mobistar first quarter 2015 results - orange belgium · mobistar first quarter 2015 results. ......
TRANSCRIPT
Mobistar - Financial results Q1 2015
Analysts & Investors Presentation
Mobistar
First quarter
2015 results
Mobistar - Financial results Q1 2015
This presentation contains forward-looking statements about Mobistar, inparticular for 2015. Although Mobistar believes these statements are based onreasonable assumptions, these forward-looking statements are subject tonumerous risks and uncertainties, including matters not yet known to us or notcurrently considered material by us, and there can be no assurance thatanticipated events will occur or that the objectives set out will actually beachieved. Important factors that could cause actual results to differ materiallyfrom the results anticipated in the forward-looking statements include, amongothers, the impact of the price adjustments on the customer base resulting fromthe competitive pressure, the evolution of the customer base, the economicsituation in Belgium, the effectiveness of Mobistar convergent strategy includingthe success and market acceptance of the voice and data abundance plans, theMobistar TV and broadband offers, the Mobistar brand and other strategic,operating and financial initiatives, Mobistar’s ability to adapt to the on-goingtransformation of the telecommunications industry, regulatory developments andconstraints and the outcome of legal proceedings, risks and uncertainties relatedto business activity.
2
Mobistar - Financial results Q1 2015
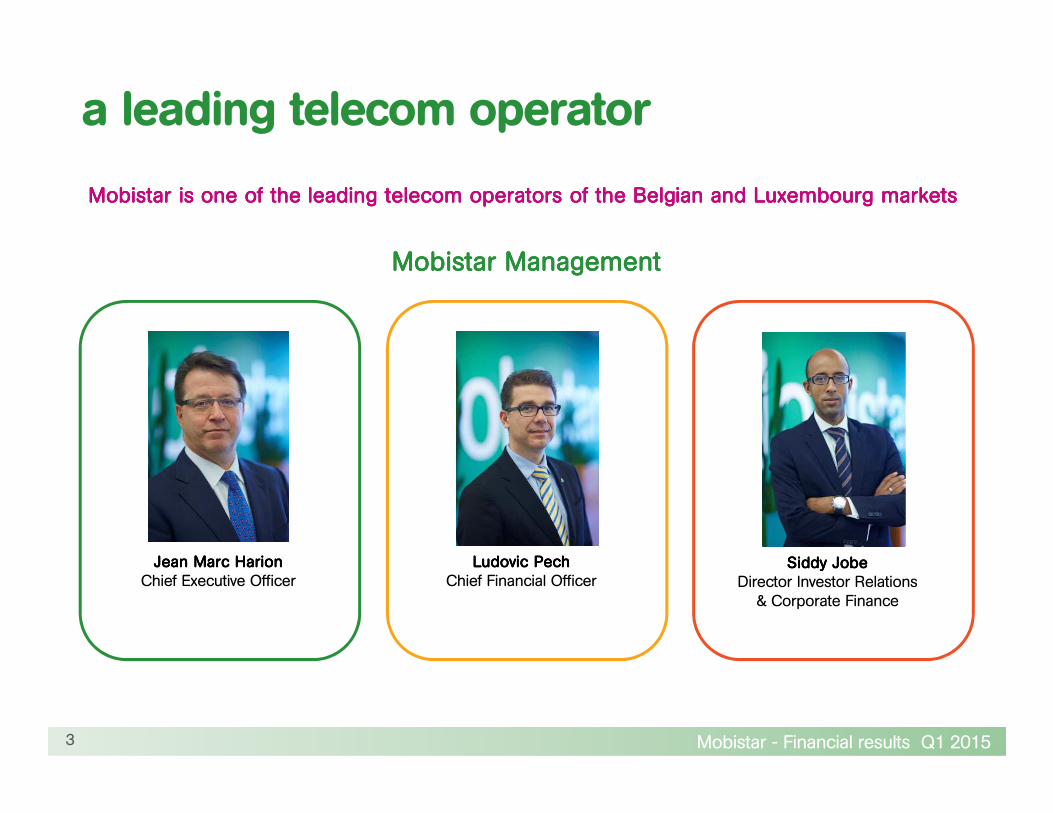
a leading telecom operator
Mobistar is one of the leading telecom operators of the Belgian and Luxembourg marketsMobistar is one of the leading telecom operators of the Belgian and Luxembourg marketsMobistar is one of the leading telecom operators of the Belgian and Luxembourg marketsMobistar is one of the leading telecom operators of the Belgian and Luxembourg markets
Jean Marc HarionJean Marc HarionJean Marc HarionJean Marc HarionChief Executive Officer
Ludovic PechLudovic PechLudovic PechLudovic PechChief Financial Officer
Siddy JobeSiddy JobeSiddy JobeSiddy JobeDirector Investor Relations& Corporate Finance
Mobistar ManagementMobistar ManagementMobistar ManagementMobistar Management
3

Mobistar - Financial results Q1 2015
“focus on value management”JeanJeanJeanJean----Marc Marc Marc Marc HarionHarionHarionHarion, , , , Chief Executive Officer
Mobistar - Financial results Q1 2015
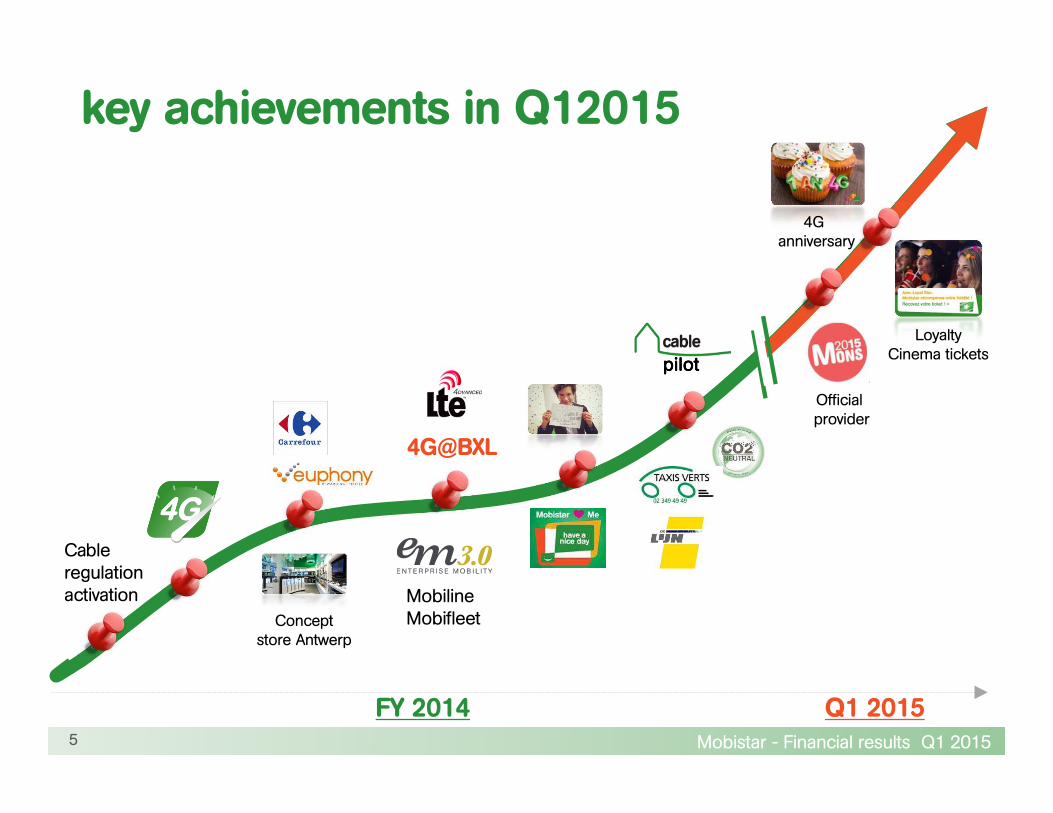
key achievements in Q12015
Cable regulation activation
Concept store Antwerp
MobilineMobifleet
pilotpilotpilotpilot
4G@BXL
5
Q1 2015FY 2014
LoyaltyCinema tickets
Official provider
4G anniversary

Mobistar - Financial results Q1 2015
• 4G postpaid customer base growth 19% vs 4Q14
• #1 in 4G: 92% outdoor coverage
• #1 in 4G: ~600 000 customers
• #1 in NPS Telco Customer Service
• Postpaid ARPU grew by 3.8% yoy
• Restated EBITDA +5.6% yoy & +12.4% excl. reg.
• Full year guidance confirmed
our main business achievements in Q1 2015
6
Mobistar - Financial results Q1 2015
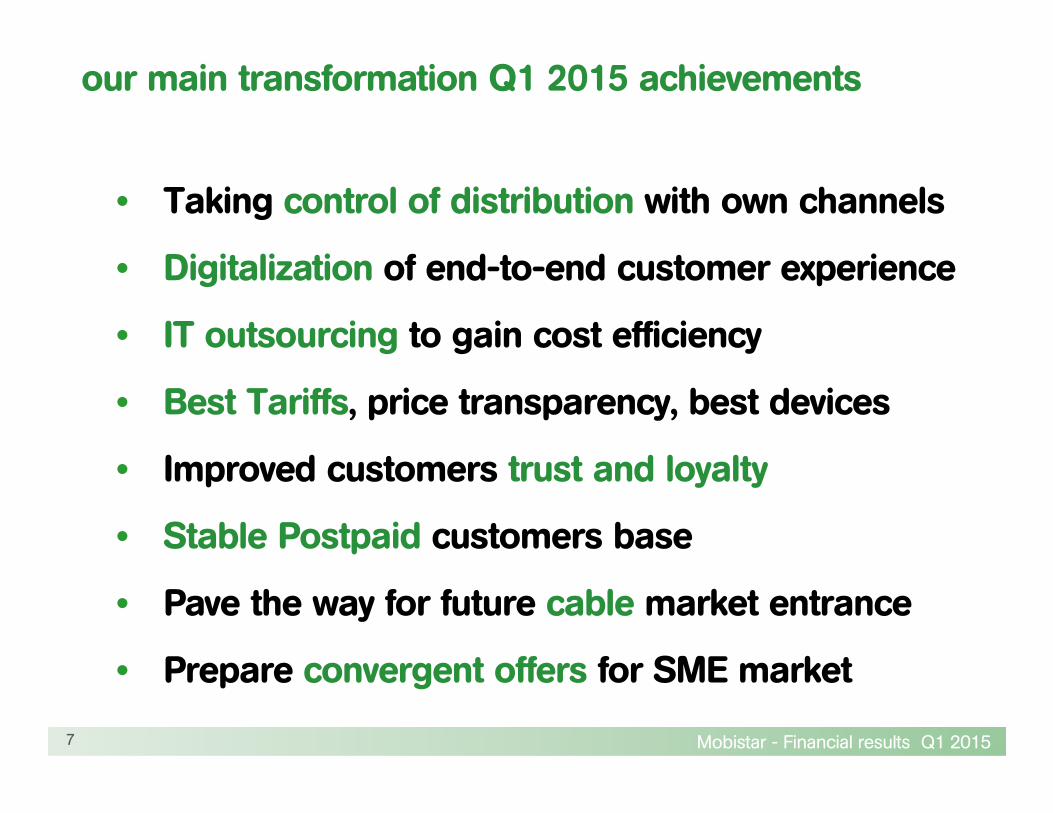
• Taking control of distribution with own channels
• Digitalization of end-to-end customer experience
• IT outsourcing to gain cost efficiency
• Best Tariffs, price transparency, best devices
• Improved customers trust and loyalty
• Stable Postpaid customers base
• Pave the way for future cable market entrance
• Prepare convergent offers for SME market
our main transformation Q1 2015 achievements
7

Mobistar - Financial results Q1 2015
achievements
Mobistar - Financial results Q1 2015
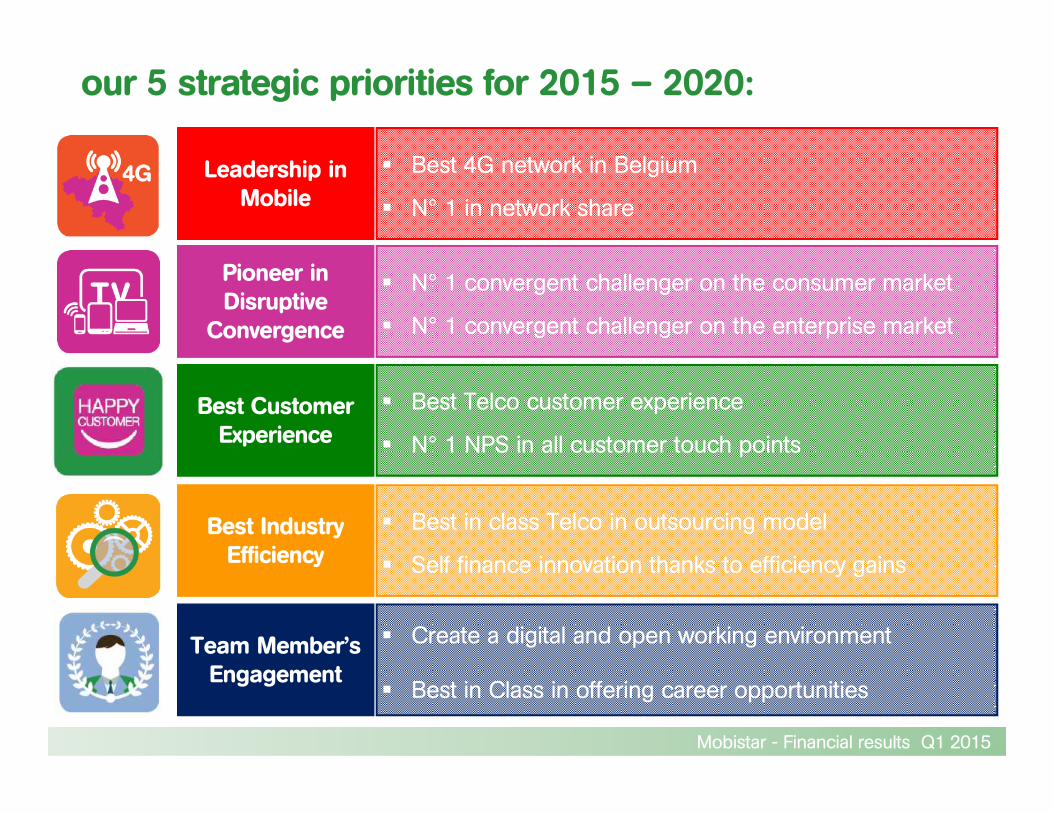
our 5 strategic priorities for 2015 – 2020:
Leadership in Mobile
� Best 4G network in Belgium
� N° 1 in network share
Pioneer in Disruptive Convergence
� N° 1 convergent challenger on the consumer market
� N° 1 convergent challenger on the enterprise market
Best Customer Experience
� Best Telco customer experience
� N° 1 NPS in all customer touch points
Best Industry Efficiency
� Best in class Telco in outsourcing model
� Self finance innovation thanks to efficiency gains
Team Member’s Engagement
� Create a digital and open working environment
� Best in Class in offering career opportunities
Mobistar - Financial results Q1 2015
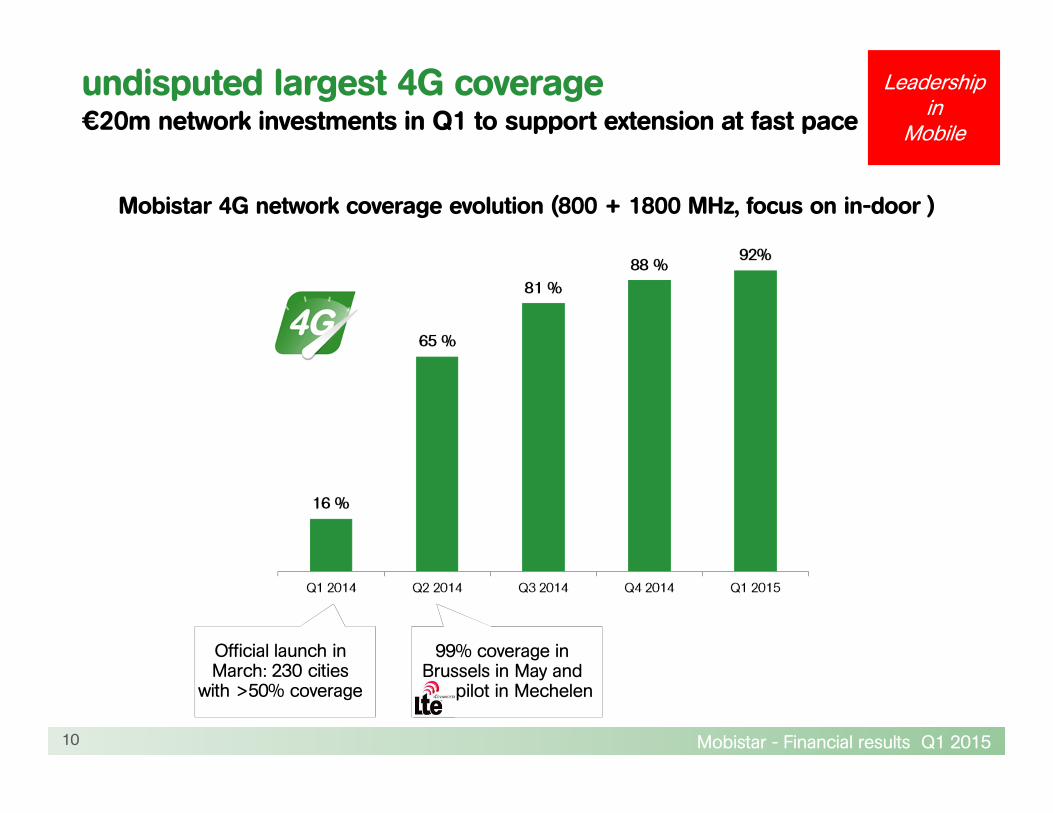
99% coverage in Brussels in May and
pilot in Mechelen
undisputed largest 4G coverage€20m network investments in Q1 to support extension at fast pace
Leadership in
Mobile
Mobistar 4G network coverage evolution (800 + 1800 MHz, focus on in-door )
Official launch in March: 230 cities
with >50% coverage
10
Mobistar - Financial results Q1 2015
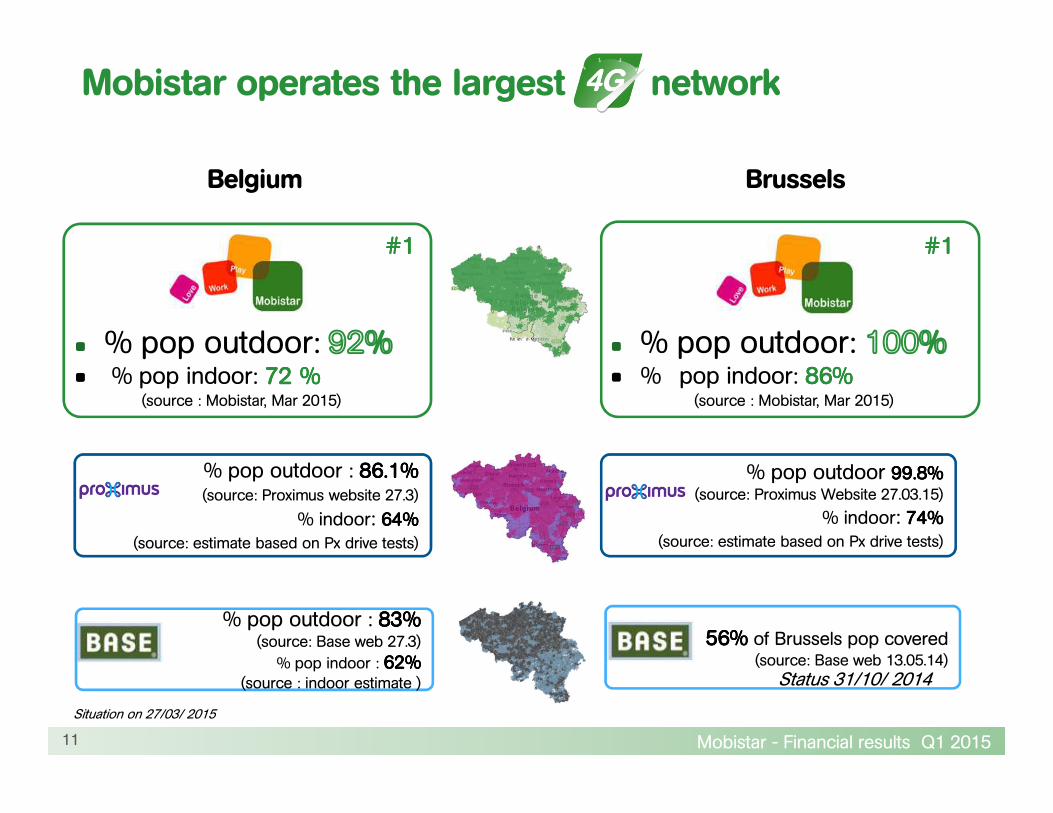
Mobistar operates the largest network
Belgium Brussels
• % pop outdoor: • % pop indoor: 86%86%86%86%
• % pop outdoor: • % pop indoor: 72 %72 %72 %72 %
(source : Mobistar, Mar 2015) (source : Mobistar, Mar 2015)
11
Situation on 27/03/ 2015
% pop outdoor 99.8%99.8%99.8%99.8%(source: Proximus Website 27.03.15)
% indoor: 74%74%74%74%(source: estimate based on Px drive tests)
56%56%56%56% of Brussels pop covered(source: Base web 13.05.14)
% pop outdoor : 83%83%83%83%(source: Base web 27.3)
% pop indoor : 62%62%62%62%(source : indoor estimate )
% pop outdoor : 86.1%86.1%86.1%86.1%(source: Proximus website 27.3)
% indoor: 64%64%64%64%(source: estimate based on Px drive tests)
Status 31/10/ 2014
#1#1#1#1 #1#1#1#1

Mobistar - Financial results Q1 2015
Leadership in
Mobile
#1Outdoor coverage
92% *
#1Indoor coverage
72% *
17.7MbpsAverage
download speed **
14 MbpsAverage
upload speed **
Mobistar leader in 4G coverage
Source 1: * Population coverage based on sites on air end of Q1 2015Source 2: ** Commsquare, January 2015
12
Mobistar - Financial results Q1 2015
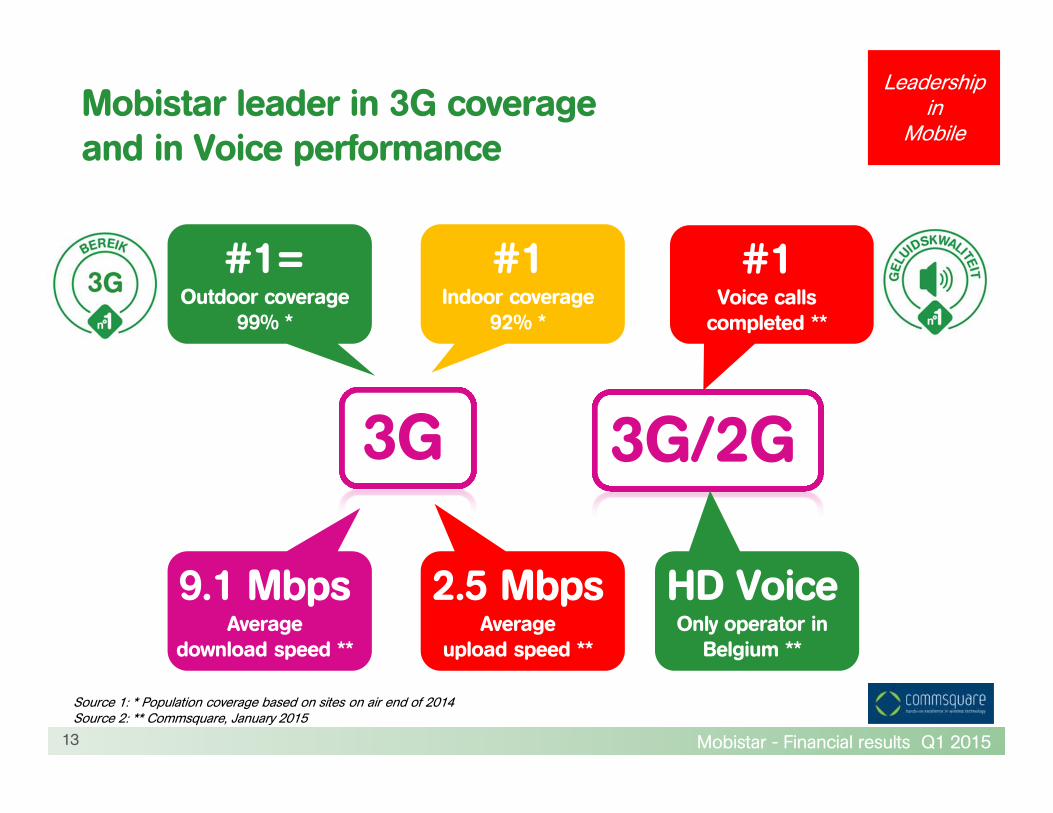
Mobistar leader in 3G coverageand in Voice performance
Leadership in
Mobile
3G/2G
#1Voice callscompleted **
3G
#1=Outdoor coverage
99% *
#1Indoor coverage
92% *
9.1 MbpsAverage
download speed **
2.5 Mbps Average
upload speed **
HD VoiceOnly operator in Belgium **
Source 1: * Population coverage based on sites on air end of 2014Source 2: ** Commsquare, January 2015
13
Mobistar - Financial results Q1 2015
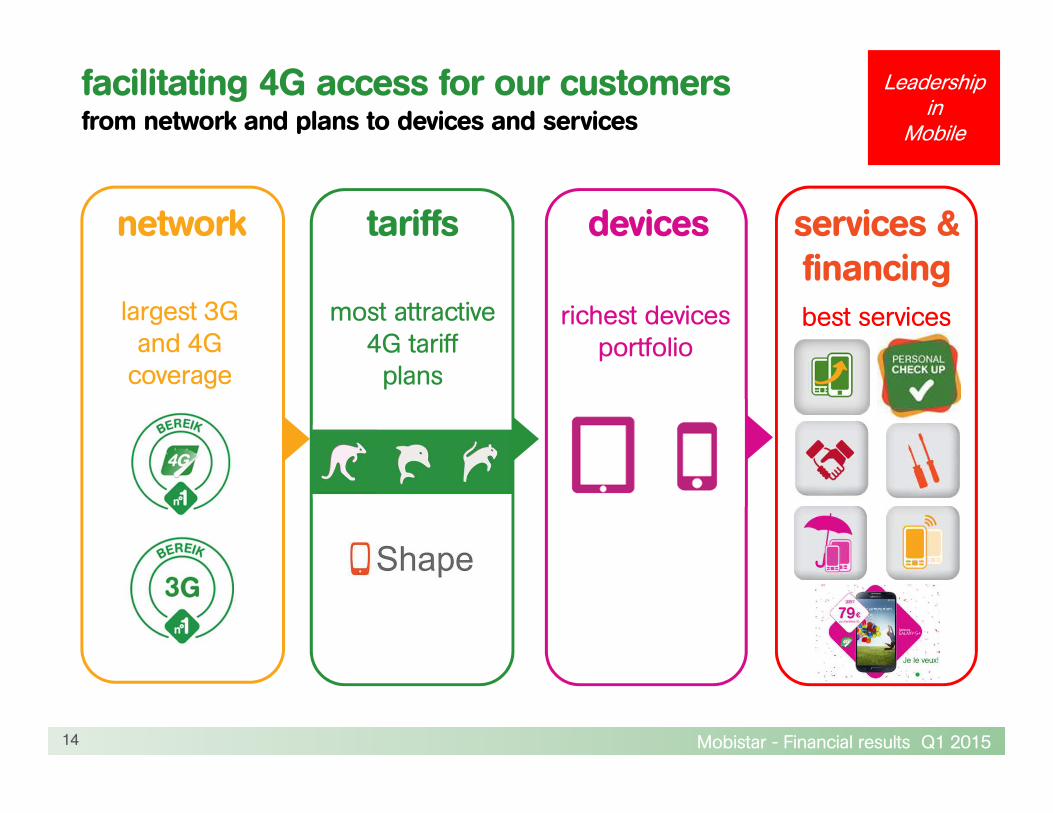
facilitating 4G access for our customersfrom network and plans to devices and services
most attractive4G tariffplans
devices
richest devices portfolio
services &financing
14
Leadership in
Mobile
tariffsnetwork
largest 3G and 4G coverage
best services
Mobistar - Financial results Q1 2015
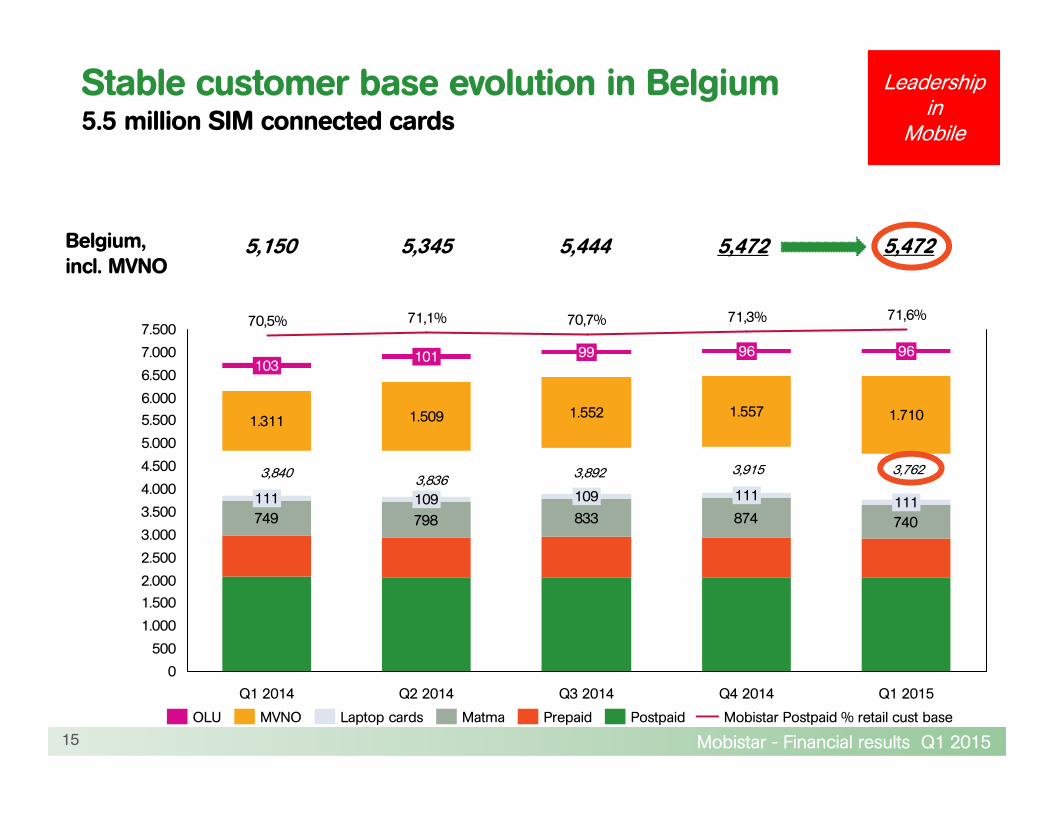
749 798 833 874 740
7.500
7.000
6.500
6.000
5.500
5.000
4.500
4.000
3.500
3.000
2.500
2.000
1.500
1.000
500
0
Q4 2014
71,3%
111
1.557
96
Q3 2014
70,7%
109
1.552
99
Q2 2014
71,1%
109
1.509
101
Q1 2014
70,5%
111
1.311
103
Q1 2015
96
1.710
111
71,6%
Mobistar Postpaid % retail cust basePostpaidPrepaidMatmaLaptop cardsMVNOOLU
3,840
Belgium,incl. MVNO
5,150
3,836
5,345 5,472
3,892
5,444
3,915
15
Leadership in
Mobile
Stable customer base evolution in Belgium5.5 million SIM connected cards
5,472
3,762
Mobistar - Financial results Q1 2015
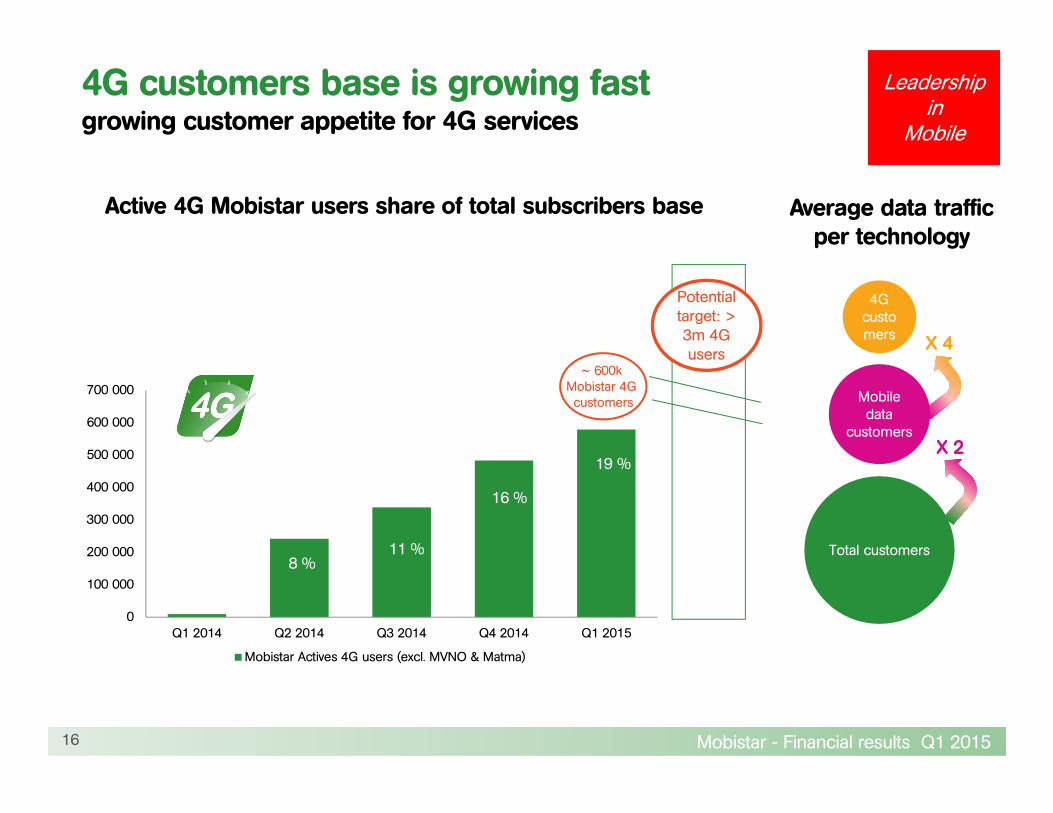
4G customers base is growing fastgrowing customer appetite for 4G services
Leadership in
Mobile
Active 4G Mobistar users share of total subscribers base
Potential target: > 3m 4G users
X 4X 4X 4X 4
X 2X 2X 2X 2
Average data trafficper technology
Total customers
Mobile data
customers
4G custo mers
16
0
100 000
200 000
300 000
400 000
500 000
600 000
700 000
Q1 2014 Q2 2014 Q3 2014 Q4 2014 Q1 2015
Mobistar Actives 4G users (excl. MVNO & Matma)
8 %11 %
16 %
~ 600k Mobistar 4G customers
19 %
Mobistar - Financial results Q1 201517
Mobistar prepaid & postpaid customers base excl. M2M & MVNO
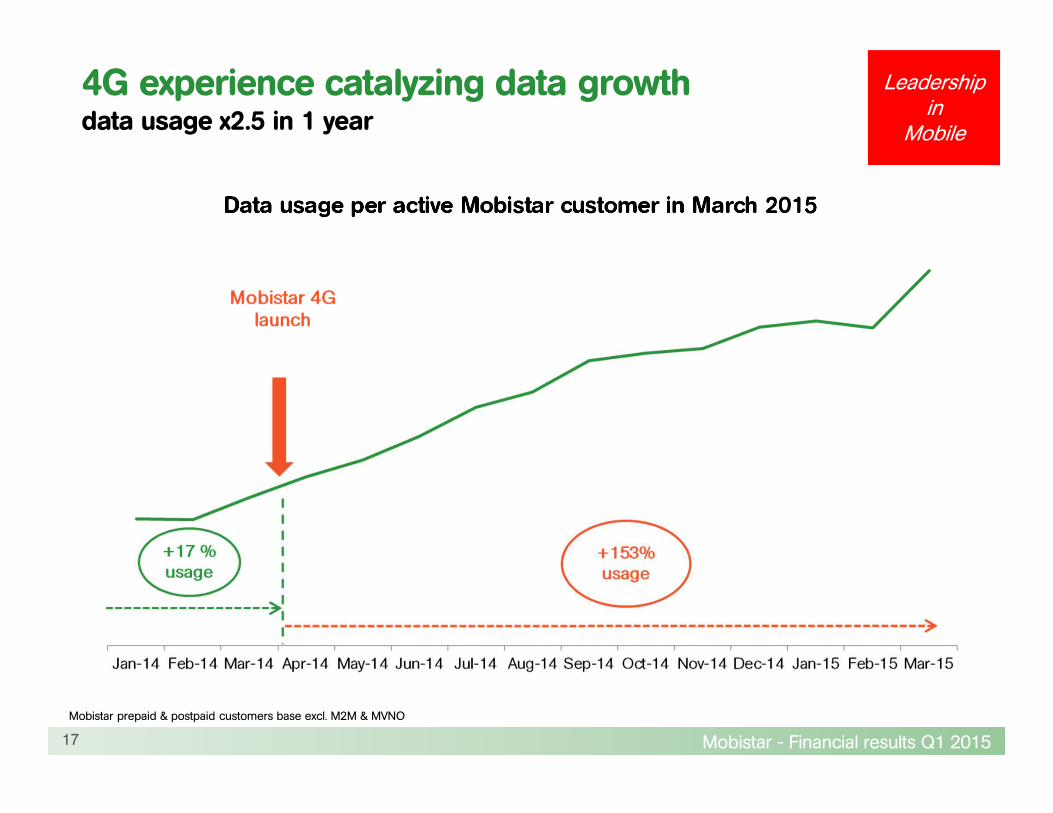
4G experience catalyzing data growthdata usage x2.5 in 1 year
Data usage per active Mobistar customer in March 2015
Leadership in
Mobile
Mobistar - Financial results Q1 2015
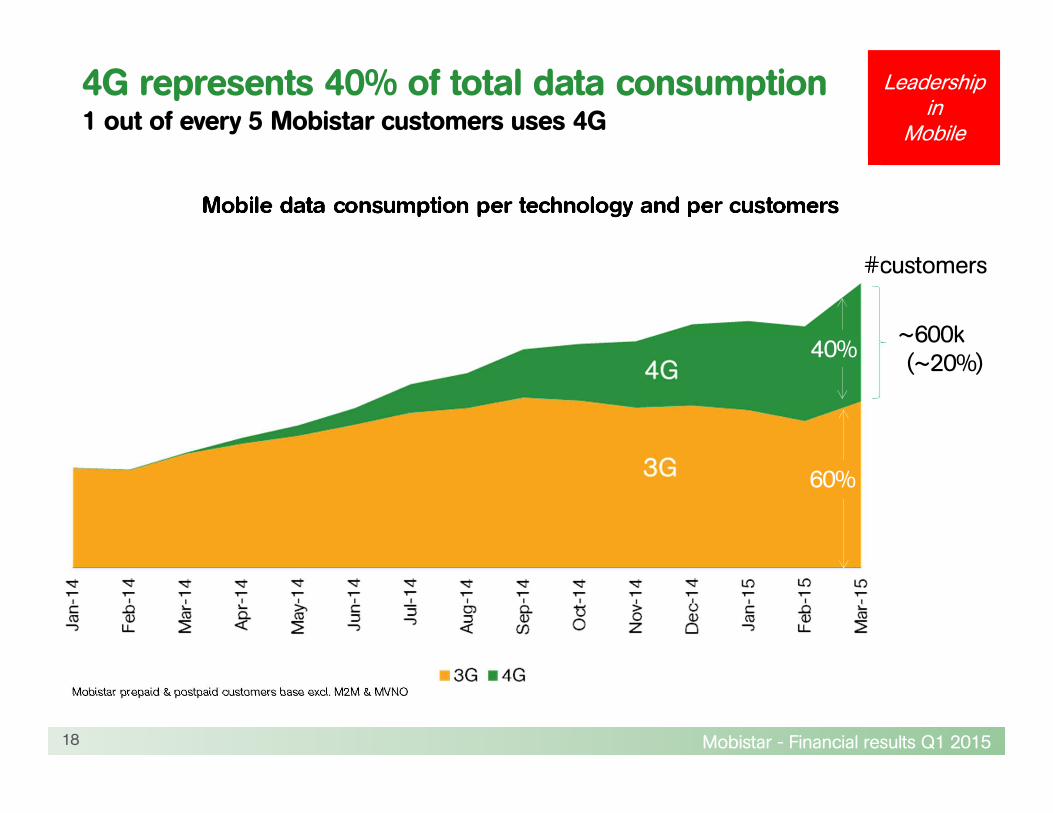
4G represents 40% of total data consumption1 out of every 5 Mobistar customers uses 4G
18
Mobistar prepaid & postpaid customers base excl. M2M & MVNO
Mobile data consumption per technology and per customers
4G~600k(~20%)
#customers
Leadership in
Mobile
40%
60%
Mobistar - Financial results Q1 2015
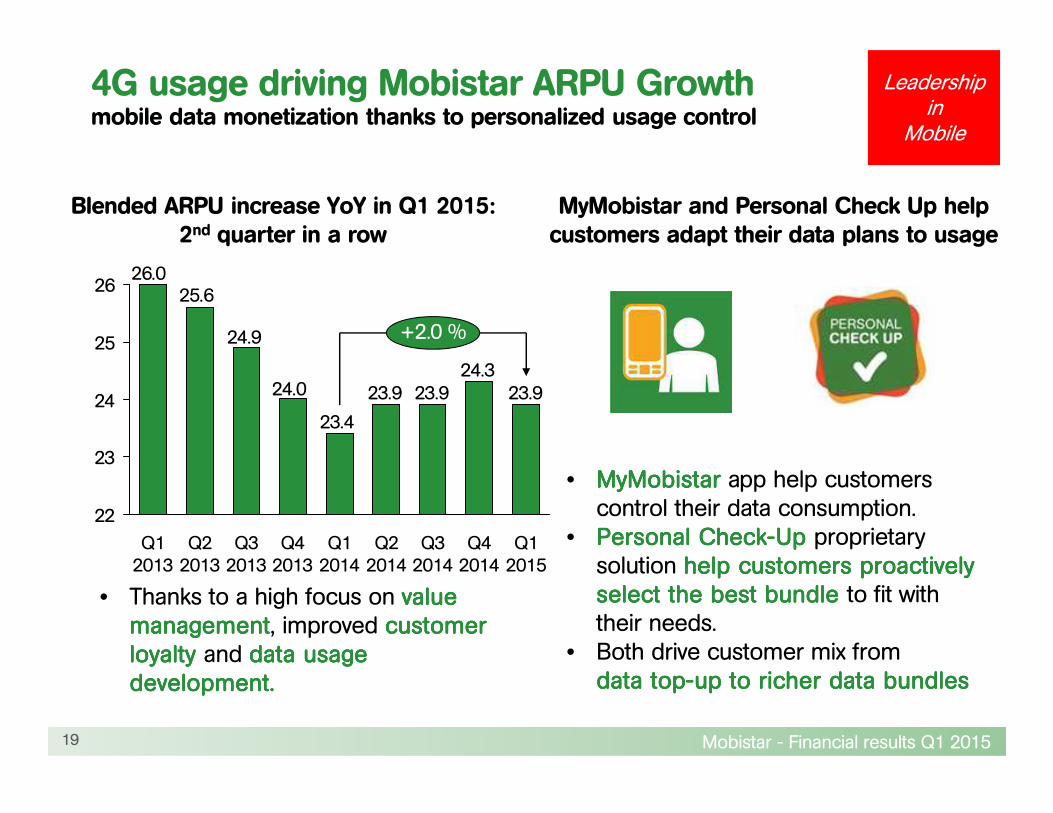
4G usage driving Mobistar ARPU Growthmobile data monetization thanks to personalized usage control
• Thanks to a high focus on value value value value managementmanagementmanagementmanagement, improved customer customer customer customer loyalty loyalty loyalty loyalty and data usage data usage data usage data usage development. development. development. development.
• MyMobistarMyMobistarMyMobistarMyMobistar app help customers control their data consumption.
• Personal CheckPersonal CheckPersonal CheckPersonal Check----Up Up Up Up proprietary solution help customers proactively help customers proactively help customers proactively help customers proactively select the best bundle select the best bundle select the best bundle select the best bundle to fit with their needs.
• Both drive customer mix fromdata topdata topdata topdata top----up to richer data bundlesup to richer data bundlesup to richer data bundlesup to richer data bundles
19
Blended ARPU increase YoY in Q1 2015:2nd quarter in a row
MyMobistar and Personal Check Up help customers adapt their data plans to usage
Leadership in
Mobile
23.924.3
23.923.9
23.4
24.0
24.9
25.626.0
22
23
24
25
26
Q3 2013
Q2 2014
Q4 2013
Q2 2013
Q1 2015
Q3 2014
Q1 2013
Q1 2014
Q4 2014
+2.0 %
Mobistar - Financial results Q1 201520
Leadership in
Mobile
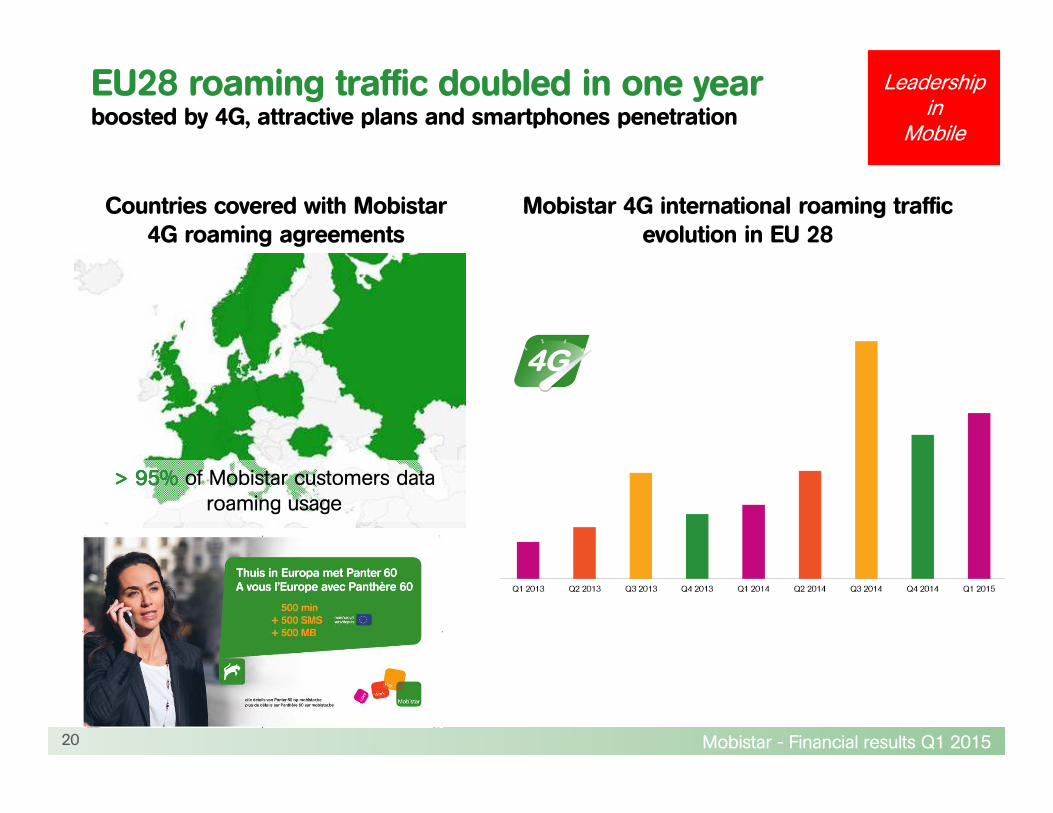
EU28 roaming traffic doubled in one yearboosted by 4G, attractive plans and smartphones penetration
Countries covered with Mobistar4G roaming agreements
Mobistar 4G international roaming traffic evolution in EU 28
>>>> 95% 95% 95% 95% of Mobistar customers data roaming usage
Mobistar - Financial results Q1 201521
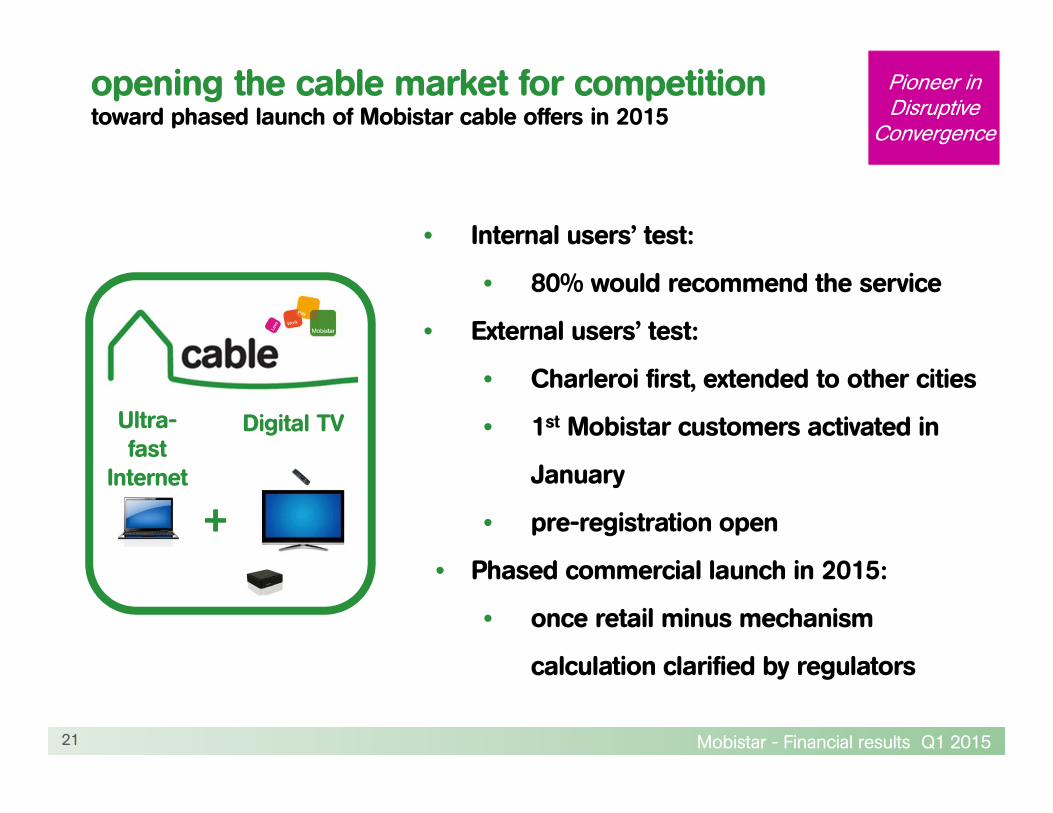
opening the cable market for competitiontoward phased launch of Mobistar cable offers in 2015
• Internal users’ test:
• 80% would recommend the service
• External users’ test:
• Charleroi first, extended to other cities
• 1st Mobistar customers activated in
January
• pre-registration open
• Phased commercial launch in 2015:
• once retail minus mechanism
calculation clarified by regulators
Ultra-fast
Internet
Digital TV
+
Pioneer in Disruptive
Convergence
Mobistar - Financial results Q1 2015
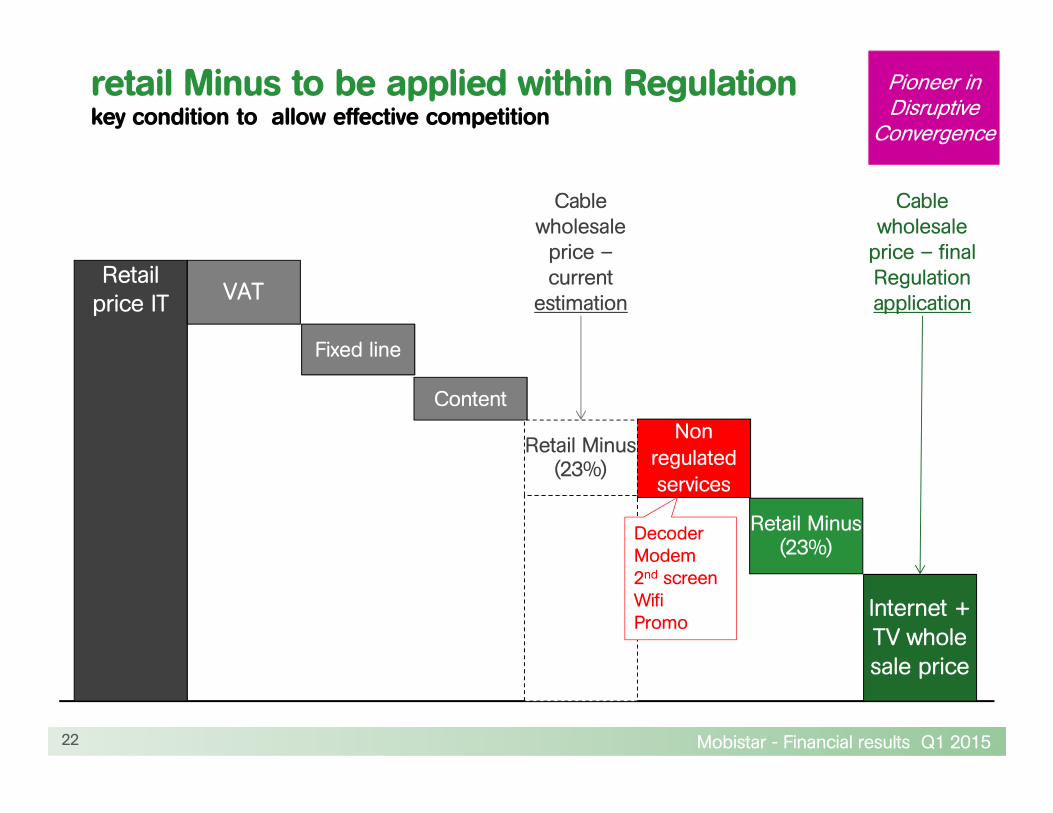
Retail price IT
22
VAT
Fixed line
Content
Non
regulated
services
Retail Minus (23%)
Internet + TV whole sale price
DecoderModem2nd screenWifiPromo
Cable wholesale price –current
estimation
Retail Minus (23%)
Cable wholesale price – final Regulation application
retail Minus to be applied within Regulation key condition to allow effective competition
Pioneer in Disruptive
Convergence
Mobistar - Financial results Q1 2015
#2
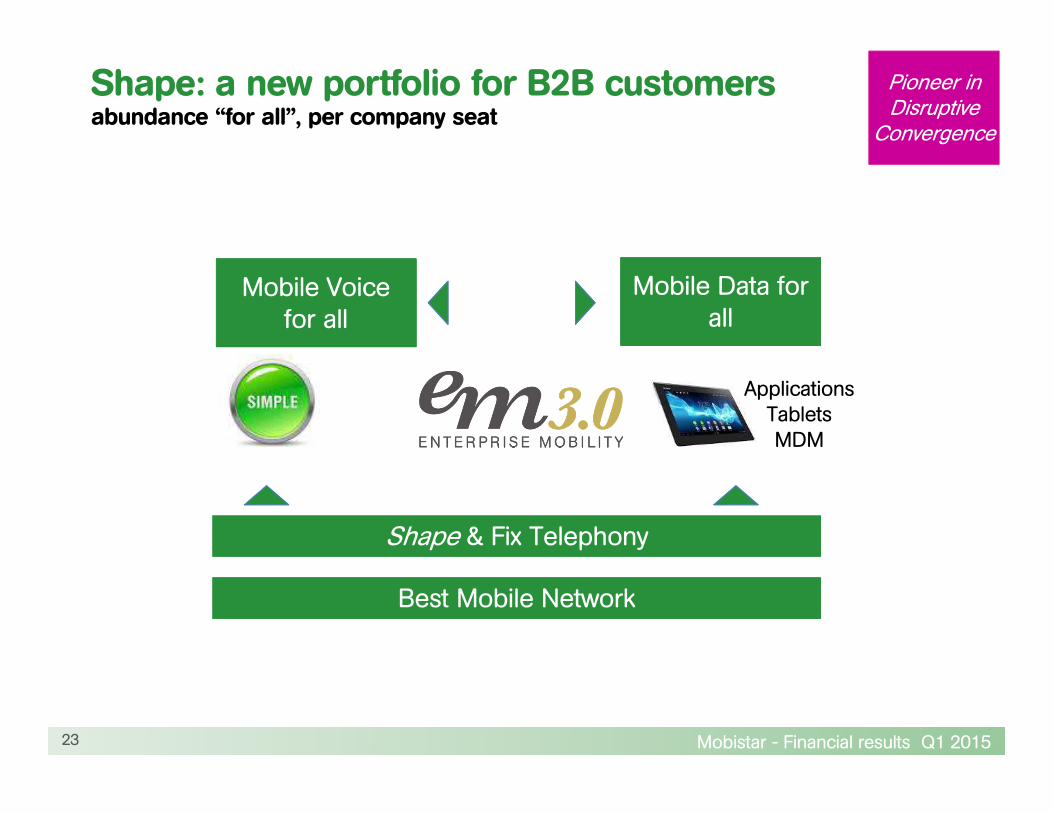
Shape & Fix Telephony
Best Mobile Network
Mobile Voice for all
Mobile Data for all
ApplicationsTabletsMDM
23
Shape: a new portfolio for B2B customersabundance “for all”, per company seat
Pioneer in Disruptive
Convergence
Mobistar - Financial results Q1 2015
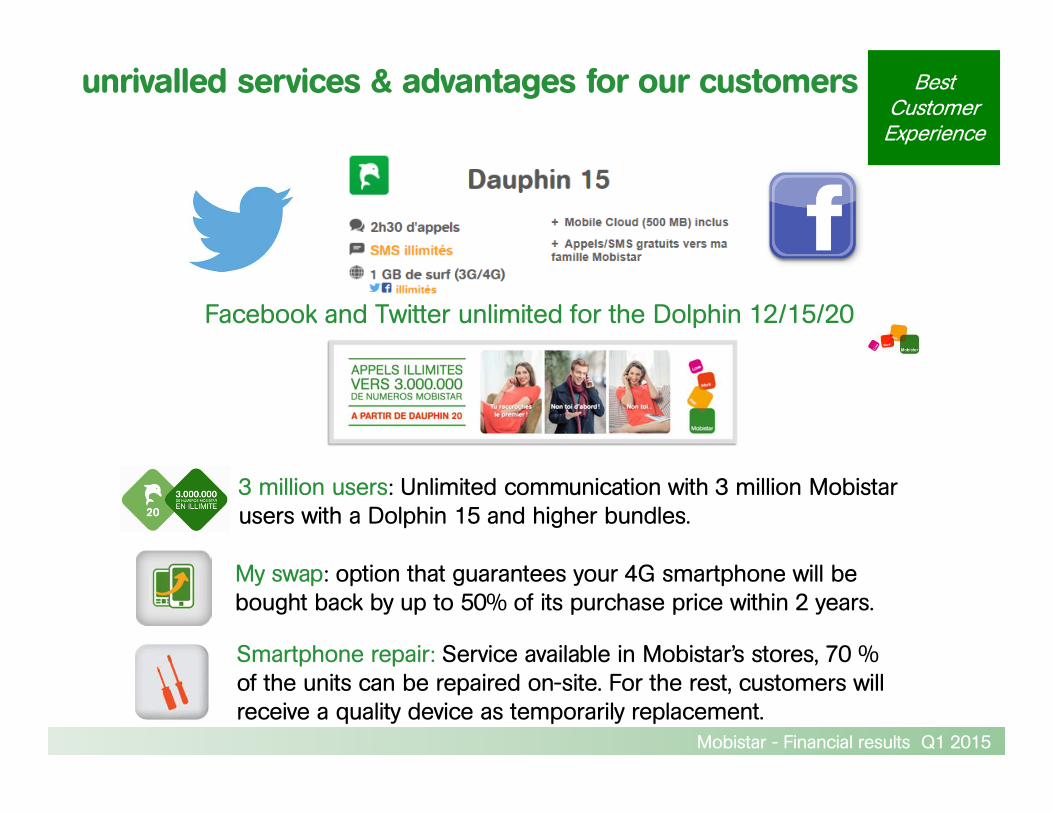
Facebook and Twitter unlimited for the Dolphin 12/15/20
unrivalled services & advantages for our customers
Smartphone repair: Service available in Mobistar’s stores, 70 % of the units can be repaired on-site. For the rest, customers will receive a quality device as temporarily replacement.
My swap: option that guarantees your 4G smartphone will be bought back by up to 50% of its purchase price within 2 years.
3 million users: Unlimited communication with 3 million Mobistar users with a Dolphin 15 and higher bundles.
Best Customer Experience
Mobistar - Financial results Q1 2015
Offer the best customer experience
on the market
#3
25
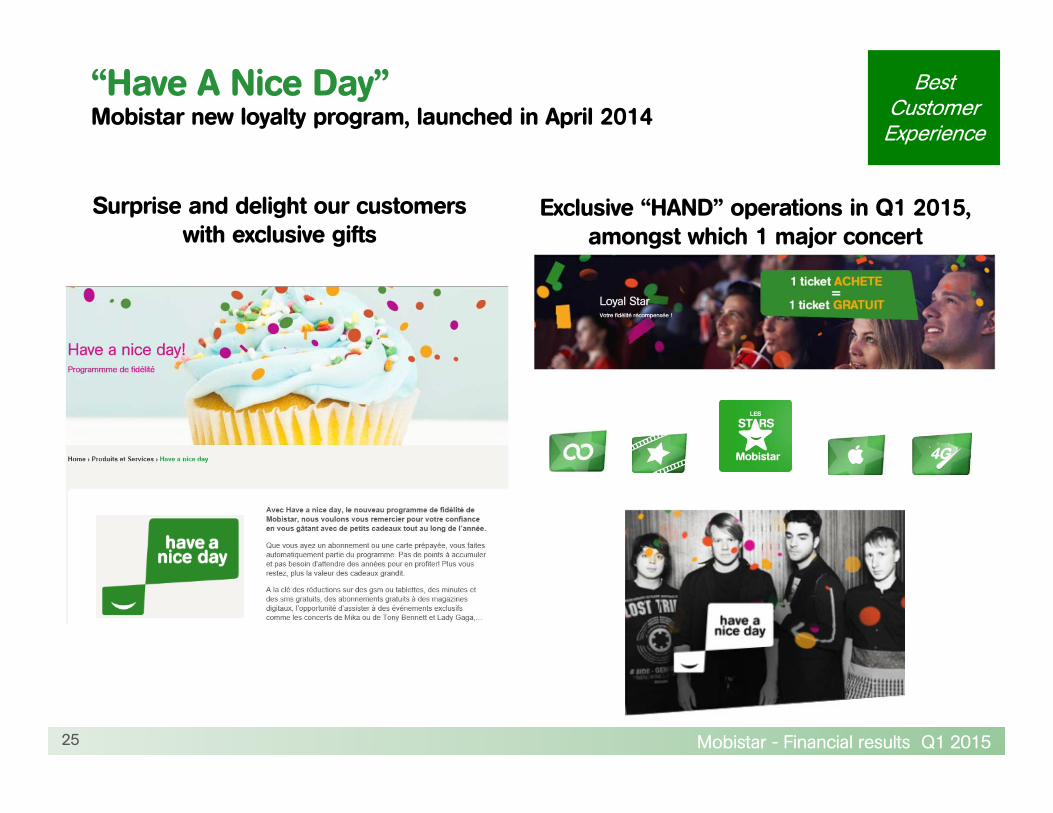
Best Customer Experience
“Have A Nice Day”Mobistar new loyalty program, launched in April 2014
Surprise and delight our customerswith exclusive gifts
Exclusive “HAND” operations in Q1 2015,amongst which 1 major concert
Mobistar - Financial results Q1 2015
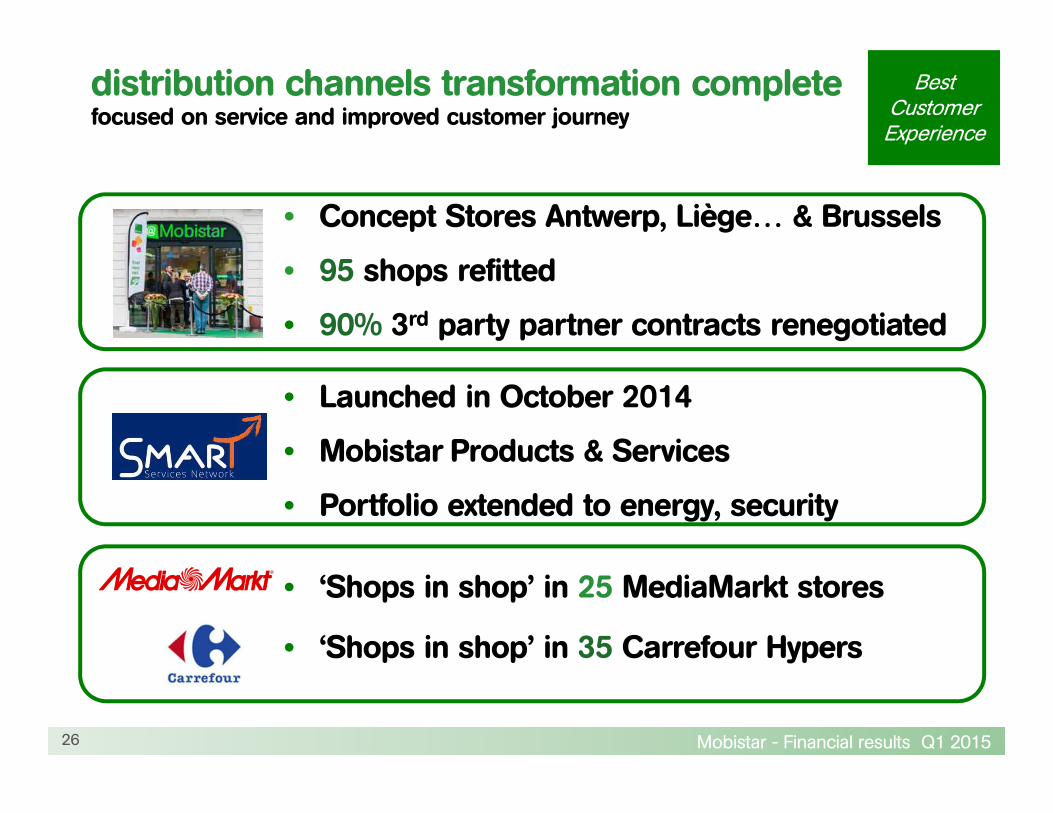
Best Customer Experience
• Concept Stores Antwerp, Liège… & Brussels
• 95 shops refitted
• 90% 3rd party partner contracts renegotiated
• Launched in October 2014
• Mobistar Products & Services
• Portfolio extended to energy, security
• ‘Shops in shop’ in 25 MediaMarkt stores
• ‘Shops in shop’ in 35 Carrefour Hypers
distribution channels transformation completefocused on service and improved customer journey
26
Mobistar - Financial results Q1 2015
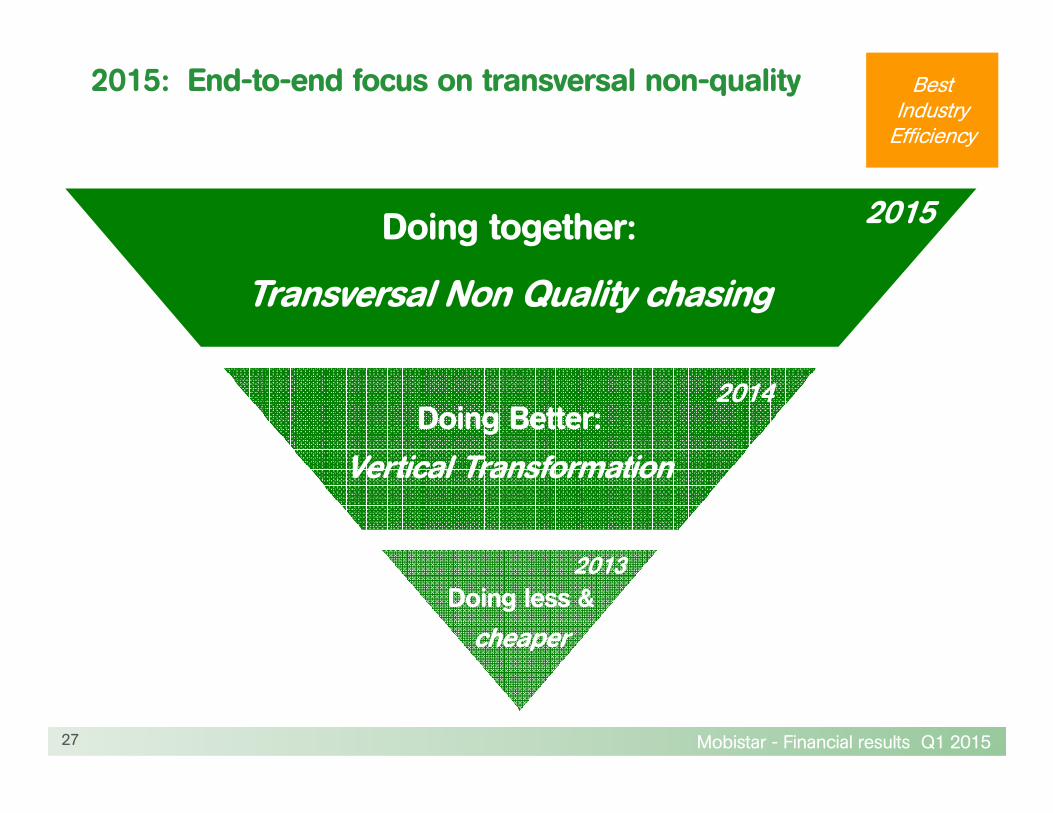
2015: End-to-end focus on transversal non-quality Best Industry Efficiency
Doing together:
Transversal Non Quality chasing
Doing Better:
Vertical Transformation
Doing less &
cheaper
2015
2014
2013
27
Mobistar - Financial results Q1 2015
financial review Q1 2015Ludovic Ludovic Ludovic Ludovic PechPechPechPech, , , , Chief Financial Officer
Mobistar - Financial results Q1 2015
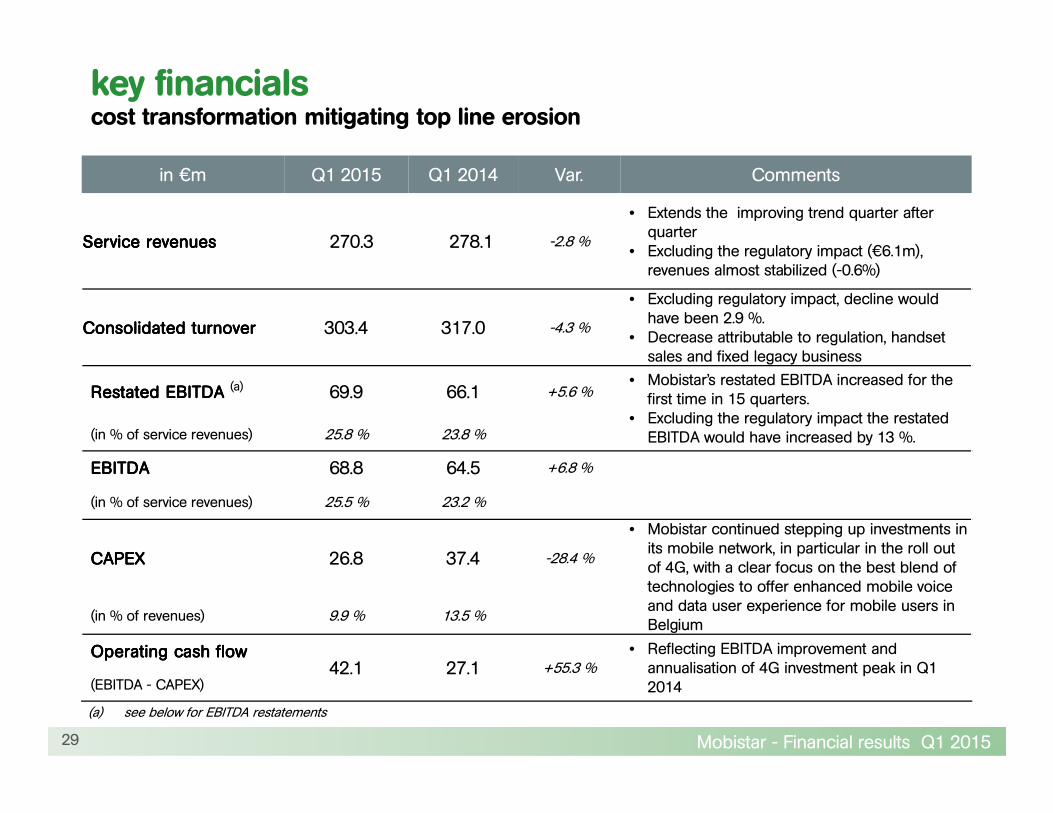
(a) see below for EBITDA restatements
key financialscost transformation mitigating top line erosion
29
in €m Q1 2015 Q1 2014 Var. Comments
Service Service Service Service revenuesrevenuesrevenuesrevenues 270.3 278.1 -2.8 %
• Extends the improving trend quarter after quarter
• Excluding the regulatory impact (€6.1m), revenues almost stabilized (-0.6%)
Consolidated turnoverConsolidated turnoverConsolidated turnoverConsolidated turnover 303.4 317.0 -4.3 %
• Excluding regulatory impact, decline would have been 2.9 %.
• Decrease attributable to regulation, handset sales and fixed legacy business
Restated EBITDA Restated EBITDA Restated EBITDA Restated EBITDA (a) 69.9 66.1 +5.6 %• Mobistar’s restated EBITDA increased for the first time in 15 quarters.
• Excluding the regulatory impact the restated EBITDA would have increased by 13 %.(in % of service revenues) 25.8 % 23.8 %
EBITDA EBITDA EBITDA EBITDA 68.8 64.5 +6.8 %
(in % of service revenues) 25.5 % 23.2 %
CAPEXCAPEXCAPEXCAPEX 26.8 37.4 -28.4 %
• Mobistar continued stepping up investments in its mobile network, in particular in the roll out of 4G, with a clear focus on the best blend of technologies to offer enhanced mobile voice and data user experience for mobile users in Belgium
(in % of revenues) 9.9 % 13.5 %
Operating cash flowOperating cash flowOperating cash flowOperating cash flow42.1 27.1 +55.3 %
• Reflecting EBITDA improvement and annualisation of 4G investment peak in Q1 2014(EBITDA - CAPEX)
Mobistar - Financial results Q1 2015
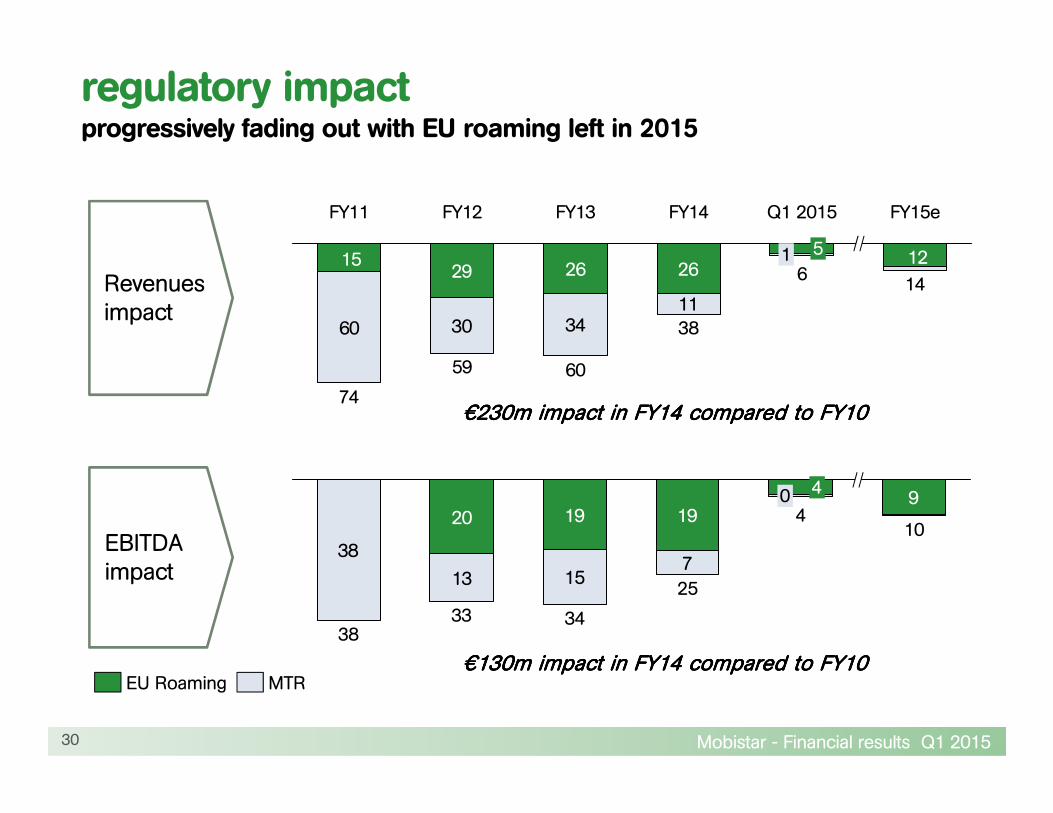
regulatory impactprogressively fading out with EU roaming left in 2015
30
Revenuesimpact
EBITDAimpact
29 26 26
60 30 3411
1215
FY15e
14
Q1 2015FY14
38
FY13
60
FY12
59
FY11
74
6
51
MTREU Roaming
20 19 199
13 157
38
343338
10
25
4
40
€€€€230m impact in FY14 compared to FY10230m impact in FY14 compared to FY10230m impact in FY14 compared to FY10230m impact in FY14 compared to FY10
€€€€130m impact in FY14 compared to FY10130m impact in FY14 compared to FY10130m impact in FY14 compared to FY10130m impact in FY14 compared to FY10
Mobistar - Financial results Q1 2015
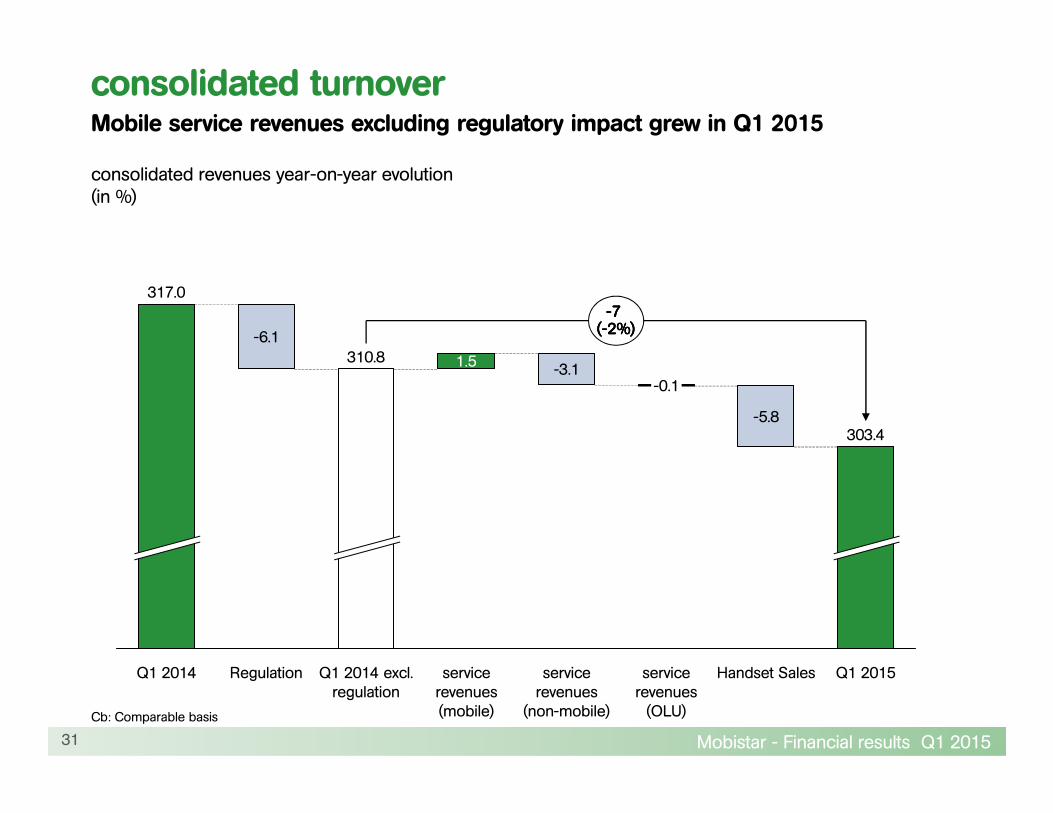
consolidated turnoverMobile service revenues excluding regulatory impact grew in Q1 2015
consolidated revenues year-on-year evolution(in %)
31
Cb: Comparable basis
1.5
-5.8303.4
Q1 2015
----7777((((----2%2%2%2%))))
Handset Salesservice revenues
(non-mobile)
-3.1
service revenues (OLU)
service revenues (mobile)
Q1 2014 excl. regulation
310.8
-6.1
RegulationQ1 2014
317.0
-0.1
Mobistar - Financial results Q1 2015
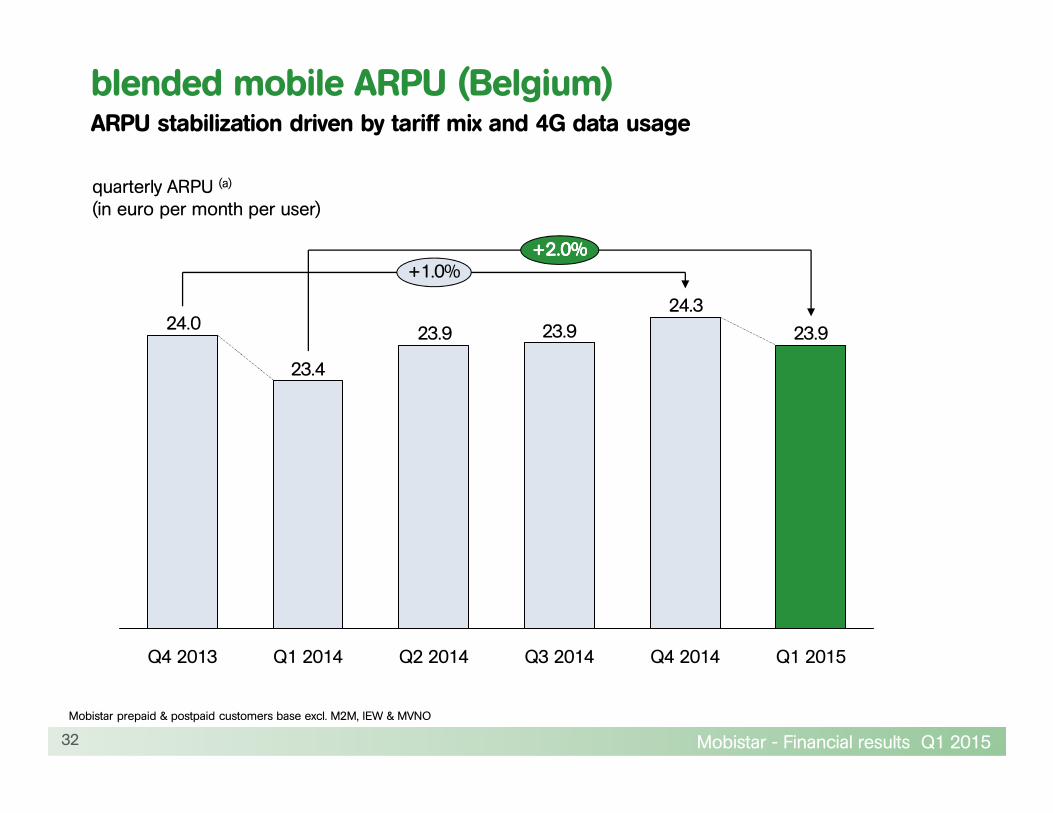
23.9
24.3
23.923.9
23.4
24.0
Q4 2013
+2.0%+2.0%+2.0%+2.0%
Q2 2014Q1 2014 Q3 2014 Q4 2014 Q1 2015
+1.0%
blended mobile ARPU (Belgium)ARPU stabilization driven by tariff mix and 4G data usage
quarterly ARPU (a)
(in euro per month per user)
32
Mobistar prepaid & postpaid customers base excl. M2M, IEW & MVNO

Mobistar - Financial results Q1 2015
1Q154Q143Q142Q141Q144Q133Q132Q131Q134Q123Q122Q121Q12
-2,8%
-0,6%
2Q15
Service revenue growth excl. regulationService revenue growth
service revenues year-on-year evolution(in %)
v-shaped recovery also confirmed in Q1 2015Mobistar is increasingly focusing on value management
33
~0.6m 4G customer base
growing
Stabilizing postpaid
customer base
Mobile ARPU is rebounding with 2.0 % growth in
Q1 2015
Exploding data usage with +153
% growth
Mobistar - Financial results Q1 2015
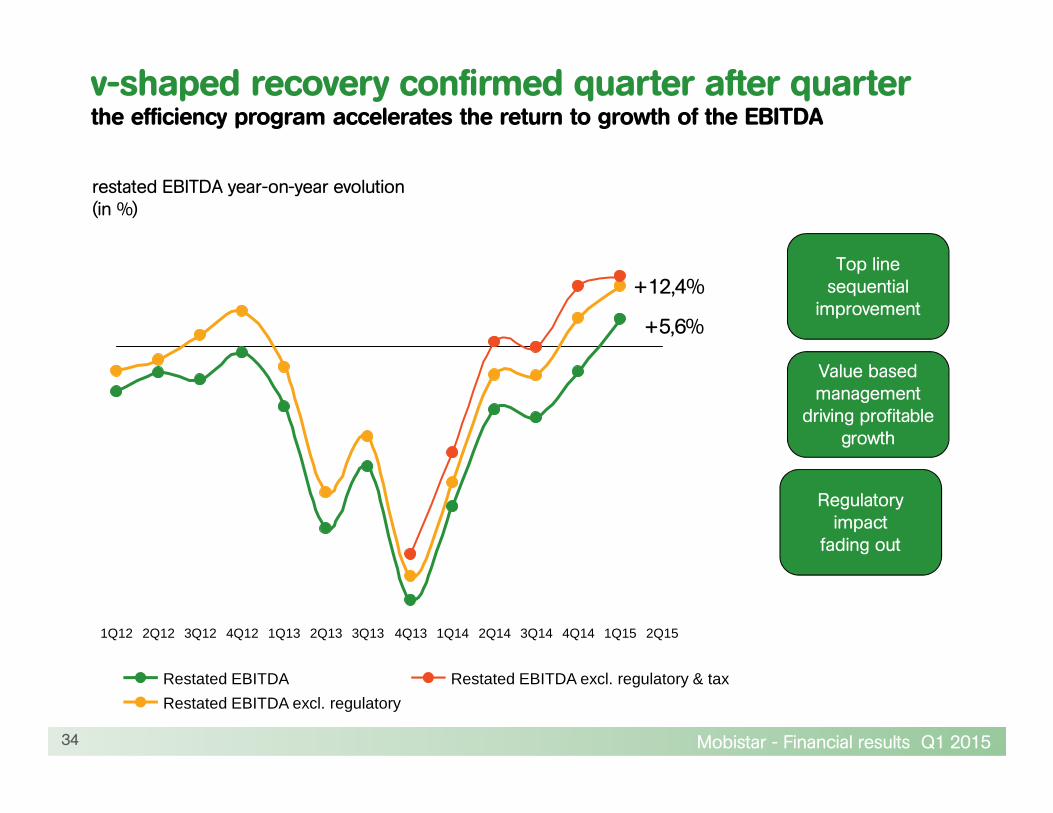
1Q154Q143Q142Q141Q144Q133Q132Q131Q134Q123Q122Q121Q12 2Q15
+12,4%
+5,6%
Restated EBITDA excl. regulatory & tax
Restated EBITDA excl. regulatory
Restated EBITDA
restated EBITDA year-on-year evolution(in %)
v-shaped recovery confirmed quarter after quarterthe efficiency program accelerates the return to growth of the EBITDA
34
Value based management
driving profitable growth
Top line sequential improvement
Regulatoryimpact
fading out
Mobistar - Financial results Q1 2015
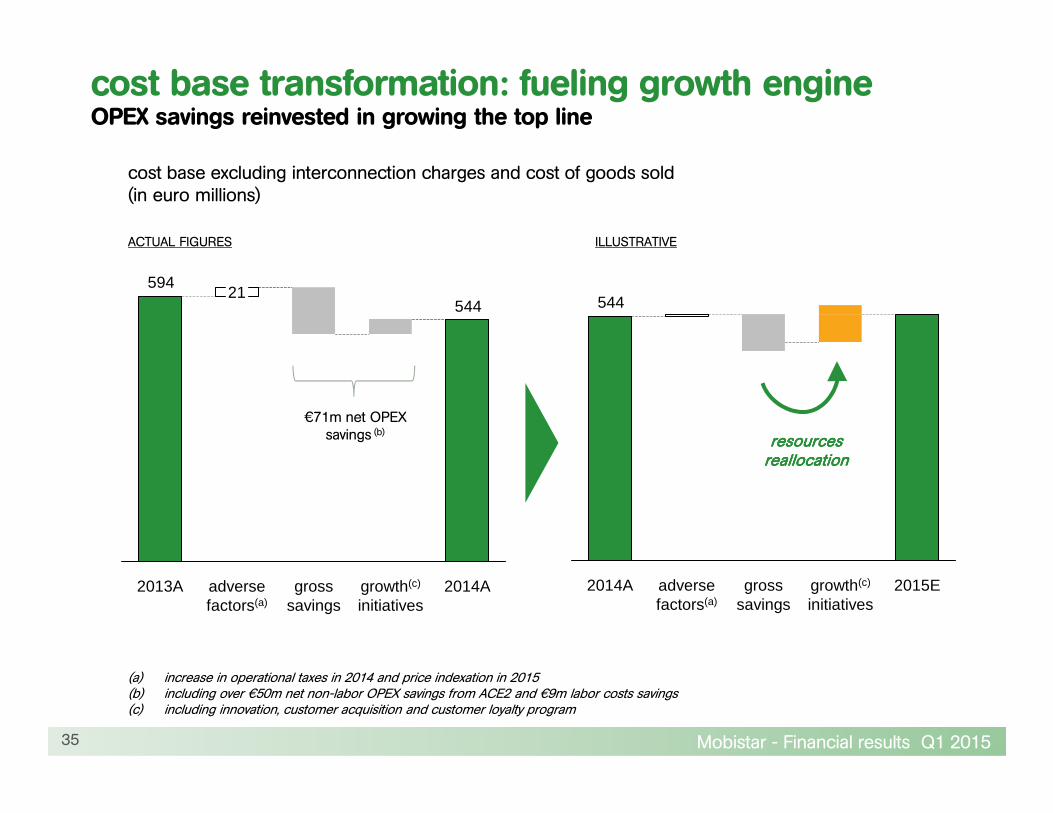
cost base transformation: fueling growth engineOPEX savings reinvested in growing the top line
35
544
594
2014Agrowth(c)
initiativesgross
savingsadversefactors(a)
21
2013A
(a) increase in operational taxes in 2014 and price indexation in 2015(b) including over €50m net non-labor OPEX savings from ACE2 and €9m labor costs savings(c) including innovation, customer acquisition and customer loyalty program
cost base excluding interconnection charges and cost of goods sold(in euro millions)
544
gross savings
growth(c)
initiatives2015Eadverse
factors(a)2014A
ILLUSTRATIVEACTUAL FIGURES
resourcesresourcesresourcesresourcesreallocationreallocationreallocationreallocation
€71m net OPEX savings (b)
Mobistar - Financial results Q1 2015
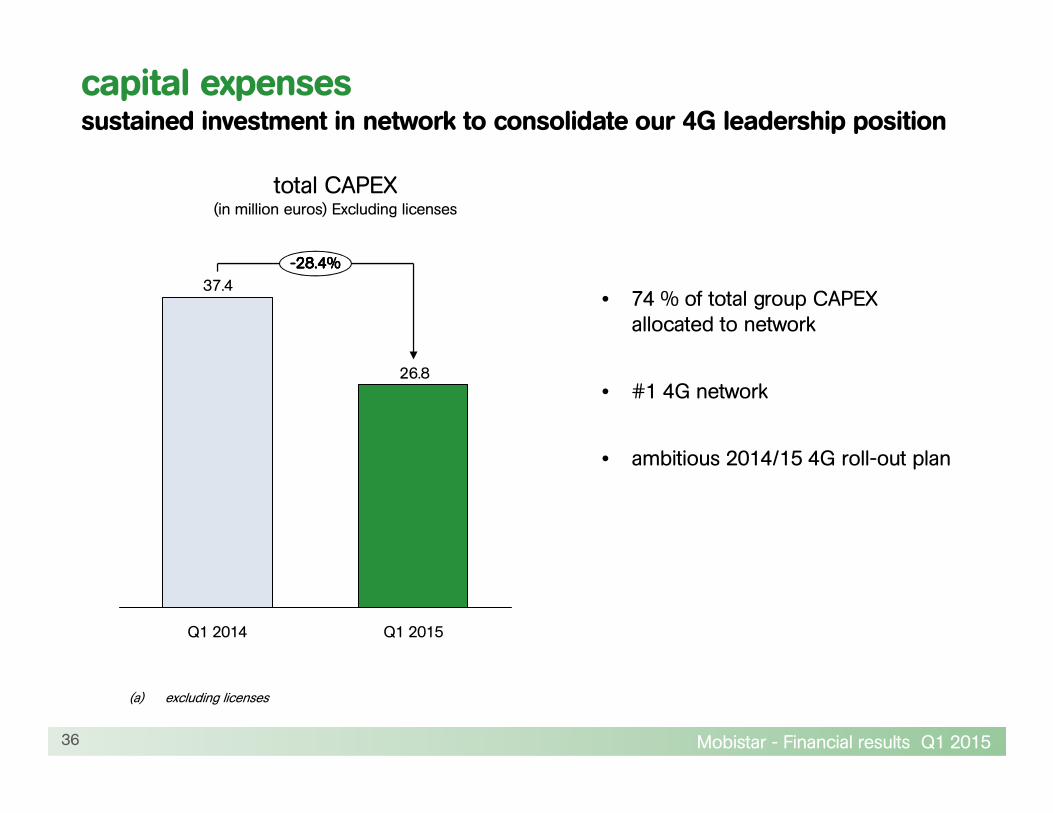
capital expensessustained investment in network to consolidate our 4G leadership position
(a) excluding licenses
36
26.8
37.4
----28.4%28.4%28.4%28.4%
Q1 2015Q1 2014
total CAPEX(in million euros) Excluding licenses
• 74 % of total group CAPEX allocated to network
• #1 4G network
• ambitious 2014/15 4G roll-out plan
Mobistar - Financial results Q1 2015
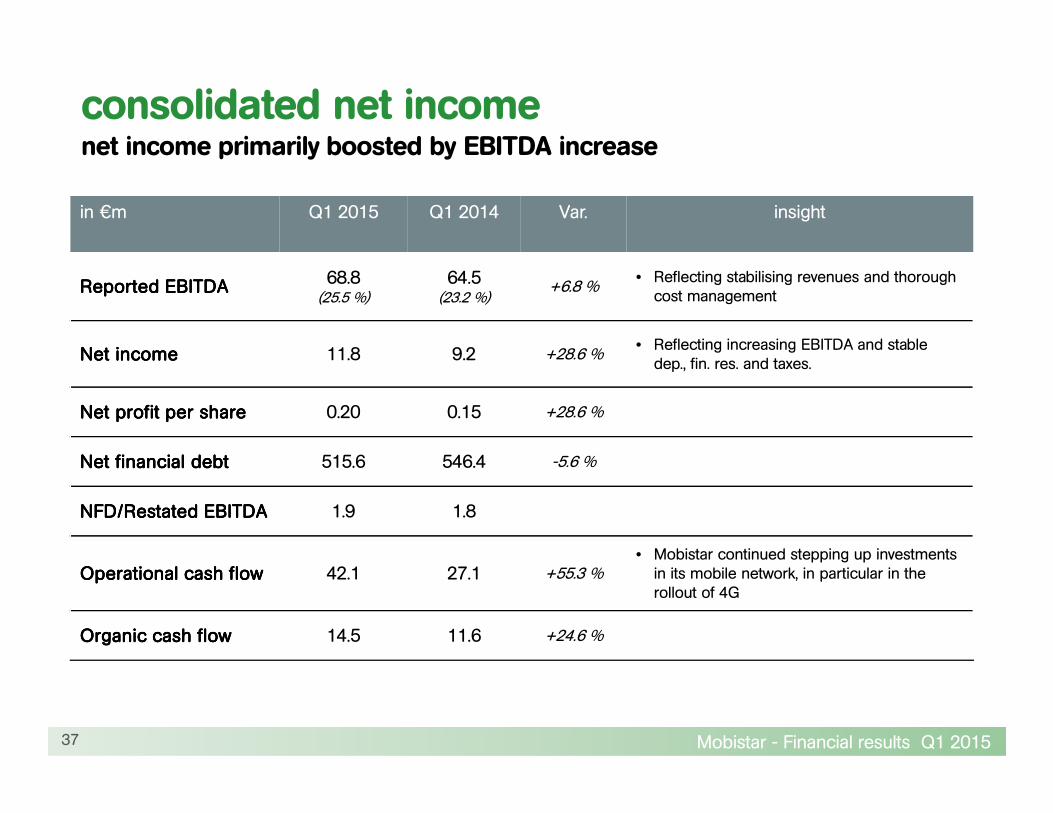
consolidated net incomenet income primarily boosted by EBITDA increase
37
in €m Q1 2015 Q1 2014 Var. insight
Reported EBITDAReported EBITDAReported EBITDAReported EBITDA 68.8(25.5 %)
64.5(23.2 %)
+6.8 %• Reflecting stabilising revenues and thoroughcost management
Net incomeNet incomeNet incomeNet income 11.8 9.2 +28.6 %• Reflecting increasing EBITDA and stable dep., fin. res. and taxes.
Net profit per shareNet profit per shareNet profit per shareNet profit per share 0.20 0.15 +28.6 %
Net financial debtNet financial debtNet financial debtNet financial debt 515.6 546.4 -5.6 %
NFD/Restated EBITDANFD/Restated EBITDANFD/Restated EBITDANFD/Restated EBITDA 1.9 1.8
Operational cash flowOperational cash flowOperational cash flowOperational cash flow 42.1 27.1 +55.3 %• Mobistar continued stepping up investments in its mobile network, in particular in the rollout of 4G
Organic cash flowOrganic cash flowOrganic cash flowOrganic cash flow 14.5 11.6 +24.6 %

Mobistar - Financial results Q1 2015
Outlook 2015JeanJeanJeanJean----Marc Marc Marc Marc HarionHarionHarionHarion, , , , Chief Executive Officer
Mobistar - Financial results Q1 2015
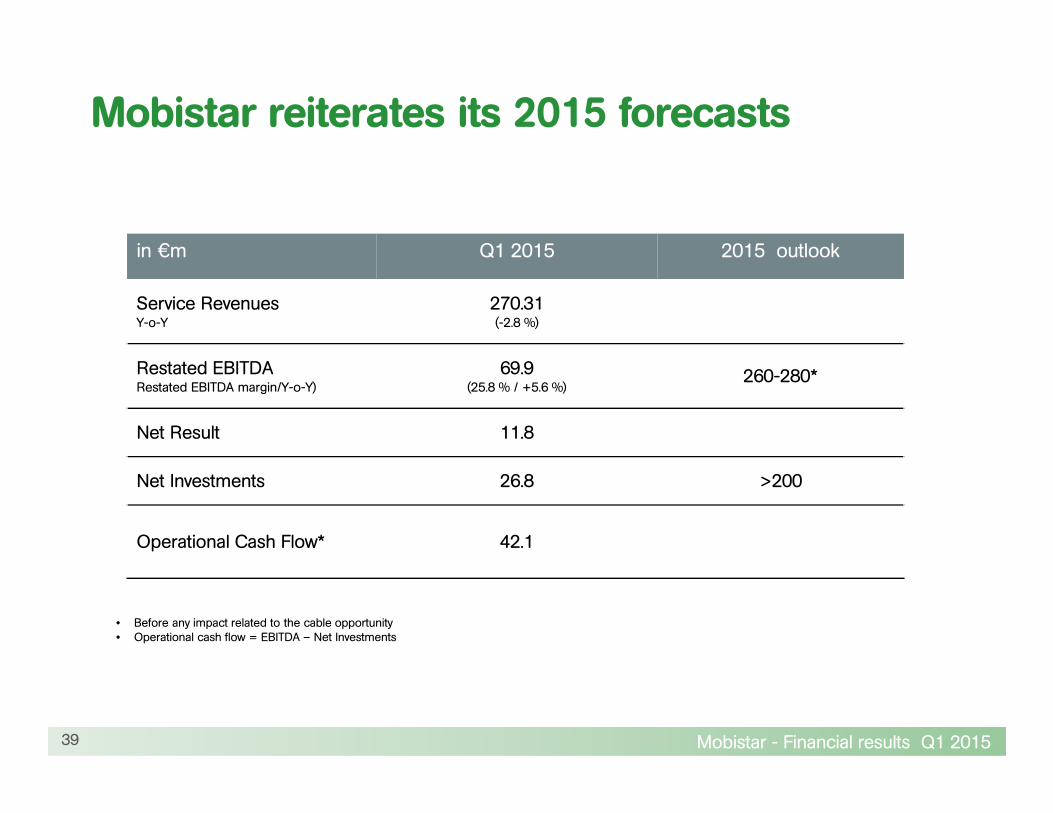
• Before any impact related to the cable opportunity• Operational cash flow = EBITDA – Net Investments
Mobistar reiterates its 2015 forecasts
39
in €m Q1 2015 2015 outlook
Service RevenuesY-o-Y
270.31(-2.8 %)
Restated EBITDARestated EBITDA margin/Y-o-Y)
69.9(25.8 % / +5.6 %)
260-280*
Net Result 11.8
Net Investments 26.8 >200
Operational Cash Flow* 42.1
Mobistar - Financial results Q1 2015
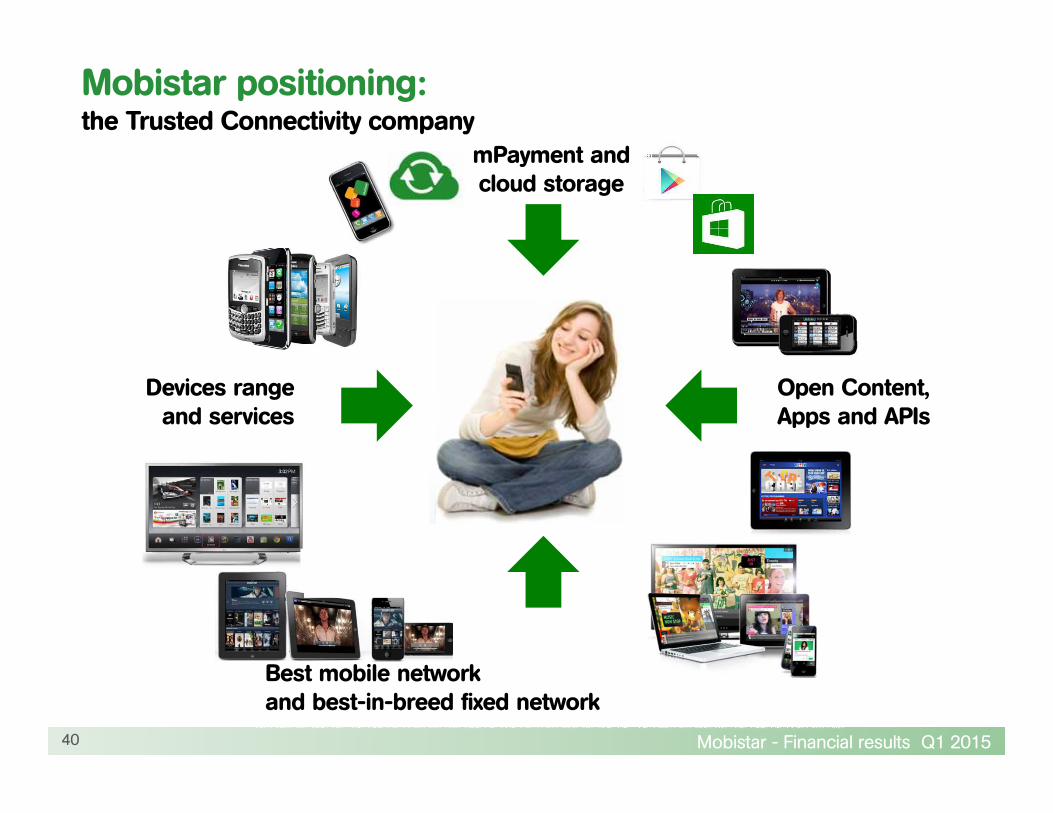
Best mobile networkand best-in-breed fixed network
Devices range and services
Open Content, Apps and APIs
mPayment and cloud storage
40
Mobistar positioning:the Trusted Connectivity company
Mobistar - Financial results Q1 2015
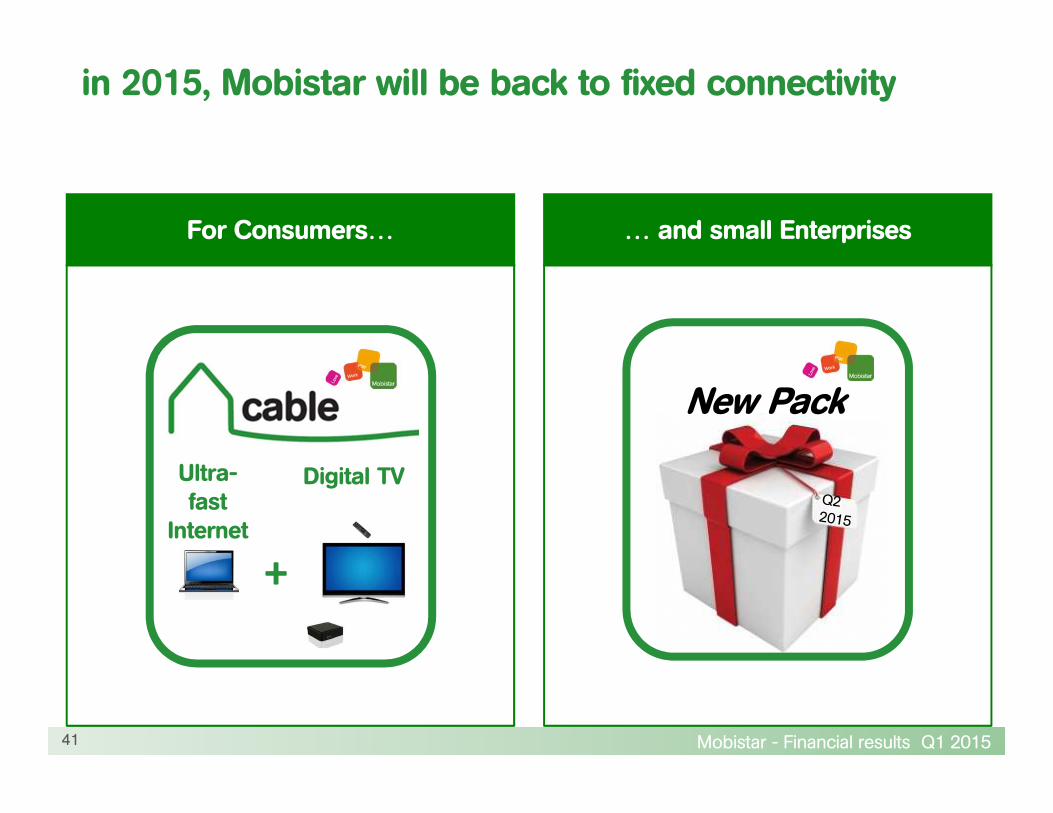
in 2015, Mobistar will be back to fixed connectivity
For Consumers… … and small Enterprises
New Pack
41
Ultra-fast
Internet
Digital TV
+
Mobistar - Financial results Q1 2015
2014 2015
=
in 2015, Mobistar will stabilize its restated EBITDA
42
Mobistar - Financial results Q1 2015
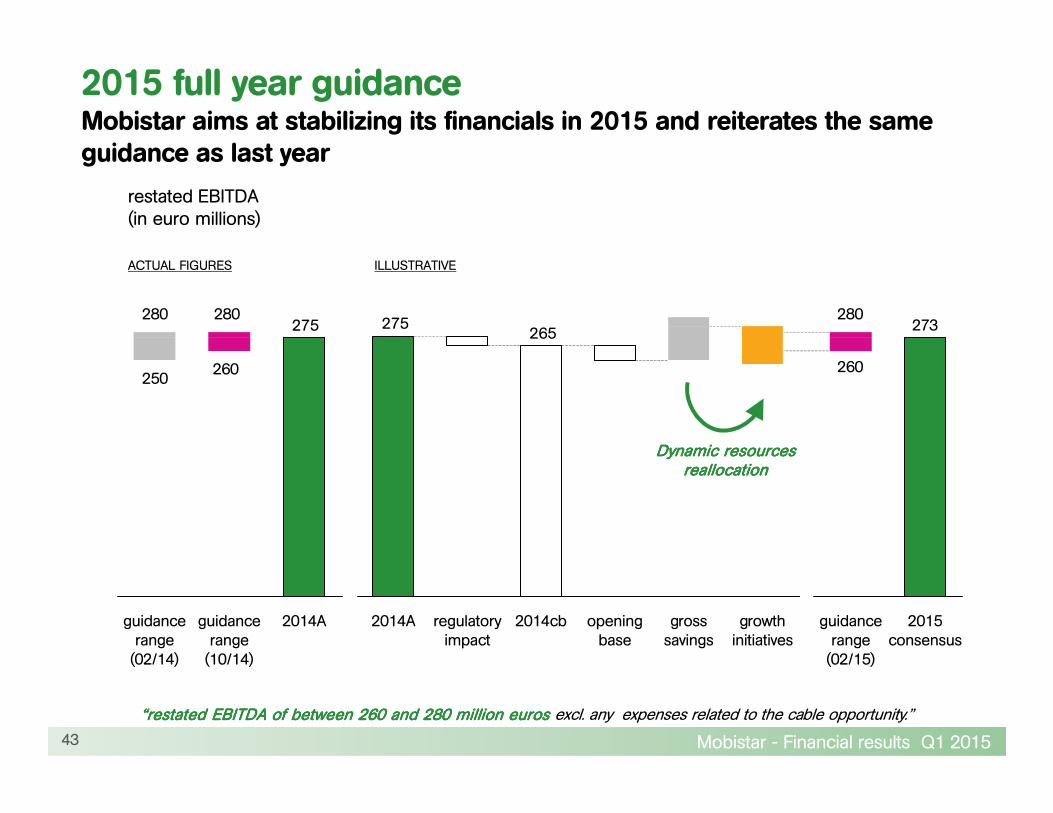
2015 full year guidanceMobistar aims at stabilizing its financials in 2015 and reiterates the sameguidance as last year
43
275
guidance range (02/14)
2014Aguidance range (10/14)
265275
2014cb growth initiatives
gross savings
opening base
regulatory impact
2014A
280
250260
280
Dynamic resourcesDynamic resourcesDynamic resourcesDynamic resourcesreallocationreallocationreallocationreallocation
restated EBITDA(in euro millions)
ILLUSTRATIVEACTUAL FIGURES
“restated EBITDA of between 260 and 280 million euros “restated EBITDA of between 260 and 280 million euros “restated EBITDA of between 260 and 280 million euros “restated EBITDA of between 260 and 280 million euros excl. any expenses related to the cable opportunity.”
273
2015 consensus
guidance range (02/15)
280
260

Mobistar - Financial results Q1 2015
Q&A
Mobistar - Financial results Q1 2015
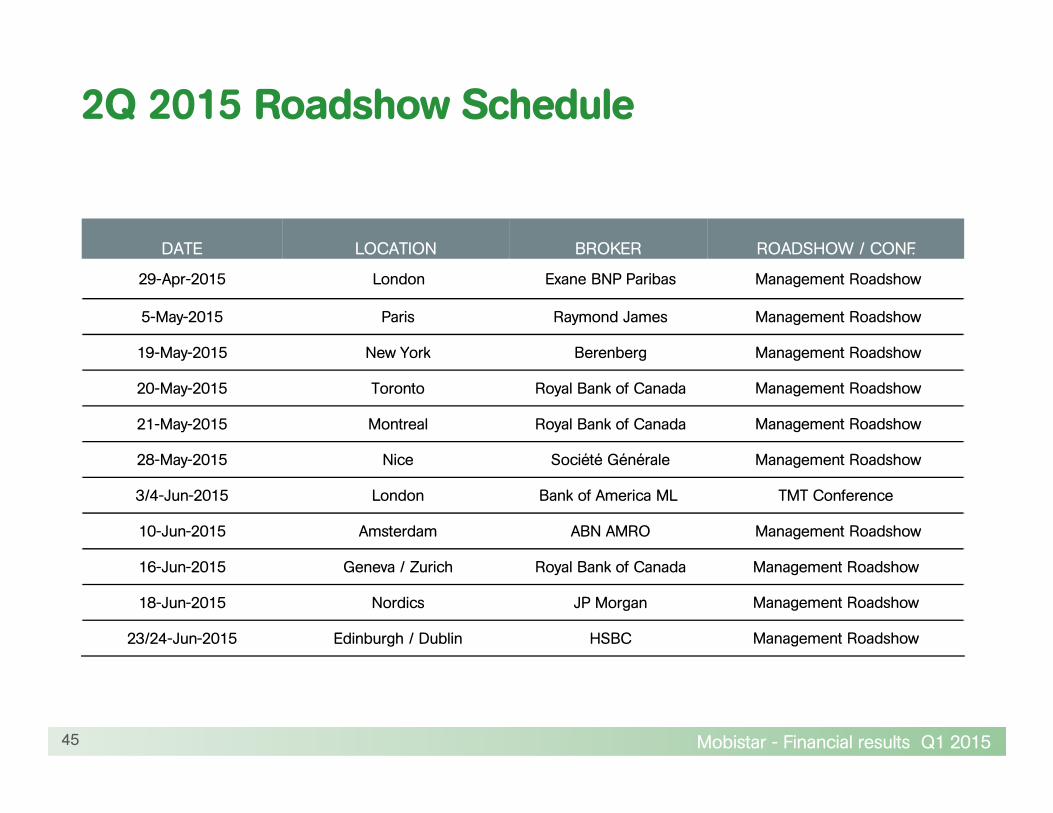
2Q 2015 Roadshow Schedule
45
DATE LOCATION BROKER ROADSHOW / CONF.
29-Apr-2015 London Exane BNP Paribas Management Roadshow
5-May-2015 Paris Raymond James Management Roadshow
19-May-2015 New York Berenberg Management Roadshow
20-May-2015 Toronto Royal Bank of Canada Management Roadshow
21-May-2015 Montreal Royal Bank of Canada Management Roadshow
28-May-2015 Nice Société Générale Management Roadshow
3/4-Jun-2015 London Bank of America ML TMT Conference
10-Jun-2015 Amsterdam ABN AMRO Management Roadshow
16-Jun-2015 Geneva / Zurich Royal Bank of Canada Management Roadshow
18-Jun-2015 Nordics JP Morgan Management Roadshow
23/24-Jun-2015 Edinburgh / Dublin HSBC Management Roadshow
Mobistar - Financial results Q1 2015
Appendix
Mobistar - Financial results Q1 2015
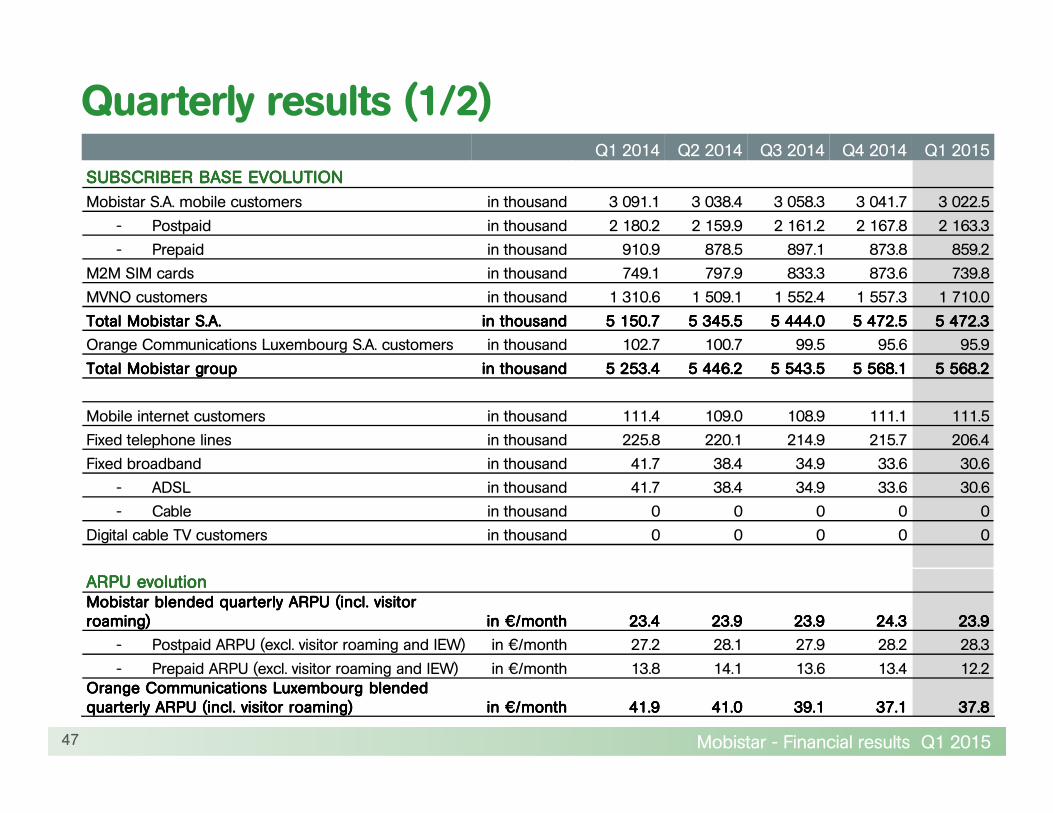
Quarterly results (1/2)
47
Q1 2014 Q2 2014 Q3 2014 Q4 2014 Q1 2015
SUBSCRIBER BASE EVOLUTIONSUBSCRIBER BASE EVOLUTIONSUBSCRIBER BASE EVOLUTIONSUBSCRIBER BASE EVOLUTION
Mobistar S.A. mobile customers in thousand 3 091.1 3 038.4 3 058.3 3 041.7 3 022.5
- Postpaid in thousand 2 180.2 2 159.9 2 161.2 2 167.8 2 163.3
- Prepaid in thousand 910.9 878.5 897.1 873.8 859.2
M2M SIM cards in thousand 749.1 797.9 833.3 873.6 739.8
MVNO customers in thousand 1 310.6 1 509.1 1 552.4 1 557.3 1 710.0
Total Mobistar S.A.Total Mobistar S.A.Total Mobistar S.A.Total Mobistar S.A. in thousandin thousandin thousandin thousand 5 150.75 150.75 150.75 150.7 5 345.55 345.55 345.55 345.5 5 444.05 444.05 444.05 444.0 5 472.55 472.55 472.55 472.5 5 472.35 472.35 472.35 472.3
Orange Communications Luxembourg S.A. customers in thousand 102.7 100.7 99.5 95.6 95.9
Total Mobistar groupTotal Mobistar groupTotal Mobistar groupTotal Mobistar group in thousandin thousandin thousandin thousand 5 253.45 253.45 253.45 253.4 5 446.25 446.25 446.25 446.2 5 543.55 543.55 543.55 543.5 5 568.15 568.15 568.15 568.1 5 568.25 568.25 568.25 568.2
Mobile internet customers in thousand 111.4 109.0 108.9 111.1 111.5
Fixed telephone lines in thousand 225.8 220.1 214.9 215.7 206.4
Fixed broadband in thousand 41.7 38.4 34.9 33.6 30.6
- ADSL in thousand 41.7 38.4 34.9 33.6 30.6
- Cable in thousand 0 0 0 0 0
Digital cable TV customers in thousand 0 0 0 0 0
ARPU ARPU ARPU ARPU evolutionevolutionevolutionevolutionMobistarMobistarMobistarMobistar blended quarterly ARPU (incl. visitor blended quarterly ARPU (incl. visitor blended quarterly ARPU (incl. visitor blended quarterly ARPU (incl. visitor roaming)roaming)roaming)roaming) in in in in €€€€/month /month /month /month 23.423.423.423.4 23.923.923.923.9 23.923.923.923.9 24.324.324.324.3 23.923.923.923.9
- Postpaid ARPU (excl. visitor roaming and IEW) in €/month 27.2 28.1 27.9 28.2 28.3
- Prepaid ARPU (excl. visitor roaming and IEW) in €/month 13.8 14.1 13.6 13.4 12.2Orange Communications Luxembourg blended Orange Communications Luxembourg blended Orange Communications Luxembourg blended Orange Communications Luxembourg blended quarterly ARPU (incl. visitor roaming)quarterly ARPU (incl. visitor roaming)quarterly ARPU (incl. visitor roaming)quarterly ARPU (incl. visitor roaming) in in in in €€€€/month/month/month/month 41.941.941.941.9 41.041.041.041.0 39.139.139.139.1 37.137.137.137.1 37.837.837.837.8
Mobistar - Financial results Q1 2015
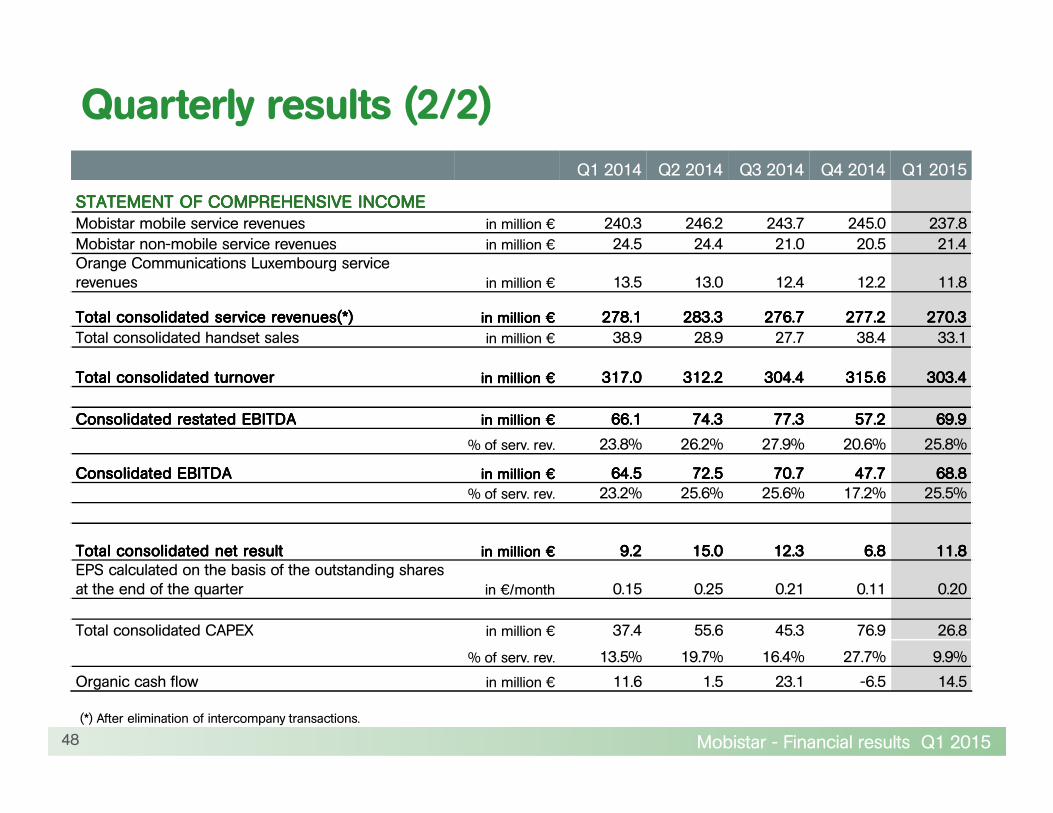
Quarterly results (2/2)
48
(*) After elimination of intercompany transactions.
Q1 2014 Q2 2014 Q3 2014 Q4 2014 Q1 2015
STATEMENT OF COMPREHENSIVE INCOMESTATEMENT OF COMPREHENSIVE INCOMESTATEMENT OF COMPREHENSIVE INCOMESTATEMENT OF COMPREHENSIVE INCOMEMobistar mobile service revenues in million € 240.3 246.2 243.7 245.0 237.8
Mobistar non-mobile service revenues in million € 24.5 24.4 21.0 20.5 21.4Orange Communications Luxembourg service revenues in million € 13.5 13.0 12.4 12.2 11.8
Total Total Total Total consolidatedconsolidatedconsolidatedconsolidated service revenues(*)service revenues(*)service revenues(*)service revenues(*) in million in million in million in million €€€€ 278.1278.1278.1278.1 283.3283.3283.3283.3 276.7276.7276.7276.7 277.2277.2277.2277.2 270.3270.3270.3270.3
Total consolidated handset sales in million € 38.9 28.9 27.7 38.4 33.1
Total Total Total Total consolidatedconsolidatedconsolidatedconsolidated turnoverturnoverturnoverturnover in million in million in million in million €€€€ 317.0317.0317.0317.0 312.2312.2312.2312.2 304.4304.4304.4304.4 315.6315.6315.6315.6 303.4303.4303.4303.4
ConsolidatedConsolidatedConsolidatedConsolidated restatedrestatedrestatedrestated EBITDAEBITDAEBITDAEBITDA in million in million in million in million €€€€ 66.166.166.166.1 74.374.374.374.3 77.377.377.377.3 57.257.257.257.2 69.969.969.969.9
% of serv. rev. 23.8% 26.2% 27.9% 20.6% 25.8%
ConsolidatedConsolidatedConsolidatedConsolidated EBITDAEBITDAEBITDAEBITDA in million in million in million in million €€€€ 64.564.564.564.5 72.572.572.572.5 70.770.770.770.7 47.747.747.747.7 68.868.868.868.8
% of serv. rev. 23.2% 25.6% 25.6% 17.2% 25.5%
Total consolidated net resultTotal consolidated net resultTotal consolidated net resultTotal consolidated net result in million in million in million in million €€€€ 9.29.29.29.2 15.015.015.015.0 12.312.312.312.3 6.86.86.86.8 11.811.811.811.8EPS calculated on the basis of the outstanding shares at the end of the quarter in €/month 0.15 0.25 0.21 0.11 0.20
Total consolidated CAPEX in million € 37.4 55.6 45.3 76.9 26.8
% of serv. rev. 13.5% 19.7% 16.4% 27.7% 9.9%
Organic cash flow in million € 11.6 1.5 23.1 -6.5 14.5
Mobistar - Financial results Q1 2015
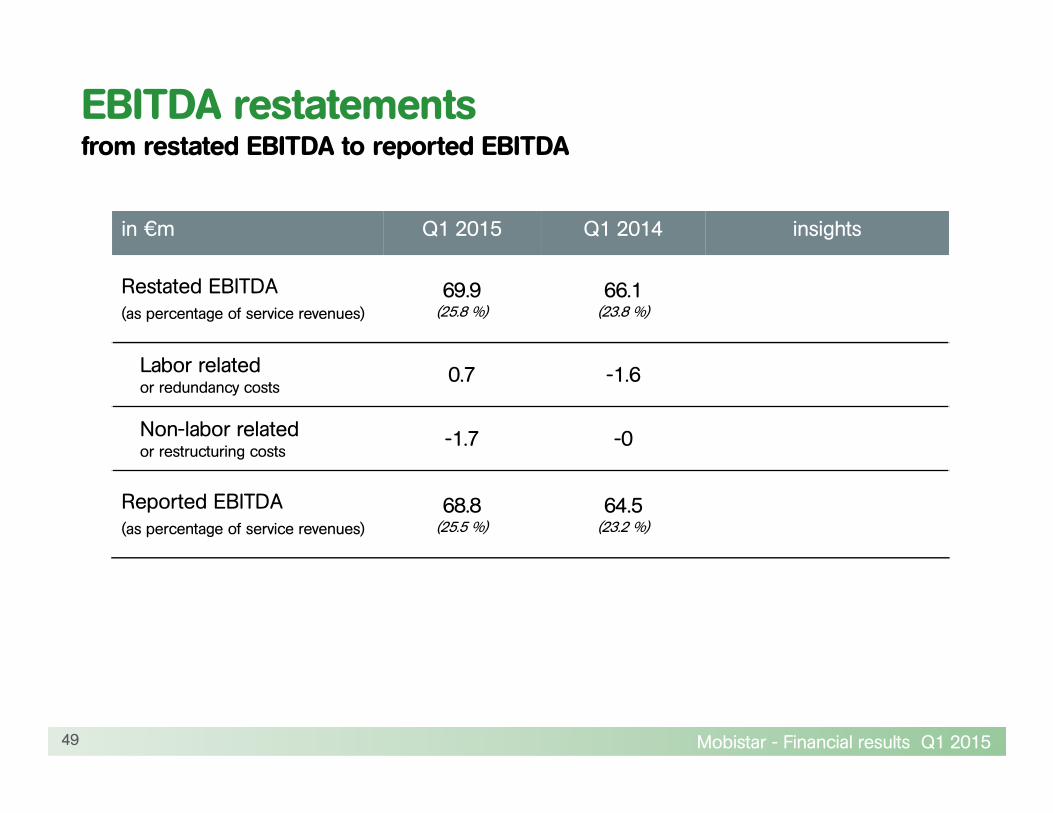
EBITDA restatementsfrom restated EBITDA to reported EBITDA
49
in €m Q1 2015 Q1 2014 insights
Restated EBITDA(as percentage of service revenues)
69.9(25.8 %)
66.1(23.8 %)
Labor relatedor redundancy costs
0.7 -1.6
Non-labor relatedor restructuring costs
-1.7 -0
Reported EBITDA(as percentage of service revenues)
68.8(25.5 %)
64.5(23.2 %)

Mobistar - Financial results Q1 2015
Investor Relations:Investor Relations:Investor Relations:Investor Relations:• [email protected]• +32 2 745 80 92• corporate.mobistar.be
@pressmobistar@harion
www.linkedin.com/company/3673