mobile path to purchase travel - report
DESCRIPTION
TRANSCRIPT

PATH TO PURCHASE STUDY
73%SMARTPHONESUSED MORE TO
FIND ANDCONTACT
BUSINESSES
TABLETSUSED MORE FOR
RESEARCH PRICECOMPARISONS,AND REVIEWS
Look for/use phone numbersto contact businesses
Look up a business locationor map/directions
UP TOUP TO
Of Smartphone & Tablet Users,Across Categories
84%
TOP 3 REASONS FOR ENGAGING WITH MOBILE ADS> LOCALLY RELEVANT
> LOCAL OFFERS COUPONS/PROMOTIONS
> FEATURES A KNOWN BRAND
OVER80%
conversion rate forrestaurant searches
AUGUST 2012
Mobile Search Is Everywhere
Phone Numbers, Directions, Deals Are Critical Mobile Content
Restaurant Searchers Make Quick Purchase Decisions
Mobile Purchase Intent Is Strong
Conversion rates consistent across smartphones and tablets
Local Relevance Key To Mobile Path To Purchase
Smartphone68%
USERS MOSTLY USE THEIR DEVICE
WHEN THEY ARE ON THE GO
72%Tablet
USERS MOSTLY USE THEIR DEVICE
WHEN THEY ARE AT HOME
RESTAURANT SEARCHES: 64% OF SMARTPHONE AND 44% OF TABLET USERS WANT TO DECIDE WITHIN AN HOUR
Restaurants TravelAutomotive
Searches that result in Purchases
2 OUT OF 3CONSUMERS NOTICE MOBILE ADS
1 OUT OF 3RESULT IN AN AD CLICK
User Transaction Intent
85%
46%
51%
IMMEDIATE Users want to purchasewithin an hour
MIXED Both quick conversions & research
FUTURE Research based with longer termconversions
ON THE GOA CAR IS THE MOST
POPULAR ON THE GOLOCATION FOR
MOBILE SEARCHES
Source: xAd/Telmetrics Mobile Path to Purchase Study 2012. Visit mobilepathtopurchase.com for more info.
Intent to make purchase within the day
Restaurants Travel Automotive87% 49%33%
© xAd, Inc. | 1230 Avenue of the Americas | 7th Floor | New York, NY 10020 | P: 347.501.0436 | xAd.com© Telmetrics, Inc. | 2680 Skymark Avenue| Suite 900 | Mississauga, Ontario, Canada L4W 5L6 | P: 800.255.3224 | Telmetrics.com
IN PARTNERSHIP WITH:
vector icons pack03 vector icons pack 03vector icons pack 03
The xAd/Telmetrics Mobile Path to Purchase Study
CONTENTS
1 KEY FINDINGS
3 DEFINING THE MOBILE TRAVEL USER
4 MOBILE TRAVEL USER PROFILES
5 PATH TO PURCHASE STAGE 1: AWARENESS
8 PATH TO PURCHASE STAGE 2: CONSIDERATION
11 PATH TO PURCHASE STAGE 3: PURCHASE
13 SUMMARY
13 STUDY METHODOLOGY
13 TERMINOLOGY
14 ABOUT THE REPORT

EXECUTIVE SUMMARY / KEY FINDINGS
The xAd/Telmetrics Mobile Path to Purchase Study
1
• 88% of the smartphone audience accessed travel related information during the study period – April 2012
• Although a large portion of smartphone users have accessed travel related content – (4) distinct Mobile Travel User Profiles stood out as over indexing in usage, each with varying demographics, mobile usage behaviors and intent
• Travel Researcher • Price Hunter • Frequent Traveler • Local Traveler
• While the majority of users where researching or seeking additional information, mobile travel users showed strong conversion behaviors
• More than 1/3 accessed information such as a business location, directions, or a business phone number
• More than 30% of mobile travel users are looking to make a purchase within the day
• In fact, almost half of mobile travel users go on to make a purchase related to the activities they completed via their mobile device – with 29% completing the purchase on the smartphone itself
• As seen in other studies, tablet and smartphone users exhibit different behaviors as smartphone activities over-index tablets in activities related to finding and contacting businesses – while tablets over-index in more research related activities like price comparisons, looking up reviews, etc.
• Considering that only ¼ of both smartphone and tablet users have narrowed down their activities to a specific brand or purchase, what users see and find on their mobile device can impact their future purchase decisions
• In fact, the majority of mobile Travel users notice mobile ads, with nearly 1 out of 3 clicking on the ad for more information
• 75% noticed ads via smartphone • 60% noticed ads via tablet
• Ads that are locally relevant or offer a coupon or promotion are most likely to be clicked on by mobile Travel users
The xAd/TelmetricsMobile Path to Purchase Study was developed to give marketers an understanding of how mobile is used during the consumer’s path-to-purchase in one of the fastest growing mobile usage categories – Travel. Findings from this study will help advertisers understand the crucial role that mobile plays in each stage of the purchase process, allowing advertisers to better reach and engage this highly fragmented and active audience. Below are key data points from the first edition of this three-part study pertaining to the Travel category.

INTRODUCTIONAs both smartphone and tablet adoption continues to rise, a handful of popular categories have emerged including Travel, Restaurants, and Auto. Based on the research to date, each of these categories has an ex-tremely relevant opportunity in mobile. But even with their growing popularity in the mobile space, user engagement related to these categories has not been explored at the depth necessary to truly advance industry understanding - therein lies the ultimate goal of this report.
xAd and long-time partner, Telmetrics, have partnered with Nielsen to develop this first-to-market mobile behavior study that helps track the mobile consumer from initial purchase intent to conversion, while also exploring ad effectiveness, and dissecting the various profiles of mobile Travel users. This study combines online survey data from 1,500 U.S. tablet and smartphone users, as well as actual observed behaviors from Nielsen’s Smartphone Analytics Panel of 6,000 Apple and Android users – each group reporting they had engaged in activity related to Travel, Restaurants, and/or Auto in the past 30 days.
In an effort to do proper justice to the over-abundance of data collected from this report, we’ve decided to digest and release each category individually. This series of reports will uncover mobile user preferences and activities related to the Travel, Restaurant, and Auto categories – findings that will become essential resources for the mobile industry going forward.
First up is Travel – a timely release alongside the busy summer vacation season, and a category that has seen significant growth in the last year, landing in the top 5 mobile growth categories according to eMarketer, Nielsen and Comscore. In Q1 of this year alone, eMarketer reported a 200% growth in mobile ad spending for the Travel industry. But as Travel brands recognize the value of mobile and hop on board, they are often doing so blindly and without the in-depth experience and knowledge necessary to effectively reach and engage this desirable audience. Why? First, mobile is growing faster than any other new media before it. As a result, there is very little that has been done in the way of past research, or experiences to build from. Second, research related to mobile Travel user behavior has never been explored and made available to the industry – until now.
INTERACTING WITH TRAVEL CONTENT ON THE SMALLER SCREENThe results of this report indicate that nearly 9 out of 10 smartphone users accessed Travel content on their devices in April 2012, spending on average 93 minutes per month on Travel applications and websites – 94% of which was done in application. Per recent trending in the Travel category, time spent interacting with Travel content via mobile device will only continue to grow. Therefore it’s important to understand how and why the mobile user interacts with Travel content in order to provide greater relevancy, and better target the correct consumer audience segments when planning mobile advertising.
First, we’ll get to know the mobile travel user and explore four key user profiles revealed through this study. Second, we’ll follow the three key stages in mobile consumer interaction; Awareness, Decision, and Purchase. The data provided in this report is organized to better understand the unique behaviors found within these three key stages and to identify the Travel industry opportunities available therein. And finally we will uncover what makes mobile advertising effective in the eye of the Travel user.
xAd/TELMETRICS MOBILE PATH TO PURCHASE STUDY
The xAd/Telmetrics Mobile Path to Purchase Study
2

Mobile users interacting with Travel content represent a diverse group of smartphone and tablet owners. While the data below illustrates prevalence with primarily younger, Caucasian males, the differences in Gender, Household Income, and Education levels are less severe. Therefore ethnicity and age alone should not be the driving factor in developing Travel related advertising on mobile.
In order to better identify the user variety available within the mobile Travel audience, we went beyond the user survey portion of this study and dug deep within the actual user behavior conducted by the Nielsen Smartphone Analytics Panel. This level of analysis has never before been conducted in mobile, and as the first to provide this type of mobile research, we are excited to introduce the industry to the four mobile Travel user profiles uncovered.
WHO IS THE MOBILE TRAVEL USER
The xAd/Telmetrics Mobile Path to Purchase Study
3
MOBILE TRAVEL USER DEMOGRAPHICS
PATH TO PURCHASE STUDY
73%SMARTPHONESUSED MORE TO
FIND ANDCONTACT
BUSINESSES
TABLETSUSED MORE FOR
RESEARCH PRICECOMPARISONS,AND REVIEWS
Look for/use phone numbersto contact businesses
Look up a business locationor map/directions
UP TOUP TO
Of Smartphone & Tablet Users,Across Categories
84%
TOP 3 REASONS FOR ENGAGING WITH MOBILE ADS> LOCALLY RELEVANT
> LOCAL OFFERS COUPONS/PROMOTIONS
> FEATURES A KNOWN BRAND
OVER80%
conversion rate forrestaurant searches
AUGUST 2012
Mobile Search Is Everywhere
Phone Numbers, Directions, Deals Are Critical Mobile Content
Restaurant Searchers Make Quick Purchase Decisions
Mobile Purchase Intent Is Strong
Conversion rates consistent across smartphones and tablets
Local Relevance Key To Mobile Path To Purchase
Smartphone68%
USERS MOSTLY USE THEIR DEVICE
WHEN THEY ARE ON THE GO
72%Tablet
USERS MOSTLY USE THEIR DEVICE
WHEN THEY ARE AT HOME
RESTAURANT SEARCHES: 64% OF SMARTPHONE AND 44% OF TABLET USERS WANT TO DECIDE WITHIN AN HOUR
Restaurants TravelAutomotive
Searches that result in Purchases
2 OUT OF 3CONSUMERS NOTICE MOBILE ADS
1 OUT OF 3RESULT IN AN AD CLICK
User Transaction Intent
85%
46%
51%
IMMEDIATE Users want to purchasewithin an hour
MIXED Both quick conversions & research
FUTURE Research based with longer termconversions
ON THE GOA CAR IS THE MOST
POPULAR ON THE GOLOCATION FOR
MOBILE SEARCHES
Source: xAd/Telmetrics Mobile Path to Purchase Study 2012. Visit mobilepathtopurchase.com for more info.
Intent to make purchase within the day
Restaurants Travel Automotive87% 49%33%
52%
18%
48%
27%21%
16%18%
13%
6%9%
29%12%
29%16%
6%3%
7%12%
72%
19%34%
21%12%
GENDER
0% 10% 20% 30% 40% 50% 60% 70% 80%
MALE
FEMALE
18-24
25-34
35-44
45-54
55+
<$25K
$25 TO <$50K
$50K TO $100K
$100K TO $150K
$150K>
SOME HIGH SCHOOL
COMPLETED HIGH SCHOOL OR EQUIVALENT
SOME COLLEGE (BUT NO DEGREE)
ASSOCIATES DEGREE
BACHOLARS DEGREE
GRADUATE DEGREE
WHITE/CAUCASIAN
BLACK/AFRICAN-AMERICAN
ASIAN/PACIFIC ISLANDER
MIXED RACE
OTHER
AGE
HH INCOME
EDUCATION
ETHNICITY

THE TRAVEL RESEARCHERThis first profile really breaks down previously conceived notions on the purchase intent of smartphone users. The Travel Researcher is defined by the sheer variety of activities and content they consume during a slightly longer path to purchase – contradicting previous claims of impulse shopping by smartphone users as a whole. Travel Researchers are largely Caucasian females, age 25-54 with a household income above $100k. During the course of their Travel consideration, they utilize Travel apps and mobile sites, search engines, social media and email, among other tools.
THE PRICE HUNTERYet another user profile supporting the use of mobile devices for more than just immediate, impulse purchasing - the Price Hunter is defined by their quest to research and compare the best pricing in order to make an economically based decision regarding their Travel plans. These deal seekers utilize social alongside Travel app and browser based sites to uncover the best deals and promotions, with heavy preference on Travel utility apps to compare prices. This group is a primarily female, non-white audience, age 25-54 with a household income less than $75k.
THE FREQUENT TRAVELERThis user group is defined by the extensive amount of Travel research conducted, and often booking being done within a month’s time. The Frequent Traveler is not as conscious of pricing, and therefore base their Travel planning on scheduling options and availability, with a few perks thrown in for comfort. These folks are Travel loyalists, and are often members of a few hotel or airline points programs and so they choose to conduct much of their search and eventual booking through these portals. This male-dominated category over-indexes in the reach of white, Asian-American and African-American mobile users, age 25-54 making more than $50k per year.
THE LOCAL TRAVELERNavigation apps and local directories reign supreme in the world of the Local Traveler, who utilizies these convenient mobile tools to plan their more locally-based trips before and during their journey. The Local Traveler incorporates activities conducted by Price Hunters in that pricing is a major factor of their trip, but the apps utilized during their process of research and purchase are quite different. Apps including Gas Buddy and Maps are prevalent in the Local Traveler’s research activities, as they hunt for the best deals on their next fill-up and plan their trip based on distance. Of course navigation apps are utilized during their trip in order to lead the way, but also to avoid traffic bottlenecks and tolls that could leave them running idle, and draining cash on the highway. This group consists of mostly white and Hispanic males, age 25-54, bringing in between $25k and $75k per year.
MOBILE TRAVEL USER PROFILES
The xAd/Telmetrics Mobile Path to Purchase Study
4
Travel Site
Social
Other
Search Engine
30%
27%
29%
60%11%
93%
6%1%
63%20%
17%
19%
12%
12%
Travel Site
Social
Other
Search Engine
30%
27%
29%
60%11%
93%
6%1%
63%20%
17%
19%
12%
12%
Travel Site
Social
Other
Search Engine
30%
27%
29%
60%11%
93%
6%1%
63%20%
17%
19%
12%
12%
Travel Site
Social
Other
Search Engine
30%
27%
29%
60%11%
93%
6%1%
63%20%
17%
19%
12%
12%
Travel Site
Social
Other
Search Engine
30%
27%
29%
60%11%
93%
6%1%
63%20%
17%
19%
12%
12%
The discovery of these four distinct Travel user groups now arm Travel marketers with the intel necessary to develop a mobile ad campaign that truly targets their intended audience. Taking into account far more than the typical user demographic information, these profiles tell a story about a mobile user’s place in the Travel path to purchase, how they prefer to engage with Travel content – ie. via apps or mobile sites – and their level of intent to purchase. This level of user insights is essential in developing a performance-driven mobile Travel campaign that increases user engagement and eliminates ad waste.
Although there are a variety of user types accessing Travel content from their smartphone, throughout the course of this research four distinct Mobile Travel User Profiles stood out - each with varying demographics, mobile usage behaviors, and intent.

When we talk about mobile user awareness related to Travel content, we are looking to understand the behavior that occurs within that first step of seeking to access Travel content via a mobile device, as well as the initial experience that occurs once that step has been taken. Mobile users have a number of different options available to them when looking to interact with Travel content on their device. They can access content via mobile browser such as Safari or Google, or interact directly with a downloaded app. With browser access, mobile users can head to a Travel brand website – perhaps their favorite airline or hotel chain – or choose a Travel utility provider that aggregates airline, hotel, rentals cars, etc. such as Kayak or Priceline. The same choice is available to mobile users who choose to interact with Travel content directly from an app, as many Travel providers and utility brands have made their business available via mobile application. The data provided in this section will dissect the driving factors that lead mobile users to access Travel content via mobile app or website, and then how they prefer to interact with Travel content once they have gained access.
According to the research, mobile applications had the largest overall reach of Travel users. The data also showed that application users spent more time consuming content (1:21 on average) vs. web users (0:11 on average). Specifically, tablet users tend to frequent the Travel comparison or utility websites (51%), while smartphone users prefer the app version of travel comparison or utility sites (35%), followed by branded or local directory apps (31%).
Overall, mobile Travel user preference of applications is no surprise to anyone who has ever interacted with both a mobile browser and application to access similar information. In many cases, mobile applications provide a far quicker method of finding the information requested. An additional reason for Travel user preference of apps over browser is that Travel brand sites like Delta.com or Hilton.com now direct users to utilize the brand app upon visiting the website. Just visit your favorite Travel brand website today on your mobile device and more than likely the site will auto identify you as a mobile user, promote the availability of the app, and ask you to download it. The reason for this is that in an application Travel brands can better control user experience, offer better functionality, etc.
PATH-TO-PURCHASE STAGE 1: AWARENESS
The xAd/Telmetrics Mobile Path to Purchase Study
5
Total
76.6M 74.4M
33.5M
88% 85%
38%
Apps Web
CHOOSING THE PREFERRED ACCESS POINT: APP VS. BROWSERMobile user engagement with Travel is rooted in overall brand awareness. In fact, 42% of smartphone users engage with an app or website of a brand they are already familiar with, and 40% choose to utilize an app or website they had used previously.
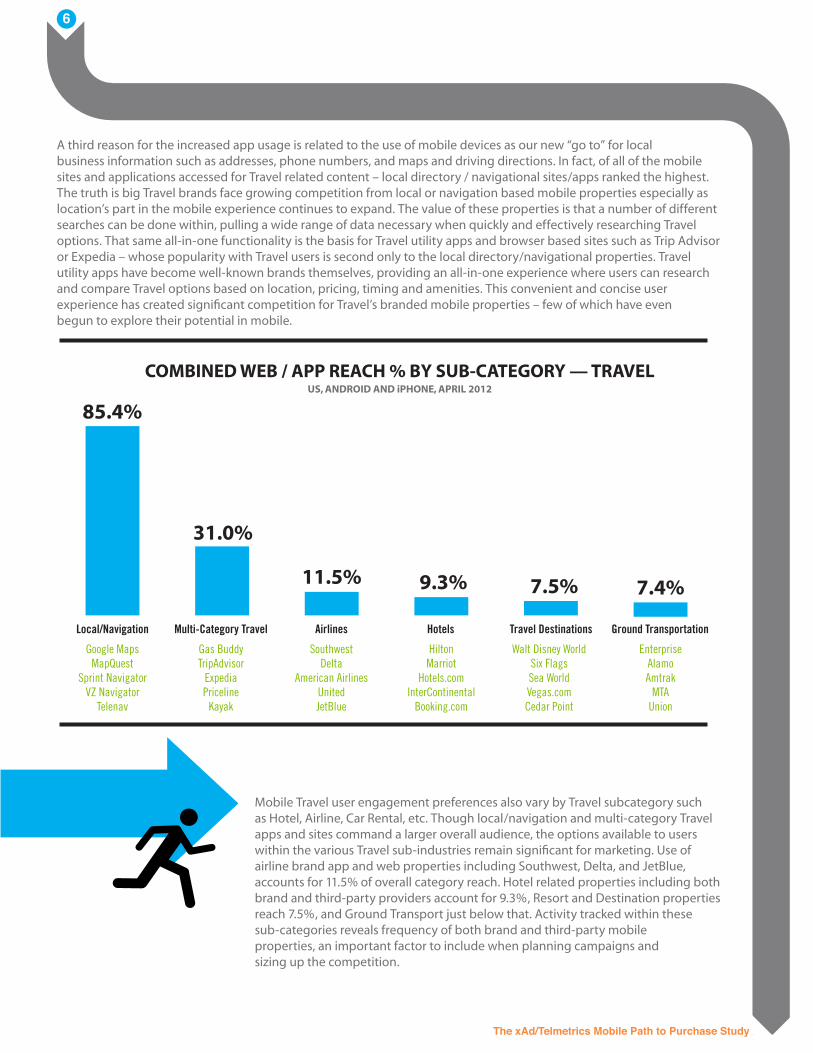
Mobile Travel user engagement preferences also vary by Travel subcategory such as Hotel, Airline, Car Rental, etc. Though local/navigation and multi-category Travel apps and sites command a larger overall audience, the options available to users within the various Travel sub-industries remain significant for marketing. Use of airline brand app and web properties including Southwest, Delta, and JetBlue, accounts for 11.5% of overall category reach. Hotel related properties including both brand and third-party providers account for 9.3%, Resort and Destination properties reach 7.5%, and Ground Transport just below that. Activity tracked within these sub-categories reveals frequency of both brand and third-party mobile properties, an important factor to include when planning campaigns and sizing up the competition.
A third reason for the increased app usage is related to the use of mobile devices as our new “go to” for local business information such as addresses, phone numbers, and maps and driving directions. In fact, of all of the mobile sites and applications accessed for Travel related content – local directory / navigational sites/apps ranked the highest. The truth is big Travel brands face growing competition from local or navigation based mobile properties especially as location’s part in the mobile experience continues to expand. The value of these properties is that a number of different searches can be done within, pulling a wide range of data necessary when quickly and effectively researching Travel options. That same all-in-one functionality is the basis for Travel utility apps and browser based sites such as Trip Advisor or Expedia – whose popularity with Travel users is second only to the local directory/navigational properties. Travel utility apps have become well-known brands themselves, providing an all-in-one experience where users can research and compare Travel options based on location, pricing, timing and amenities. This convenient and concise user experience has created significant competition for Travel’s branded mobile properties – few of which have even begun to explore their potential in mobile.
The xAd/Telmetrics Mobile Path to Purchase Study
6
COMBINED WEB / APP REACH % BY SUB-CATEGORY — TRAVELUS, ANDROID AND iPHONE, APRIL 2012
Local/Navigation
Google MapsMapQuest
Sprint NavigatorVZ Navigator
Telenav
Gas BuddyTripAdvisor
ExpediaPriceline
Kayak
SouthwestDelta
American AirlinesUnitedJetBlue
HiltonMarriot
Hotels.comInterContinental
Booking.com
Walt Disney WorldSix FlagsSea WorldVegas.comCedar Point
EnterpriseAlamoAmtrak
MTAUnion
Multi-Category Travel Airlines Hotels Travel Destinations Ground Transportation
85.4%
31.0%
11.5% 9.3% 7.5% 7.4%
7
The xAd/Telmetrics Mobile Path to Purchase Study
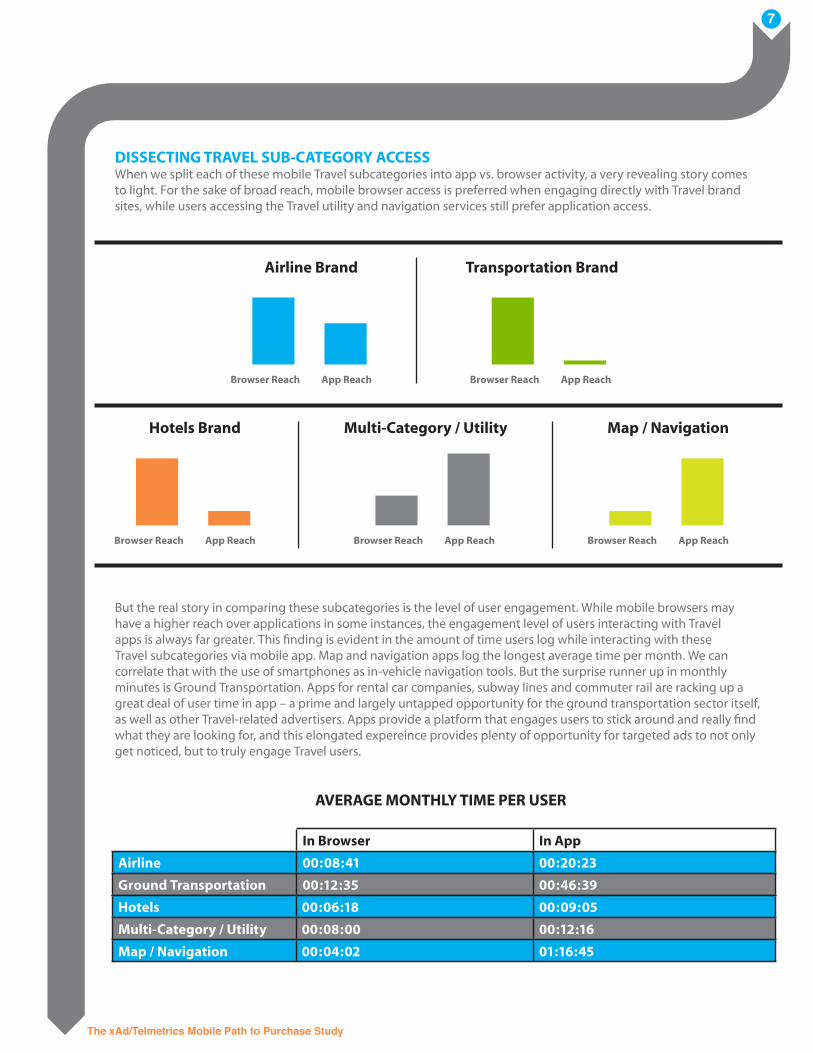
DISSECTING TRAVEL SUB-CATEGORY ACCESSWhen we split each of these mobile Travel subcategories into app vs. browser activity, a very revealing story comes to light. For the sake of broad reach, mobile browser access is preferred when engaging directly with Travel brand sites, while users accessing the Travel utility and navigation services still prefer application access.
In Browser In App
Airline 00:08:41 00:20:23
Ground Transportation 00:12:35 00:46:39
Hotels 00:06:18 00:09:05
Multi-Category / Utility 00:08:00 00:12:16
Map / Navigation 00:04:02 01:16:45
But the real story in comparing these subcategories is the level of user engagement. While mobile browsers may have a higher reach over applications in some instances, the engagement level of users interacting with Travel apps is always far greater. This finding is evident in the amount of time users log while interacting with these Travel subcategories via mobile app. Map and navigation apps log the longest average time per month. We can correlate that with the use of smartphones as in-vehicle navigation tools. But the surprise runner up in monthly minutes is Ground Transportation. Apps for rental car companies, subway lines and commuter rail are racking up a great deal of user time in app – a prime and largely untapped opportunity for the ground transportation sector itself, as well as other Travel-related advertisers. Apps provide a platform that engages users to stick around and really find what they are looking for, and this elongated expereince provides plenty of opportunity for targeted ads to not only get noticed, but to truly engage Travel users.
Airline Brand
Hotels Brand
Browser Reach
Browser Reach Browser Reach
Browser Reach
Browser Reach
App Reach
App Reach App Reach
App Reach
App Reach
Map / Navigation
Transportation Brand
Multi-Category / Utility
AVERAGE MONTHLY TIME PER USER

The xAd/Telmetrics Mobile Path to Purchase Study
8
This study reveals that mobile users are typically in this all-important research and consideration phase when accessing Travel-related content from their mobile device. In fact, when mobile users begin to interact with Travel-related content from their device, just ¼ of those users (both smartphone and tablet) have narrowed down their research activities to a specific brand or purchase. This means that the information (including advertisements) users see and find on their mobile device has the opportunity to truly guide their decisions during this crucial stage of their purchase process.
PATH-TO-PURCHASE STAGE 2: CONSIDERATION
Not sure/Don’t remember
I wasn’t really looking for a specific airline/hotel/rental car service, just browsing
I knew exactly what I was looking for
I had narrowed down what I was looking for
I had a general idea of what I was looking for
I had no idea what I was looking for
15%
34%
12%
11%
0
20
40
60
80
100
0
20
40
60
80
100
30%
17%
13%
11%
27%26%
1%2%TABLETSMARTPHONE
STAGE IN DECISION WHEN FIRST ACCESSING APP/WEBSITE

9
The xAd/Telmetrics Mobile Path to Purchase Study
When working with mobile devices, the influence of location can be direct – as in the vicinity of an intended purchase, or indicative of the location from which a user is conducting their mobile Travel activity – ie. work, home, or in the car. As seen in other studies, tablet and smartphone users exhibit different behaviors in terms of location of usage – with more smartphone usage happening outside of the home, and the most tablet usage occurring inside the home. But it’s the breakdown of the outside the home segment that makes things interesting.
SMARTPHONE USAGE
HOME
37%HOME
75%OUT OF HOME
63%
OUT OF HOME
25%
TABLET USAGE
TOP TRAVEL APP/WEBSITE ACTIVITIES BY DEVICE
SMARTPHONE
TABLET
Look up pricing information/compare prices
Look up flight/hotel/rental car general information
Look up location of hotel/rental car service
Look up directions to visit hotel/rental service
Use review to decide on airline/hotel/rental car
Find coupons/deals/promotions to use on airline/hotel/rental service
Call the business for more information
58%
37%
26%
26%
22%
22%
19%
67%
38%
28%
21%
26%
25%
13%
Of all the activities performed by mobile Travel users (both smartphone and tablet users), the act of looking up pricing or price comparison, followed by the access of general Travel related information, are the most popular. This behavior proves that although many assume smartphone activity drives quick, impulse purchases of convenience, mobile users infact demonstrate a longer and more deliberate process across both device types.
THE ROLE OF LOCATION While the majority of mobile travel users where researching or seeking additional information, they showed a strong preference for local information with 1 out of 5 interested in local business / contact information (such as a phone number or access to a business location). This behavior was seen across both smartphone and tablet users – despite the fact that the majority (63%) of smartphone activity happens on “the go” while 75% of tablet activity happens in the home.
10in order
The xAd/Telmetrics Mobile Path to Purchase Study
10
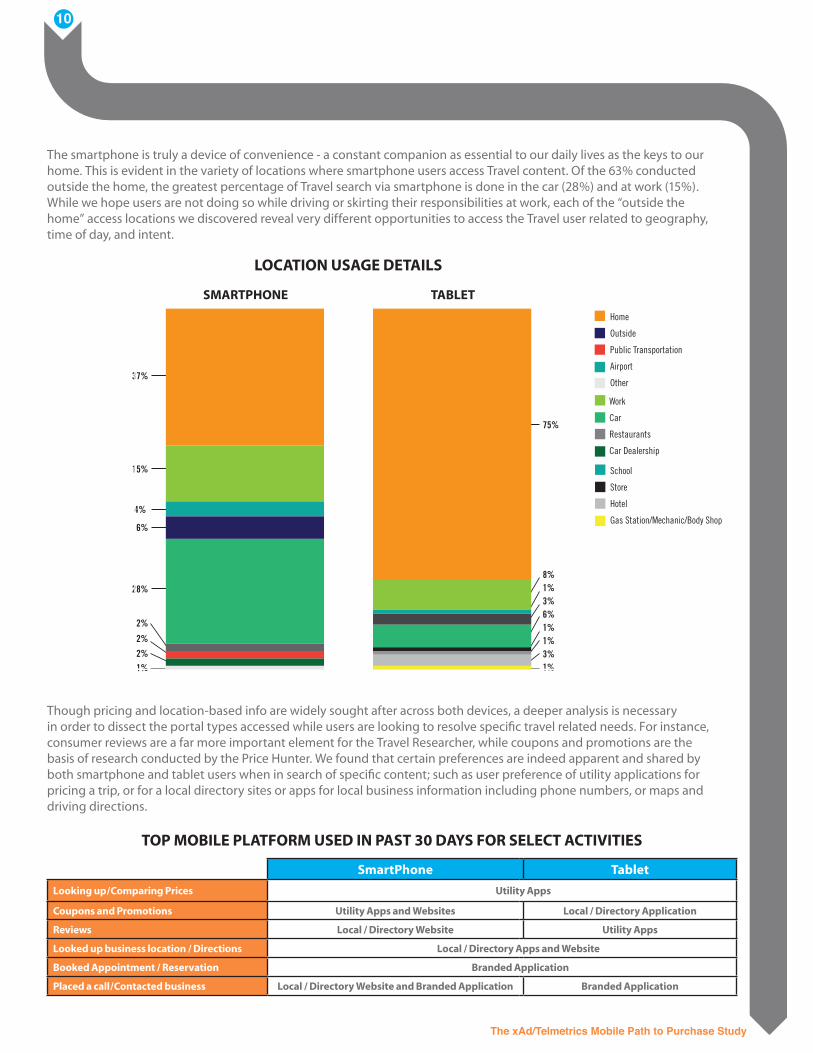
Though pricing and location-based info are widely sought after across both devices, a deeper analysis is necessary in order to dissect the portal types accessed while users are looking to resolve specific travel related needs. For instance, consumer reviews are a far more important element for the Travel Researcher, while coupons and promotions are the basis of research conducted by the Price Hunter. We found that certain preferences are indeed apparent and shared by both smartphone and tablet users when in search of specific content; such as user preference of utility applications for pricing a trip, or for a local directory sites or apps for local business information including phone numbers, or maps and driving directions.
The smartphone is truly a device of convenience - a constant companion as essential to our daily lives as the keys to our home. This is evident in the variety of locations where smartphone users access Travel content. Of the 63% conducted outside the home, the greatest percentage of Travel search via smartphone is done in the car (28%) and at work (15%). While we hope users are not doing so while driving or skirting their responsibilities at work, each of the “outside the home” access locations we discovered reveal very different opportunities to access the Travel user related to geography, time of day, and intent.
1%3%
1%1%
6%
3%1%
8%
75%
1%2%
2%
2%
28%
37%
15%
4%
6%
Home
Outside
Public Transportation
Airport
Other
Work
Car
Restaurants
Car Dealership
School
Store
Hotel
Gas Station/Mechanic/Body Shop
0
20
40
60
80
100
0
20
40
60
80
100
LOCATION USAGE DETAILS
SMARTPHONE TABLET
1%3%
1%1%
6%
3%1%
8%
75%
1%2%
2%
2%
28%
37%
15%
4%
6%
Home
Outside
Public Transportation
Airport
Other
Work
Car
Restaurants
Car Dealership
School
Store
Hotel
Gas Station/Mechanic/Body Shop
0
20
40
60
80
100
0
20
40
60
80
100
1%3%
1%1%
6%
3%1%
8%
75%
1%2%
2%
2%
28%
37%
15%
4%
6%
Home
Outside
Public Transportation
Airport
Other
Work
Car
Restaurants
Car Dealership
School
Store
Hotel
Gas Station/Mechanic/Body Shop
0
20
40
60
80
100
0
20
40
60
80
100
1%3%
1%1%
6%
3%1%
8%
75%
1%2%
2%
2%
28%
37%
15%
4%
6%
Home
Outside
Public Transportation
Airport
Other
Work
Car
Restaurants
Car Dealership
School
Store
Hotel
Gas Station/Mechanic/Body Shop
0
20
40
60
80
100
0
20
40
60
80
100
SmartPhone Tablet
Looking up/Comparing Prices Utility Apps
Coupons and Promotions Utility Apps and Websites Local / Directory Application
Reviews Local / Directory Website Utility Apps
Looked up business location / Directions Local / Directory Apps and Website
Booked Appointment / Reservation Branded Application
Placed a call/Contacted business Local / Directory Website and Branded Application Branded Application
TOP MOBILE PLATFORM USED IN PAST 30 DAYS FOR SELECT ACTIVITIES
PATH-TO-PURCHASE STAGE 3: PURCHASE
11
The xAd/Telmetrics Mobile Path to Purchase Study
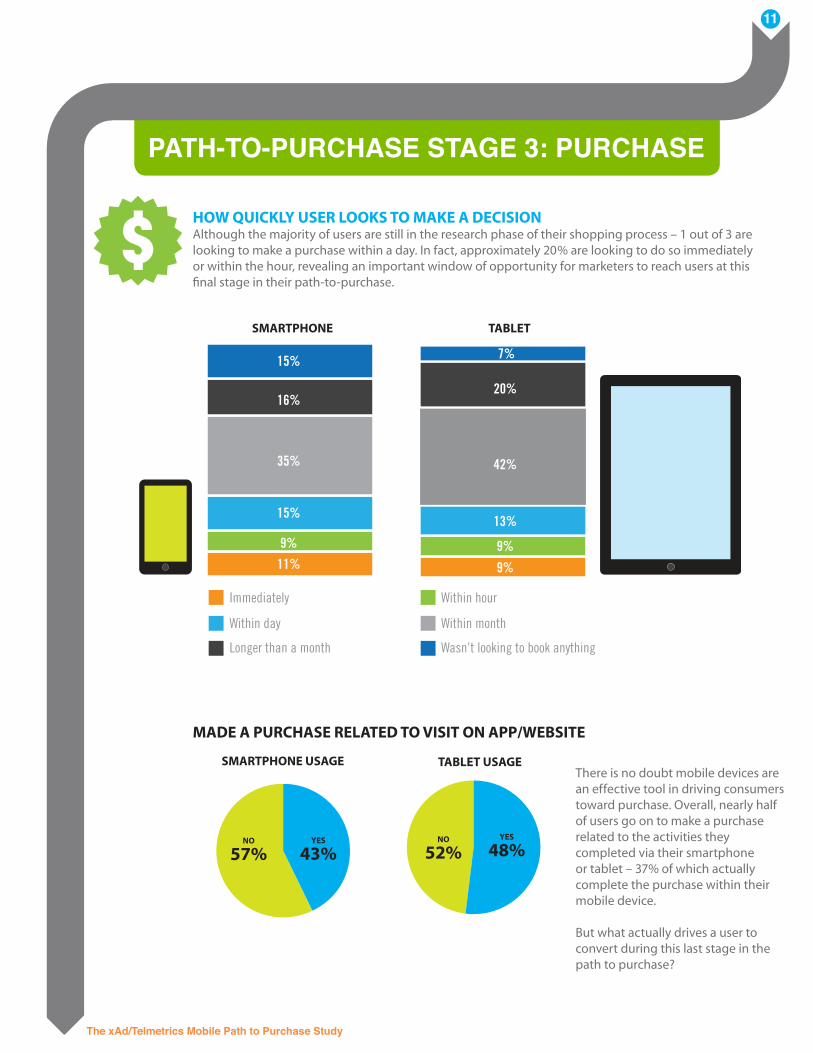
There is no doubt mobile devices are an effective tool in driving consumers toward purchase. Overall, nearly half of users go on to make a purchase related to the activities they completed via their smartphone or tablet – 37% of which actually complete the purchase within their mobile device.
But what actually drives a user to convert during this last stage in the path to purchase?
MADE A PURCHASE RELATED TO VISIT ON APP/WEBSITE
$
TABLET USAGE
YES
48%NO
52%NO
57%YES
43%
SMARTPHONE USAGE
Immediately
Within day
Longer than a month
Within hour
Within month
Wasn’t looking to book anything
0
20
40
60
80
100
0
20
40
60
80
100
120
15%
35%
16%
15%
9%
11%
42%
20%
13%
9%
9%
7%
TABLETSMARTPHONE
HOW QUICKLY USER LOOKS TO MAKE A DECISIONAlthough the majority of users are still in the research phase of their shopping process – 1 out of 3 are looking to make a purchase within a day. In fact, approximately 20% are looking to do so immediately or within the hour, revealing an important window of opportunity for marketers to reach users at this final stage in their path-to-purchase.

The xAd/Telmetrics Mobile Path to Purchase Study
12
TOP 3 REASONS FOR BOOKINGSMARTPHONE TABLET
» Right Price » Right Price
» Specific Brand Preference » Specific Brand Preference
» Prices Set to Increase Soon » Good Reviews
Whether driven by current economics or simply a desire to hunt down the best deal, a staggering 73% of smartphone users booked their Travel because the price was right – 19% driven by a deal that called for immediate action.
When users take the step to complete a Travel transaction, the very nature of each device comes into play. Tablet users are more likely to complete their purchase within their device, utilizing either app, browser of by calling the business directly (45%). But because smartphone users are a more mobile, “on the go” audience, we find less complete a transaction using their device (39%) and instead opt to complete a purchase either at the business location or via desktop computer – common and significant behaviors the industry is yet unable to track.
DRIVING ACTION THROUGH MOBILE ADVERTISEMENTBy dissecting these three key stages in the mobile Travel user’s path to purchase, we can better understand what effects mobile behavior – empowering travel marketers with the knowledge they need to engage their target mobile audience. Through this research we have discovered that price, location, and relevance are key elements of user consideration when moving toward purchase. In fact, 57% of smartphone users and 52% of tablet users report clicking on a mobile advertisement because it was targeted to their current needs or recent search behavior. Local relevance remains high throughout the mobile Travel user path to purchase with 73% of smartphone and 70% of tablet users reporting they are more likely to click on ads that include or are targeted based on location. Price is second only to local relevance for users of both device types as 72% of smartphone users and 69% of tablet users click on ads that offer coupons or promotions. Utilizing targeted ad placements to provide users with the information they need at the right place and time will not only increase ad engagement, but overall sales as well.
ADVERTISING MOST LIKELY TO CLICK ON BY DEVICE
Smartphone
Tablet
Ads thatincorporatemultimedia
Ad that features a brand I know
Ad that doesn’ttake me outside
app/website
Ads with phone number/clear way
of contact
An ad that’s interactive
Ad that offerscoupon/promotion
Simple text adsAd that’s locallyrelevant to me
4%8%
14%15%
55%59%
72%73%
7%8%13%
16%
52%
65%69%70%
13
The xAd/Telmetrics Mobile Path to Purchase Study
TERMINOLOGYMobile Application/App: mobile content portal which does not require access via a mobile browser, though does still require internet access to reach.
Mobile Website/WAP: mobile content source accessible via a mobile browser such as Google or Safari, which requires internet access to reach. Desktop-accessible websites visited with a smartphone are then called mobile websites.
Mobile Property: for the sake of this report, this refers to a combination of both applications and mobile websites - as many large brands and businesses often have both available to consumers.
Brand Application/App: mobile content portal specific to a brand or organization - such as Delta or JetBlue.
Brand Website: mobile content source specific to a brand or organization, such as Delta.com or JetBlue.com, reachable via a mobile browser.
Utility/Multi-Category Application/App: mobile content portal which aggregates information from a number of other content sources and provides that information in an all-in-one mobile tool. These include Priceline, Travelocity and the like.
Utility/Multi-Category Website: mobile content source which aggregates information from a number of other content sources and provides that information in an all-in-one mobile tool, reachable via a mobile browser. These include Priceline.com, Travelocity.com and the like.
Local Directory Application/App: mobile content portal where users can search for businesses and information regarding a specific location. These include Yodle, SuperPages, and the like.
Local Directory Website: mobile content source where users can search for businesses and information regarding a specific location, reachable via a mobile browser. These include Yellowpages.com, Local.Yahoo.com or the like.
Navigation Application/App: mobile content portal where users can search for information regarding a specific location, including map and driving directions, turn-by-turn navigation, and local points of interest. These include VZNavigator, Google Maps, and the like.
Navigation Website: mobile content source where users can search for information regarding a specific location, including map and driving directions, and local points of interest, reachable via a mobile browser. These include Mapquest.com, HopStop.com or the like.
SUMMARYSimilar to other recent studies, the activities conducted by smartphone and tablet users can vary greatly. This is largely due to the unique characteristics of mobile devices including their size and portability, as well as the functional variety from mobile web and app usage, to click-to-call. These differences influence exactly where smartphones and tablets are commonly utilized, whether at home, work, or on the go. From these differences in usage location, a variety of different intensions and activities are revealed. The smartphone is favored for local info and navigation, while the tablet is typically used for more leisure research and browsing. But an important trend occurring alongside the growth of smartphone use is the utilization of handheld devices for the same long-tail research commonly assumed to occur only on desktop computers. This study revealed that for Travel needs, the smartphone is not just a tool meant for quick, impulse info and decision making, but that it’s also utilized as part of a longer and more informed mobile path to purchase. These insights reveal the wider scope of opportunity available to mobile marketers via smartphones and tablets.
STUDY METHODOLOGYThe xAd/Telmetrics Mobile Path to Purchase Study was conducted in conjunction with Nielsen. The results are based on data from an online survey of 1,500 U.S. smartphone and tablet users, as well as and actual observed consumer behaviors from Nielsen’s Smartphone Analytics Panel of 6,000 Apple and Android users. Data from Nielsen’s Smartphone Analytics panel is included to supplement the survey results. Survey respondent totals are as follows (none of which are mutually exclusive): • Smartphone owners: 1,371 • Tablet owners: 738 • Restaurant users: 1,413 • Travel users: 931 • Automotive users: 674
The xAd/Telmetrics Mobile Path to Purchase Study
14
ABOUT THIS REPORT xAd and long-time partner Telmetrics joined to produce this proprietary study designed to better understand mobile activity among Travel, Restaurant, and Automotive users with the goal of more effectively reaching these industry consumers with mobile search and display advertising. As the first report published from this multi-category research project, it focuses on mobile user behavior related to the Travel category.
Additional study details and findings can be found at www.MobilePathtoPurchase.com. For questions or to provide feedback, please contact us at 415.814.9837 or [email protected].
ABOUT XAD Since 2009, xAd has grown to become one of the largest mobile advertising networks in the U.S. and the only one offering the ability to target ads using a combination of accurate location signal and search context. Across its network, xAd aggregates and manages billions of monthly ad impressions from which it derives the largest supply of location based advertising inventory in the market. For over a million national and local advertisers, xAd delivers targeted mobile location@scale. xAd is based in New York City with several satellite offices across the U.S and Internationally. For more information, visit xAd.com.
ABOUT TELMETRICSFor more than 20 years, Telmetrics has been the call measurement industry leader. Telmetrics’ call tracking solutions, which are available in North America and across Europe, enable marketers to evaluate consumer phone response to ads by providing valuable ad feedback and consumer call intelligence. With greater visibility into advertising performance across all media channels—digital, mobile, print and more—media publishers, agencies and advertisers can optimize the media mix for higher quality lead generation, resulting in increased revenues and a more complete picture of ROI across converging media. For more information, visit Telmetrics.com.
ABOUT NIELSENNielsen Holdings N.V. (NYSE: NLSN) is a global information and measurement company with leading market positions in marketing and consumer information, television and other media measurement, online intelligence, mobile measurement, trade shows and related properties. Nielsen has a presence in approximately 100 countries, with headquarters in New York, USA and Diemen, the Netherlands.