mitigating climate change sources and sinks of atmospheric co2 emissions trading historical and...
Post on 20-Dec-2015
221 views
TRANSCRIPT
Mitigating Climate Mitigating Climate ChangeChange
Sources and sinks of atmospheric CO2
Emissions trading
Historical and projected CO2 emissions
Climate wedges
Alternative energy
“Scientists are necessary, but not sufficient to solve the climate problem”
“Scientists are necessary, but not sufficient to solve the climate problem”
Dr. Ralph Cicerone, President of the National Academy of Science, November 2007Dr. Ralph Cicerone, President of the National Academy of Science, November 2007
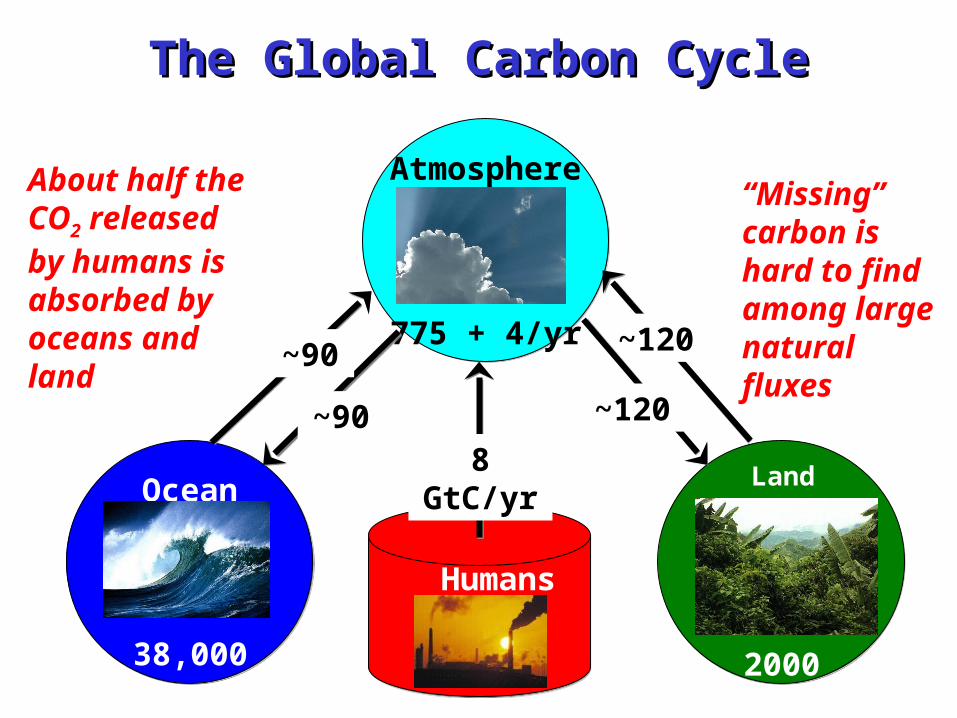
The Global Carbon CycleThe Global Carbon Cycle
Humans
Atmosphere
775 + 4/yr
Ocean
38,000
Land
2000
~90
~120
~120
8 GtC/yr
~90
About half the CO2 released by humans is absorbed by oceans and land
“Missing” carbon is hard to find among large natural fluxes
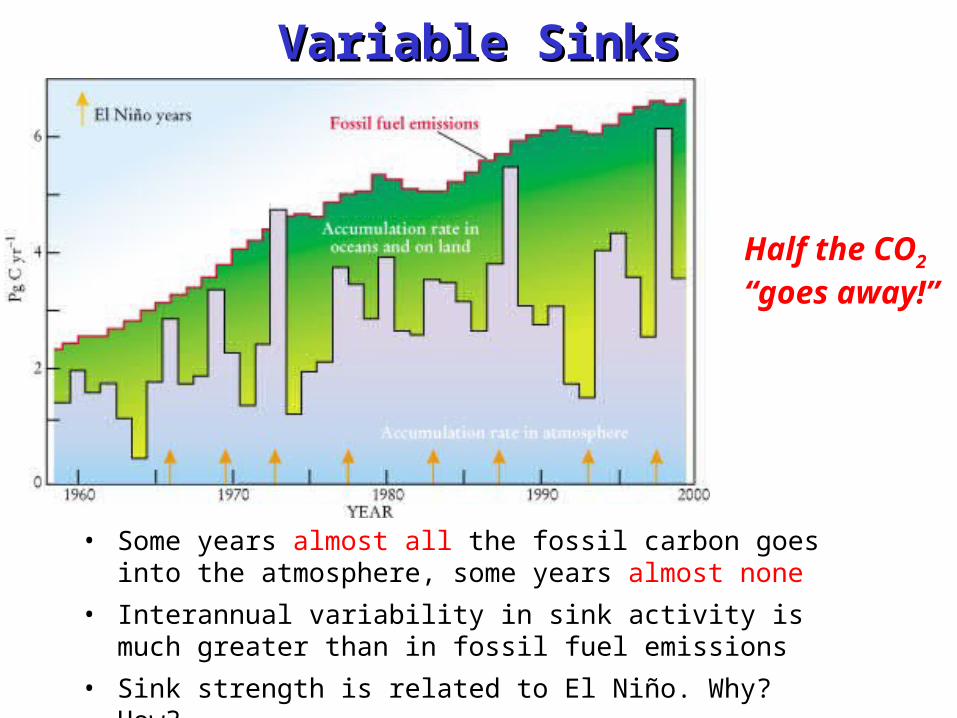
Variable SinksVariable Sinks
Half the CO2 “goes away!”
• Some years almost all the fossil carbon goes into the atmosphere, some years almost none
• Interannual variability in sink activity is much greater than in fossil fuel emissions
• Sink strength is related to El Niño. Why? How?

European Climate ExchangeEuropean Climate ExchangeFutures Trading: Permits to Emit CO2Futures Trading: Permits to Emit CO2
• European “cap-and-trade” market set up as described in Kyoto Protocol (http://www.europeanclimateexchange.com)
• 7/10/2009 price €16.19/ton of CO2 emitted 12/2012 = $83.25/ton of Carbon
• Supply and demand!
ECX CFI Futures Contracts: Price and Volume
0
2,000,000
4,000,000
6,000,000
8,000,000
10,000,000
12,000,000
2/7/102/28/103/21/104/11/105/4/105/25/106/16/107/7/107/28/108/18/109/8/109/29/1010/20/1011/10/1012/1/1012/22/1016/01/201106/02/201127/02/201120/03/201111/04/201102/05/201123/05/201113/06/201104/07/2011
VOLUME (tonnes CO2)
0.00
5.00
10.00
15.00
20.00
25.00
30.00
35.00
Price per tonne (EUR)
Total VolumeDec07 SettDec08 Sett
Present Value of Carbon SinksPresent Value of Carbon Sinks• Terrestrial and marine exchanges currently
remove more than 4 GtC per year from the atmosphere
• This free service provided by the planet constitutes an effective 50% emissions reduction, worth about $325 Billion per year at today’s price on the ECX!
• Carbon cycle science is currently unable to quantitatively account for – The locations at which these sinks operate– The mechanisms involved– How long the carbon will remain stored – How long the sinks will continue to operate– Whether there is anything we can do to make them
work better or for a longer time
Where Has All the Carbon Where Has All the Carbon Gone?Gone?
• Into the oceansoceans– Solubility pump (CO2 very soluble in cold water, but
rates are limited by slow physical mixing)– Biological pump (slow “rain” of organic debris)
• Into the landland– CO2 Fertilization
(plants eat CO2 … is more better?)– Nutrient fertilization
(N-deposition and fertilizers)– Land-use change
(forest regrowth, fire suppression, woody encroachment … but what about Wal-Marts?)
– Response to changing climate (e.g., Boreal warming)
Coupled Carbon-Climate Coupled Carbon-Climate ModelingModeling
• “Earth System” Climate Models– Atmospheric GCM– Ocean GCM with biology and chemistry– Land biophysics, biogeochemistry, biogeography
• Prescribe fossil fuel emissions, rather than CO2 concentration as usually done
• Integrate model from 1850-2100, predicting both CO2 and climate as they evolve
• Oceans, plants, and soils exchange CO2 with model atmosphere
• Climate affects ocean circulation and terrestrial biology, thus feeds back to carbon cycle

• Coupled simulations of climate and the carbon cycle
• Given nearly identical human emissions, different models project dramatically different futures!
Land
Ocean
Atmosphere 30
0 pp
m!
Carbon-Climate FuturesCarbon-Climate FuturesFriedlingstein et al (2006)Friedlingstein et al (2006)
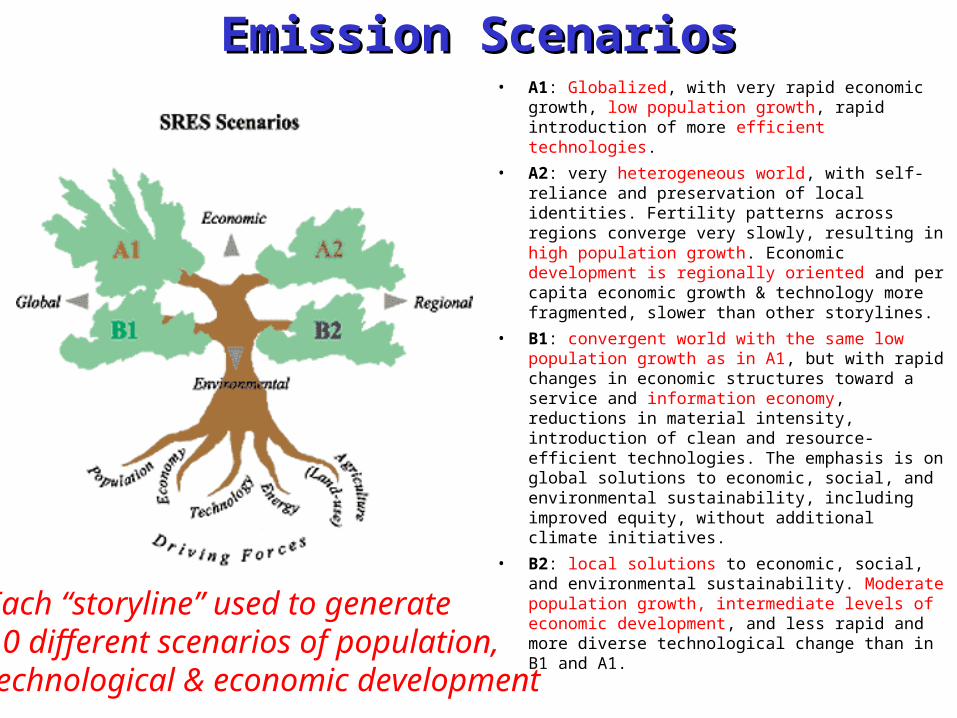
Emission ScenariosEmission Scenarios• A1: Globalized, with very rapid economic
growth, low population growth, rapid introduction of more efficient technologies.
• A2: very heterogeneous world, with self-reliance and preservation of local identities. Fertility patterns across regions converge very slowly, resulting in high population growth. Economic development is regionally oriented and per capita economic growth & technology more fragmented, slower than other storylines.
• B1: convergent world with the same low population growth as in A1, but with rapid changes in economic structures toward a service and information economy, reductions in material intensity, introduction of clean and resource-efficient technologies. The emphasis is on global solutions to economic, social, and environmental sustainability, including improved equity, without additional climate initiatives.
• B2: local solutions to economic, social, and environmental sustainability. Moderate population growth, intermediate levels of economic development, and less rapid and more diverse technological change than in B1 and A1.
Each “storyline” used to generate10 different scenarios of population,technological & economic development
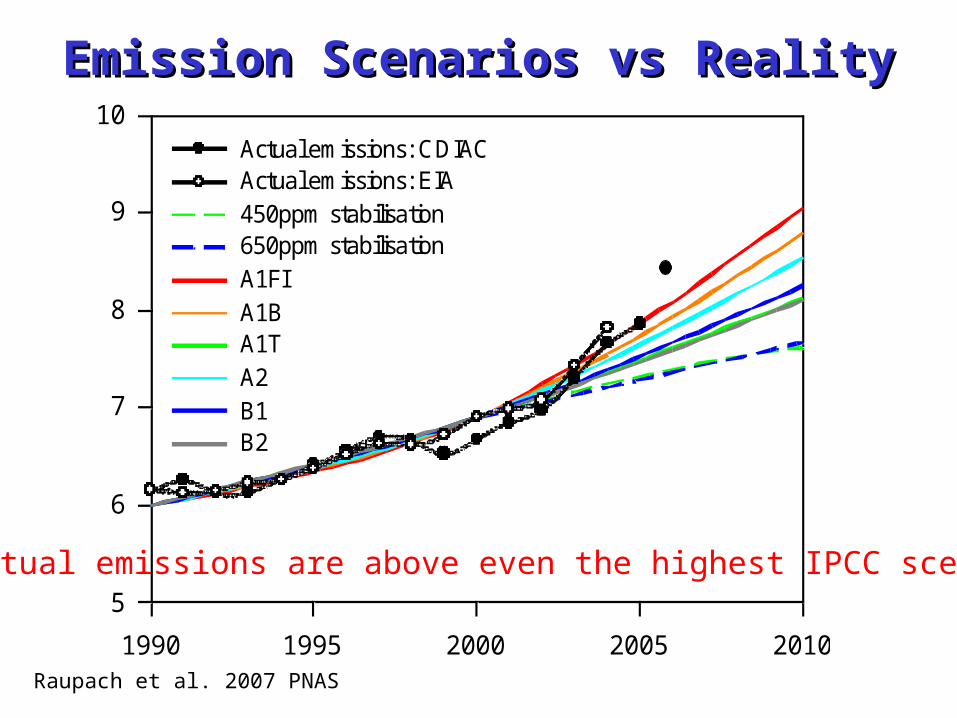
Emission Scenarios vs RealityEmission Scenarios vs Reality
Recent emissions
1990 1995 2000 2005 2010
5
6
7
8
9
10Actual emissions: CDIACActual emissions: EIA450ppm stabilisation650ppm stabilisationA1FI A1B A1T A2 B1 B2
1850 1900 1950 2000 2050 2100
0
5
10
15
20
25
30Actual emissions: CDIAC450ppm stabilisation650ppm stabilisationA1FI A1B A1T A2 B1 B2
Raupach et al. 2007 PNAS
Actual emissions are above even the highest IPCC scenarios
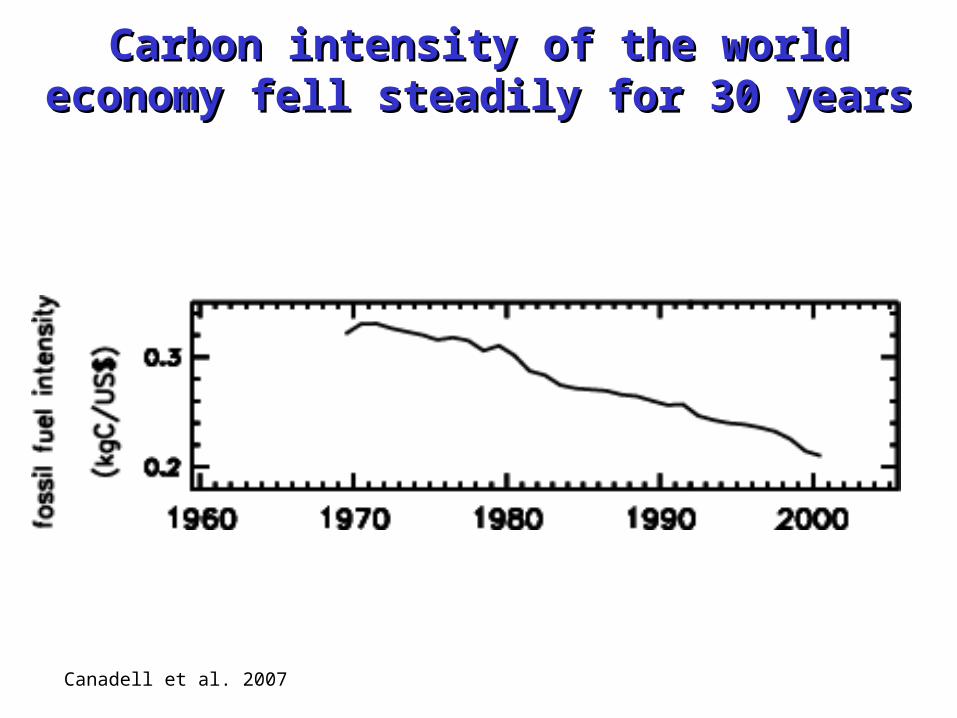
Carbon intensity of the world Carbon intensity of the world economy fell steadily for 30 yearseconomy fell steadily for 30 years
Canadell et al. 2007
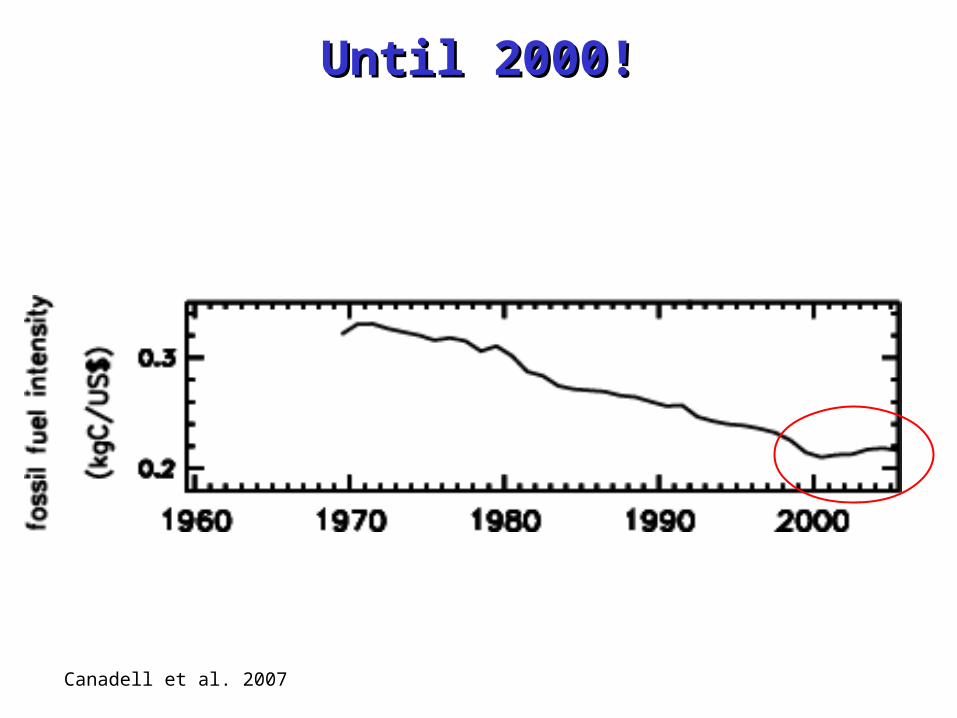
Until 2000!Until 2000!
Canadell et al. 2007

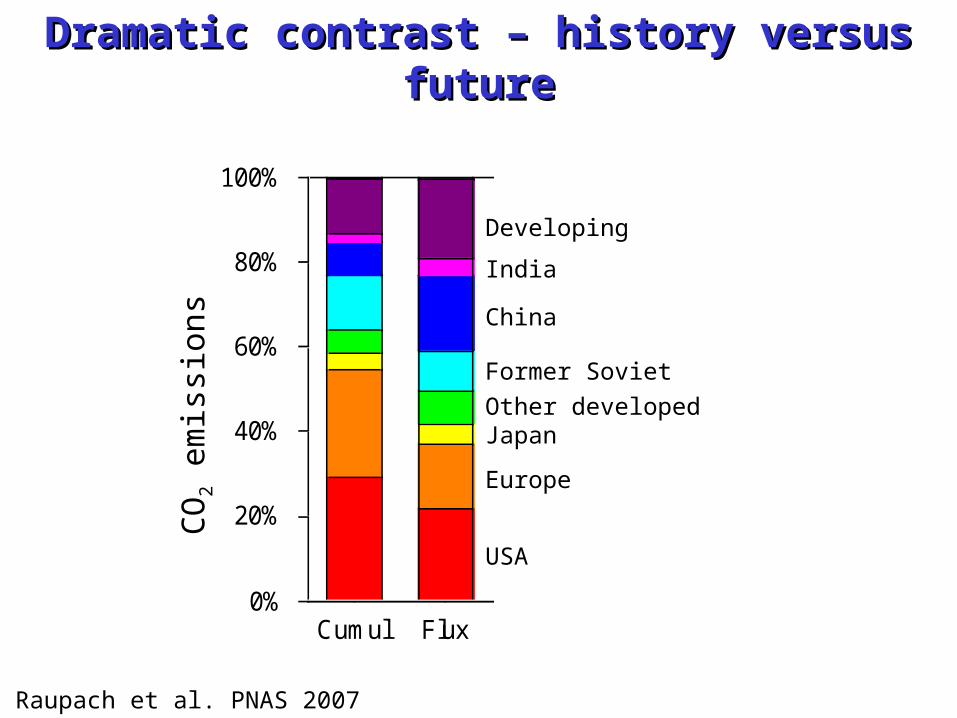
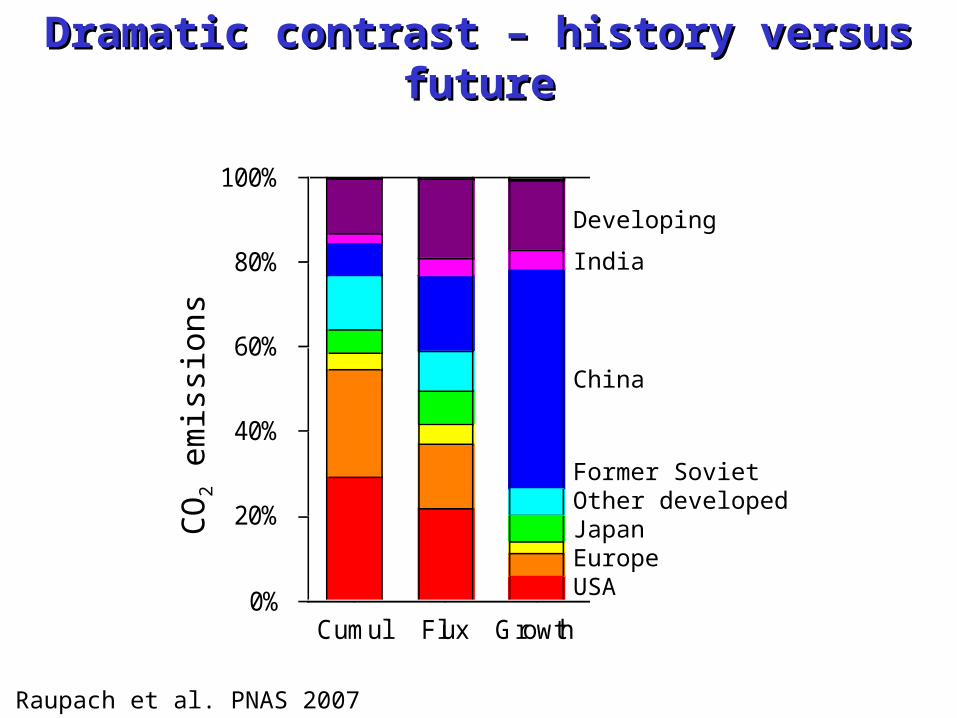
Dramatic contrast – history versus Dramatic contrast – history versus futurefuture
Cumul Flux Growth Pop0%
20%
40%
60%
80%
100%D3
India
D2
China
FSUD1
JapanEUUSA
CO
2 e
mis
sion
sDevelopingIndiaChina
Former SovietOther developedJapan
Europe
USA
Cumulative
Raupach et al. PNAS 2007
Cumul Flux Growth Pop0%
20%
40%
60%
80%
100%D3
India
D2
China
FSUD1
JapanEUUSA
CO
2 e
mis
sion
sDeveloping
India
China
Former Soviet
Other developedJapan
Europe
USA
Dramatic contrast – history versus Dramatic contrast – history versus futurefuture
Raupach et al. PNAS 2007
Cumul Flux Growth Pop0%
20%
40%
60%
80%
100%D3
India
D2
China
FSUD1
JapanEUUSA
CO
2 e
mis
sion
sDeveloping
India
China
Former SovietOther developedJapanEuropeUSA
Dramatic contrast – history versus Dramatic contrast – history versus futurefuture
Raupach et al. PNAS 2007
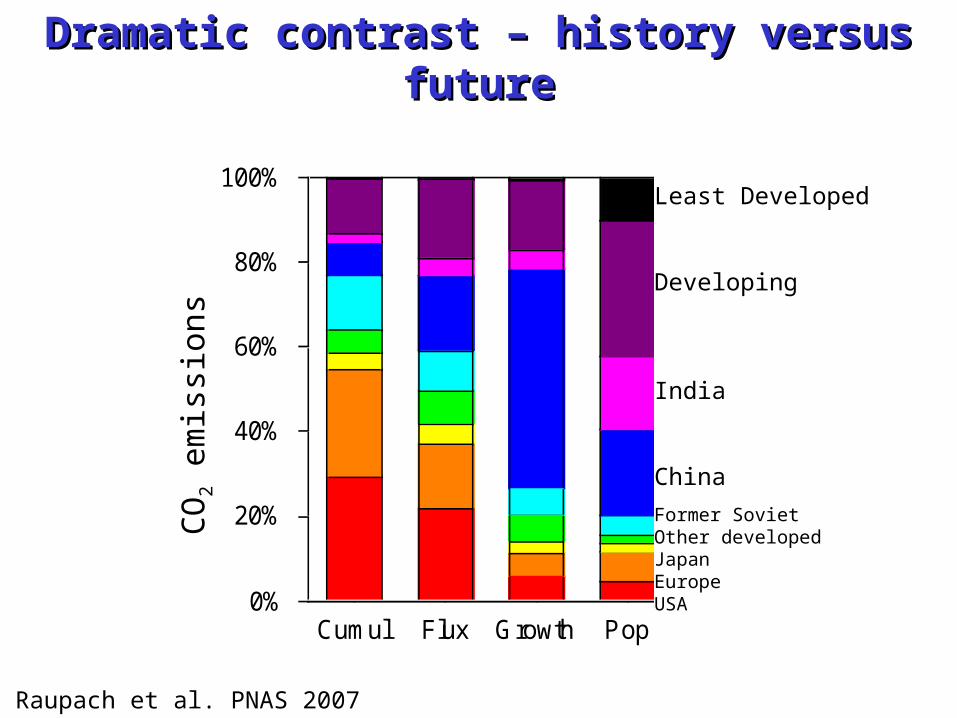
Cumul Flux Growth Pop0%
20%
40%
60%
80%
100%D3
India
D2
China
FSUD1
JapanEUUSA
CO
2 e
mis
sion
sLeast Developed
Developing
India
China
Former SovietOther developedJapanEuropeUSA
Dramatic contrast – history versus Dramatic contrast – history versus futurefuture
Raupach et al. PNAS 2007

2 2 = 4 billion tons go out
Ocean Land Biosphere (net)
Fossil FuelBurning
+
8
800billion tons carbon
4billion
tons go in
ATMOSPHERE
billion tons added every year
COCO22 “Budget” of the “Budget” of the AtmosphereAtmosphere
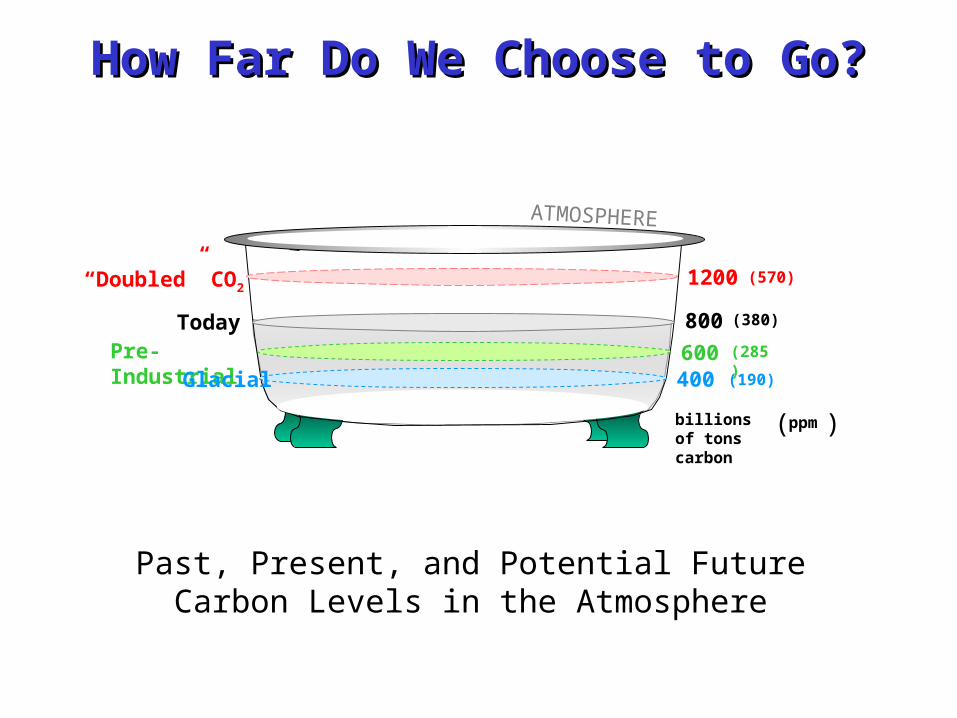
Billions of tons of carbon
“Doubled” CO2
TodayPre-Industrial
Glacial
800
1200
600400
billions of tons carbon
ATMOSPHERE
( ppm)
(570)
(380)
(285)
(190)
Past, Present, and Potential FutureCarbon Levels in the Atmosphere
How Far Do We Choose to Go?How Far Do We Choose to Go?

Billions of Tons Carbon Emitted per Year
Historical emissions
0
8
16
1950 2000 2050 2100
Historical EmissionsHistorical Emissions
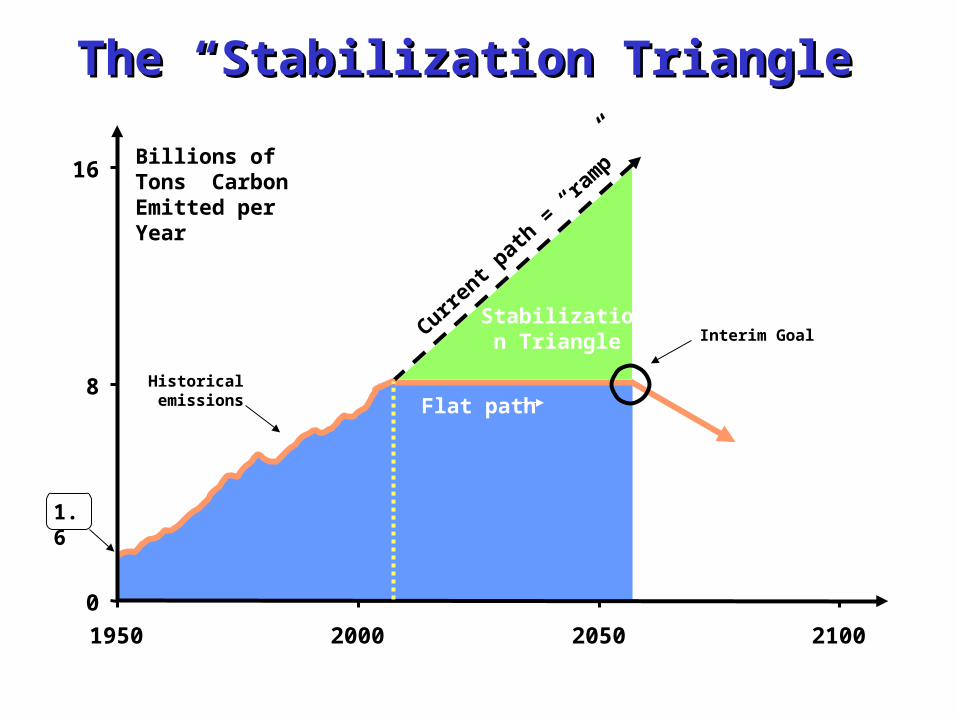
1.6
Interim Goal
Billions of Tons Carbon Emitted per Year
Current p
ath =
“ram
p”
Historical emissions Flat path
Stabilization Triangle
0
8
16
1950 2000 2050 2100
The “Stabilization Triangle”The “Stabilization Triangle”
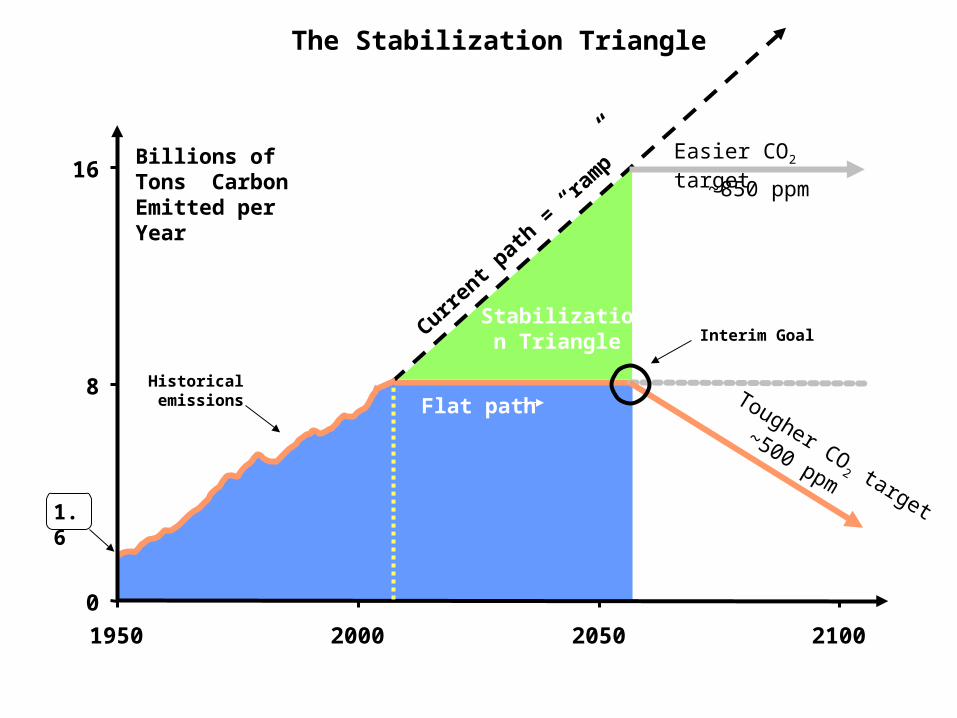
1.6
Interim Goal
Billions of Tons Carbon Emitted per Year
Current p
ath =
“ram
p”
Historical emissions Flat path
Stabilization Triangle
0
8
16
1950 2000 2050 2100
The Stabilization Triangle
Tougher CO2 target
~500 ppm
~850 ppm
Easier CO2 target
1.6
Billions of Tons Carbon Emitted per Year
Current p
ath =
“ram
p”
Historical emissions Flat path
0
8
16
1950 2000 2050 2100
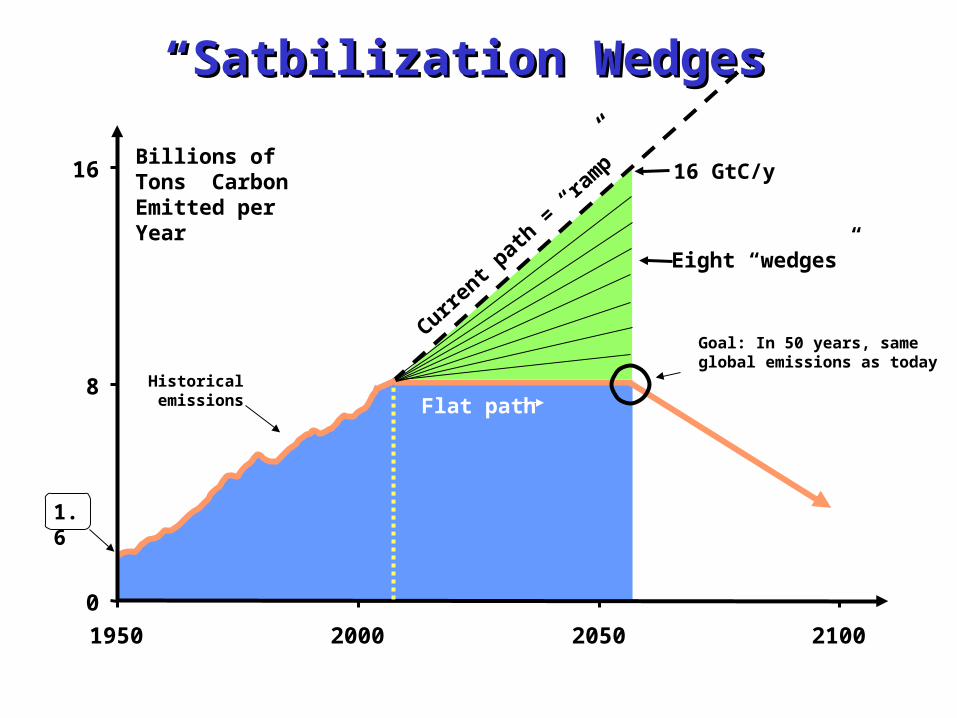
16 GtC/y
Eight “wedges”
Goal: In 50 years, sameglobal emissions as today
““Satbilization Wedges”Satbilization Wedges”
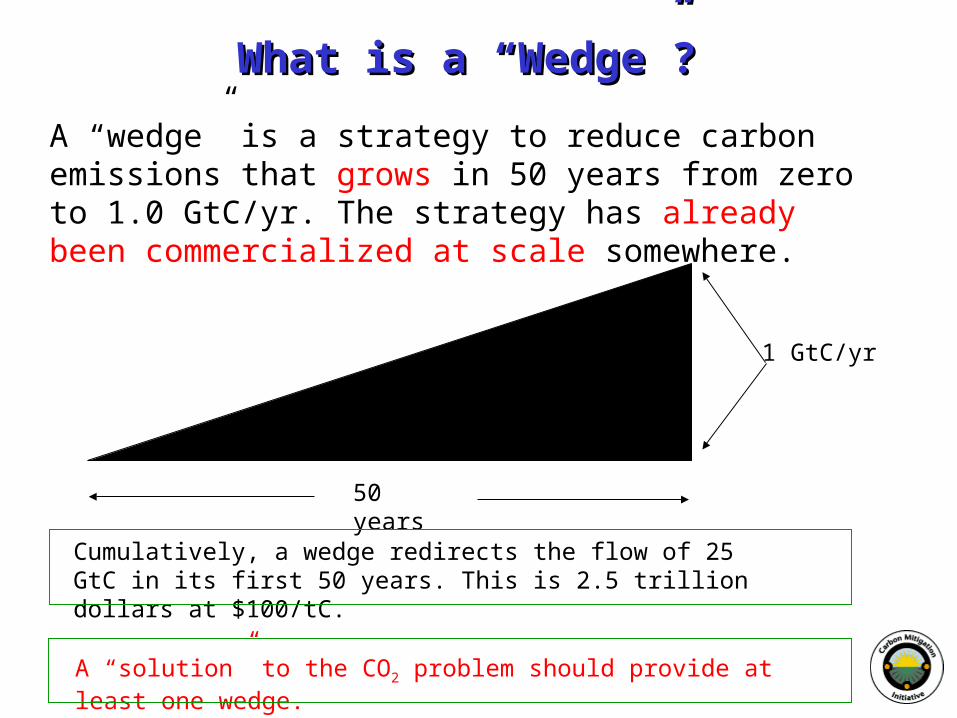
What is a “Wedge”?What is a “Wedge”?
A “wedge” is a strategy to reduce carbon emissions that grows in 50 years from zero to 1.0 GtC/yr. The strategy has already been commercialized at scale somewhere.
1 GtC/yr
50 years
Total = 25 Gigatons carbon
Cumulatively, a wedge redirects the flow of 25 GtC in its first 50 years. This is 2.5 trillion dollars at $100/tC.
A “solution” to the CO2 problem should provide at least one wedge.
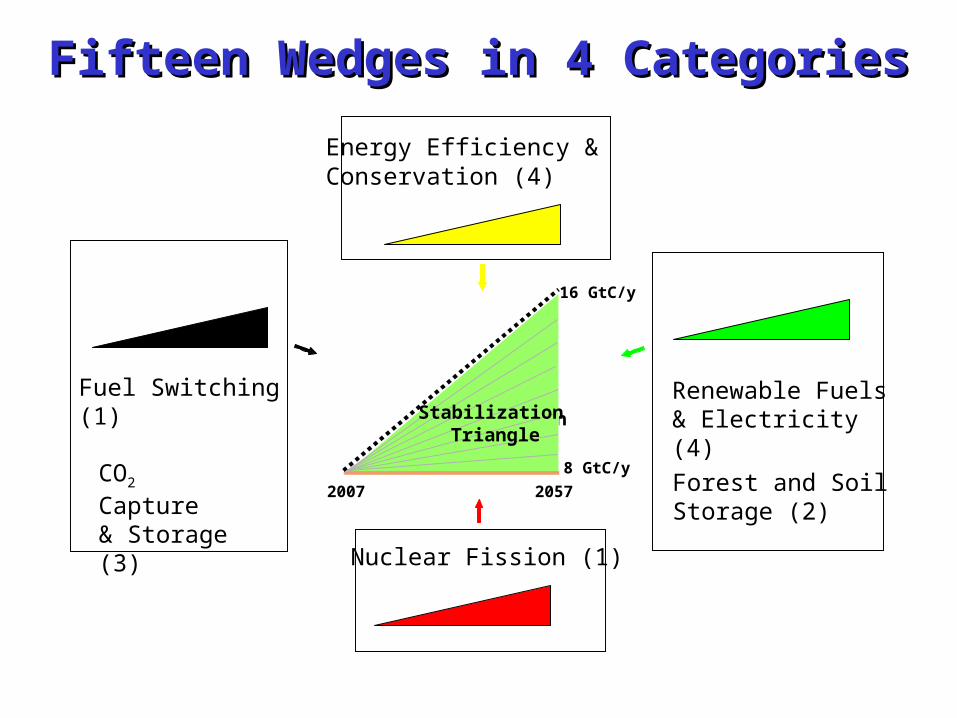
Energy Efficiency & Conservation (4)
CO2 Capture & Storage (3)
Stabilization Triangle
Renewable Fuels& Electricity (4)
Forest and Soil Storage (2)
Fuel Switching(1)
Nuclear Fission (1)
2007 2057
8 GtC/y
16 GtC/y
TriangleStabilization
Fifteen Wedges in 4 CategoriesFifteen Wedges in 4 Categories
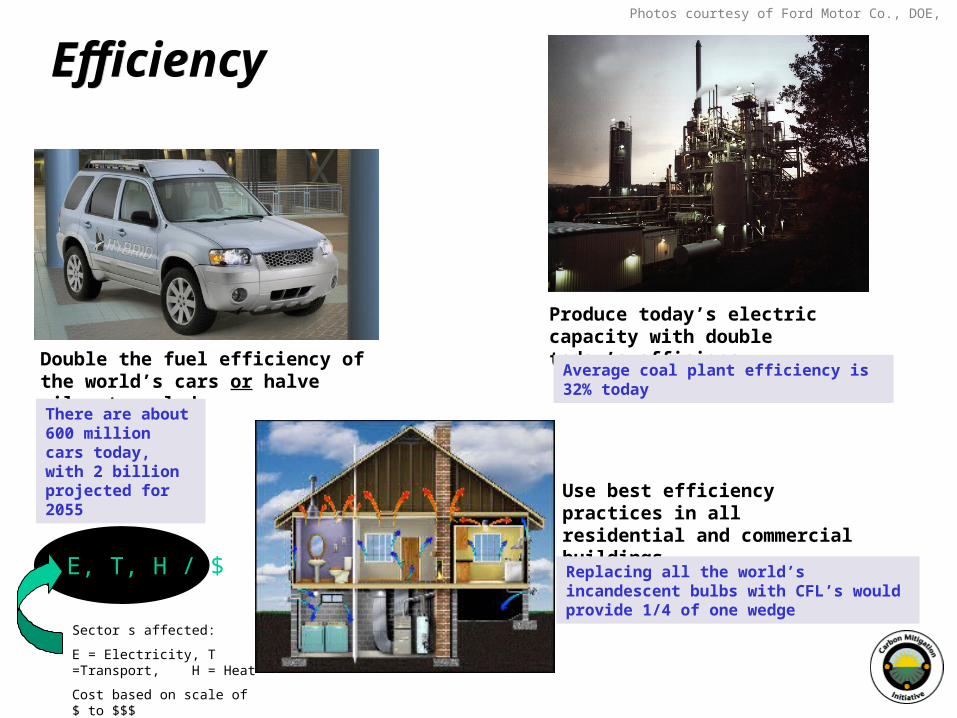
Double the fuel efficiency of the world’s cars or halve miles traveled
Produce today’s electric capacity with double today’s efficiency
Use best efficiency practices in all residential and commercial buildings
Replacing all the world’s incandescent bulbs with CFL’s would provide 1/4 of one wedge
EfficiencyEfficiency
There are about 600 million cars today, with 2 billion projected for 2055
Average coal plant efficiency is 32% today
E, T, H / $
Photos courtesy of Ford Motor Co., DOE, EPA
Sector s affected:
E = Electricity, T =Transport, H = Heat
Cost based on scale of $ to $$$

Substitute 1400 natural gas electric plants for an equal number of coal-fired facilities
A wedge requires an amount of natural gas equal to that used for all purposes today
Fuel SwitchingFuel Switching
Photo by J.C. Willett (U.S. Geological Survey).
E, H / $
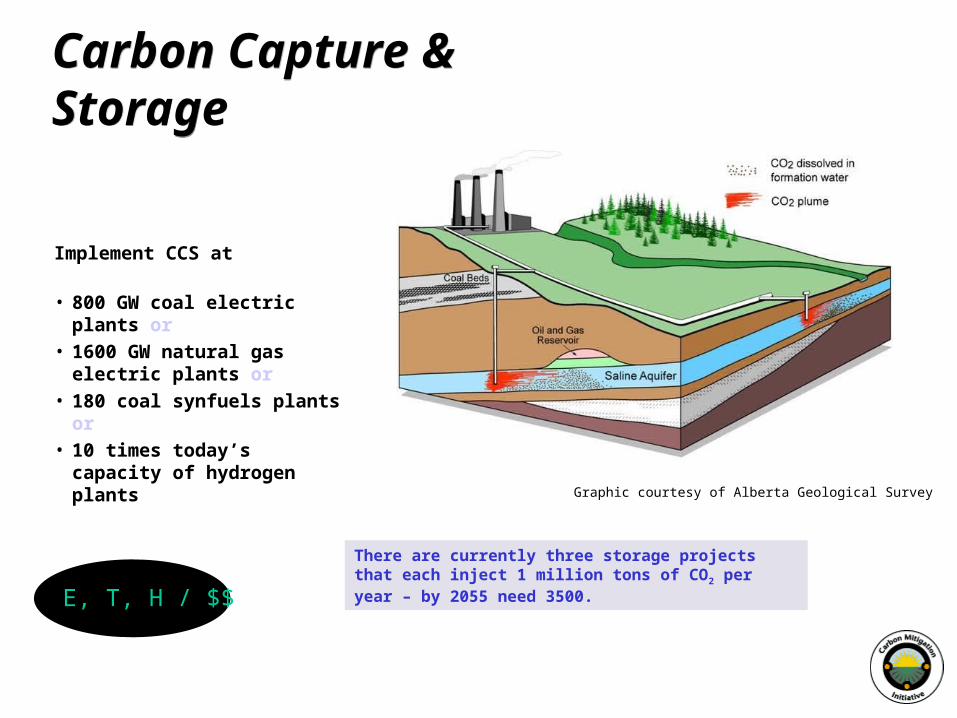
Implement CCS at
• 800 GW coal electric plants or• 1600 GW natural gas electric
plants or• 180 coal synfuels plants or• 10 times today’s capacity of
hydrogen plants
Graphic courtesy of Alberta Geological Survey
Carbon Capture & StorageCarbon Capture & Storage
There are currently three storage projects that each inject 1 million tons of CO2 per year – by 2055 need 3500.
E, T, H / $$

Triple the world’s nuclear electricity capacity by 2055
Nuclear ElectricityNuclear Electricity
Graphic courtesy of NRC
The rate of installation required for a wedge from electricity is equal to the global rate of nuclear expansion from 1975-1990.
E/ $$
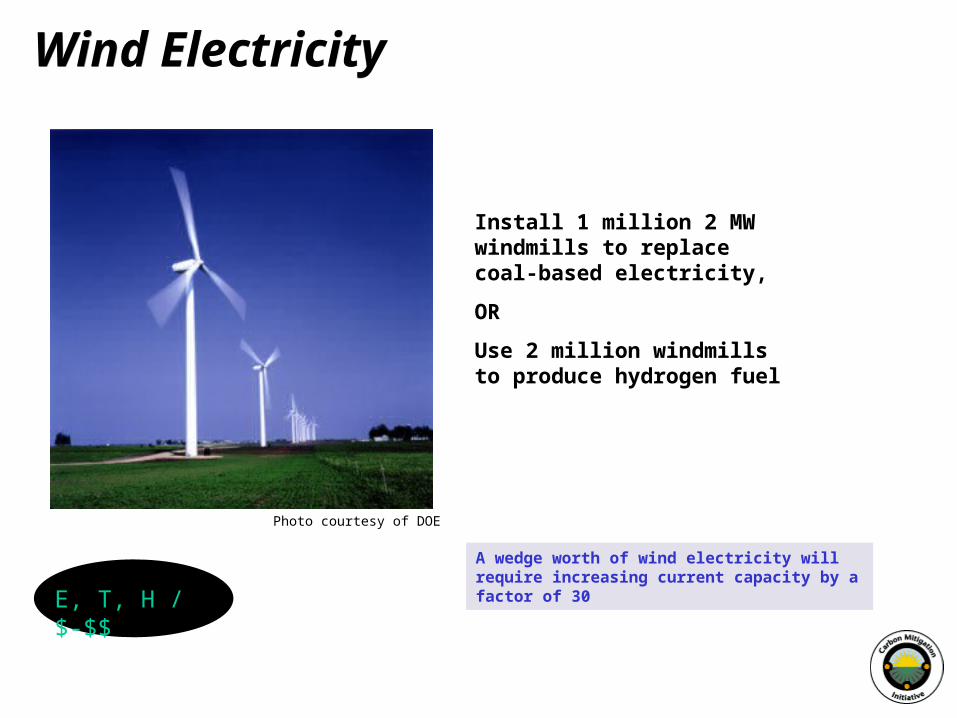
Wind ElectricityWind Electricity
Install 1 million 2 MW windmills to replace coal-based electricity,
OR
Use 2 million windmills to produce hydrogen fuel
Photo courtesy of DOE
A wedge worth of wind electricity will require increasing current capacity by a factor of 30
E, T, H / $-$$
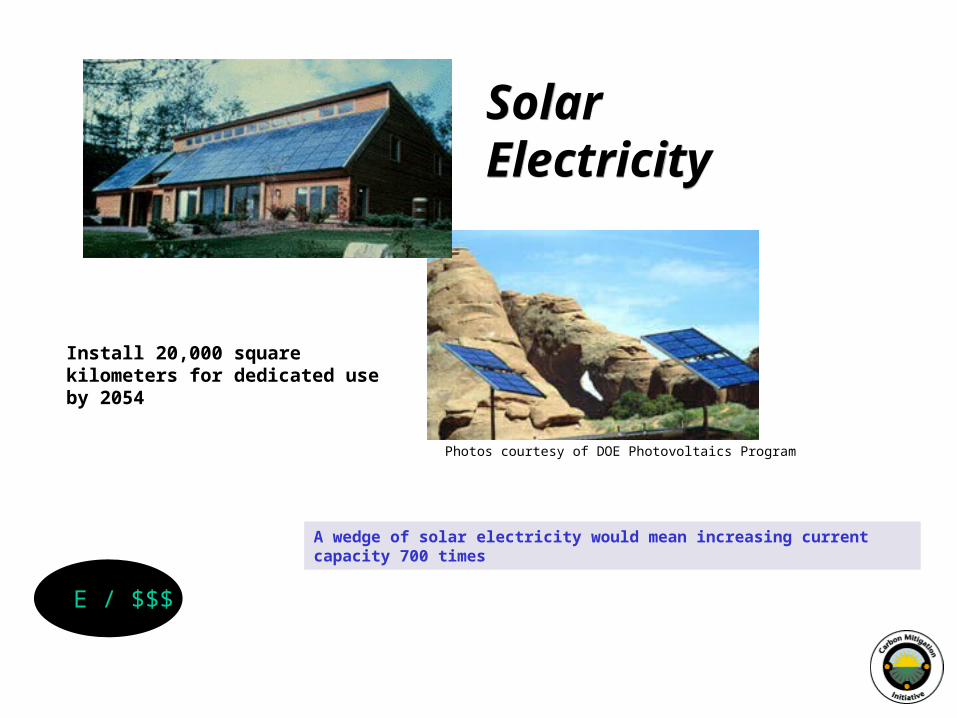
Solar ElectricitySolar Electricity
Photos courtesy of DOE Photovoltaics Program
Install 20,000 square kilometers for dedicated use by 2054
A wedge of solar electricity would mean increasing current capacity 700 times
E / $$$
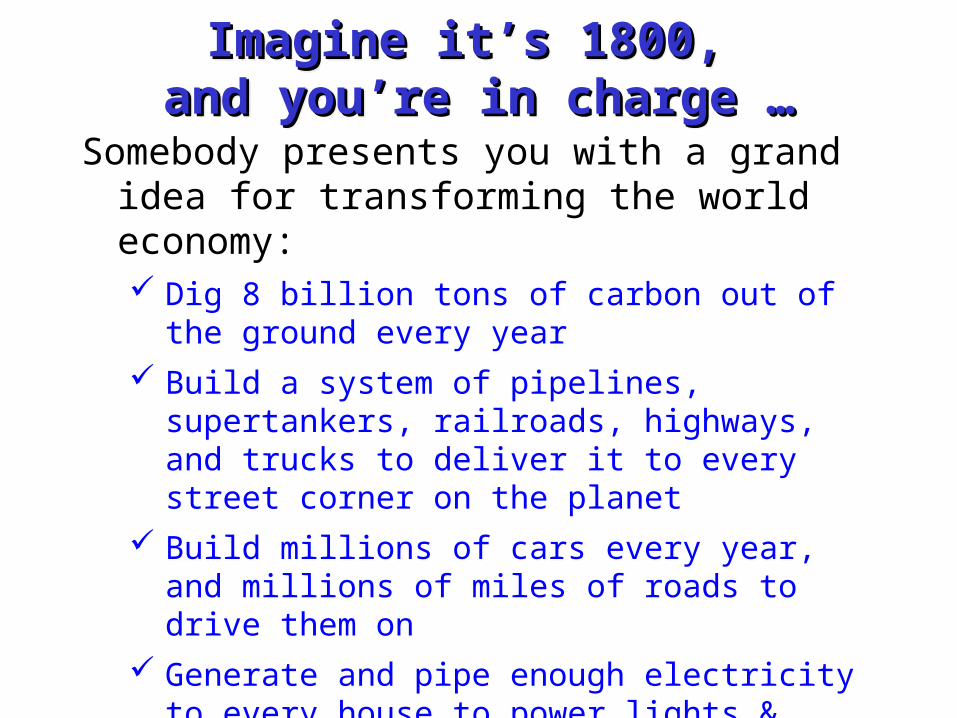
Imagine it’s 1800, Imagine it’s 1800, and you’re in charge …and you’re in charge …
Imagine it’s 1800, Imagine it’s 1800, and you’re in charge …and you’re in charge …
Somebody presents you with a grand idea for transforming the world economy: Dig 8 billion tons of carbon out of the
ground every year Build a system of pipelines, supertankers,
railroads, highways, and trucks to deliver it to every street corner on the planet
Build millions of cars every year, and millions of miles of roads to drive them on
Generate and pipe enough electricity to every house to power lights & stereos & plasma TVs
… “and here’s the itemized bill …”

Thinking about CostsThinking about CostsThinking about CostsThinking about Costs
• Our global society built that very system
• We didn’t go broke building it …
• We got rich beyond the avarice of kings!
• Now we have to do it again!
• How?
Putting a Price on Carbon Putting a Price on Carbon EmissionsEmissions
Putting a Price on Carbon Putting a Price on Carbon EmissionsEmissions
• A new industrial revolution won’t happen because people want to “do the right thing”
• The government can’t just pass a law and create a new global energy economy, any more than they could 200 years ago
• If low-carbon-footprint goods and services cost less than “dirtier” ones, people will buy them
• The role of policy is to provide incentives, to put a price on carbon!
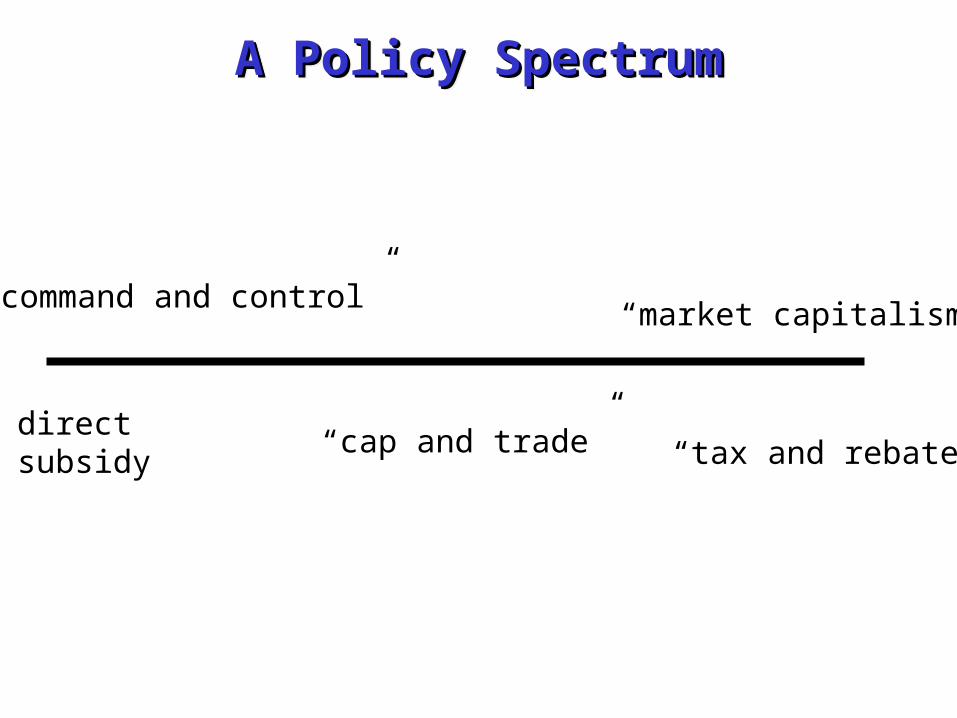
A Policy SpectrumA Policy SpectrumA Policy SpectrumA Policy Spectrum
direct subsidy
“cap and trade” “tax and rebate”
“command and control”“market capitalism”

ConclusionsConclusionsConclusionsConclusions• Rising levels of CO2 will cause significant
climate change in the 21st century and far beyond
• The only way to mitigate these changes is to stop burning coal, oil, and gas
• This can feasibly be done using today’s technology, but requires tremendous will
• Solving the climate problem will require a new industrial revolution
• Dealing with this problem will be a major theme of history for centuries to come