minnesota watermarks - university of california, davis · pdf fileminnesota watermarks gauging...
TRANSCRIPT

M I N N E S O T A
w a t e r m a r k sg a u g i n g t h e f l o w o f p r o g r e s s 2 0 0 0 – 2 0 1 0
E N V I R O N M E N T A L Q U A L I T Y B O A R D
. . .
. . .
. . .
. . .
. . .
. . .
. . .
. . .
. . .
. . .
. . .
. . .
. . .
. . .
. . .
. . .
. . .
. . .
. . .
. . .
. . .
. .
. . .
. . .
. . .
. . .
. . .
. . .
. . .
. . .
. . .
. . .
. . .
. . .
. . .
. . .
. . .
. . .
. . .
. . .
. . .
. . .
. .
. . .
. . .
. . .
. . .
. . .
. . .
. . .
. . .
. . .
. . .
. . .
. . .
. . .
. . .
. . .
. . .
. . .
. . .
. . .
. . .
. . .
. .
. . .
. . .
. . .
. . .
. . .
. . .
. . .
. . .
. . .
. . .
. . .
. . .
. . .
. . .
. . .
.
. . . . . . . . . . . . . . . . . . . . . . . . . . . . . . . . . . . . . . . . . . . . . . . . . . . . . . . . . . . . . . . . . . . . . . . . . . . . . . . . . . . . . . . . . . . . . . . . . . . . . . . . . . . . . . . . . . . . . . . . . . . . . . . . . . . . . . . . . . . . . . . . . . . . . . . . . . . . . . . . . . . . . . . . . . . . . . . . . . . . . . . . . . . . . . .
Minnesota Watermarks: Gauging the Flow of Progress 2000 –2010 was produced by the EQB Water Resources Committeewith assistance from the Water Management Unification TaskForce, the basin teams and many others. It was prepared bycommittee director Marilyn Lundberg at Minnesota Planning.Minnesota Watermarks was approved by the EnvironmentalQuality Board at its September 2000 meeting and fulfills therequirement in Minnesota Statutes 103B.151 for a 10-yearMinnesota water plan.
The report is the culmination of an 18-month interagencyprocess to set a new direction for water management inMinnesota. Organizations participating include: the Board ofWater and Soil Resources; the Metropolitan Council; theMinnesota departments of Agriculture, Health and NaturalResources; the Minnesota Geological Survey; MinnesotaPlanning; the Minnesota Rivers Council; the Pollution ControlAgency; the River Defense Network; the U.S. Department ofAgriculture Natural Resources Conservation Service; the U.S.Geological Survey and the University of Minnesota WaterResources Center. The Office of Dispute Resolution providedfacilitation. The seven newly formed Basin Teams involvednumerous other organizations and citizens. The cost to designand print this report was $8,000.
Upon request, Minnesota Watermarks will be made available inan alternative format, such as Braille, large print or audio tape.For TTY, contact Minnesota Relay Service at 800-627-3529 andask for Minnesota Planning.
Minnesota Planning is a state agency charged with developing along-range plan for the state, stimulating public participation inMinnesota’s future and coordinating activities with stateagencies, the Legislature and other units of government.
The Environmental Quality Board, staffed by MinnesotaPlanning, draws together five citizens and the heads of 10 stateagencies that play a vital role in Minnesota’s environment anddevelopment. The board develops policy, creates long-rangeplans and reviews proposed projects that would significantlyinfluence Minnesota’s environment.
Additional copies of this report are available on the Internet(www.mnplan.state.mn.us) or by contacting MinnesotaPlanning.
September 2000
Room 300658 Cedar StreetSt. Paul, MN 55155www.mnplan.state.mn.us651-296-3985
MINNESOTA PLAN N I NG E N V I R O N M E N T A L Q U A L I T Y B O A R D
M I N N E S O T A
w a t e r m a r k sg a u g i n g t h e f l o w o f p r o g r e s s 2 0 0 0 – 2 0 1 0
Summary ............................................................................................................................... 1
Introduction ........................................................................................................................... 3
Common goals and objectives designed to unify efforts ....................................................... 4
Basin conditions and planning approaches vary .................................................................. 13
Lake Superior Basin ............................................................................................................. 19
Minnesota, Missouri and Des Moines River Basins .............................................................. 22
Rainy River Basin ................................................................................................................. 26
Red River Basin .................................................................................................................... 29
Upper Mississippi River Basin .............................................................................................. 32
Lower Mississippi and Cedar River Basins ........................................................................... 35
St. Croix River Basin ............................................................................................................ 38
Going Forward ..................................................................................................................... 42
Glossary ............................................................................................................................... 44
Contributors ........................................................................................................................ 45
. . . . . . . . . . . . . . . . . . . . . . . . . . . . . . . . . . . . . . . . . . . . . . . . . . . . . . . . . . . . . . . . . . . . . . . . . . . . . . . . . . . . . . . . . . . . . . . . . . . . . . . . . . . . . . . . . . . . . . . . . . . . . . . . . . . . . . . . . . . . . . . . . . . . . . . . . . . . . . . . . . . . . . . . . . . .
. . . . . . . . . . . . . . . . . . . . . . . . . . . . . . . . . . . . . . . . . . . . . . . . . . . . . . . . . . . . . . . . . . . . . . . . . . . . . . . . . . . . . . . . . . . . . . . . . . . . . . . . . . . . . . . . . . . . . . . . . . . . . . . . . . . . . . . . . . . . . . . . . . . . . . . . . . . . . . . . . . . . . . . . . . . .
. . .
. . .
. . .
. . .
. . .
. . .
. . .
. . .
. . .
. . .
. . .
. . .
. . .
. . .
. . .
. . .
. . .
. . .
. . .
. . .
. . .
. .
. . .
. . .
. . .
. . .
. . .
. . .
. . .
. . .
. . .
. . .
. . .
. . .
. . .
. . .
. . .
. . .
. . .
. . .
. . .
. . .
. .
. . .
. . .
. . .
. . .
. . .
. . .
. . .
. . .
. . .
. . .
. . .
. . .
. . .
. . .
. . .
. . .
. . .
. . .
. . .
. . .
. . .
. .
. . .
. . .
. . .
. . .
. . .
. . .
. . .
. . .
. . .
. . .
. . .
. . .
. . .
. . .
. . .
.
. . . . . . . . . . . . . . . . . . . . . . . . . . . . . . . . . . . . . . . . . . . . . . . . . . . . . . . . . . . . . . . . . . . . . . . . . . . . . . . . . . . . . . . . . . . . . . . . . . . . . . . . . . . . . . . . . . . . . . . . . . . . . . . . . . . . . . . . . . . . . . . . . . . . . . . . . . . . . . . . . . . . . . . . . . . .
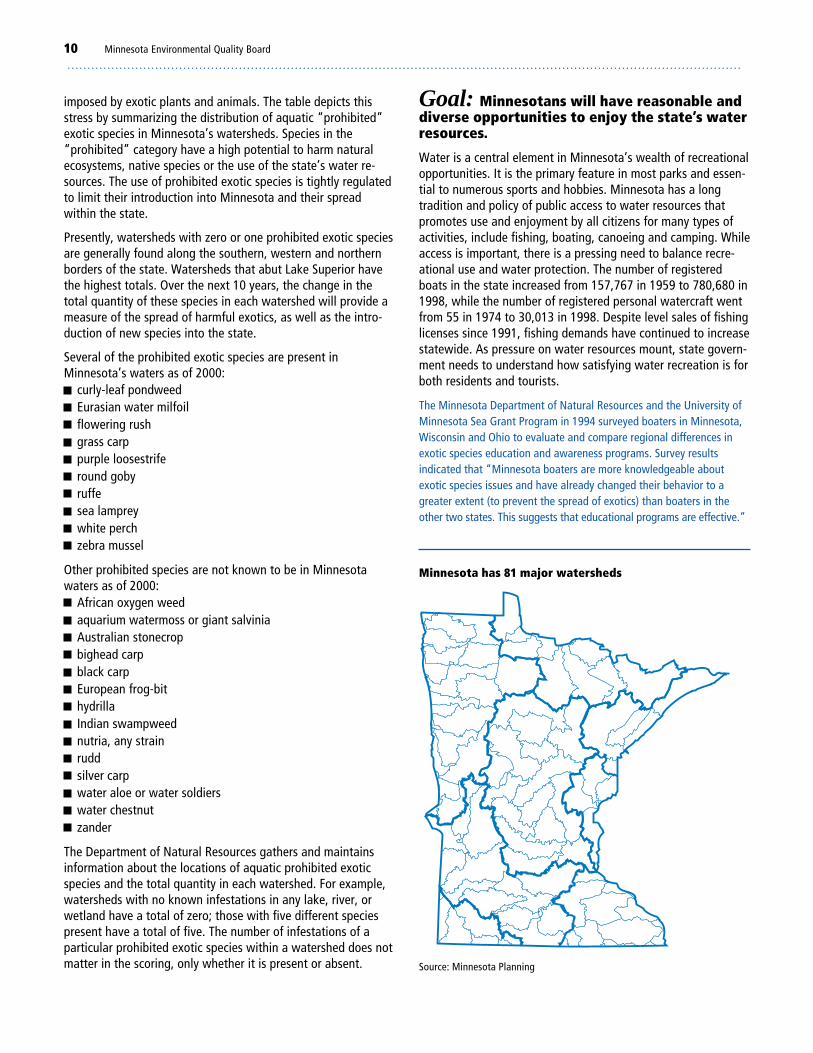
WATER BASINS KEY FEATURE OF MINNESOTA WATERMARKS
The land in Minnesota drains into 10 major river basins.Water from these basins flows in three directions: theRed and Rainy flow north; the Lake Superior Basinflows east; the remaining basins flow south.
To develop the 10-year water plan, interagency basinteams led public information efforts and developed
Lake ofthe Woods
Koochiching
Mahno
men
Wad
ena
Pine
Kana
bec
Aitkin
MilleLacs
Isanti
Otter TailCrowWing
ToddGrant
Stevens
Traverse
Swift
Stearns
Anoka
Kand
iyoh
i
Meeker
Chippewa
Wright
Yellow Medicine
Linc
oln
Lyon
Pipe-stone
Rock Nobles
Murray
Redwood
McLeod
SibleyDakotaScott
LeSueur
Brown
Watonwan
Jackson
Was
eca
Rice
Steele Dodge Olmsted Winona
HoustonFillmore
Kittson
Clay Becker
Carlton
Itasca
Beltrami
Hubbard
MorrisonDouglas
Pope
Cotton-wood
Martin
Roseau
Marshall
Polk
Pennington
Norman
Wilkin
Red Lake
Renville
Nicollet
Freeborn Mower
Blue Earth
Hennepin
Faribault
Goodhue
Wabasha
Chisa
goW
ashi
ngto
n
Ram
s.
LakeSt. Louis
Lac QuiParle
Cook
Carver
Big Stone
Benton
Clea
rwat
er
Sherburne
Cass
Red River BasinRainy River Basin
Upper MississippiRiver Basin
Lake Superior Basin
St. CroixRiver Basin
LowerMississippiRiver Basin
CedarRiver Basin
MinnesotaRiver Basin
MissouriRiver Basin
Des MoinesRiver Basin
basin reports. For planning purposes several waterbasins were combined. The Minnesota, Des Moinesand Missouri River Basins in the southwestern part ofthe state were grouped and the Lower Mississippi andCedar River Basins in southeastern Minnesota werealso grouped.
. . . . . . . . . . . . . . . . . . . . . . . . . . . . . . . . . . . . . . . . . . . . . . . . . . . . . . . . . . . . . . . . . . . . . . . . . . . . . . . . . . . . . . . . . . . . . . . . . . . . . . . . . . . . . . . . . . . . . . . . . . . . . . . . . . . . . . . . . . . . . . . . . . . . . . . . . . . . . . . . . . . . . . . . .
Watermarks: Gauging the Flow of Progress 2000 – 2010 1. . . . . . . . . . . . . . . . . . . . . . . . . . . . . . . . . . . . . . . . . . . . . . . . . . . . . . . . . . . . . . . . . . . . . . . . . . . . . . . . . . . . . . . . . . . . . . . . . . . . . . . . . . . . . . . . . . . . . . . . . . . . . . . . . . . . . . . . . . . . . . . . . . . . . . . . . . . . . . . . . . . . . . . . .
Minnesota’s ecosystems from the introduction of exotic speciesare increasing. While prohibited exotic species have not beendetected in 10 of Minnesota’s 81 major watersheds, severalspecies, such as purple loosestrife and Eurasian water milfoil,are spreading.
People have more opportunities to use lakes and streams as thenumber of public access sites and fishing piers has increased.The quality of water recreation depends on access as well asmany other factors. Satisfaction of recreational experiences willbe measured in the future by periodic surveys.
Seven basins identify specific goals and objectives
Minnesota Watermarks looks specifically at seven water basins:Lake Superior; Minnesota, Missouri and Des Moines Rivers;Rainy River; Red River; Upper Mississippi River; Lower Missis-sippi and Cedar Rivers; and St. Croix River. Based on the reportsof each basin team, these sections describe the basin and thestatus of planning efforts, highlight basin goals and objectives,condition and pressure indicators, point out particular issues ofconcern and discuss next steps. Three basins also have targetsfor specific indicators.
Some basins have had notable population changes, while mosthave areas that are growing rapidly. Trout streams abound insome basins, deep clear lakes in others and important shallowlakes in still others. Some areas are susceptible to water ero-sion, others to wind and some to both. Land uses varythroughout the state, with some basins high in forest lands andothers high in urban areas or cropland. Exotic species affectingone basin may not yet be a problem in another.
While the differences are notable, many conditions and prob-lems cut across several basins:
Local planning and funding. Strengthening local plan-ning and ensuring adequate financial resources for local watermanagement were key issues in most basins.
Land use. Land use and its relationship to the condition andquality of lakes, streams and groundwater was of interest inevery basin.
Prevention. Most basin teams noted the high quality ofwater resources and the importance of keeping these resourcesin top condition.
Education and stewardship. Water resources are greatlyaffected by the actions of individuals who sometimes unknow-ingly pollute.
Climate effects. Recognizing that all aspects of the envi-ronment are interrelated, all of the basin teams noted thatweather and climate change must be considered in planning forMinnesota’s water resources.
Summary. . . . . . . . . . . . . . . . . . . . . . . . . . . . . . . . . . . . . . . . . . . . . . . . . . . . . . . . . . . . . . . . . . . . . . . . . . . . . . . . . . . . . . . . . . . . . . . . . . . . . . . . . . . . . . . . . . . . . . . . . . . . . . . . . . . . . . . . . . . . . . . . . . . . . . . . . . . . . . . . . . . . . . . . .
Coming out of Governor Jesse Ventura’s Water ManagementUnification Initiative, Minnesota Watermarks: Gauging the Flowof Progress 2000-2010 heralds the start of a 10-year processtoward unifying water management in Minnesota. It containsfour statewide goals, nine objectives and 10 indicators to helpmeasure results. As part of this process, teams were establishedto determine specific goals and objectives for Minnesota’s majorwater basins and to identify common concerns. The results ofthese team efforts are included in this report.
The statewide goals are to improve water quality, conserve thediverse characteristics of Minnesota’s waters, restore and main-tain healthy aquatic ecosystems, and provide diverserecreational opportunities. Most of the statewide indicatorsintegrate a variety of water-related measurements.
Trends show status of water resources
Overall, Minnesota’s water resources are in good shape. Morethan 65 percent of assessed streams and lakes meet water qualitystandards and criteria. Only 5,000 of the 92,000 stream milesand 2,500 of the 12,000 lakes are assessed, however. Significantreductions in serious water pollutants — biochemical oxygendemand, phosphorus, ammonia and fecal coliform bacteria —have been reported in state streams. But nitrogen pollutionlevels are increasing, and suspended solids remain a problem.
Monitoring shows pollutants such as nitrate are seeping intogroundwater throughout the state, with high levels in manyplaces. While groundwater quality trend information is lacking,work is underway to set up sampling networks that will be usedto assess trends. Levels of Atrazine, a common pesticide, aredeclining in wells monitored over time in central Minnesota butremain about the same in the southeast.
Water levels in lakes, streams and aquifers vary considerablyacross the state and change with natural conditions and pres-sures of human activity. Water levels in streams and wellsreflect periodic drought and flood conditions. Levels were gen-erally high throughout the 1990s, with most stream flows abovenormal and catastrophic flooding occurring in some places.Water use for many purposes increases during drought condi-tions, which could occur at any time. Groundwater use isgrowing. Changes in use need to be monitored, becausegroundwater levels affect surface waters.
Water resources are a key factor in ecosystem health. Whilemeasuring levels of a specific toxic compound indirectly reflectsproblems, new measures that combine information to create anindex identifying the number of species of fish or plants present,their pollution tolerance and their health will directly show howenvironmental conditions are altered. Such indices already existor are being developed throughout the state. Threats to
. . . . . . . . . . . . . . . . . . . . . . . . . . . . . . . . . . . . . . . . . . . . . . . . . . . . . . . . . . . . . . . . . . . . . . . . . . . . . . . . . . . . . . . . . . . . . . . . . . . . . . . . . . . . . . . . . . . . . . . . . . . . . . . . . . . . . . . . . . . . . . . . . . . . . . . . . . . . . . . . . . . . . . . . .
2 Minnesota Environmental Quality Board
Coordination. A continuing, cooperative effort is neededbecause several groups and units of government have an inter-est in water or are charged with managing them.
During the next decade, the state government will continue towork with federal and local governments, as well other groups,
to unify efforts, focus on major water basins and measure re-sults. The framework detailed in Minnesota Watermarks is astarting point for the efforts that will be needed to protectMinnesota’s prized water resources.
Goal: Minnesotans will improve thequality of water resources.
OBJECTIVE A.Protect and improve water quality in rivers, streamsand other water courses.Indicator 1. Percentage of stream miles assessed that meetwater quality standards and criteria.
OBJECTIVE B.Protect and improve lake water quality.Indicator 2. Percentage of lake acres assessed that meetwater quality standards and criteria.
OBJECTIVE C.Protect and improve groundwater quality.Indicator 3. Percentage of drinking water wells sampled thatmeet nitrate standards.
Goal: Minnesotans will conserve watersupplies and maintain the diversecharacteristics of water resources to givefuture generations a healthy environmentand a strong economy.
OBJECTIVE D.Maintain groundwater levels to sustain surfacewater bodies and provide water supplies for humandevelopment.Indicator 4. Water levels in wells in relation to precipitation.
OBJECTIVE E.Maintain the hydrologic characteristics of surfacewater bodies that support beneficial uses.Indicator 5. Annual stream flow in relation to precipitation.
Indicator 6. Lake levels in relation to the 10-year average.
Goal: Minnesotans will restore andmaintain healthy aquatic ecosystems thatsupport diverse plants and wildlife.
OBJECTIVE F.Ensure that aquatic environments have conditionssuitable for the maintenance of healthy self-sustaining communities of plants and animals.Indicator 7. Index of biotic integrity for lakes, rivers andwetlands.
OBJECTIVE G.Limit geographic range of exotic species.Indicator 8. Number of major watersheds with specificquantities of prohibited exotic species.
Goal: Minnesotans will have reasonableand diverse opportunities to enjoy the state’swater resources.
OBJECTIVE H.Provide access to water-based recreation sites.Indicator 9. Number of public access sites on lakes, rivers andstreams.
OBJECTIVE I.Improve or maintain the quality of water recreation.Indicator 10. Survey of degree of satisfaction with water-related outdoor experiences.
Watermarks: Gauging the Flow of Progress 2000 – 2010 3. . . . . . . . . . . . . . . . . . . . . . . . . . . . . . . . . . . . . . . . . . . . . . . . . . . . . . . . . . . . . . . . . . . . . . . . . . . . . . . . . . . . . . . . . . . . . . . . . . . . . . . . . . . . . . . . . . . . . . . . . . . . . . . . . . . . . . . . . . . . . . . . . . . . . . . . . . . . . . . . . . . . . . . . .
Introduction. . . . . . . . . . . . . . . . . . . . . . . . . . . . . . . . . . . . . . . . . . . . . . . . . . . . . . . . . . . . . . . . . . . . . . . . . . . . . . . . . . . . . . . . . . . . . . . . . . . . . . . . . . . . . . . . . . . . . . . . . . . . . . . . . . . . . . . . . . . . . . . . . . . . . . . . . . . . . . . . . . . . . . . . .
“I am concerned about growth in the area and an increase in the use ofwater resources,” said Daniel Kalmon at a public meeting on the St.Croix Basin. “It is good to be able to participate as a citizen and tocomment on what is happening.”
To paraphrase a famous state resource on radio: Minnesota —where the rivers are strong, the lakes are good-looking, and thefishing is above average.
When the average American hears the word Minnesota, chancesare good that the first image that comes to his or her mind iswater. Home to the headwaters of the nation’s largest river andbig, clear lakes teeming with fish, Minnesota is a water mecca.Minnesotans, as well as tens of thousands of visitors who ac-count for the state’s $9 billion tourism economy, count onclean, clear water for drinking, cooking, bathing and recreation.
Minnesota Watermarks: Gauging the Flow of Progress 2000-2010 outlines the state’s plan to protect and conserveMinnesota’s water. It heralds the start of a 10-year process tounify efforts and measure results. The legislatively mandatedplan is a major component of Governor Jesse Ventura’s WaterManagement Unification Initiative. The Governor’s executiveorder establishing the initiative includes:
Focusing on major water basins, such as the Mississippi,Minnesota and Red Rivers, to recognize the differences in waterresources and management choices throughout the state
Unifying water management through interagency teams ineach basin that will work with local entities and the public
Measuring results by developing and tracking indicators ofprogress toward a statewide framework of goals and objectivesadapted to each basin
The Environmental Quality Board Water Resources Committeeand a Water Unification Task Force provided leadership for thetwo-year process leading to this report. Seven interagency teamsof state and federal staff were organized in Minnesota’s majorwater basins to unify efforts and gather public input in theirregion. While the state has 10 major water basins, three on thesouthern border drain relatively small areas in Minnesota andwere added to adjacent basins for planning purposes. The basinsencompassed in this plan are: Lake Superior; Lower Mississippiand Cedar Rivers; Minnesota, Missouri and Des Moines Rivers;Rainy River; Red River; St. Croix; and Upper Mississippi River.Because four basins affect the Twin Cities region and the areacontains large numbers of people and water-related groups, aMetro Committee was formed to gather input from this area.
To focus public discussions, the committee and task force in1999 produced Preparing for Water Plan 2000: A Public ReviewDraft, which contained four goals, 10 objectives and 29 indica-tors to measure results. In September 1999, the committee, taskforce and teams first met to discuss the Governor’s water initia-tive, the 10-year water plan and assignments. Working withgovernmental entities, water interests and the public throughFebruary 2000, this group gathered feedback on four questions:
Did the goals and objectives address water needs? If not,what would?
Did the 29 indicators measure progress? If not, what would?
What indicators of human behaviors or pressures that pose arisk to water resources should be tracked?
For each indicator, what should the target be for 2010?
Minnesota Watermarks is built on the task force and basinteams reports and contains two major sections. The first focuseson four statewide goals, nine objectives and 10 indicators de-signed to show trends. The indicators generally consolidate anumber of individual measures that reflect the resource condition.For example, the water quality indicators show whether Minnesotawater bodies are meeting standards, which consist of numerousspecific components. The second section summarizes each ofthe seven basin reports, highlighting the similarities and uniquecharacter and priorities of each basin. The complete report ofeach basin team is available separately as an appendix and onthe Minnesota Planning web site at www.mnplan.state.mn.us.
Another water policy report is due to the Minnesota Legislaturein September 2002. Between now and then, the committee,task force and basin teams will continue to work together todecide key strategies and related responsibilities, track progresstoward the goals and objectives, set 10-year targets and evalu-ate whether existing actions and programs are meeting needs.The basin teams recommended taking a wide variety of mea-surements and will need to continue to define the feasibility ofthese and set priorities for tracking.
An emerging issue in water quality is the presence of pharmaceuticalcompounds and endocrine-disrupting chemicals in water supplies.Excreted substances such as chemotherapy drugs, antibiotics, analgesics,cholesterol-lowering drugs, caffeine and other pharmaceuticalcompounds are showing up in treated municipal wastewater, septictanks and other effluent sources. Most such compounds are notcovered by drinking water standards, which leaves the possibility oftrace amounts of these substances appearing in tap water.
. . . . . . . . . . . . . . . . . . . . . . . . . . . . . . . . . . . . . . . . . . . . . . . . . . . . . . . . . . . . . . . . . . . . . . . . . . . . . . . . . . . . . . . . . . . . . . . . . . . . . . . . . . . . . . . . . . . . . . . . . . . . . . . . . . . . . . . . . . . . . . . . . . . . . . . . . . . . . . . . . . . . . . . . .
4 Minnesota Environmental Quality Board
Common goals and objectives designed to unify efforts. . . . . . . . . . . . . . . . . . . . . . . . . . . . . . . . . . . . . . . . . . . . . . . . . . . . . . . . . . . . . . . . . . . . . . . . . . . . . . . . . . . . . . . . . . . . . . . . . . . . . . . . . . . . . . . . . . . . . . . . . . . . . . . . . . . . . . . . . . . . . . . . . . . . . . . . . . . . . . . . . . . . . . . . .
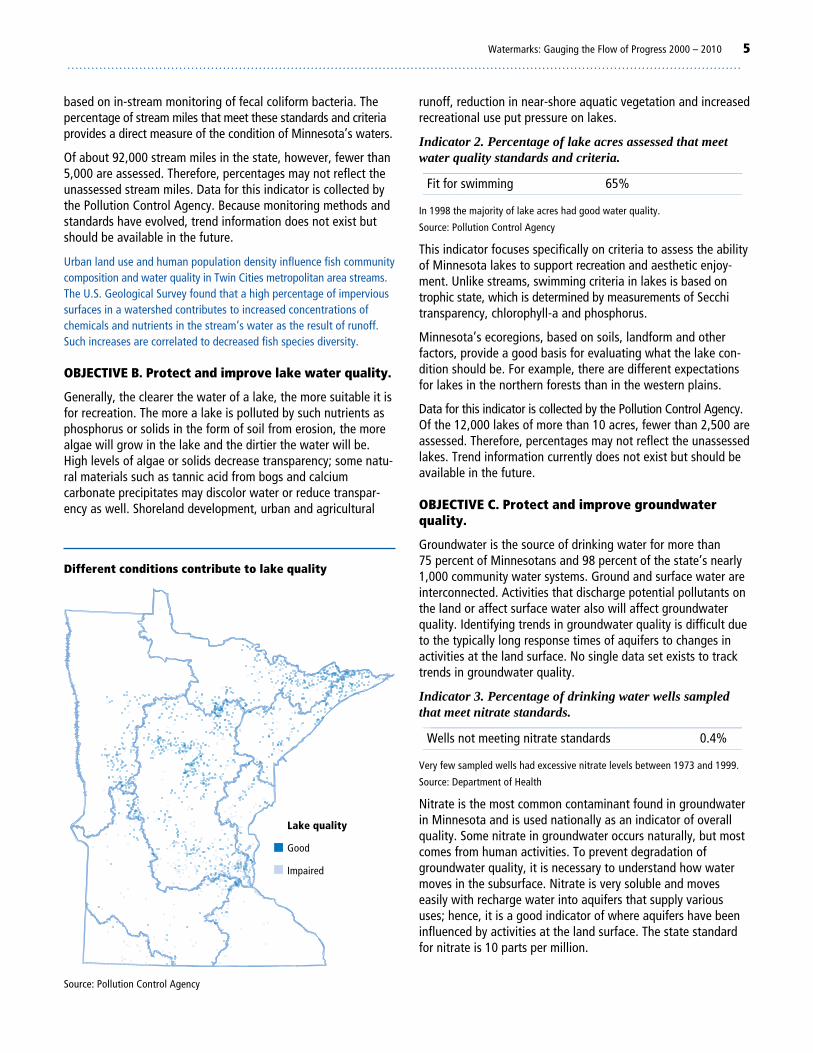
Indicator 1. Percentage of stream miles assessed that meetwater quality standards and criteria.
______________________________________________________________________________________________________________________________________________________________
Fit for swimming 68%________________________________________________________________________________
Fit for aquatic life 65%________________________________________________________________________________
In 1998 a majority of stream miles met standards but about a third did not.
Source: Pollution Control Agency
To protect the state’s waters for a variety of uses, the PollutionControl Agency sets standards and criteria for streams. Streamcriteria are based on a combination of aquatic life and swimminguse-support standards. Assessments of aquatic life use-supportare conducted to determine if the waters are of a quality thatsupports the aquatic life that would be found in the stream underthe most natural conditions. Limits are established for specificpollutants that would impair certain uses, along with minimumacceptable levels of health for the aquatic communities in thewaters. Specific pollutants or factors that contribute to pollutioninclude biochemical oxygen demand, ammonia, nitrogen,phosphorus and suspended solids. Assessments of swimminguse-support are conducted to determine if the waters are of aquality that supports primary body contact. Quality is determined
Common goals and objectives will help unify water planningand management across the state. The following four goals,nine objectives and 10 indicators reflect extensive feedbackfrom basin teams and others. They serve as the foundation forstate, federal and local plans and management efforts, andprovide direction for basin and local plans.
When reviewing indicators for each objective, it is important torecognize that water resource conditions often change slowly.Many trends that the teams and other respondents indicatedwould be valuable to track cannot yet be measured adequately.For example, information about the complex groundwater flowand its interaction with surface water is inadequate to answertoday’s questions. Water use from some groundwater sourcesmay not be sustainable for the long term, and little groundwaterquality trend information exists. Toxic substances, includingpharmaceuticals used by people and animals as well as com-pounds that disrupt the endocrine system, are among thepollutants found in water for which additional tracking is desir-able. The statewide indicators often reflect data that exists ormay be developed during the next decade, rather than the bestinformation that explains water conditions. Monitoring that isdone to assess the impacts of a particular activity may be usedhere to try to describe trends.
Goal: Minnesotans will improve the qualityof water resources.
Since Minnesota’s waters flow to three major North Americandrainage basins, the state has a key responsibility to protectwater resources. Clean and clear water, however, is too easilytaken for granted. Changing land uses, increased industrialactivity and an ever-expanding population create the need forconstant vigilance in protecting the state’s waters. Pollutantsare threatening lakes, streams and groundwater. While all wa-ter resources are interconnected, the following objectives givespecial consideration to streams, lakes and groundwater.
More than 190 Minnesota communities ranging in size from 50 to 200people have no central wastewater treatment system.
OBJECTIVE A. Protect and improve water quality inrivers, streams and other water courses.
Water quality in rivers and other water courses, such as stormwater and agricultural drainage systems, is threatened by avariety of sources. Nutrients, solids, bacteria and other commonpollutants can harm the health of humans and animals andcause aesthetic problems, inhibiting the recreational use andenjoyment of streams, rivers and other water courses.
Two thirds of monitored streams sustain aquatic life
Source: Pollution Control Agency
Water quality
Good
Impaired
Watermarks: Gauging the Flow of Progress 2000 – 2010 5. . . . . . . . . . . . . . . . . . . . . . . . . . . . . . . . . . . . . . . . . . . . . . . . . . . . . . . . . . . . . . . . . . . . . . . . . . . . . . . . . . . . . . . . . . . . . . . . . . . . . . . . . . . . . . . . . . . . . . . . . . . . . . . . . . . . . . . . . . . . . . . . . . . . . . . . . . . . . . . . . . . . . . . . .
runoff, reduction in near-shore aquatic vegetation and increasedrecreational use put pressure on lakes.
Indicator 2. Percentage of lake acres assessed that meetwater quality standards and criteria.
________________________________________________________________________________________________________________________________________________________________
Fit for swimming 65%________________________________________________________________________________
In 1998 the majority of lake acres had good water quality.
Source: Pollution Control Agency
This indicator focuses specifically on criteria to assess the abilityof Minnesota lakes to support recreation and aesthetic enjoy-ment. Unlike streams, swimming criteria in lakes is based ontrophic state, which is determined by measurements of Secchitransparency, chlorophyll-a and phosphorus.
Minnesota’s ecoregions, based on soils, landform and otherfactors, provide a good basis for evaluating what the lake con-dition should be. For example, there are different expectationsfor lakes in the northern forests than in the western plains.
Data for this indicator is collected by the Pollution Control Agency.Of the 12,000 lakes of more than 10 acres, fewer than 2,500 areassessed. Therefore, percentages may not reflect the unassessedlakes. Trend information currently does not exist but should beavailable in the future.
OBJECTIVE C. Protect and improve groundwaterquality.
Groundwater is the source of drinking water for more than75 percent of Minnesotans and 98 percent of the state’s nearly1,000 community water systems. Ground and surface water areinterconnected. Activities that discharge potential pollutants onthe land or affect surface water also will affect groundwaterquality. Identifying trends in groundwater quality is difficult dueto the typically long response times of aquifers to changes inactivities at the land surface. No single data set exists to tracktrends in groundwater quality.
Indicator 3. Percentage of drinking water wells sampledthat meet nitrate standards.
______________________________________________________________________________________________________________________________________________________________
Wells not meeting nitrate standards 0.4%________________________________________________________________________________
Very few sampled wells had excessive nitrate levels between 1973 and 1999.
Source: Department of Health
Nitrate is the most common contaminant found in groundwaterin Minnesota and is used nationally as an indicator of overallquality. Some nitrate in groundwater occurs naturally, but mostcomes from human activities. To prevent degradation ofgroundwater quality, it is necessary to understand how watermoves in the subsurface. Nitrate is very soluble and moveseasily with recharge water into aquifers that supply varioususes; hence, it is a good indicator of where aquifers have beeninfluenced by activities at the land surface. The state standardfor nitrate is 10 parts per million.
based on in-stream monitoring of fecal coliform bacteria. Thepercentage of stream miles that meet these standards and criteriaprovides a direct measure of the condition of Minnesota’s waters.
Of about 92,000 stream miles in the state, however, fewer than5,000 are assessed. Therefore, percentages may not reflect theunassessed stream miles. Data for this indicator is collected bythe Pollution Control Agency. Because monitoring methods andstandards have evolved, trend information does not exist butshould be available in the future.
Urban land use and human population density influence fish communitycomposition and water quality in Twin Cities metropolitan area streams.The U.S. Geological Survey found that a high percentage of impervioussurfaces in a watershed contributes to increased concentrations ofchemicals and nutrients in the stream’s water as the result of runoff.Such increases are correlated to decreased fish species diversity.
OBJECTIVE B. Protect and improve lake water quality.
Generally, the clearer the water of a lake, the more suitable it isfor recreation. The more a lake is polluted by such nutrients asphosphorus or solids in the form of soil from erosion, the morealgae will grow in the lake and the dirtier the water will be.High levels of algae or solids decrease transparency; some natu-ral materials such as tannic acid from bogs and calciumcarbonate precipitates may discolor water or reduce transpar-ency as well. Shoreland development, urban and agricultural
Different conditions contribute to lake quality
Source: Pollution Control Agency
Lake quality
Good
Impaired
. . . . . . . . . . . . . . . . . . . . . . . . . . . . . . . . . . . . . . . . . . . . . . . . . . . . . . . . . . . . . . . . . . . . . . . . . . . . . . . . . . . . . . . . . . . . . . . . . . . . . . . . . . . . . . . . . . . . . . . . . . . . . . . . . . . . . . . . . . . . . . . . . . . . . . . . . . . . . . . . . . . . . . . . .
6 Minnesota Environmental Quality Board
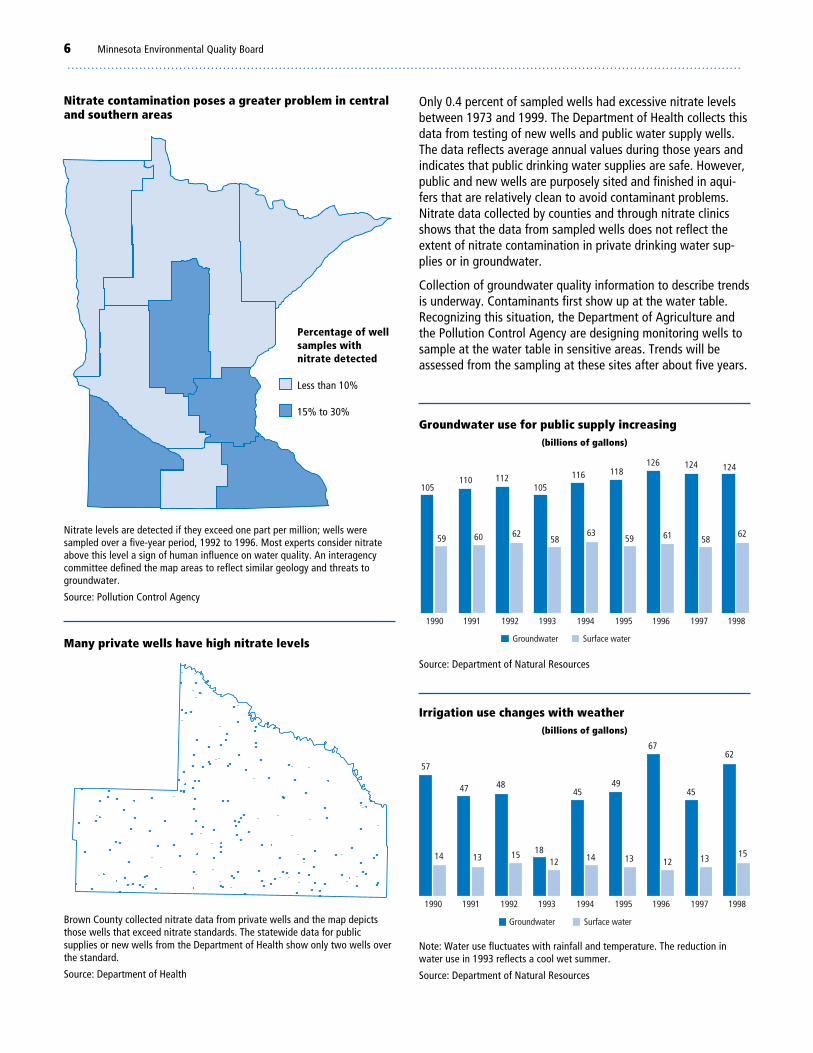
Only 0.4 percent of sampled wells had excessive nitrate levelsbetween 1973 and 1999. The Department of Health collects thisdata from testing of new wells and public water supply wells.The data reflects average annual values during those years andindicates that public drinking water supplies are safe. However,public and new wells are purposely sited and finished in aqui-fers that are relatively clean to avoid contaminant problems.Nitrate data collected by counties and through nitrate clinicsshows that the data from sampled wells does not reflect theextent of nitrate contamination in private drinking water sup-plies or in groundwater.
Collection of groundwater quality information to describe trendsis underway. Contaminants first show up at the water table.Recognizing this situation, the Department of Agriculture andthe Pollution Control Agency are designing monitoring wells tosample at the water table in sensitive areas. Trends will beassessed from the sampling at these sites after about five years.
Nitrate contamination poses a greater problem in centraland southern areas
Nitrate levels are detected if they exceed one part per million; wells weresampled over a five-year period, 1992 to 1996. Most experts consider nitrateabove this level a sign of human influence on water quality. An interagencycommittee defined the map areas to reflect similar geology and threats togroundwater.
Source: Pollution Control Agency
Percentage of wellsamples withnitrate detected
Less than 10%
15% to 30%
Many private wells have high nitrate levels
Brown County collected nitrate data from private wells and the map depictsthose wells that exceed nitrate standards. The statewide data for publicsupplies or new wells from the Department of Health show only two wells overthe standard.
Source: Department of Health
105110 112
105116 118
126 124 124
59 60 6258
6359 61 58
62
1990 1991 1992 1993 1994 1995 1996 1997 1998
Groundwater Surface water
Groundwater use for public supply increasing(billions of gallons)
Source: Department of Natural Resources
Note: Water use fluctuates with rainfall and temperature. The reduction inwater use in 1993 reflects a cool wet summer.
Source: Department of Natural Resources
57
47 48
18
4549
67
45
62
14 13 1512 14 13 12 13 15
1990 1991 1992 1993 1994 1995 1996 1997 1998
Groundwater Surface water
Irrigation use changes with weather(billions of gallons)

Watermarks: Gauging the Flow of Progress 2000 – 2010 7. . . . . . . . . . . . . . . . . . . . . . . . . . . . . . . . . . . . . . . . . . . . . . . . . . . . . . . . . . . . . . . . . . . . . . . . . . . . . . . . . . . . . . . . . . . . . . . . . . . . . . . . . . . . . . . . . . . . . . . . . . . . . . . . . . . . . . . . . . . . . . . . . . . . . . . . . . . . . . . . . . . . . . . . .
Goal: Minnesotans will conserve watersupplies and maintain the diverse characteristicsof water resources to give future generations ahealthy environment and a strong economy.
Minnesotans tend to take water for granted in planning fordevelopment; they expect to find it available everywhere in aquantity and quality that meets their demands. The supply insome areas is inadequate, however, and elsewhere, contamina-tion or the natural quality prevents the use of available water.Several issues need to be considered: competing users canstrain local water supplies; individual demands for water eitherstay the same or rise when the supply of water falls duringdroughts; and high water levels that may happen infrequentlyneed to be taken into account when planning construction sofloods do not cause unnecessary and costly damage.
OBJECTIVE D. Maintain groundwater levels tosustain surface water bodies and provide watersupplies for human development.
The demand for clean water is growing, and Minnesota is in-creasingly tapping into its groundwater. The use of groundwaterfor public water supplies exceeded that of surface water inabout 1980 and continues to grow. Irrigation, drawing mainlyon groundwater, also continues to increase, especially duringdry years. Using too much water from a vulnerable supply couldcause lakes, rivers or wells to dry up.
Indicator 4. Water levels in wells in relation to precipitation.
Number above Number in the Number below the median median range the median
________________________________________________________________________________
1990 0 4 13________________________________________________________________________________
1991 1 5 10________________________________________________________________________________
1992 6 9 4________________________________________________________________________________
1993 3 12 4________________________________________________________________________________
1994 11 7 2________________________________________________________________________________
1995 5 14 0________________________________________________________________________________
1996 11 8 1________________________________________________________________________________
1997 4 13 2________________________________________________________________________________
1998 7 10 4________________________________________________________________________________
1999 6 10 4________________________________________________________________________________
Water levels vary over the years in 21 selected wells.
Note: Water levels were compared to the long-term November median for eachwell. The total number of wells in some years does not equal 21 becauserecords are missing or incomplete.
Source: Department of Natural Resources
Water levels are a good indicator of the overall condition of thewater supply. Measurements of the water levels in wells inte-grate the effects of climate and other natural variations with thepressures of human activity. Changes in land surface may affectrecharge negatively. Large natural variations in precipitationalso occur naturally and may mask the influence of humanactivity on a regional or basin scale. Minnesotans’ demand for
water does not take into account the changing amounts ofwater available due to climatic variability. In fact, pumping anddemand for water tend to increase when rainfall is short andwater levels are declining.
Shallow groundwater levels usually vary in concert with pre-cipitation. The Department of Natural Resources obtainsmeasurements of the levels in selected water table wells acrossthe state. November levels are used as baseline because theytend to reflect the sum of conditions that occurred during thepreceding season. The median is computed from the Novemberlevels over time. In 1990, water levels were recovering from thedrought years of 1987 through 1989, and more wells had levelsbelow than above their long-term median for November. As thedecade progressed, many wells showed water level increasesinto the median range or above.
The Department of Natural Resources Observation Well Networkincludes about 700 wells that are maintained expressly to mea-sure water levels; they are located throughout developed partsof the state in 77 counties. Wells will be in every significantstate aquifer and in some monitoring locations in every countywhen the network is completed.
Total water use is increasing in Minnesota. Use was 705 gallons perperson per day in 1996 compared with 558 in 1986.
OBJECTIVE E. Maintain the hydrologic characteristicsof surface water bodies that support beneficial uses.
Again, natural variation in supplies is inversely related to demand.When water use increases during drought, an already stressedriver can become dry. Costs of flood damages increase if flood-prone lands are developed. Surface water is a valuable source ofdrinking water; 26 community water supplies draw from lakes orrivers, and nearly 1 million people rely on Mississippi River sources.
Indicator 5. Annual stream flow in relation to precipitation.
Number Number in the Number above normal normal range below normal
________________________________________________________________________________
1990 9 70 2________________________________________________________________________________
1991 42 33 6________________________________________________________________________________
1992 57 22 2________________________________________________________________________________
1993 61 20 0________________________________________________________________________________
1994 64 17 0________________________________________________________________________________
1995 63 18 0________________________________________________________________________________
1996 80 1 0________________________________________________________________________________
1997 76 5 0________________________________________________________________________________
1998 47 33 1________________________________________________________________________________
The majority of state stream flows were running above normal in the 1990s.
Sources: Department of Natural Resources and United States Geological Survey
Year-round and partial-record sites provide data to calculateflow statistics for the 81 major watersheds. Each watershed isthen characterized as experiencing high, normal or low flows bycomparing flow conditions for the specific water year to the
. . . . . . . . . . . . . . . . . . . . . . . . . . . . . . . . . . . . . . . . . . . . . . . . . . . . . . . . . . . . . . . . . . . . . . . . . . . . . . . . . . . . . . . . . . . . . . . . . . . . . . . . . . . . . . . . . . . . . . . . . . . . . . . . . . . . . . . . . . . . . . . . . . . . . . . . . . . . . . . . . . . . . . . . .
8 Minnesota Environmental Quality Board
period of record for that station. The water year is from October1 to September 30. Since the flow conditions are summarized forthe entire water year, severe spring or summer flooding in thebasin may not result in above-average flows for the whole year.
The abundance of precipitation in the 1990s resulted in above-normal flows for several watersheds and catastrophic floods forseveral basins. Annual stream flows in the last decade oftenexceeded normal ranges. The majority of watersheds had flowsabove the normal range, while a few dipped below normal inthe northern part of the state. During the 1996 water year, onlyone of 81 watersheds exhibited flows that were normal or be-low normal. Five watersheds were in the normal range thefollowing year, despite severe flooding in the Red and Minne-sota River Basins.
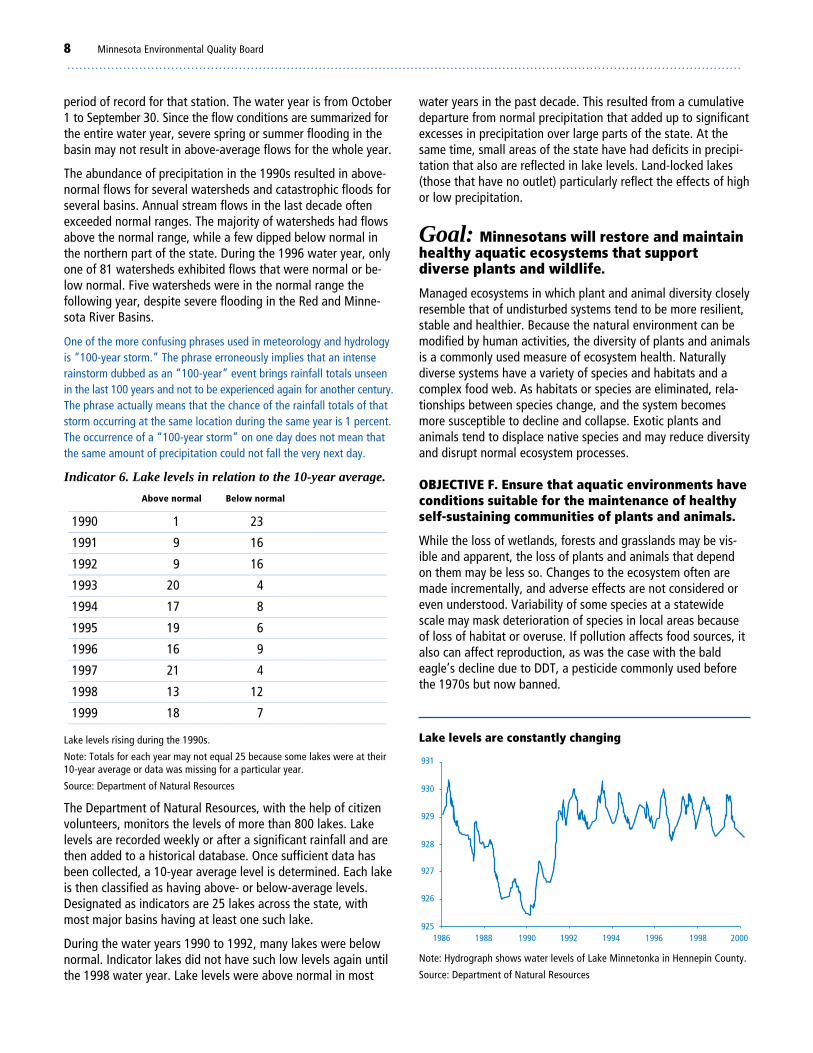
One of the more confusing phrases used in meteorology and hydrologyis “100-year storm.” The phrase erroneously implies that an intenserainstorm dubbed as an “100-year” event brings rainfall totals unseenin the last 100 years and not to be experienced again for another century.The phrase actually means that the chance of the rainfall totals of thatstorm occurring at the same location during the same year is 1 percent.The occurrence of a “100-year storm” on one day does not mean thatthe same amount of precipitation could not fall the very next day.
Indicator 6. Lake levels in relation to the 10-year average.
Above normal Below normal________________________________________________________________________________
1990 1 23________________________________________________________________________________
1991 9 16________________________________________________________________________________
1992 9 16________________________________________________________________________________
1993 20 4________________________________________________________________________________
1994 17 8________________________________________________________________________________
1995 19 6________________________________________________________________________________
1996 16 9________________________________________________________________________________
1997 21 4________________________________________________________________________________
1998 13 12________________________________________________________________________________
1999 18 7________________________________________________________________________________
Lake levels rising during the 1990s.
Note: Totals for each year may not equal 25 because some lakes were at their10-year average or data was missing for a particular year.
Source: Department of Natural Resources
The Department of Natural Resources, with the help of citizenvolunteers, monitors the levels of more than 800 lakes. Lakelevels are recorded weekly or after a significant rainfall and arethen added to a historical database. Once sufficient data hasbeen collected, a 10-year average level is determined. Each lakeis then classified as having above- or below-average levels.Designated as indicators are 25 lakes across the state, withmost major basins having at least one such lake.
During the water years 1990 to 1992, many lakes were belownormal. Indicator lakes did not have such low levels again untilthe 1998 water year. Lake levels were above normal in most
water years in the past decade. This resulted from a cumulativedeparture from normal precipitation that added up to significantexcesses in precipitation over large parts of the state. At thesame time, small areas of the state have had deficits in precipi-tation that also are reflected in lake levels. Land-locked lakes(those that have no outlet) particularly reflect the effects of highor low precipitation.
Goal: Minnesotans will restore and maintainhealthy aquatic ecosystems that supportdiverse plants and wildlife.
Managed ecosystems in which plant and animal diversity closelyresemble that of undisturbed systems tend to be more resilient,stable and healthier. Because the natural environment can bemodified by human activities, the diversity of plants and animalsis a commonly used measure of ecosystem health. Naturallydiverse systems have a variety of species and habitats and acomplex food web. As habitats or species are eliminated, rela-tionships between species change, and the system becomesmore susceptible to decline and collapse. Exotic plants andanimals tend to displace native species and may reduce diversityand disrupt normal ecosystem processes.
OBJECTIVE F. Ensure that aquatic environments haveconditions suitable for the maintenance of healthyself-sustaining communities of plants and animals.
While the loss of wetlands, forests and grasslands may be vis-ible and apparent, the loss of plants and animals that dependon them may be less so. Changes to the ecosystem often aremade incrementally, and adverse effects are not considered oreven understood. Variability of some species at a statewidescale may mask deterioration of species in local areas becauseof loss of habitat or overuse. If pollution affects food sources, italso can affect reproduction, as was the case with the baldeagle’s decline due to DDT, a pesticide commonly used beforethe 1970s but now banned.
925
926
927
928
929
930
931
1986 1988 1990 1992 1994 1996 1998 2000
Note: Hydrograph shows water levels of Lake Minnetonka in Hennepin County.
Source: Department of Natural Resources
Lake levels are constantly changing
Watermarks: Gauging the Flow of Progress 2000 – 2010 9. . . . . . . . . . . . . . . . . . . . . . . . . . . . . . . . . . . . . . . . . . . . . . . . . . . . . . . . . . . . . . . . . . . . . . . . . . . . . . . . . . . . . . . . . . . . . . . . . . . . . . . . . . . . . . . . . . . . . . . . . . . . . . . . . . . . . . . . . . . . . . . . . . . . . . . . . . . . . . . . . . . . . . . . .
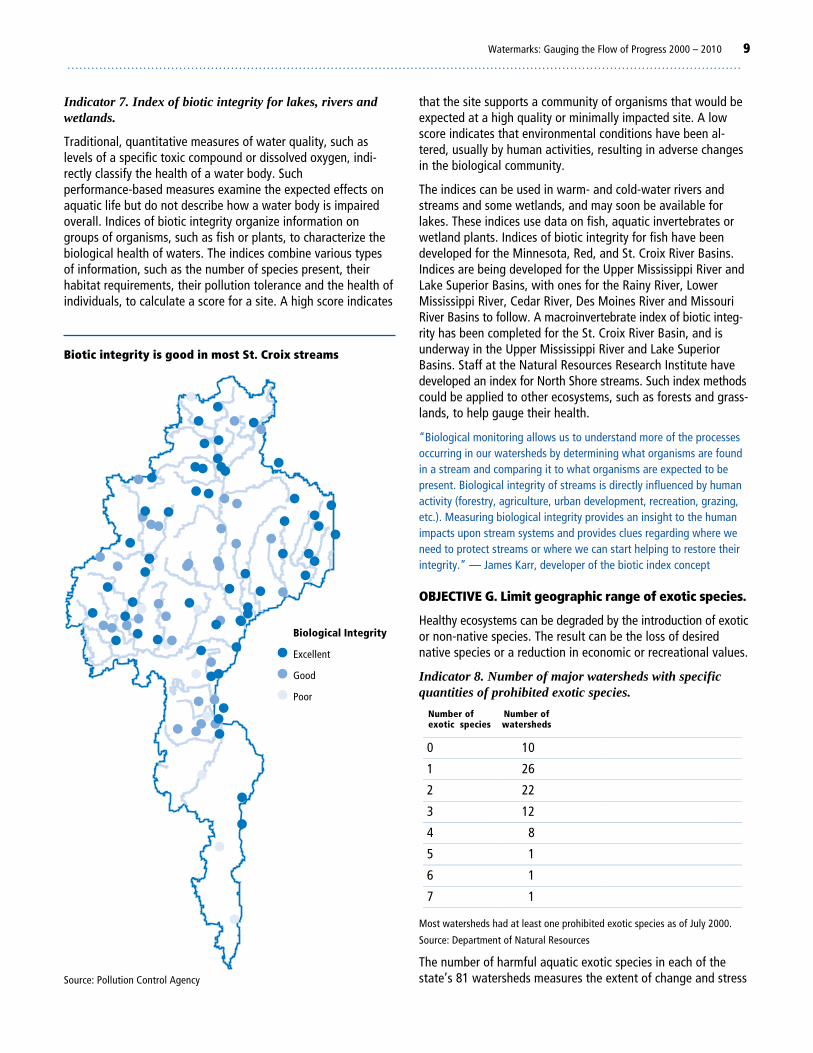
Indicator 7. Index of biotic integrity for lakes, rivers andwetlands.
Traditional, quantitative measures of water quality, such aslevels of a specific toxic compound or dissolved oxygen, indi-rectly classify the health of a water body. Suchperformance-based measures examine the expected effects onaquatic life but do not describe how a water body is impairedoverall. Indices of biotic integrity organize information ongroups of organisms, such as fish or plants, to characterize thebiological health of waters. The indices combine various typesof information, such as the number of species present, theirhabitat requirements, their pollution tolerance and the health ofindividuals, to calculate a score for a site. A high score indicates
that the site supports a community of organisms that would beexpected at a high quality or minimally impacted site. A lowscore indicates that environmental conditions have been al-tered, usually by human activities, resulting in adverse changesin the biological community.
The indices can be used in warm- and cold-water rivers andstreams and some wetlands, and may soon be available forlakes. These indices use data on fish, aquatic invertebrates orwetland plants. Indices of biotic integrity for fish have beendeveloped for the Minnesota, Red, and St. Croix River Basins.Indices are being developed for the Upper Mississippi River andLake Superior Basins, with ones for the Rainy River, LowerMississippi River, Cedar River, Des Moines River and MissouriRiver Basins to follow. A macroinvertebrate index of biotic integ-rity has been completed for the St. Croix River Basin, and isunderway in the Upper Mississippi River and Lake SuperiorBasins. Staff at the Natural Resources Research Institute havedeveloped an index for North Shore streams. Such index methodscould be applied to other ecosystems, such as forests and grass-lands, to help gauge their health.
“Biological monitoring allows us to understand more of the processesoccurring in our watersheds by determining what organisms are foundin a stream and comparing it to what organisms are expected to bepresent. Biological integrity of streams is directly influenced by humanactivity (forestry, agriculture, urban development, recreation, grazing,etc.). Measuring biological integrity provides an insight to the humanimpacts upon stream systems and provides clues regarding where weneed to protect streams or where we can start helping to restore theirintegrity.” — James Karr, developer of the biotic index concept
OBJECTIVE G. Limit geographic range of exotic species.
Healthy ecosystems can be degraded by the introduction of exoticor non-native species. The result can be the loss of desirednative species or a reduction in economic or recreational values.
Indicator 8. Number of major watersheds with specificquantities of prohibited exotic species.
Number of Number ofexotic species watersheds
________________________________________________________________________________
0 10________________________________________________________________________________
1 26________________________________________________________________________________
2 22________________________________________________________________________________
3 12________________________________________________________________________________
4 8________________________________________________________________________________
5 1________________________________________________________________________________
6 1________________________________________________________________________________
7 1________________________________________________________________________________
Most watersheds had at least one prohibited exotic species as of July 2000.
Source: Department of Natural Resources
The number of harmful aquatic exotic species in each of thestate’s 81 watersheds measures the extent of change and stress
● ●
●
●
●
●
●
●
●●
●
●
●
●
●
●●
●
●●
●
●●
●
●
●●
●
●●
●
●
●
●
●
●
●
●
●
● ●
●
●
●
●
●●
●
●
●● ●
●
●
●
●
●
●
●
●
●
●
●
●●
●●
●
●
●●
●
●
●
●●●
●
●
●● ●
●
●
●
●
●
●
●
●
●
●
●
●
●
●
●●
●
●
Biotic integrity is good in most St. Croix streams
Source: Pollution Control Agency
Biological Integrity
Excellent
Good
Poor
. . . . . . . . . . . . . . . . . . . . . . . . . . . . . . . . . . . . . . . . . . . . . . . . . . . . . . . . . . . . . . . . . . . . . . . . . . . . . . . . . . . . . . . . . . . . . . . . . . . . . . . . . . . . . . . . . . . . . . . . . . . . . . . . . . . . . . . . . . . . . . . . . . . . . . . . . . . . . . . . . . . . . . . . .
10 Minnesota Environmental Quality Board
Goal: Minnesotans will have reasonable anddiverse opportunities to enjoy the state’s waterresources.
Water is a central element in Minnesota’s wealth of recreationalopportunities. It is the primary feature in most parks and essen-tial to numerous sports and hobbies. Minnesota has a longtradition and policy of public access to water resources thatpromotes use and enjoyment by all citizens for many types ofactivities, include fishing, boating, canoeing and camping. Whileaccess is important, there is a pressing need to balance recre-ational use and water protection. The number of registeredboats in the state increased from 157,767 in 1959 to 780,680 in1998, while the number of registered personal watercraft wentfrom 55 in 1974 to 30,013 in 1998. Despite level sales of fishinglicenses since 1991, fishing demands have continued to increasestatewide. As pressure on water resources mount, state govern-ment needs to understand how satisfying water recreation is forboth residents and tourists.
The Minnesota Department of Natural Resources and the University ofMinnesota Sea Grant Program in 1994 surveyed boaters in Minnesota,Wisconsin and Ohio to evaluate and compare regional differences inexotic species education and awareness programs. Survey resultsindicated that “Minnesota boaters are more knowledgeable aboutexotic species issues and have already changed their behavior to agreater extent (to prevent the spread of exotics) than boaters in theother two states. This suggests that educational programs are effective.”
imposed by exotic plants and animals. The table depicts thisstress by summarizing the distribution of aquatic “prohibited”exotic species in Minnesota’s watersheds. Species in the“prohibited” category have a high potential to harm naturalecosystems, native species or the use of the state’s water re-sources. The use of prohibited exotic species is tightly regulatedto limit their introduction into Minnesota and their spreadwithin the state.
Presently, watersheds with zero or one prohibited exotic speciesare generally found along the southern, western and northernborders of the state. Watersheds that abut Lake Superior havethe highest totals. Over the next 10 years, the change in thetotal quantity of these species in each watershed will provide ameasure of the spread of harmful exotics, as well as the intro-duction of new species into the state.
Several of the prohibited exotic species are present inMinnesota’s waters as of 2000:
curly-leaf pondweedEurasian water milfoilflowering rushgrass carppurple loosestriferound gobyruffesea lampreywhite perchzebra mussel
Other prohibited species are not known to be in Minnesotawaters as of 2000:
African oxygen weedaquarium watermoss or giant salviniaAustralian stonecropbighead carpblack carpEuropean frog-bithydrillaIndian swampweednutria, any strainruddsilver carpwater aloe or water soldierswater chestnutzander
The Department of Natural Resources gathers and maintainsinformation about the locations of aquatic prohibited exoticspecies and the total quantity in each watershed. For example,watersheds with no known infestations in any lake, river, orwetland have a total of zero; those with five different speciespresent have a total of five. The number of infestations of aparticular prohibited exotic species within a watershed does notmatter in the scoring, only whether it is present or absent.
Minnesota has 81 major watersheds
Source: Minnesota Planning
Watermarks: Gauging the Flow of Progress 2000 – 2010 11. . . . . . . . . . . . . . . . . . . . . . . . . . . . . . . . . . . . . . . . . . . . . . . . . . . . . . . . . . . . . . . . . . . . . . . . . . . . . . . . . . . . . . . . . . . . . . . . . . . . . . . . . . . . . . . . . . . . . . . . . . . . . . . . . . . . . . . . . . . . . . . . . . . . . . . . . . . . . . . . . . . . . . . . .
OBJECTIVE H. Provide access to water-basedrecreation sites.
With more than 12,000 lakes and 90,000 miles of streams andrivers, Minnesota offers a wealth of water-based recreationalopportunities. The public has access to water resources forrecreation through a variety of settings, including local, stateand national parks, state and national forests, and other publicholdings. The Department of Natural Resources collects trendinformation on public access.
Indicator 9. Number of public access sites on lakes, riversand streams.
________________________________________________________________________________
1990 3,000________________________________________________________________________________
1991 3,020________________________________________________________________________________
1992 3,040________________________________________________________________________________
1993 3,060________________________________________________________________________________
1994 3,080________________________________________________________________________________
1995 3,100________________________________________________________________________________
1996 3,120________________________________________________________________________________
1997 3,140________________________________________________________________________________
1998 3,160________________________________________________________________________________
1999 3,180________________________________________________________________________________
Public access to recreational waters is growing.
Source: Department of Natural Resources
Public access sites on lakes, rivers and streams have risen from3,000 in 1990 to 3,180 in 1999. The number of sites is an indi-cator of how well the state is meeting its policy of providingaccess to water resources. These sites include boat and shoreaccess, as well as fishing piers. Public access sites help meetoutdoor recreation demands, improve the quality of life and
attract tourists. In addition to being used for fishing and launch-ing motor boats, public access sites provide opportunities forbirdwatchers and canoeists, among others.
With one boat for every six people, Minnesota ranks number oneamong all 50 states in the number of recreational watercraft per capita.
OBJECTIVE I. Improve or maintain the quality ofwater recreation.
Enjoyment and safety decline on waters subject to heavy recre-ational use. In recent years, the Department of Natural Resourceshas surveyed boaters to measure their satisfaction and levels ofuse. It also conducts fishing surveys to determine the amountand rate of fish harvest. To prevent conflicts between variousrecreational uses, surface water use regulations now apply toabout 300 separate water bodies. Fish harvest regulations ad-dress the management needs of about 100 lakes and 30 rivers.
About 600 Minnesota streams totaling nearly 2,000 miles aredesignated as trout waters.
Indicator 10. Survey of degree of satisfaction with water-related outdoor experiences.
From lakeshore homeowners to birdwatchers and swimmers,the users of Minnesota’s water resources are as diverse as thewaters themselves. Because the basin teams expressed a stronginterest in knowing how satisfied recreational users of Minne-sota waters are, Minnesota Planning, in cooperation with theDepartment of Natural Resources and other state agencies, isinitiating a survey to monitor trends in a variety of outdoor wateruses. Repeated surveys can provide a measure of the quality ofrecreational experiences and allow the state to track changesover time. No general water recreational trend information exists,and trend information for specific types of users is lacking.
1994 1995 1996 1997
19%
26%23% 22%
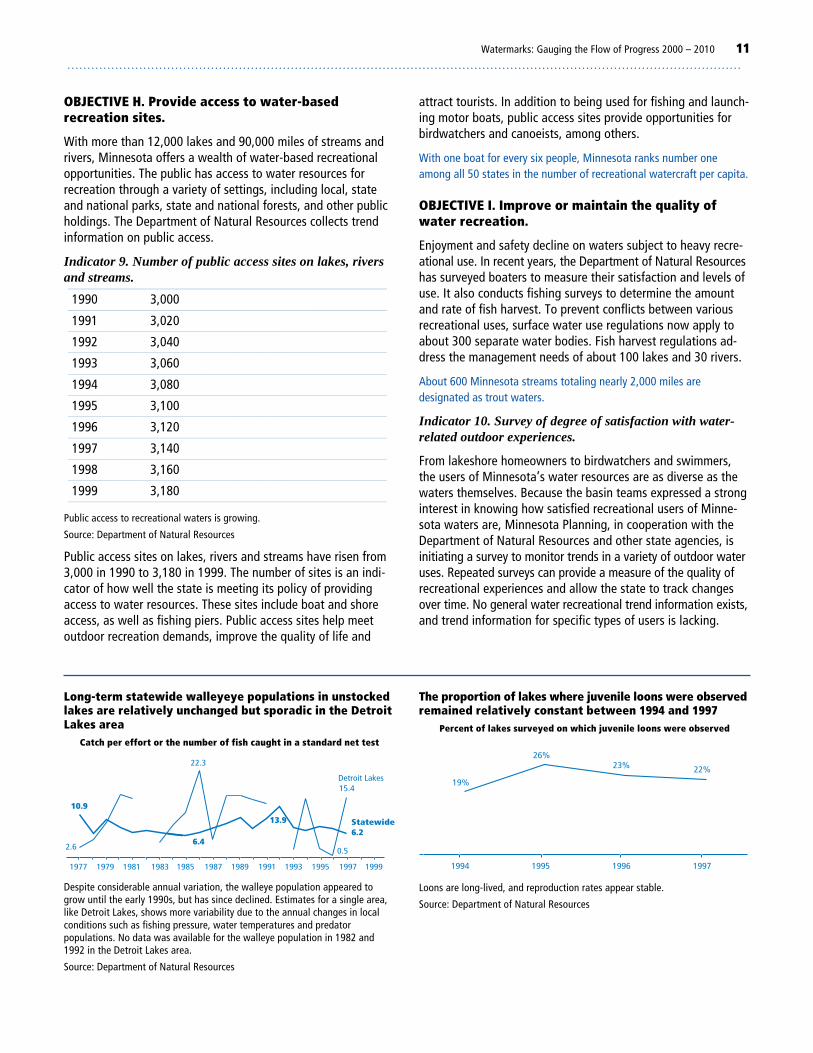
The proportion of lakes where juvenile loons were observedremained relatively constant between 1994 and 1997
Percent of lakes surveyed on which juvenile loons were observed
Loons are long-lived, and reproduction rates appear stable.
Source: Department of Natural Resources
Detroit Lakes
22.3
0.5
15.4
2.6
Statewide
10.9
6.26.4
13.9
1977 1979 1981 1983 1985 1987 1989 1991 1993 1995 1997 1999
Long-term statewide walleyeye populations in unstockedlakes are relatively unchanged but sporadic in the DetroitLakes area
Catch per effort or the number of fish caught in a standard net test
Despite considerable annual variation, the walleye population appeared togrow until the early 1990s, but has since declined. Estimates for a single area,like Detroit Lakes, shows more variability due to the annual changes in localconditions such as fishing pressure, water temperatures and predatorpopulations. No data was available for the walleye population in 1982 and1992 in the Detroit Lakes area.
Source: Department of Natural Resources
. . . . . . . . . . . . . . . . . . . . . . . . . . . . . . . . . . . . . . . . . . . . . . . . . . . . . . . . . . . . . . . . . . . . . . . . . . . . . . . . . . . . . . . . . . . . . . . . . . . . . . . . . . . . . . . . . . . . . . . . . . . . . . . . . . . . . . . . . . . . . . . . . . . . . . . . . . . . . . . . . . . . . . . . .
12 Minnesota Environmental Quality Board
surveys are conducted continually on some larger, more impor-tant lakes, such as Mille Lacs. Recreational fishing pressure onMinnesota waters is highly variable. Survey results show thatfishing pressure on walleye lakes has increased steadily sincethe 1950s. While the number and weight of walleyes caughthave remained steady, the time needed to catch a fish has in-creased. For northern pike, the number and weight of fishcaught and the time needed to catch a fish tend to decrease asfishing pressure increases.
The state of recreational boating in north-central Minnesota changedmarkedly between 1985 and 1998. A 1998 Department of NaturalResources survey of boating in that part of the state found that over the13 years, the average horsepower of boat motors increased from 46 to93. This change reflected the trend away from fishing boats, whichwere the predominant craft in use in 1985, to runabouts.
The state conducts some surveys to examine specific concernsand ensure that management goals address current issues.Boaters’ and anglers’ opinions are tracked periodically by theDepartment of Natural Resources. Between 1985 and 1998, forexample, the number of boats on lakes in the north-central lakeregion did not change significantly, yet more boaters perceivedlakes to be crowded in 1998 than in 1985 (15 percent of re-spondents versus 5 percent, respectively). Overall, satisfactionwith boating experiences is high, with only 10 percent of theboaters reporting that they are dissatisfied to any extent.
Anglers are surveyed to help determine the amount of fishingactivity and level of harvest on individual lakes. From 1935 to1994, surveys of users on 918 of the about 5,000 lakes man-aged for sport fishing were conducted. Most surveys have beenconducted on lakes that have either lake trout or walleye. Rela-tively few lakes are the focus of more than one survey, although
Watermarks: Gauging the Flow of Progress 2000 – 2010 13. . . . . . . . . . . . . . . . . . . . . . . . . . . . . . . . . . . . . . . . . . . . . . . . . . . . . . . . . . . . . . . . . . . . . . . . . . . . . . . . . . . . . . . . . . . . . . . . . . . . . . . . . . . . . . . . . . . . . . . . . . . . . . . . . . . . . . . . . . . . . . . . . . . . . . . . . . . . . . . . . . . . . . . . .
“It shall be Minnesota public policy to protect, preserve and enhance itsmany lakes as irreplaceable natural assets, held in trust for futuregenerations, while encouraging responsible current use for widelydiverse purposes.” — Report of the 1992 Lake Management Forum
The overview presented in the first part of this report providesthe general goals and objectives for the state as a whole. Thereports of the basin teams contain specific goals, objectives andindicators tailored to the particular conditions found in eachbasin. These goals and objectives, along with those for thewhole state, will be used to move toward creating strategiesand actions that will address concerns about water resources inMinnesota. Basin teams will develop targets to further imple-ment the indicators for each basin.
State agencies will use the goals, objectives, indicators andtargets to the extent possible to guide program priorities and
initiatives. Local governments play a major role in water man-agement in Minnesota and have helped shape the stateframework and the basin reports. Local governments will incor-porate these planning elements into local water plans and usethem to guide other planning efforts.
The reports of the seven basin teams reflect some similaritiesand commonalities, as well as a variety of conditions and priori-ties across the state. Basin planning efforts were alreadyprogressing in several basins when this initiative was started. Inother basins, the process of water planning is just beginning.Regardless of the stage of planning, each basin team, startingwith a similar core of state and federal agency representatives,undertook an effort unique to each basin to gather togetherrepresentatives of local government, water interests and othergroups or individuals to develop recommendations specific to
Basin conditions and planning approaches vary. . . . . . . . . . . . . . . . . . . . . . . . . . . . . . . . . . . . . . . . . . . . . . . . . . . . . . . . . . . . . . . . . . . . . . . . . . . . . . . . . . . . . . . . . . . . . . . . . . . . . . . . . . . . . . . . . . . . . . . . . . . . . . . . . . . . . . . . . . . . . . . . . . . . . . . . . . . . . . . . . . . . . . . . .
Red River Basin Rainy River Basin
Upper MississippiRiver Basin
Lake Superior Basin
St. CroixRiver Basin
LowerMississippiRiver Basin
CedarRiver Basin
MinnesotaRiver Basin
MissouriRiver Basin
Des MoinesRiver Basin
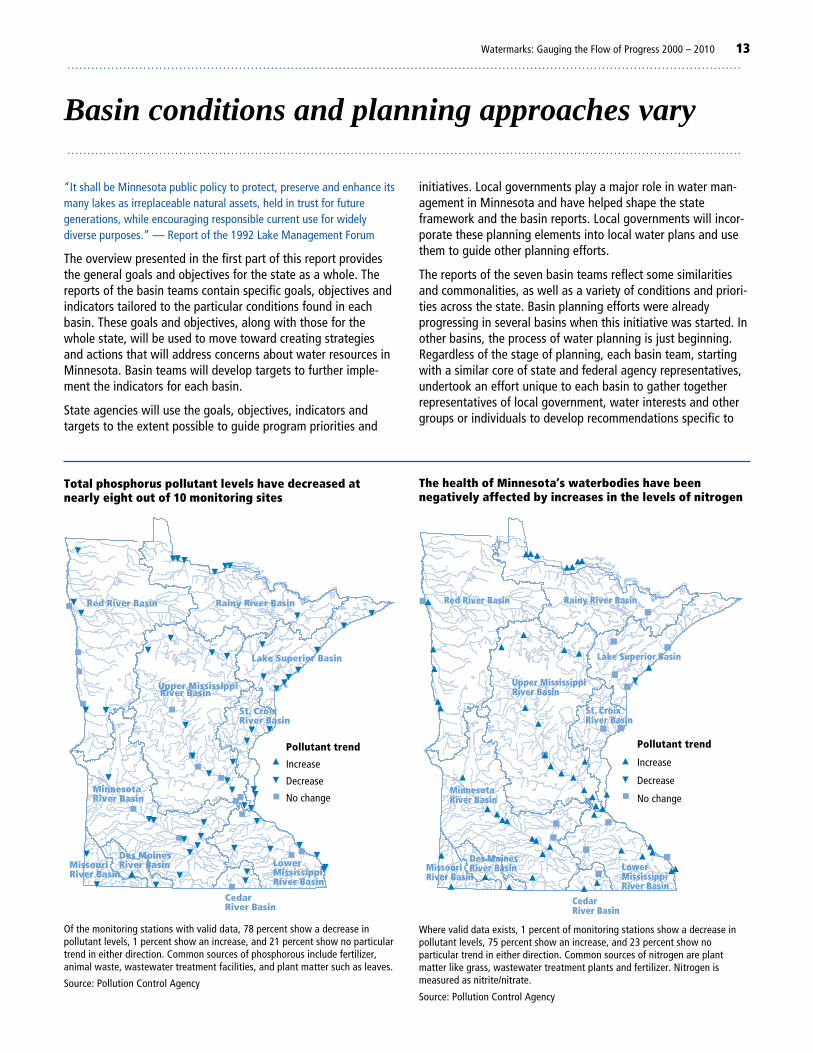
Total phosphorus pollutant levels have decreased atnearly eight out of 10 monitoring sites
Of the monitoring stations with valid data, 78 percent show a decrease inpollutant levels, 1 percent show an increase, and 21 percent show no particulartrend in either direction. Common sources of phosphorous include fertilizer,animal waste, wastewater treatment facilities, and plant matter such as leaves.
Source: Pollution Control Agency
Red River Basin Rainy River Basin
Upper MississippiRiver Basin
Lake Superior Basin
St. CroixRiver Basin
LowerMississippiRiver Basin
CedarRiver Basin
MinnesotaRiver Basin
MissouriRiver Basin
Des MoinesRiver Basin
The health of Minnesota’s waterbodies have beennegatively affected by increases in the levels of nitrogen
Where valid data exists, 1 percent of monitoring stations show a decrease inpollutant levels, 75 percent show an increase, and 23 percent show noparticular trend in either direction. Common sources of nitrogen are plantmatter like grass, wastewater treatment plants and fertilizer. Nitrogen ismeasured as nitrite/nitrate.
Source: Pollution Control Agency
Pollutant trend
Increase
Decrease
No change
Pollutant trend
Increase
Decrease
No change
. . . . . . . . . . . . . . . . . . . . . . . . . . . . . . . . . . . . . . . . . . . . . . . . . . . . . . . . . . . . . . . . . . . . . . . . . . . . . . . . . . . . . . . . . . . . . . . . . . . . . . . . . . . . . . . . . . . . . . . . . . . . . . . . . . . . . . . . . . . . . . . . . . . . . . . . . . . . . . . . . . . . . . . . .
14 Minnesota Environmental Quality Board
their basin for the state water plan. Some teams added mem-bers from other organizations, created an advisory group oradapted an existing board, and all held public meetings and metindividually with various local governments.
Most basins share some border or drainage with neighboringstates. In addition, the Red River, Rainy River and Lake SuperiorBasins include international waters. These three basins are alsounder the jurisdiction of the International Joint Commission,which was established by the United States and Canada in a1909 treaty and has goals and objectives for these basins.
Based on feedback from the public and other sources, basinteams were asked to report on several points, beginning withsuggested changes to the draft goals, objectives and indicatorsof the state plan. They were also to go beyond the listed indica-tors of water resource condition, such as water quality andwater quantity, and include indicators of human behavior — orpressures — on the water resource, such as how much water isused and how land is used or managed. When examined withthe condition indicators and in the context of a basin’s geology,soils and climate, pressure indicators highlight human behaviors
that may adversely affect water resources. Once identified,these behaviors can be addressed in planning.
Basin teams were asked to develop 10-year targets for theindicators, but due to the status of planning within many ba-sins, only three teams recommended targets. Teams were alsoto report on water-related issues of importance in their basin.
Several issues were raised by many basins, including:
Local planning and funding. Strengthening local plan-ning and ensuring adequate financial resources for local watermanagement were key issues in most basins. The basin teams’emphasis on funding issues illustrates the need to explore ap-proaches and priorities tied to local resource governancecapability. Some areas have a strong local tax capacity, butothers do not. The committee for the Twin Cities region recom-mended expanding self-funded local entities, but others lookedfor more state and federal assistance.
Land use. Land use and its relationship to the condition andquality of lakes, streams and groundwater was of interest inevery basin. Pressures from shoreland development, impervious
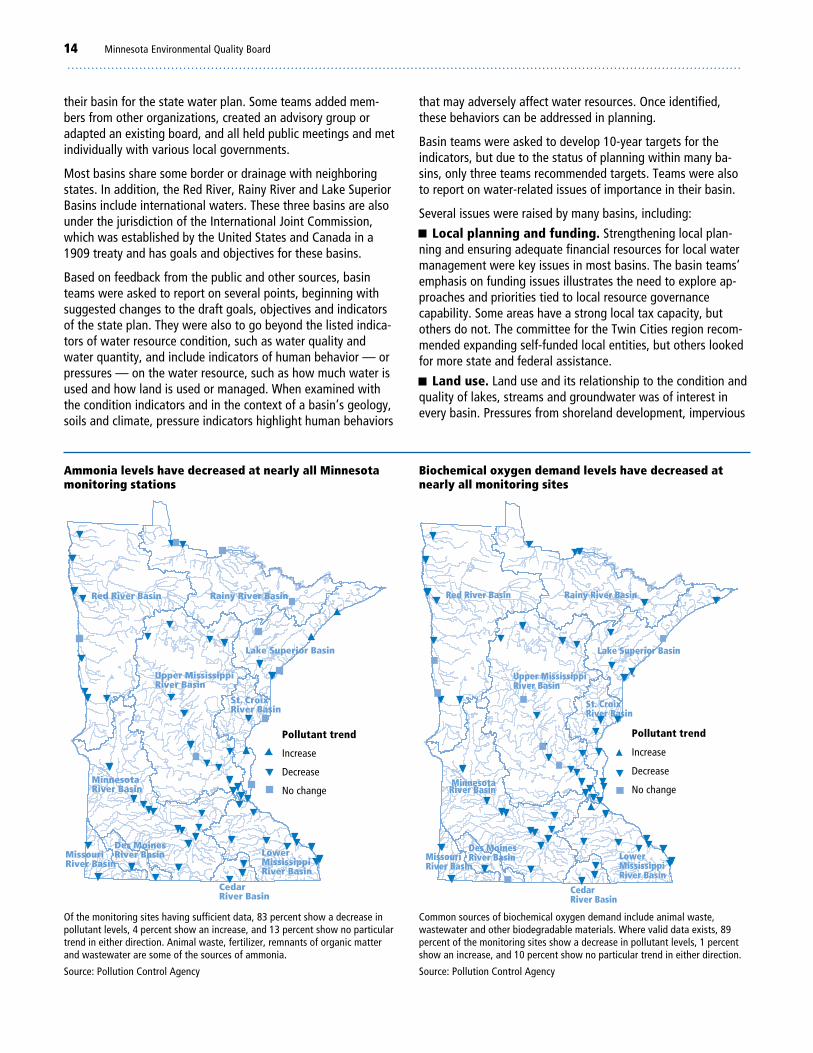
Ammonia levels have decreased at nearly all Minnesotamonitoring stations
Of the monitoring sites having sufficient data, 83 percent show a decrease inpollutant levels, 4 percent show an increase, and 13 percent show no particulartrend in either direction. Animal waste, fertilizer, remnants of organic matterand wastewater are some of the sources of ammonia.
Source: Pollution Control Agency
Red River Basin Rainy River Basin
Upper MississippiRiver Basin
Lake Superior Basin
St. CroixRiver Basin
LowerMississippiRiver Basin
CedarRiver Basin
MinnesotaRiver Basin
MissouriRiver Basin
Des MoinesRiver Basin
Red River Basin Rainy River Basin
Upper MississippiRiver Basin
Lake Superior Basin
St. CroixRiver Basin
LowerMississippiRiver Basin
CedarRiver Basin
MinnesotaRiver Basin
MissouriRiver Basin
Des MoinesRiver Basin
Biochemical oxygen demand levels have decreased atnearly all monitoring sites
Common sources of biochemical oxygen demand include animal waste,wastewater and other biodegradable materials. Where valid data exists, 89percent of the monitoring sites show a decrease in pollutant levels, 1 percentshow an increase, and 10 percent show no particular trend in either direction.
Source: Pollution Control Agency
Pollutant trend
Increase
Decrease
No change
Pollutant trend
Increase
Decrease
No change
Watermarks: Gauging the Flow of Progress 2000 – 2010 15. . . . . . . . . . . . . . . . . . . . . . . . . . . . . . . . . . . . . . . . . . . . . . . . . . . . . . . . . . . . . . . . . . . . . . . . . . . . . . . . . . . . . . . . . . . . . . . . . . . . . . . . . . . . . . . . . . . . . . . . . . . . . . . . . . . . . . . . . . . . . . . . . . . . . . . . . . . . . . . . . . . . . . . . .
surfaces, changes in vegetative cover, drainage and types oftillage were among the many specific indicators listed. The landuse issues tied to flooding were emphasized as a concern inseveral basins. Soil erosion, excess nutrients in waters andproperty damage also were linked to flooding and land use.
Prevention. Most basin teams noted the high quality ofwater resources and the importance of keeping these resourcesin top condition. The diversity and integrity of the aquatic eco-systems need to be better understood and protected. Concernsabout protecting trout streams, native fish species and thethreatened and endangered mussel species were stressed bymany.
Education and stewardship. Water resources are greatlyaffected by the actions of individuals who sometimes unknow-ingly pollute. Problems with water resources are often the resultof poor decisions about land use or water use. Education givesthe public the information needed to “do the right thing.” Get-ting volunteers to monitor lake or stream clarity, promote bestmanagement practices and inform their neighbors were cited bybasin teams as a cornerstone of educational efforts. Forming
lake associations or organizing preventive or restorationprojects also can contribute to good stewardship.
Climate effects. Because all aspects of the environment areinterrelated, all of the basin teams noted that weather andclimate change must be considered in planning for Minnesota’swater resources. While many aspects of climate change are un-known, drought and flooding, as well as effects from changes intemperature, occur periodically and need to be taken into account.
Coordination. Coordination is necessary because myriadlocal, state and federal government and even internationalentities have roles in water management. Governor Ventura’sWater Management Unification Initiative is a first step in thenew process. It needs to continue and be strengthened.
The following summaries of basin team reports review the sta-tus of planning in each basin; note statewide goals, objectivesand indicators that are of particular importance in the basin;identify unique objectives and environmental and pressureindicators for the basin; and discuss the next steps for waterplanning in the basin.
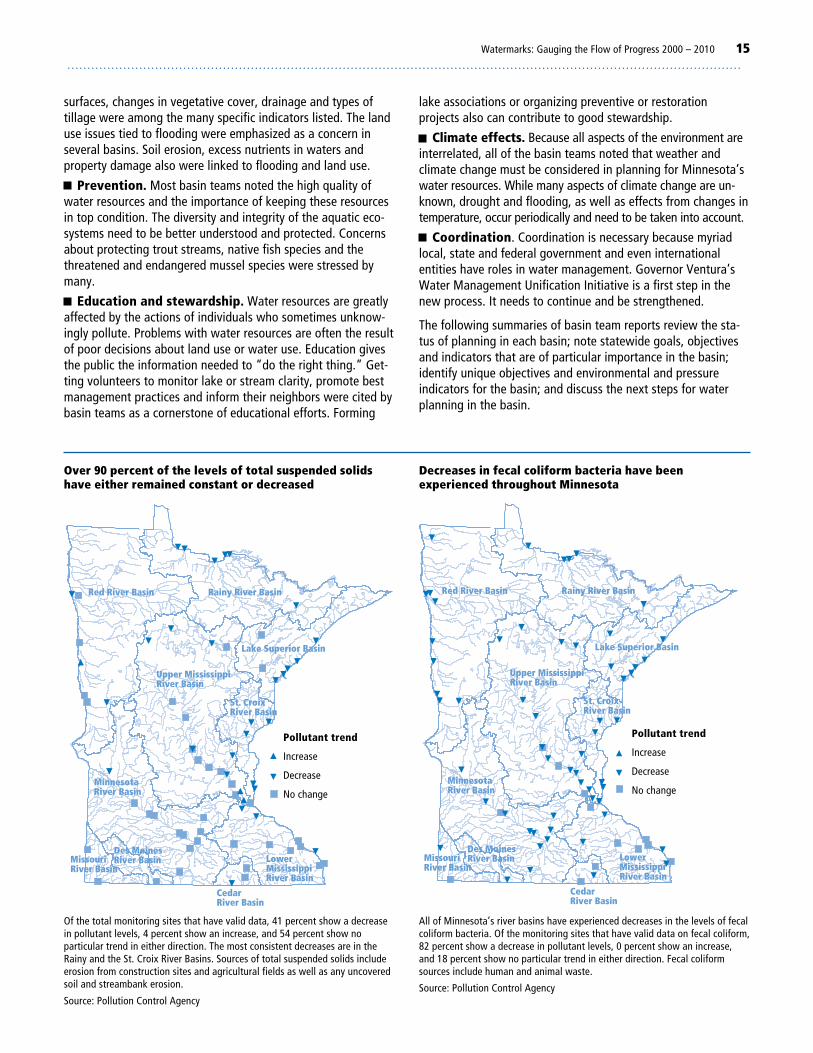
Over 90 percent of the levels of total suspended solidshave either remained constant or decreased
Of the total monitoring sites that have valid data, 41 percent show a decreasein pollutant levels, 4 percent show an increase, and 54 percent show noparticular trend in either direction. The most consistent decreases are in theRainy and the St. Croix River Basins. Sources of total suspended solids includeerosion from construction sites and agricultural fields as well as any uncoveredsoil and streambank erosion.
Source: Pollution Control Agency
Red River Basin Rainy River Basin
Upper MississippiRiver Basin
Lake Superior Basin
St. CroixRiver Basin
LowerMississippiRiver Basin
CedarRiver Basin
MinnesotaRiver Basin
MissouriRiver Basin
Des MoinesRiver Basin
Decreases in fecal coliform bacteria have beenexperienced throughout Minnesota
All of Minnesota’s river basins have experienced decreases in the levels of fecalcoliform bacteria. Of the monitoring sites that have valid data on fecal coliform,82 percent show a decrease in pollutant levels, 0 percent show an increase,and 18 percent show no particular trend in either direction. Fecal coliformsources include human and animal waste.
Source: Pollution Control Agency
Red River Basin Rainy River Basin
Upper MississippiRiver Basin
Lake Superior Basin
St. CroixRiver Basin
LowerMississippiRiver Basin
CedarRiver Basin
MinnesotaRiver Basin
MissouriRiver Basin
Des MoinesRiver Basin
Pollutant trend
Increase
Decrease
No change
Pollutant trend
Increase
Decrease
No change
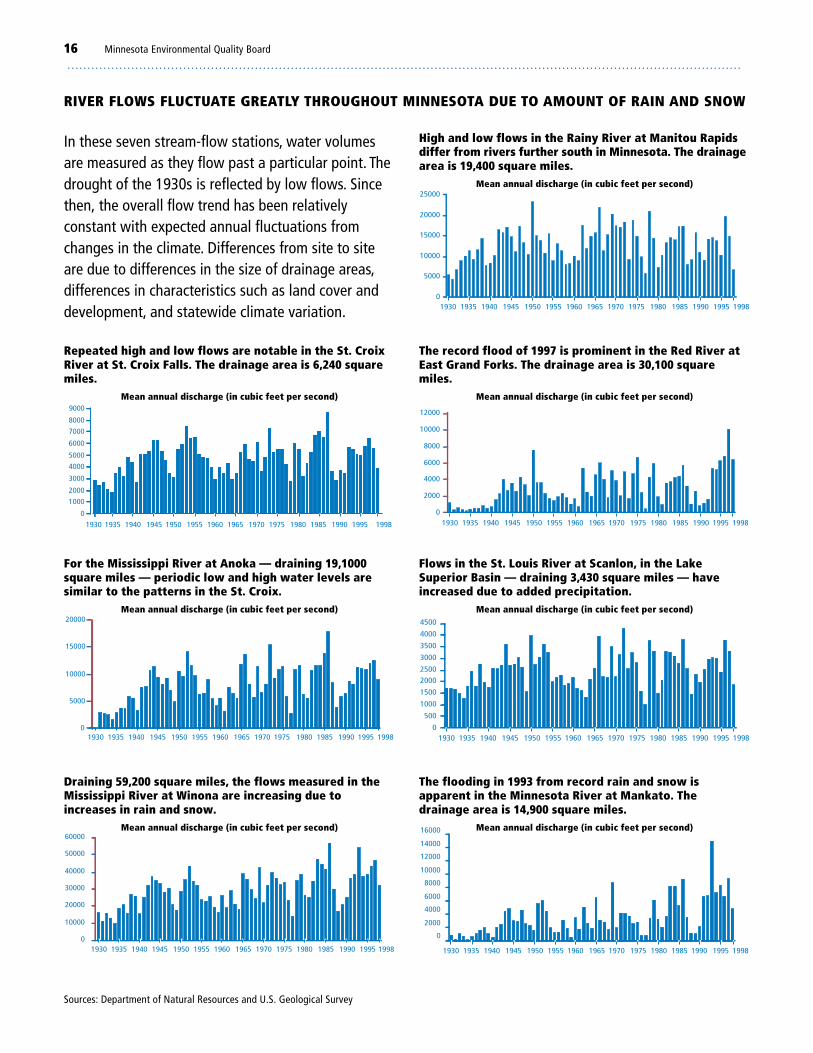
. . . . . . . . . . . . . . . . . . . . . . . . . . . . . . . . . . . . . . . . . . . . . . . . . . . . . . . . . . . . . . . . . . . . . . . . . . . . . . . . . . . . . . . . . . . . . . . . . . . . . . . . . . . . . . . . . . . . . . . . . . . . . . . . . . . . . . . . . . . . . . . . . . . . . . . . . . . . . . . . . . . . . . . . .
16 Minnesota Environmental Quality Board
High and low flows in the Rainy River at Manitou Rapidsdiffer from rivers further south in Minnesota. The drainagearea is 19,400 square miles.
Mean annual discharge (in cubic feet per second)
RIVER FLOWS FLUCTUATE GREATLY THROUGHOUT MINNESOTA DUE TO AMOUNT OF RAIN AND SNOW
In these seven stream-flow stations, water volumesare measured as they flow past a particular point. Thedrought of the 1930s is reflected by low flows. Sincethen, the overall flow trend has been relativelyconstant with expected annual fluctuations fromchanges in the climate. Differences from site to siteare due to differences in the size of drainage areas,differences in characteristics such as land cover anddevelopment, and statewide climate variation.
Sources: Department of Natural Resources and U.S. Geological Survey
1930 1935 1940 1945 1950 1955 1960 1965 1970 1975 1980 1985 1990 1995 1998
0
1000
2000
3000
4000
5000
6000
7000
8000
09000
0
5000
10000
15000
20000
1930 1935 1940 1945 1950 1955 1960 1965 1970 1975 1980 1985 1990 1995 1998
0
10000
20000
30000
40000
50000
60000
1930 1935 1940 1945 1950 1955 1960 1965 1970 1975 1980 1985 1990 1995 1998
1930 1935 1940 1945 1950 1955 1960 1965 1970 1975 1980 1985 1990 1995 19980
5000
10000
15000
20000
25000
1930 1935 1940 1945 1950 1955 1960 1965 1970 1975 1980 1985 1990 1995 19980
2000
4000
6000
8000
10000
12000
0
500
1000
1500
20002500
3000
3500
4000
4500
1930 1935 1940 1945 1950 1955 1960 1965 1970 1975 1980 1985 1990 1995 1998
0
2000
4000
6000
8000
10000
12000
14000
16000
1930 1935 1940 1945 1950 1955 1960 1965 1970 1975 1980 1985 1990 1995 1998
Repeated high and low flows are notable in the St. CroixRiver at St. Croix Falls. The drainage area is 6,240 squaremiles.
Mean annual discharge (in cubic feet per second)
The record flood of 1997 is prominent in the Red River atEast Grand Forks. The drainage area is 30,100 squaremiles.
Mean annual discharge (in cubic feet per second)
For the Mississippi River at Anoka — draining 19,1000square miles — periodic low and high water levels aresimilar to the patterns in the St. Croix.
Mean annual discharge (in cubic feet per second)
Flows in the St. Louis River at Scanlon, in the LakeSuperior Basin — draining 3,430 square miles — haveincreased due to added precipitation.
Mean annual discharge (in cubic feet per second)
Draining 59,200 square miles, the flows measured in theMississippi River at Winona are increasing due toincreases in rain and snow.
Mean annual discharge (in cubic feet per second)
The flooding in 1993 from record rain and snow isapparent in the Minnesota River at Mankato. Thedrainage area is 14,900 square miles.
Mean annual discharge (in cubic feet per second)
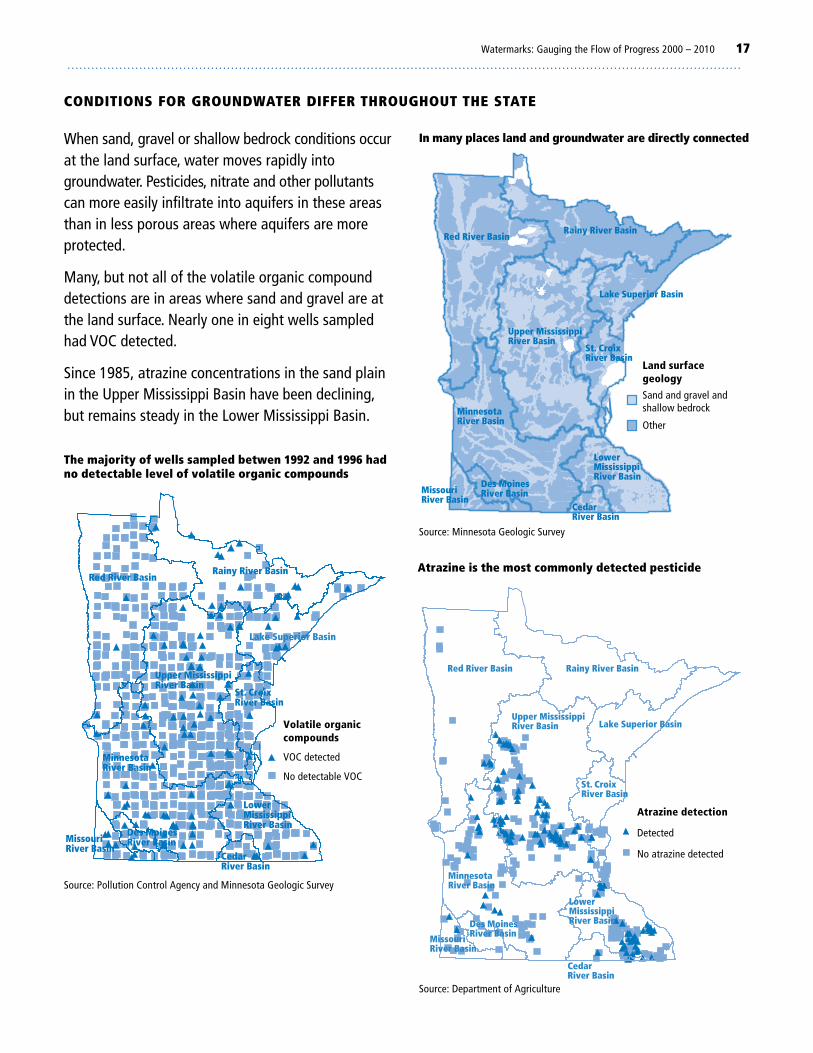
Watermarks: Gauging the Flow of Progress 2000 – 2010 17. . . . . . . . . . . . . . . . . . . . . . . . . . . . . . . . . . . . . . . . . . . . . . . . . . . . . . . . . . . . . . . . . . . . . . . . . . . . . . . . . . . . . . . . . . . . . . . . . . . . . . . . . . . . . . . . . . . . . . . . . . . . . . . . . . . . . . . . . . . . . . . . . . . . . . . . . . . . . . . . . . . . . . . . .
When sand, gravel or shallow bedrock conditions occurat the land surface, water moves rapidly intogroundwater. Pesticides, nitrate and other pollutantscan more easily infiltrate into aquifers in these areasthan in less porous areas where aquifers are moreprotected.
Many, but not all of the volatile organic compounddetections are in areas where sand and gravel are atthe land surface. Nearly one in eight wells sampledhad VOC detected.
Since 1985, atrazine concentrations in the sand plainin the Upper Mississippi Basin have been declining,but remains steady in the Lower Mississippi Basin.
CONDITIONS FOR GROUNDWATER DIFFER THROUGHOUT THE STATE
Red River BasinRainy River Basin
Upper MississippiRiver Basin
Lake Superior Basin
St. CroixRiver Basin
LowerMississippiRiver Basin
CedarRiver Basin
MinnesotaRiver Basin
MissouriRiver Basin
Des MoinesRiver Basin
Land surfacegeology
Sand and gravel andshallow bedrock
Other
In many places land and groundwater are directly connected
Lake Superior Basin
Red River BasinRainy River Basin
Upper MississippiRiver Basin
St. CroixRiver Basin
LowerMississippiRiver Basin
CedarRiver Basin
MinnesotaRiver Basin
MissouriRiver Basin
Des MoinesRiver Basin
The majority of wells sampled betwen 1992 and 1996 hadno detectable level of volatile organic compounds
Source: Pollution Control Agency and Minnesota Geologic Survey
Volatile organiccompounds
VOC detected
No detectable VOC
Red River Basin Rainy River Basin
Upper MississippiRiver Basin Lake Superior Basin
St. CroixRiver Basin
LowerMississippiRiver Basin
CedarRiver Basin
MinnesotaRiver Basin
MissouriRiver Basin
Des MoinesRiver Basin
Atrazine detection
Detected
No atrazine detected
Source: Department of Agriculture
Atrazine is the most commonly detected pesticide
Source: Minnesota Geologic Survey
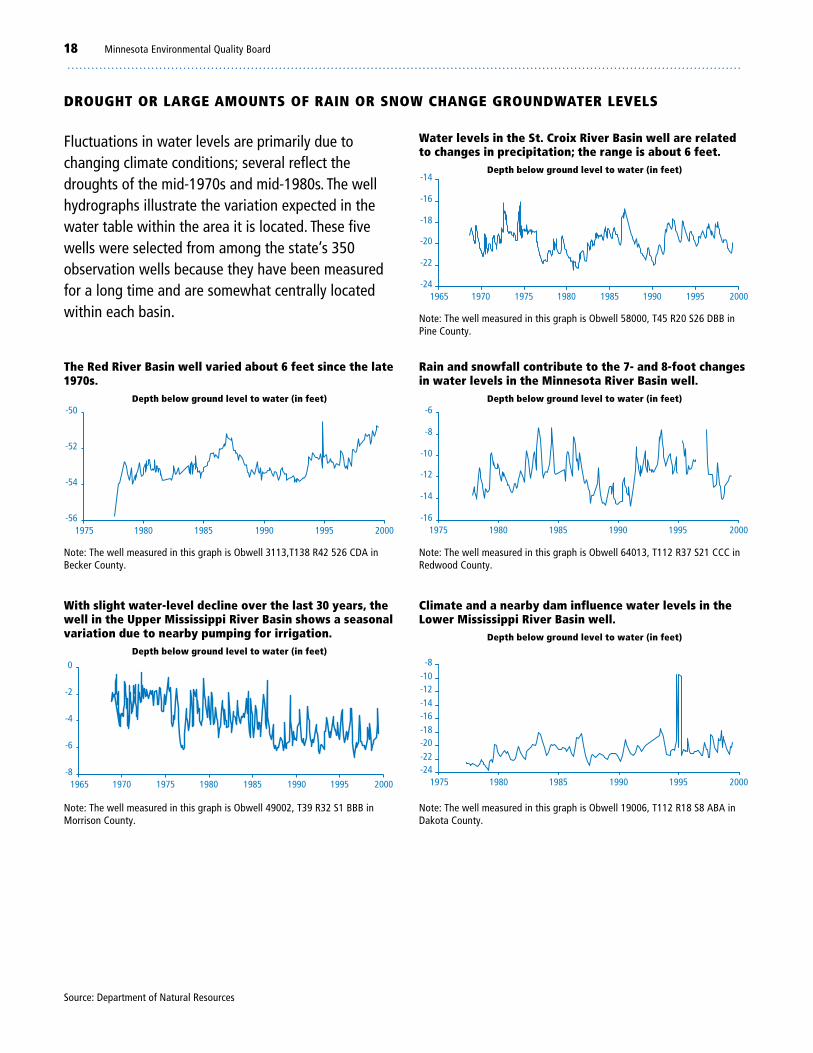
. . . . . . . . . . . . . . . . . . . . . . . . . . . . . . . . . . . . . . . . . . . . . . . . . . . . . . . . . . . . . . . . . . . . . . . . . . . . . . . . . . . . . . . . . . . . . . . . . . . . . . . . . . . . . . . . . . . . . . . . . . . . . . . . . . . . . . . . . . . . . . . . . . . . . . . . . . . . . . . . . . . . . . . . .
18 Minnesota Environmental Quality Board
-24
-22
-20
-18
-16
-14
1965 1970 1975 1980 1985 1990 1995 2000
DROUGHT OR LARGE AMOUNTS OF RAIN OR SNOW CHANGE GROUNDWATER LEVELS
Fluctuations in water levels are primarily due tochanging climate conditions; several reflect thedroughts of the mid-1970s and mid-1980s. The wellhydrographs illustrate the variation expected in thewater table within the area it is located. These fivewells were selected from among the state’s 350observation wells because they have been measuredfor a long time and are somewhat centrally locatedwithin each basin.
Rain and snowfall contribute to the 7- and 8-foot changesin water levels in the Minnesota River Basin well.
Depth below ground level to water (in feet)
The Red River Basin well varied about 6 feet since the late1970s.
Depth below ground level to water (in feet)
-56
-54
-52
-50
1975 1980 1985 1990 1995 2000
Water levels in the St. Croix River Basin well are relatedto changes in precipitation; the range is about 6 feet.
Depth below ground level to water (in feet)
-16
-14
-12
-10
-8
-6
1975 1980 1985 1990 1995 2000
With slight water-level decline over the last 30 years, thewell in the Upper Mississippi River Basin shows a seasonalvariation due to nearby pumping for irrigation.
Depth below ground level to water (in feet)
Climate and a nearby dam influence water levels in theLower Mississippi River Basin well.
Depth below ground level to water (in feet)
Note: The well measured in this graph is Obwell 3113,T138 R42 526 CDA inBecker County.
Note: The well measured in this graph is Obwell 58000, T45 R20 S26 DBB inPine County.
-8
-6
-4
-2
0
1965 1970 1975 1980 1985 1990 1995 2000
-24-22-20-18-16-14-12-10-8
1975 1980 1985 1990 1995 2000
Note: The well measured in this graph is Obwell 64013, T112 R37 S21 CCC inRedwood County.
Note: The well measured in this graph is Obwell 19006, T112 R18 S8 ABA inDakota County.
Note: The well measured in this graph is Obwell 49002, T39 R32 S1 BBB inMorrison County.
Source: Department of Natural Resources
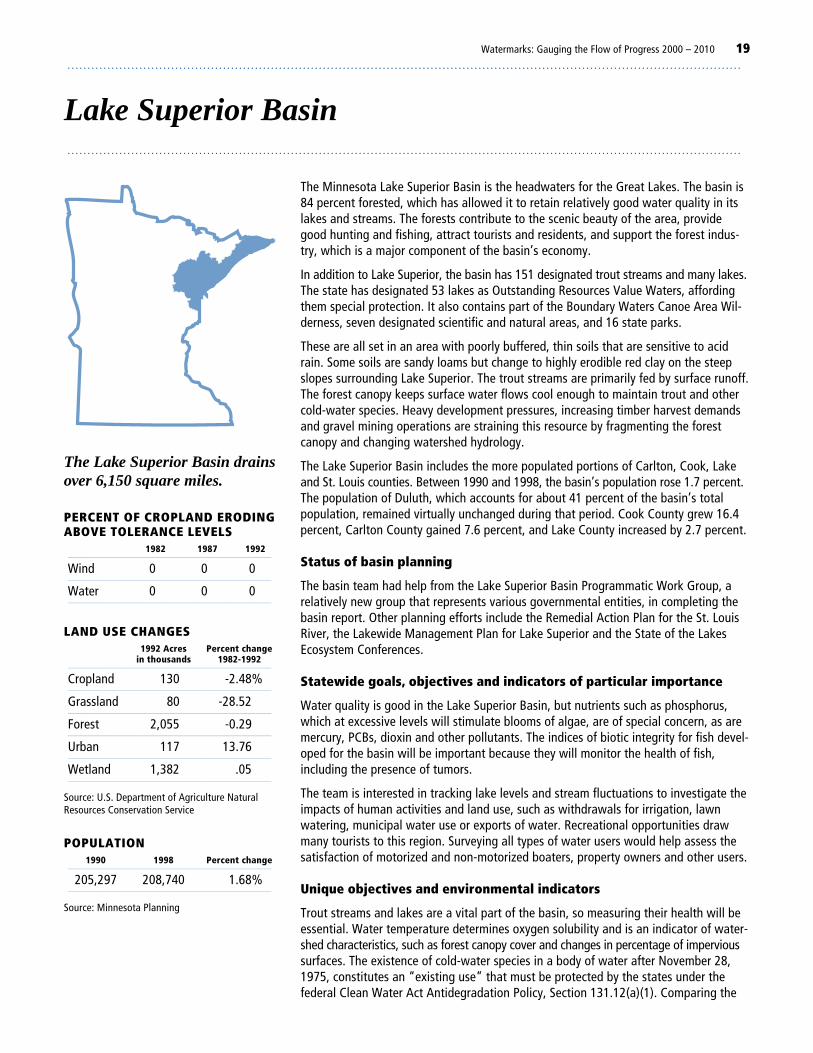
Watermarks: Gauging the Flow of Progress 2000 – 2010 19. . . . . . . . . . . . . . . . . . . . . . . . . . . . . . . . . . . . . . . . . . . . . . . . . . . . . . . . . . . . . . . . . . . . . . . . . . . . . . . . . . . . . . . . . . . . . . . . . . . . . . . . . . . . . . . . . . . . . . . . . . . . . . . . . . . . . . . . . . . . . . . . . . . . . . . . . . . . . . . . . . . . . . . . .
Lake Superior Basin. . . . . . . . . . . . . . . . . . . . . . . . . . . . . . . . . . . . . . . . . . . . . . . . . . . . . . . . . . . . . . . . . . . . . . . . . . . . . . . . . . . . . . . . . . . . . . . . . . . . . . . . . . . . . . . . . . . . . . . . . . . . . . . . . . . . . . . . . . . . . . . . . . . . . . . . . . . . . . . . . . . . . . . . .
The Minnesota Lake Superior Basin is the headwaters for the Great Lakes. The basin is84 percent forested, which has allowed it to retain relatively good water quality in itslakes and streams. The forests contribute to the scenic beauty of the area, providegood hunting and fishing, attract tourists and residents, and support the forest indus-try, which is a major component of the basin’s economy.
In addition to Lake Superior, the basin has 151 designated trout streams and many lakes.The state has designated 53 lakes as Outstanding Resources Value Waters, affordingthem special protection. It also contains part of the Boundary Waters Canoe Area Wil-derness, seven designated scientific and natural areas, and 16 state parks.
These are all set in an area with poorly buffered, thin soils that are sensitive to acidrain. Some soils are sandy loams but change to highly erodible red clay on the steepslopes surrounding Lake Superior. The trout streams are primarily fed by surface runoff.The forest canopy keeps surface water flows cool enough to maintain trout and othercold-water species. Heavy development pressures, increasing timber harvest demandsand gravel mining operations are straining this resource by fragmenting the forestcanopy and changing watershed hydrology.
The Lake Superior Basin includes the more populated portions of Carlton, Cook, Lakeand St. Louis counties. Between 1990 and 1998, the basin’s population rose 1.7 percent.The population of Duluth, which accounts for about 41 percent of the basin’s totalpopulation, remained virtually unchanged during that period. Cook County grew 16.4percent, Carlton County gained 7.6 percent, and Lake County increased by 2.7 percent.
Status of basin planning
The basin team had help from the Lake Superior Basin Programmatic Work Group, arelatively new group that represents various governmental entities, in completing thebasin report. Other planning efforts include the Remedial Action Plan for the St. LouisRiver, the Lakewide Management Plan for Lake Superior and the State of the LakesEcosystem Conferences.
Statewide goals, objectives and indicators of particular importance
Water quality is good in the Lake Superior Basin, but nutrients such as phosphorus,which at excessive levels will stimulate blooms of algae, are of special concern, as aremercury, PCBs, dioxin and other pollutants. The indices of biotic integrity for fish devel-oped for the basin will be important because they will monitor the health of fish,including the presence of tumors.
The team is interested in tracking lake levels and stream fluctuations to investigate theimpacts of human activities and land use, such as withdrawals for irrigation, lawnwatering, municipal water use or exports of water. Recreational opportunities drawmany tourists to this region. Surveying all types of water users would help assess thesatisfaction of motorized and non-motorized boaters, property owners and other users.
Unique objectives and environmental indicators
Trout streams and lakes are a vital part of the basin, so measuring their health will beessential. Water temperature determines oxygen solubility and is an indicator of water-shed characteristics, such as forest canopy cover and changes in percentage of impervioussurfaces. The existence of cold-water species in a body of water after November 28,1975, constitutes an “existing use” that must be protected by the states under thefederal Clean Water Act Antidegradation Policy, Section 131.12(a)(1). Comparing the
The Lake Superior Basin drainsover 6,150 square miles.
PERCENT OF CROPLAND ERODINGABOVE TOLERANCE LEVELS
1982 1987 1992___________________________________________________
Wind 0 0 0___________________________________________________
Water 0 0 0___________________________________________________
LAND USE CHANGES1992 Acres Percent change
in thousands 1982-1992___________________________________________________
Cropland 130 -2.48%___________________________________________________
Grassland 80 -28.52___________________________________________________
Forest 2,055 -0.29___________________________________________________
Urban 117 13.76___________________________________________________
Wetland 1,382 .05___________________________________________________
Source: U.S. Department of Agriculture NaturalResources Conservation Service
POPULATION1990 1998 Percent change
___________________________________________________
205,297 208,740 1.68%___________________________________________________
Source: Minnesota Planning
. . . . . . . . . . . . . . . . . . . . . . . . . . . . . . . . . . . . . . . . . . . . . . . . . . . . . . . . . . . . . . . . . . . . . . . . . . . . . . . . . . . . . . . . . . . . . . . . . . . . . . . . . . . . . . . . . . . . . . . . . . . . . . . . . . . . . . . . . . . . . . . . . . . . . . . . . . . . . . . . . . . . . . . . .
20 Minnesota Environmental Quality Board
current status of cold-water fish such as brook and rainbowtrout in streams and lake trout and splake in lakes with whatexisted since 1975 would show if management efforts are pro-tecting the integrity of the basin’s streams and lakes, andthereby protecting existing uses.
Pollutants such as mercury, PCBs and dioxin are major waterquality concerns. Not only do these threaten recreational use,but they also dramatically affect the fish and wildlife that relyon the waters. Accumulated levels of toxic substances in fish isof particular concern.
The habitat of wild rice has been on the decline in the area.Measurement of remaining and reestablished stands of wild ricecould be a useful indicator of lake and watershed health, aswell as of a historically self-sustaining aquatic plant community.
Some of the exotic species in the Lake Superior Basin are uniquein the state; most of these have been carried into the area byinternational and regional shipping traffic. The exotic species ofconcern in the basin include purple loosestrife, ruffe, roundgobey, spiney water fleas, zebra mussels and rusty crayfish.
Because tourism is vital for the economy of the basin, the num-ber of resorts and swimming beaches is important. Trackingincreases year after year is simple and inexpensive. Additionaltrends in recreational opportunities may be established throughthe use of Department of Natural Resources public resourceinformation maps, which identify public lands available forrecreational use.
Public Recreation Information Maps bring together the most up-to-dateinformation on federal, state and county lands and their recreationalfacilities. They make it easier to find unique spots for outdoorenjoyment. Each map displays parks, forests, scientific and naturalareas, waterfowl production areas and wildlife management areas. Inaddition, each map shows facilities such as state trails, fishing piers,campgrounds, historic sites and more.
Unique objectives and pressure indicators
To better control pollutants, efforts must be made to enforceexisting laws and protections. Both wastewater and septic systemshave guidelines that must be followed to ensure compliance.
Septic system compliance is crucial to maintaining good waterquality in Minnesota lakes. Compliance trends are a good indi-cator of the how well private citizens are doing at limiting thepollution of water. Wastewater permit violations are relativelycommon, and tracking the number will hold businesses andpublic utilities accountable.
Many types of land uses pose a threat to water resources.Shorelands are especially sensitive. Tracking the percentchanges in the shoreland impact zone (area half-way to the
allowed building line) would provide a general barometer ofriver and lake health. Changes in forest canopy, for instance,can have a ripple effect on water temperature, erosion andsediment loads. Farming this zone can lead to nutrient andpesticides reaching the water. Developments add impervioussurfaces and fertilized lawns. Shorelines cleared of trees reduceleaves and downed trees in the water that add to fish habitat.Lake vegetation cleared for swimming beaches and boat accessreduces fish habitat. More positive changes could be assessedby tracking the number of revegetation and riparian area man-agement plans.
Acid rain forms when sulfur and nitrogen oxides from air pollution mixwith moisture in the atmosphere. The acids fall to earth in rain, fog ordust where they can make lakes too acidic for fish and other aquatic lifeto survive. At least 2,200 Minnesota lakes are vulnerable to acid rain.
Other issues of significance in the basin
Citizens are a key part of the political process and need to beinvolved in finding and implementing solutions to problems thataffect Minnesota’s waters. For this reason, the basin team rec-ommends a goal of having Minnesotans participate in thestewardship of the waters of the state.
A special objective would have citizens actively involved inmonitoring and managing basin water resources and water-sheds. Citizens currently voluntarily conduct monitoring —including water levels, clarity in lakes and rainfall — for severalstate agencies. Without this data collection effort, the agencies,given their limited funding and staff, would not be able to pro-vide the information now available.
Counting the number of lake and river associations or citizensdoing water monitoring would show success in this area. Thenumber of people participating in environmental education andmonitoring programs would also reflect citizen involvement.
Next steps
The Lake Superior Basin Team and Programmatic Work Groupsare working on a plan to be completed December 2001. Thevision is that the state water plan will complement the basinplan, and together, they will be a useful tool for protecting andimproving Minnesota’s water resources.
Basin team
Pollution Control Agency; Minnesota departments of NaturalResources, Agriculture and Health; Board of Water and SoilResources; U.S. Department of Agriculture Natural ResourcesConservation Service; and American Indian tribal, county andlocal governments involved with natural resource and land useissues.
Watermarks: Gauging the Flow of Progress 2000 – 2010 21. . . . . . . . . . . . . . . . . . . . . . . . . . . . . . . . . . . . . . . . . . . . . . . . . . . . . . . . . . . . . . . . . . . . . . . . . . . . . . . . . . . . . . . . . . . . . . . . . . . . . . . . . . . . . . . . . . . . . . . . . . . . . . . . . . . . . . . . . . . . . . . . . . . . . . . . . . . . . . . . . . . . . . . . .
SELECTED UNIQUE ENVIRONMENTAL CONDITION INDICATORS IN THE LAKE SUPERIOR BASIN
Goal: Minnesotans will improve the quality of water resources.
OBJECTIVES INDICATORS
Protect and improve water quality inrivers, streams and other watercourses.
~ Biochemical oxygen demand~ Stream water temperature~ Expanded fish advisories~ Indices of fish tumors~ Cold-water fish species that have existed or did exist after 1975
Protect and improve lake waterquality.
~ Cold-water fish species that have existed or did exist after 1975~ Indices of fish tumors~ Expanded fish advisories
Protect and improve groundwaterquality.
~ Chloride
Goal: Minnesotans will conserve water supplies and maintain the diverse characteristics of water resources togive future generations a healthy and a strong economy.
OBJECTIVES INDICATORS
Maintain the hydrologic characteris-tics of surface water bodies thatsupport beneficial uses.
~ Changes in wetland acres, type and function
Goal: Minnesotans will restore and maintain healthy ecosystems that support diverse plants and wildlife.
OBJECTIVES INDICATORS
Ensure that aquatic environmentshave conditions suitable for themaintenance of healthy self-sustain-ing communities of plants and animals.
~ Remaining and reestablished wild rice stands
Goal: Minnesotans will have diverse opportunities to enjoy the state’s water resources.
OBJECTIVES INDICATORS
Provide access to water recreationsites.
~ Number of public swimming beaches~ Number of resorts operating on basin waters~ Expansion of recreation sites, as indicated on public recreation information maps
Improve or maintain the quality ofwater recreation.
~ Property owners’ satisfaction with their lake experience
SELECTED UNIQUE PRESSURE INDICATORS IN THE LAKE SUPERIOR BASIN
Goal: Minnesotans will improve the quality of water resources.
OBJECTIVES INDICATORS
Protect and improve the quality inrivers, streams and other watercourses.
~ Percentage of land conversion in the shoreland impact zone
Protect and improve lake waterquality.
~ Percentage of land conversion in the shoreland impact zone~ Septic system compliance trends~ Number of wastewater permit violations
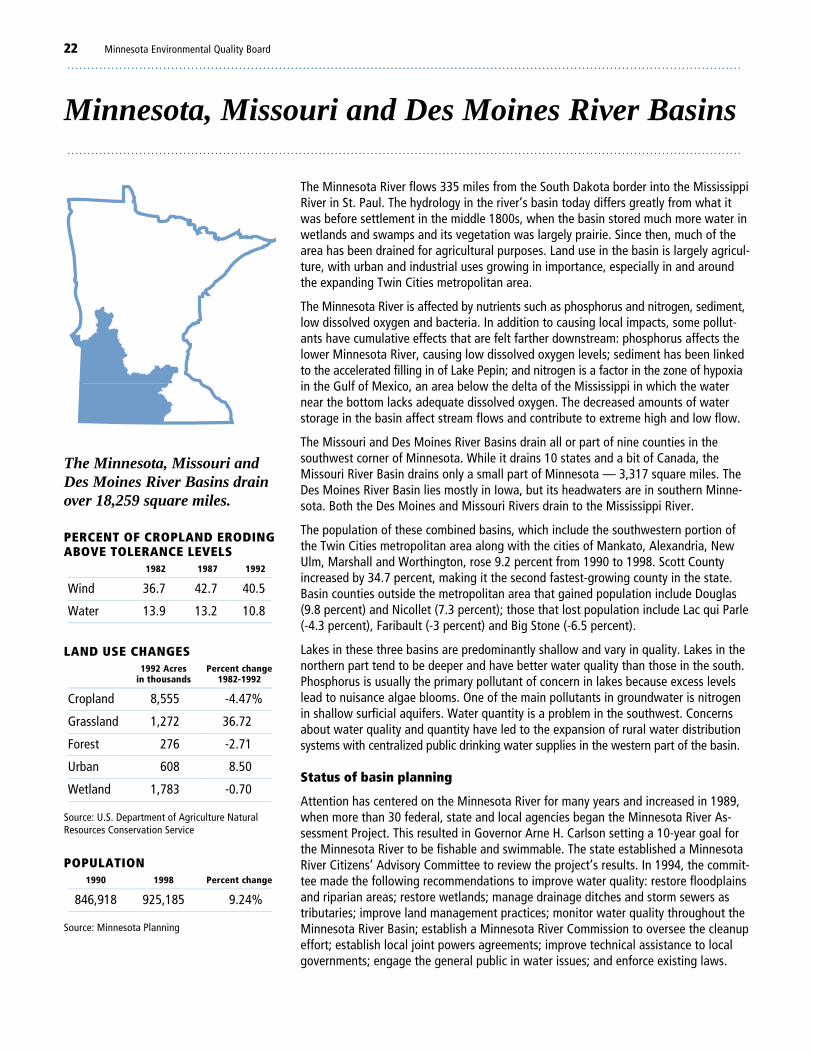
. . . . . . . . . . . . . . . . . . . . . . . . . . . . . . . . . . . . . . . . . . . . . . . . . . . . . . . . . . . . . . . . . . . . . . . . . . . . . . . . . . . . . . . . . . . . . . . . . . . . . . . . . . . . . . . . . . . . . . . . . . . . . . . . . . . . . . . . . . . . . . . . . . . . . . . . . . . . . . . . . . . . . . . . .
22 Minnesota Environmental Quality Board
The Minnesota River flows 335 miles from the South Dakota border into the MississippiRiver in St. Paul. The hydrology in the river’s basin today differs greatly from what itwas before settlement in the middle 1800s, when the basin stored much more water inwetlands and swamps and its vegetation was largely prairie. Since then, much of thearea has been drained for agricultural purposes. Land use in the basin is largely agricul-ture, with urban and industrial uses growing in importance, especially in and aroundthe expanding Twin Cities metropolitan area.
The Minnesota River is affected by nutrients such as phosphorus and nitrogen, sediment,low dissolved oxygen and bacteria. In addition to causing local impacts, some pollut-ants have cumulative effects that are felt farther downstream: phosphorus affects thelower Minnesota River, causing low dissolved oxygen levels; sediment has been linkedto the accelerated filling in of Lake Pepin; and nitrogen is a factor in the zone of hypoxiain the Gulf of Mexico, an area below the delta of the Mississippi in which the waternear the bottom lacks adequate dissolved oxygen. The decreased amounts of waterstorage in the basin affect stream flows and contribute to extreme high and low flow.
The Missouri and Des Moines River Basins drain all or part of nine counties in thesouthwest corner of Minnesota. While it drains 10 states and a bit of Canada, theMissouri River Basin drains only a small part of Minnesota — 3,317 square miles. TheDes Moines River Basin lies mostly in Iowa, but its headwaters are in southern Minne-sota. Both the Des Moines and Missouri Rivers drain to the Mississippi River.
The population of these combined basins, which include the southwestern portion ofthe Twin Cities metropolitan area along with the cities of Mankato, Alexandria, NewUlm, Marshall and Worthington, rose 9.2 percent from 1990 to 1998. Scott Countyincreased by 34.7 percent, making it the second fastest-growing county in the state.Basin counties outside the metropolitan area that gained population include Douglas(9.8 percent) and Nicollet (7.3 percent); those that lost population include Lac qui Parle(-4.3 percent), Faribault (-3 percent) and Big Stone (-6.5 percent).
Lakes in these three basins are predominantly shallow and vary in quality. Lakes in thenorthern part tend to be deeper and have better water quality than those in the south.Phosphorus is usually the primary pollutant of concern in lakes because excess levelslead to nuisance algae blooms. One of the main pollutants in groundwater is nitrogenin shallow surficial aquifers. Water quantity is a problem in the southwest. Concernsabout water quality and quantity have led to the expansion of rural water distributionsystems with centralized public drinking water supplies in the western part of the basin.
Status of basin planning
Attention has centered on the Minnesota River for many years and increased in 1989,when more than 30 federal, state and local agencies began the Minnesota River As-sessment Project. This resulted in Governor Arne H. Carlson setting a 10-year goal forthe Minnesota River to be fishable and swimmable. The state established a MinnesotaRiver Citizens’ Advisory Committee to review the project’s results. In 1994, the commit-tee made the following recommendations to improve water quality: restore floodplainsand riparian areas; restore wetlands; manage drainage ditches and storm sewers astributaries; improve land management practices; monitor water quality throughout theMinnesota River Basin; establish a Minnesota River Commission to oversee the cleanupeffort; establish local joint powers agreements; improve technical assistance to localgovernments; engage the general public in water issues; and enforce existing laws.
Minnesota, Missouri and Des Moines River Basins. . . . . . . . . . . . . . . . . . . . . . . . . . . . . . . . . . . . . . . . . . . . . . . . . . . . . . . . . . . . . . . . . . . . . . . . . . . . . . . . . . . . . . . . . . . . . . . . . . . . . . . . . . . . . . . . . . . . . . . . . . . . . . . . . . . . . . . . . . . . . . . . . . . . . . . . . . . . . . . . . . . . . . . . .
The Minnesota, Missouri andDes Moines River Basins drainover 18,259 square miles.
PERCENT OF CROPLAND ERODINGABOVE TOLERANCE LEVELS
1982 1987 1992___________________________________________________
Wind 36.7 42.7 40.5___________________________________________________
Water 13.9 13.2 10.8___________________________________________________
LAND USE CHANGES1992 Acres Percent change
in thousands 1982-1992___________________________________________________
Cropland 8,555 -4.47%___________________________________________________
Grassland 1,272 36.72___________________________________________________
Forest 276 -2.71___________________________________________________
Urban 608 8.50___________________________________________________
Wetland 1,783 -0.70___________________________________________________
Source: U.S. Department of Agriculture NaturalResources Conservation Service
POPULATION1990 1998 Percent change
___________________________________________________
846,918 925,185 9.24%___________________________________________________
Source: Minnesota Planning
Watermarks: Gauging the Flow of Progress 2000 – 2010 23. . . . . . . . . . . . . . . . . . . . . . . . . . . . . . . . . . . . . . . . . . . . . . . . . . . . . . . . . . . . . . . . . . . . . . . . . . . . . . . . . . . . . . . . . . . . . . . . . . . . . . . . . . . . . . . . . . . . . . . . . . . . . . . . . . . . . . . . . . . . . . . . . . . . . . . . . . . . . . . . . . . . . . . . .
A good deal of planning is occurring at all levels in the Minne-sota River Basin. Counties identify local goals for water resourceuse and protection in their comprehensive local water plans.Larger in scope are watershed plans. Both types of plans caninfluence local land use decisions. Other plans include the De-partment of Natural Resource’s Minnesota River WatershedComprehensive Recreational Guidance Document, which pro-vides guidance for developing recreational opportunities withinthe watershed, and the Pollution Control Agency’s MinnesotaRiver Basin Plan. Components of these plans have been used indeveloping the basin’s report.
The Missouri and Des Moines River Basins lack the extensivestate and federal plans and assessments that the MinnesotaRiver Basin has. Plans for these basins are primarily developedby local governments.
Statewide goals, objectives, and indicators ofparticular importance
The statewide goals, objectives and indicators fit the three basinswell. For a number of waters, meeting water quality standardswill be an improvement. In some surface waters, dissolvedoxygen, turbidity and bacteria often exceed the standard. Nitro-gen poses a problem both locally and downstream. Exoticspecies of particular concern are Eurasian water milfoil, zebramussels and curly-leaf pond weed. Water conservation, healthyecosystems and recreation are also important to the basins.
Unique objectives and environmental indicators
Over the past decade, local, state and federal assessments haveidentified a number of problems in the Minnesota River Basin.Consequently, targets either have been or will be established.Some of these targets are included in the table.
Both the Des Moines and Missouri River Basins have uniquepriorities as well. Protecting the Topeka shiner, an endangeredfish species found in Minnesota, is a priority in the MissouriRiver Basin. Because of shallow lake depths and lake fertilityissues, aeration systems for fish management are necessary inthe Des Moines River Basin. An indicator measuring the numberof aeration systems on lakes is suggested to monitor lake health.
Unique objectives and pressure indicators
The team suggests land use indicators for each objective be-cause land uses directly affect water resources. Local planningdrives land use change; thus, plans can be used to indicateprogress on environmental issues. A county’s comprehensiveplan can form the basis for more specific natural resource plans.The team would like to track many types of plans that wouldprovide local information and strategies for water management,including lake management, source water protection and waterconservation plans. The latter would involve developing strate-gic use plans with large water users.
It is important to determine the areas — whether watershed,county or smaller — that would benefit from having an up-to-dateresource plan so that the appropriate water quality issues are
addressed. Such plans form a foundation on which measurableimprovement can occur. Tracking plans by farmers on applica-tion of nutrients, manure and pesticides would show efforts toreduce associated problems. Although it may be challenging tomeasure success in improving water quality, these plans signifyprogress in addressing human impacts on water resources.
Water recreation is an asset in the three basins. It is importantto promote the area as a viable recreational resource within thestate and the upper Midwest. In addition, resource protectionshould be addressed in future development proposals. Striking abalance between development and recreational resource protec-tion can sustain resources for generations to come. Countingthe number of communities using conservation connections and“smart growth” principles, as well as public and private coop-erative ventures for managing water resources and recreation,would reflect trends toward a sustainable use of resources andopportunities for access to natural spaces.
While it is not unique for a basin to have groundwater quantityand quality problems, these are especially significant in theMissouri and Des Moines River Basins. Where aquifers are sensi-tive to contamination, it is important to monitor for pollutants.The risk of contamination is greater for the shallow aquifersystems.
Other issues of significance in the basin
While financial resources have been dedicated to identify prob-lems and improve the water quality of the Minnesota River,adequate funding is and will continue to be important to carry-ing out this task. Watershed projects in the Missouri and DesMoines River Basins also depend on adequate funds to solvetheir priority water quality problems. The team recommendsthat state and federal funds be provided in sufficient amountsto ensure success in improving high-priority water resources.
Land use change occurs on the local level. Thus, it is importantto involve local governments, watershed projects and otherinterests in planning and implementation processes. The numberof cooperative ventures among public agencies and private-sector interest groups is worthy of tracking.
Next steps
The team will work toward determining how each indicator willbe measured and develop strategies to meet targets. Developingthe next part of this plan will require working in cooperation withcounty water planners, soil and water conservation districts, water-shed projects and the Minnesota River Basin Joint Powers Board.
Basin team members
Pollution Control Agency; Minnesota departments of NaturalResources, Health and Agriculture; Board of Water and SoilResources; and U.S. Department of Agriculture Natural ResourcesConservation Service. The team solicited input from soil andwater conservation districts, county water planners, watershedprojects, the Minnesota River Basin Joint Powers Board and thegeneral public.
. . . . . . . . . . . . . . . . . . . . . . . . . . . . . . . . . . . . . . . . . . . . . . . . . . . . . . . . . . . . . . . . . . . . . . . . . . . . . . . . . . . . . . . . . . . . . . . . . . . . . . . . . . . . . . . . . . . . . . . . . . . . . . . . . . . . . . . . . . . . . . . . . . . . . . . . . . . . . . . . . . . . . . . . .
24 Minnesota Environmental Quality Board
SELECTED UNIQUE ENVIRONMENTAL CONDITION INDICATORS IN THE MINNESOTA, MISSOURIAND DES MOINES RIVER BASINS
Goal: Minnesotans will improve the quality of water resources.
OBJECTIVES INDICATORS AND TARGETS
Protect and improve water quality inrivers, streams and other watercourses.
~ Stream transparency readingsSpecific to the Minnesota River Basin:~ Annual phosphorus loading in the Minnesota River at Jordan: reduce to 200 tons(60 percent) at low flow, 700 tons (40 percent) at medium flow and 1,200 tons (40 percent)at high flow~ Nitrogen concentrations: reverse increasing trend~ Sediment loading: reduce watersheds by 30 percent from historic levels (average annualloads 1980 to 1989, by 2010)~ Carbonaceous biochemical oxygen demand: reduce by 40 percent under low flowconditions to maintain dissolved oxygen levels at 5 milligrams per liter in the lowerMinnesota River
Protect and improve lake waterquality.
~ Fish, invertebrate and macrophyte populations in lakesSpecific to the Missouri and Des Moines River Basins:~ Dissolved oxygen levels
Protect and improve groundwaterquality.
~ Chloride in groundwater~ Volatile organic compounds in groundwater~ Total atrazineSpecific to the Missouri and Des Moines River Basins:~ Water quality changes in shallow aquifers
Goal: Minnesotans will conserve water supplies and maintain the diverse characteristics of water resources togive future generations a healthy environment and a strong economy.
OBJECTIVES INDICATORS AND TARGETS
Maintain groundwater levels tosustain surface water bodies such aslakes, wetlands, fens and rivers andprovide water supplies for humandevelopment.
~ Number of aquifers with sustainable-yield problems~ Number of calcareous fens identified and protected
Maintain the hydrologic characteris-tics of surface water bodies thatsupport beneficial uses.
~ Number of new subdivisions or building permits for shoreland area
Goal: Minnesotans will restore and maintain healthy aquatic ecosystems that support diverse plants and wildlife.
OBJECTIVES INDICATORS AND TARGETS
Ensure aquatic environments haveconditions suitable for the mainte-nance of healthy self-sustainingcommunities of plants and animals.
~ Number of territories occupied by bald eagles~ Frog and toad populations~ Mussel community index~ Number of species on threatened or endangered species listsSpecific to the Des Moines River Basin:~ Blue-winged teal and mallard populations~ Nesting colonial birds and other aquatic species
Watermarks: Gauging the Flow of Progress 2000 – 2010 25. . . . . . . . . . . . . . . . . . . . . . . . . . . . . . . . . . . . . . . . . . . . . . . . . . . . . . . . . . . . . . . . . . . . . . . . . . . . . . . . . . . . . . . . . . . . . . . . . . . . . . . . . . . . . . . . . . . . . . . . . . . . . . . . . . . . . . . . . . . . . . . . . . . . . . . . . . . . . . . . . . . . . . . . .
Goal: Minnesotans will have reasonable and diverse opportunities to enjoy the state’s water resources.
OBJECTIVES INDICATORS AND TARGETS
Provide access to water recreationsites.
~ Miles of stream corridor easements~ Percentage of public water accesses meeting the requirements of the Americans withDisabilities Act
Improve or maintain the quality ofwater recreation.
~ Number of lakeshore and river parks~ Miles of corridor linking new and expanding recreational facilities and areas to existingrecreational opportunitiesSpecific to the Missouri and Des Moines River Basins:~ Hunter satisfaction surveys
SELECTED UNIQUE PRESSURE INDICATORS IN THE MINNESOTA, MISSOURI AND DES MOINESRIVER BASINS
Goal: Minnesotans will improve the quality of water resources.
OBJECTIVES INDICATORS AND TARGETS
Protect and improve water quality inrivers, streams and other watercourses.
~ Number of acres of restored floodplains, including re-establishment of vegetative buffer~ Number of acres of restored and preserved wetlands~ Implementation of erosion control practices (percent of cropland meeting 30 percentresidue guidelines from tillage transect survey)~ Number of nutrient and pesticide management plans~ Enrollment of acreage in wetland and riparian conservation programs
Protect and improve lake waterquality.
~ Number of upgraded individual sewage treatment systems
Goal: Minnesotans will conserve water supplies and maintain the diverse characteristics of water resources togive future generations a healthy environment and a strong economy.
OBJECTIVES INDICATORS AND TARGETS
Maintain groundwater levels tosustain surface water bodies such aslakes, wetlands, fens and rivers andprovide water supplies for humandevelopment.
~ Per capita use of water
Maintain the hydrologic characteris-tics of surface water bodies thatsupport beneficial uses.
~ Number of flood-damaged structures removed~ Number of upland land use practices that reduce or retain overland runoff flows~ Number and costs of drainage projects (ditch and tile improvements; feet of tilepurchased) and systems managed to reduce peak flows~ Acres of land converted to filter strips and buffers
Goal: Minnesotans will restore and maintain healthy aquatic ecosystems that support diverse plants and wildlife.
OBJECTIVES INDICATORS AND TARGETS
Ensure aquatic environments haveconditions suitable for the mainte-nance of healthy self-sustainingcommunities of plants and animals.
~ Number of acres of sustainable agriculture
Limit geographic range of exoticspecies.
~ Acres of preservation of existing natural habitats and restoration of degraded habitats~ Acreage of pastures and right-of-ways managed for removal of exotic species
Improve or maintain the quality ofwater recreation.
~ Number of multiuse areas providing nonconflicting recreation opportunities andenhanced habitat
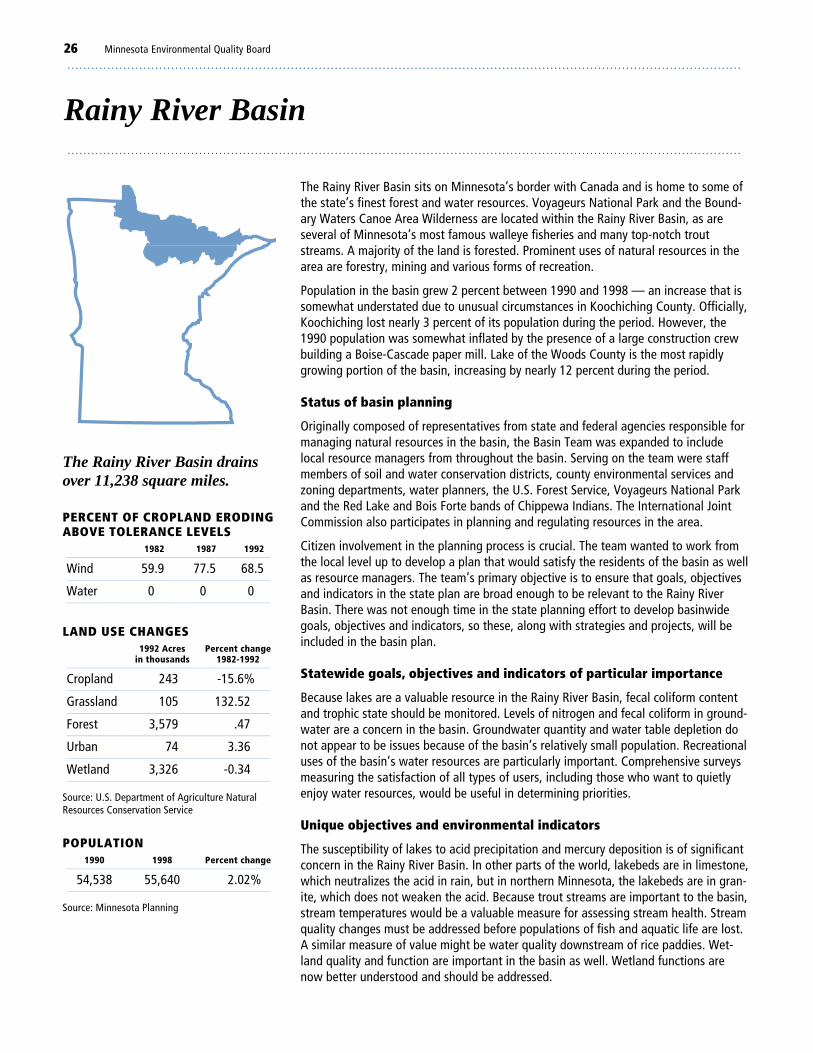
. . . . . . . . . . . . . . . . . . . . . . . . . . . . . . . . . . . . . . . . . . . . . . . . . . . . . . . . . . . . . . . . . . . . . . . . . . . . . . . . . . . . . . . . . . . . . . . . . . . . . . . . . . . . . . . . . . . . . . . . . . . . . . . . . . . . . . . . . . . . . . . . . . . . . . . . . . . . . . . . . . . . . . . . .
26 Minnesota Environmental Quality Board
Rainy River Basin. . . . . . . . . . . . . . . . . . . . . . . . . . . . . . . . . . . . . . . . . . . . . . . . . . . . . . . . . . . . . . . . . . . . . . . . . . . . . . . . . . . . . . . . . . . . . . . . . . . . . . . . . . . . . . . . . . . . . . . . . . . . . . . . . . . . . . . . . . . . . . . . . . . . . . . . . . . . . . . . . . . . . . . . .
The Rainy River Basin sits on Minnesota’s border with Canada and is home to some ofthe state’s finest forest and water resources. Voyageurs National Park and the Bound-ary Waters Canoe Area Wilderness are located within the Rainy River Basin, as areseveral of Minnesota’s most famous walleye fisheries and many top-notch troutstreams. A majority of the land is forested. Prominent uses of natural resources in thearea are forestry, mining and various forms of recreation.
Population in the basin grew 2 percent between 1990 and 1998 — an increase that issomewhat understated due to unusual circumstances in Koochiching County. Officially,Koochiching lost nearly 3 percent of its population during the period. However, the1990 population was somewhat inflated by the presence of a large construction crewbuilding a Boise-Cascade paper mill. Lake of the Woods County is the most rapidlygrowing portion of the basin, increasing by nearly 12 percent during the period.
Status of basin planning
Originally composed of representatives from state and federal agencies responsible formanaging natural resources in the basin, the Basin Team was expanded to includelocal resource managers from throughout the basin. Serving on the team were staffmembers of soil and water conservation districts, county environmental services andzoning departments, water planners, the U.S. Forest Service, Voyageurs National Parkand the Red Lake and Bois Forte bands of Chippewa Indians. The International JointCommission also participates in planning and regulating resources in the area.
Citizen involvement in the planning process is crucial. The team wanted to work fromthe local level up to develop a plan that would satisfy the residents of the basin as wellas resource managers. The team’s primary objective is to ensure that goals, objectivesand indicators in the state plan are broad enough to be relevant to the Rainy RiverBasin. There was not enough time in the state planning effort to develop basinwidegoals, objectives and indicators, so these, along with strategies and projects, will beincluded in the basin plan.
Statewide goals, objectives and indicators of particular importance
Because lakes are a valuable resource in the Rainy River Basin, fecal coliform contentand trophic state should be monitored. Levels of nitrogen and fecal coliform in ground-water are a concern in the basin. Groundwater quantity and water table depletion donot appear to be issues because of the basin’s relatively small population. Recreationaluses of the basin’s water resources are particularly important. Comprehensive surveysmeasuring the satisfaction of all types of users, including those who want to quietlyenjoy water resources, would be useful in determining priorities.
Unique objectives and environmental indicators
The susceptibility of lakes to acid precipitation and mercury deposition is of significantconcern in the Rainy River Basin. In other parts of the world, lakebeds are in limestone,which neutralizes the acid in rain, but in northern Minnesota, the lakebeds are in gran-ite, which does not weaken the acid. Because trout streams are important to the basin,stream temperatures would be a valuable measure for assessing stream health. Streamquality changes must be addressed before populations of fish and aquatic life are lost.A similar measure of value might be water quality downstream of rice paddies. Wet-land quality and function are important in the basin as well. Wetland functions arenow better understood and should be addressed.
The Rainy River Basin drainsover 11,238 square miles.
PERCENT OF CROPLAND ERODINGABOVE TOLERANCE LEVELS
1982 1987 1992___________________________________________________
Wind 59.9 77.5 68.5___________________________________________________
Water 0 0 0___________________________________________________
LAND USE CHANGES1992 Acres Percent change
in thousands 1982-1992___________________________________________________
Cropland 243 -15.6%___________________________________________________
Grassland 105 132.52___________________________________________________
Forest 3,579 .47___________________________________________________
Urban 74 3.36___________________________________________________
Wetland 3,326 -0.34___________________________________________________
Source: U.S. Department of Agriculture NaturalResources Conservation Service
POPULATION1990 1998 Percent change
___________________________________________________
54,538 55,640 2.02%___________________________________________________
Source: Minnesota Planning
Watermarks: Gauging the Flow of Progress 2000 – 2010 27. . . . . . . . . . . . . . . . . . . . . . . . . . . . . . . . . . . . . . . . . . . . . . . . . . . . . . . . . . . . . . . . . . . . . . . . . . . . . . . . . . . . . . . . . . . . . . . . . . . . . . . . . . . . . . . . . . . . . . . . . . . . . . . . . . . . . . . . . . . . . . . . . . . . . . . . . . . . . . . . . . . . . . . . .
As in the rest of the state, exotic species are a concern in theRainy River Basin. Infestations of exotics have not been dra-matic, as in other regions, but preventing further spread iscrucial. Among the exotics of specific concern in one or morecounties in the basin are purple loosestrife, Eurasian watermilfoil, rainbow smelt, rusty crayfish and zebra mussels.
Wild rice is grown in the northern one-third of the state on anestimated 18,500 acres in the counties of Aitkin, Beltrami, Cass,Clearwater, Crow Wing, Itasca, Koochiching, Lake of the Woods, Polk,and Pennington. In 1999, cultivated wild rice production was 6.2million processed pounds, up from 3.9 million pounds in 1989.
Unique objectives and pressure indicators
Onsite sewage treatment is a major water resource concern inthe Rainy River Basin, particularly on the bedrock lakes towardthe eastern part of the basin, where soils and slopes frequentlyare limiting factors. The need to develop and apply new tech-nologies for onsite sewage treatment is significant.
Industrial and urban source pollution is a problem here as inother parts of the state. The water quality of the Rainy River ismonitored and has improved dramatically in recent years. How-ever, paper mills in Minnesota and Canada discharge morewaste water into the Rainy River than all other sources com-bined. The list of pollutants measured by the state shouldinclude toxic pollutants.
Other issues of significance in the basin
The state is encouraged to give local water planning substantialsupport in the future. Locally based, state-supported waterplanning has been successful in the counties of the Rainy RiverBasin. The collaboration of local groups, state agencies andothers working to improve and protect water resources hascreated a strong base of local support. These efforts shouldtranslate into increased water quality for downstream areas inthe basin.
Providing public education and information is crucial for suc-cessful water management. A public information and educationtool kit should be developed to encourage local involvement.
The key to success in the Rainy River Basin is the involvement ofcitizens and other local interests. This involvement is necessaryif local water planning efforts are to succeed. The state planshould be the beginning of a partnership across all jurisdictions.State planning efforts would be more manageable for localgovernments if they were better integrated with ongoing plan-ning processes. To foster the integration of local planning, theteam recommends reorganizing schedules to incorporate countywater plan updates and reduce conflict with year-end reportsfor local government.
Measurements of progress in meeting the state objectives needto reflect the landform type in addition to the basin or watershed.
The basin would profit from a geographic land use componentincorporated into future plans to better identify where waterquality issues are broadly divergent. This could be done byregional landform or ecoregion. For example, water conditionsdiffer in a forested area compared to a peat bog or a plainsarea. Identifying where there are natural variations in the condi-tions of waters is an important element in evaluating land use.
In addition, climate variations need to be considered whencompiling results. Some water quality parameters can varysignificantly from year to year, depending on climatic condi-tions. Annual rainfall, for example, generally increases from thewest to the east, affecting water quality. Other factors, such asthe effect of natural water color on water clarity, need to beconsidered carefully when comparing different water bodies orespecially different major watersheds. Another important lakewater quality parameter that can make setting targets difficultis the likelihood of an individual lake to thermally stratify, ordevelop thermal “layers.” Indicators in any future plans shouldincorporate a weather or climate factor.
The Rainy River Basin is an international basin. Many internationalgoals and objectives are already in place. The International JointCommission’s Rainy River Alert Levels are internationallyadopted, ambient water quality standards based on standardsof the United States, Canada, the state of Minnesota and theprovince of Ontario. The commission’s standards should beadopted as the Minnesota water quality standards for the RainyRiver. Clearer overall direction for greater international coopera-tion is needed for border waters. Local stakeholders need moreopportunity for involvement with the International JointCommission’s Rainy River and Lake of the Woods boards. Thereis a significant need for increased communication across theU.S.-Canadian border among residents, stakeholders, electedofficials and local, state or provincial and federal agencies.
Next steps
Basin goals, objectives and indicators, along with strategies andprojects, will be developed as part of the Rainy River Basin planin 2001.
Basin team members
Pollution Control Agency; Minnesota departments of NaturalResources, Health and Agriculture; Board of Water and SoilResources; U.S. Department of Agriculture Natural ResourcesConservation Service; Chippewa National Forest, Superior Na-tional Forest; Voyageurs National Park; U.S. Geological Survey;Arrowhead Regional Development Commission; Bois Forte Bandof Chippewa Indians; Red Lake Band of Chippewa Indians;Rainy River First Nations; basin soil and water conservationdistricts, local water planners, county planning departments andvarious town board officers.
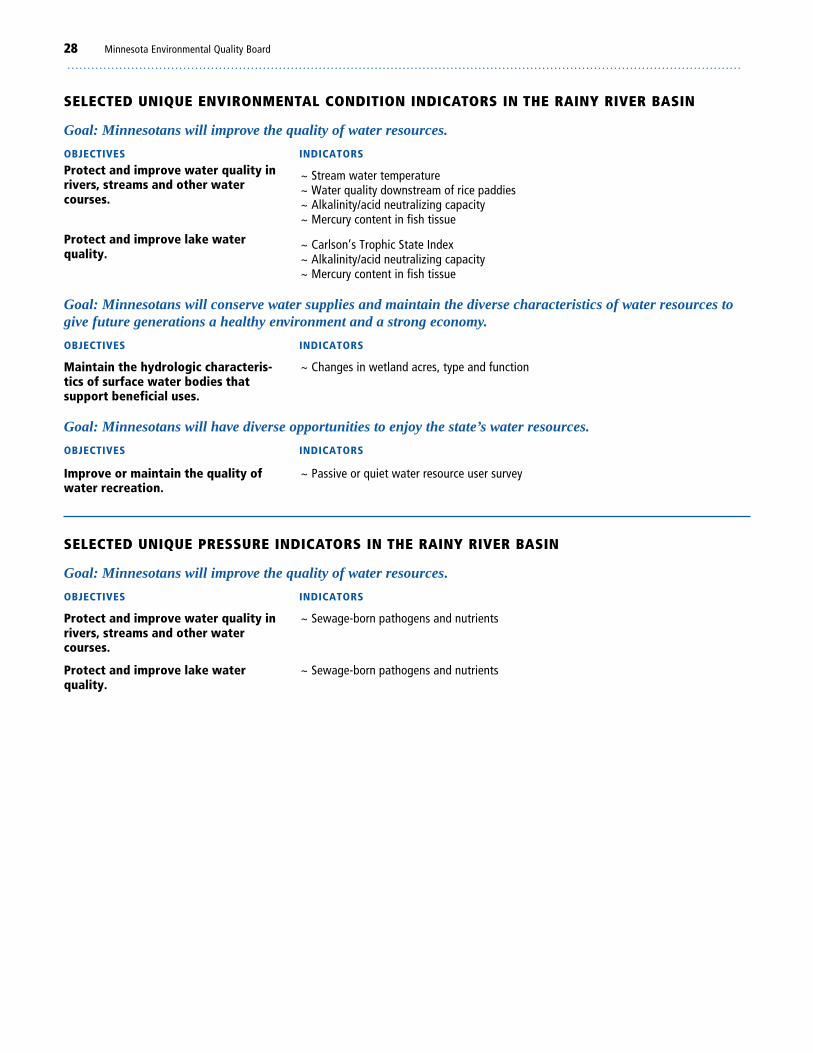
. . . . . . . . . . . . . . . . . . . . . . . . . . . . . . . . . . . . . . . . . . . . . . . . . . . . . . . . . . . . . . . . . . . . . . . . . . . . . . . . . . . . . . . . . . . . . . . . . . . . . . . . . . . . . . . . . . . . . . . . . . . . . . . . . . . . . . . . . . . . . . . . . . . . . . . . . . . . . . . . . . . . . . . . .
28 Minnesota Environmental Quality Board
SELECTED UNIQUE ENVIRONMENTAL CONDITION INDICATORS IN THE RAINY RIVER BASIN
Goal: Minnesotans will improve the quality of water resources.
OBJECTIVES INDICATORS
Protect and improve water quality inrivers, streams and other watercourses.
~ Stream water temperature~ Water quality downstream of rice paddies~ Alkalinity/acid neutralizing capacity~ Mercury content in fish tissue
Protect and improve lake waterquality.
~ Carlson’s Trophic State Index~ Alkalinity/acid neutralizing capacity~ Mercury content in fish tissue
Goal: Minnesotans will conserve water supplies and maintain the diverse characteristics of water resources togive future generations a healthy environment and a strong economy.
OBJECTIVES INDICATORS
Maintain the hydrologic characteris-tics of surface water bodies thatsupport beneficial uses.
~ Changes in wetland acres, type and function
Goal: Minnesotans will have diverse opportunities to enjoy the state’s water resources.
OBJECTIVES INDICATORS
Improve or maintain the quality ofwater recreation.
~ Passive or quiet water resource user survey
SELECTED UNIQUE PRESSURE INDICATORS IN THE RAINY RIVER BASIN
Goal: Minnesotans will improve the quality of water resources.
OBJECTIVES INDICATORS
Protect and improve water quality inrivers, streams and other watercourses.
~ Sewage-born pathogens and nutrients
Protect and improve lake waterquality.
~ Sewage-born pathogens and nutrients
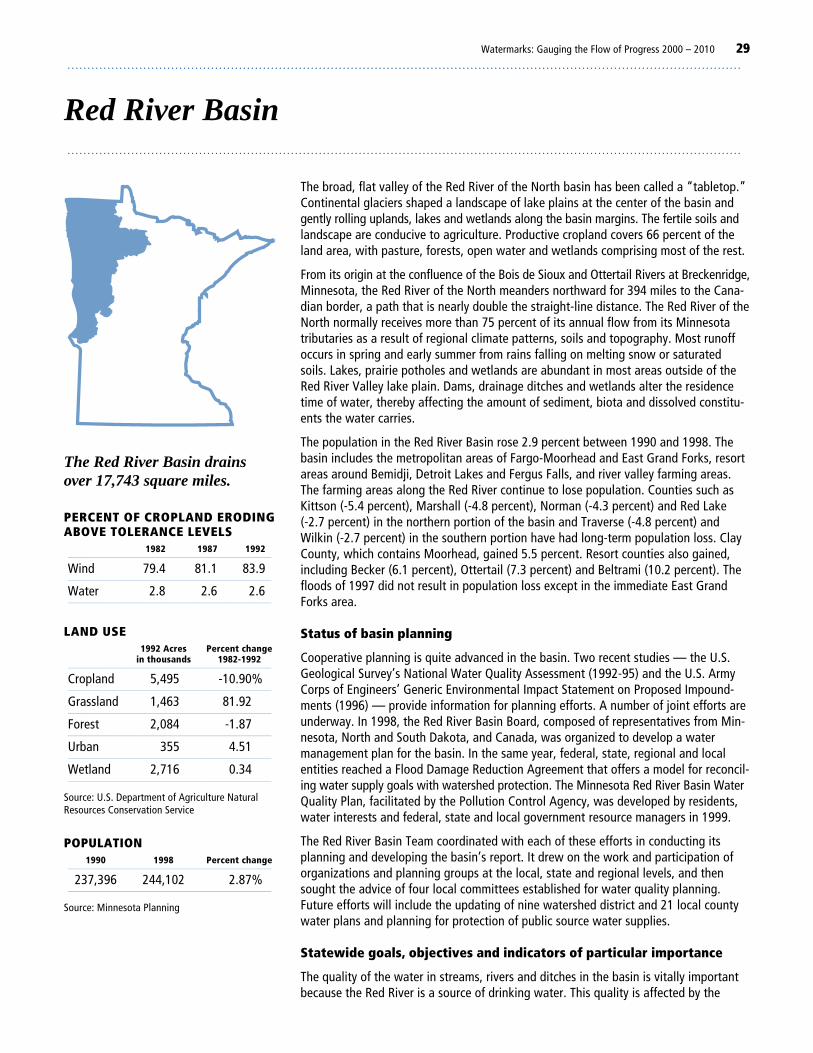
Watermarks: Gauging the Flow of Progress 2000 – 2010 29. . . . . . . . . . . . . . . . . . . . . . . . . . . . . . . . . . . . . . . . . . . . . . . . . . . . . . . . . . . . . . . . . . . . . . . . . . . . . . . . . . . . . . . . . . . . . . . . . . . . . . . . . . . . . . . . . . . . . . . . . . . . . . . . . . . . . . . . . . . . . . . . . . . . . . . . . . . . . . . . . . . . . . . . .
Red River Basin. . . . . . . . . . . . . . . . . . . . . . . . . . . . . . . . . . . . . . . . . . . . . . . . . . . . . . . . . . . . . . . . . . . . . . . . . . . . . . . . . . . . . . . . . . . . . . . . . . . . . . . . . . . . . . . . . . . . . . . . . . . . . . . . . . . . . . . . . . . . . . . . . . . . . . . . . . . . . . . . . . . . . . . . .
The broad, flat valley of the Red River of the North basin has been called a “tabletop.”Continental glaciers shaped a landscape of lake plains at the center of the basin andgently rolling uplands, lakes and wetlands along the basin margins. The fertile soils andlandscape are conducive to agriculture. Productive cropland covers 66 percent of theland area, with pasture, forests, open water and wetlands comprising most of the rest.
From its origin at the confluence of the Bois de Sioux and Ottertail Rivers at Breckenridge,Minnesota, the Red River of the North meanders northward for 394 miles to the Cana-dian border, a path that is nearly double the straight-line distance. The Red River of theNorth normally receives more than 75 percent of its annual flow from its Minnesotatributaries as a result of regional climate patterns, soils and topography. Most runoffoccurs in spring and early summer from rains falling on melting snow or saturatedsoils. Lakes, prairie potholes and wetlands are abundant in most areas outside of theRed River Valley lake plain. Dams, drainage ditches and wetlands alter the residencetime of water, thereby affecting the amount of sediment, biota and dissolved constitu-ents the water carries.
The population in the Red River Basin rose 2.9 percent between 1990 and 1998. Thebasin includes the metropolitan areas of Fargo-Moorhead and East Grand Forks, resortareas around Bemidji, Detroit Lakes and Fergus Falls, and river valley farming areas.The farming areas along the Red River continue to lose population. Counties such asKittson (-5.4 percent), Marshall (-4.8 percent), Norman (-4.3 percent) and Red Lake(-2.7 percent) in the northern portion of the basin and Traverse (-4.8 percent) andWilkin (-2.7 percent) in the southern portion have had long-term population loss. ClayCounty, which contains Moorhead, gained 5.5 percent. Resort counties also gained,including Becker (6.1 percent), Ottertail (7.3 percent) and Beltrami (10.2 percent). Thefloods of 1997 did not result in population loss except in the immediate East GrandForks area.
Status of basin planning
Cooperative planning is quite advanced in the basin. Two recent studies — the U.S.Geological Survey’s National Water Quality Assessment (1992-95) and the U.S. ArmyCorps of Engineers’ Generic Environmental Impact Statement on Proposed Impound-ments (1996) — provide information for planning efforts. A number of joint efforts areunderway. In 1998, the Red River Basin Board, composed of representatives from Min-nesota, North and South Dakota, and Canada, was organized to develop a watermanagement plan for the basin. In the same year, federal, state, regional and localentities reached a Flood Damage Reduction Agreement that offers a model for reconcil-ing water supply goals with watershed protection. The Minnesota Red River Basin WaterQuality Plan, facilitated by the Pollution Control Agency, was developed by residents,water interests and federal, state and local government resource managers in 1999.
The Red River Basin Team coordinated with each of these efforts in conducting itsplanning and developing the basin’s report. It drew on the work and participation oforganizations and planning groups at the local, state and regional levels, and thensought the advice of four local committees established for water quality planning.Future efforts will include the updating of nine watershed district and 21 local countywater plans and planning for protection of public source water supplies.
Statewide goals, objectives and indicators of particular importance
The quality of the water in streams, rivers and ditches in the basin is vitally importantbecause the Red River is a source of drinking water. This quality is affected by the
The Red River Basin drainsover 17,743 square miles.
PERCENT OF CROPLAND ERODINGABOVE TOLERANCE LEVELS
1982 1987 1992___________________________________________________
Wind 79.4 81.1 83.9___________________________________________________
Water 2.8 2.6 2.6___________________________________________________
LAND USE1992 Acres Percent change
in thousands 1982-1992___________________________________________________
Cropland 5,495 -10.90%___________________________________________________
Grassland 1,463 81.92___________________________________________________
Forest 2,084 -1.87___________________________________________________
Urban 355 4.51___________________________________________________
Wetland 2,716 0.34___________________________________________________
Source: U.S. Department of Agriculture NaturalResources Conservation Service
POPULATION1990 1998 Percent change
___________________________________________________
237,396 244,102 2.87%______________________________________________________________________________________________________
Source: Minnesota Planning
. . . . . . . . . . . . . . . . . . . . . . . . . . . . . . . . . . . . . . . . . . . . . . . . . . . . . . . . . . . . . . . . . . . . . . . . . . . . . . . . . . . . . . . . . . . . . . . . . . . . . . . . . . . . . . . . . . . . . . . . . . . . . . . . . . . . . . . . . . . . . . . . . . . . . . . . . . . . . . . . . . . . . . . . .
30 Minnesota Environmental Quality Board
area’s geology, topography and land use, all of which increasethe potential for nutrient and sediment loading. For this reason,tracking individual measures that comprise state standards andcriteria for streams — especially the levels of phosphorus, nitro-gen, ammonia, biochemical oxygen demand, total suspendedsolids and fecal coliform bacteria — is valuable.
Both groundwater quality and quantity are of concern in thebasin. Several closed basin lakes have risen to record levels inthe recent wet cycle, resulting in reduced water quality anddamaged property. The hydrologic characteristics of streamsand rivers in the basin have particular influence because theRed River flows north and the presence of ice in the north exac-erbates flooding in the southern headwaters, yet in late summerand early fall, many tributaries have little or no flow. In addi-tion, extensive drainage and the removal of wetlands, haveaffected the flow of surface water. Basin residents are inter-ested in reducing the extremes when it is economically andecologically responsible to do so.
Residents also are concerned about the biological integrity ofaquatic species diversity in streams and rivers. An index ofbiotic integrity has been established for fish and is being ex-tended to other aquatic species.
Enhancing water recreation activities matters to many in thebasin, in part because it emphasizes the ecological value of thebasin’s waters. Lakes, which are concentrated mostly in thecentral and southeastern regions of the basin, are a major tour-ist attraction, and their water quality is critically important.
Unique objectives and environmental indicators
A new objective to reduce flood damages was recommended bythe basin team. Flooding plagues the basin, and planning forcontrolling flood damage is continuing. The Flood DamageReduction Agreement defines a process by which local water-shed districts can reconcile water supply goals with ecologicalprinciples of watershed protection. Team members believe thatthe agreement is a model that could be used by other parts ofthe state.
Because of the area’s unique geology, the need to increaseknowledge of groundwater resources is significant. Arsenicoccurs naturally in geologic formations in the region, which is aconcern for drinking water supplies. Identifying and routinelymeasuring levels of particular compounds in groundwater isconsidered a good way to recognize emerging issues. The teamproposed considering completed county geologic atlases, up-dated county local water management plans and protectedrecharge areas as strategies for improving understanding ofgroundwater.
Unique objectives and pressure indicators
Because land use activities directly affect water resources, plan-ning participants suggested land use measures for most objectives.Crowding around shoreland is a growing problem, and zoningvariances and wetland filling put pressure on lakes and streams.Poor feedlot and animal waste management contributes to
excess nutrients, and measuring the number of feedlot and wastemanagement plans gives an indication of protection efforts. Otherland use indicators include measuring the acres or feet of bufferand filter strips and counting the number of sediment basins.
Converting marginal land from agriculture to permanent vegeta-tion reduces problems from runoff and provides for wildlifehabitat. Using conservation tillage transects or some othermeasure of conservation tillage could identify efforts to reducesediment loading.
Other issues of significance in the basin
Adequate funding is the most important tool for implementingany water management plan. Basin residents and stakeholdersare very realistic about the need to adequately fund their plansand recognize the importance of federal and state cost-sharingopportunities. To achieve the goals of the state plan, waterresources protection, preservation and restoration have to bedone at the local level.
Another high priority is to continue the well-developed basinmanagement and intergovernmental cooperation that charac-terizes planning in the Red River basin. The plans and projectsof the International Joint Commission and the Red River BasinBoard, along with the basin plan and the Flood Damage Reduc-tion Agreement, help shape local plans. There is a strongwillingness to coordinate planning efforts to minimize effort andmaximize results.
Recognizing that state and basin goals and objectives cannot beachieved without citizen involvement, planning participantssuggest an educational goal of creating awareness so thatcitizens practice wise land and water stewardship. Participationin volunteer monitoring programs and lake associations couldbe a measure of citizen involvement. Planning participants alsoexpressed interest in tracking the time it takes the state to acton violations in standards.
Next steps
The team that developed the Minnesota Red River Basin WaterQuality Plan is working to develop an appropriate basin organi-zation to lead plan implementation. Goals will be achievedthrough specific projects, and fund-raising strategies will bedeveloped to support these projects. Basin-wide water qualitymonitoring will be expanded and a strategy coordinated toprotect the Red River as a supplier of drinking water. Designingand implementing a nonpoint-source pollution reduction infor-mation and education campaign are also proposed. To ensuresuccess, the team will continue to work toward integratingplanning efforts, including the Flood Damage Reduction Agree-ment, to achieve water-related goals and objectives.
Basin team members
Board of Water and Soil Resources; Pollution Control Agency;Minnesota departments of Natural Resources, Agriculture andHealth; and U.S. Department of Agriculture Natural ResourcesConservation Service, with assistance from basin residents.
Watermarks: Gauging the Flow of Progress 2000 – 2010 31. . . . . . . . . . . . . . . . . . . . . . . . . . . . . . . . . . . . . . . . . . . . . . . . . . . . . . . . . . . . . . . . . . . . . . . . . . . . . . . . . . . . . . . . . . . . . . . . . . . . . . . . . . . . . . . . . . . . . . . . . . . . . . . . . . . . . . . . . . . . . . . . . . . . . . . . . . . . . . . . . . . . . . . . .
SELECTED UNIQUE ENVIRONMENTAL CONDITION INDICATORS IN THE RED RIVER BASIN
Goal: Minnesotans will improve the quality of water resources.
OBJECTIVES INDICATORS
Protect and improve water quality inrivers, streams and other watercourses.
~ Chemical oxygen demand, sulfates, sodium and protozoan, including cryptosporidium~ Index of biological integrity~ Stream water clarity
Protect and improve lake waterquality.
~ Carlson’s Trophic State Index
Protect and improve groundwaterquality.
~ Number of compounds showing up in groundwater
Goal: Minnesotans will conserve water supplies and maintain the diverse characteristics of water resources togive future generations a healthy environment and a strong economy.
OBJECTIVES INDICATORS
Maintain the hydrologic characteris-tics of surface water bodies thatsupport beneficial uses.
~ Stream miles that have monitoring for stream suitability
Manage drainage and retentionsystems to balance water flow forflood damage reduction, economicpurposes and natural resource en-hancement
~ Trends in climatic cycles in relation to hydrologic characteristics of surface water
SELECTED UNIQUE PRESSURE INDICATORS IN THE RED RIVER BASIN
Goal: Minnesotans will improve the quality of water resources.
OBJECTIVES INDICATORS
Protect and improve water quality inrivers, streams and other watercourses.
~ Number of zoning variances granted in shoreland areas~ A measure of conservation tillage
Protect and improve lake waterquality.
~ Number of zoning variances granted in shoreland areas~ Amount of conservation tillage~ Number of wetlands filled and square footage of filling in shoreland areas~ Number of feedlot waste and nutrient management plans implemented
Protect and improve groundwaterquality.
~ A measure of best management practices in wellhead protection areas~ Number of applications received for sealing unused, unsealed and abandoned wells~ Number of acres protected or enhanced in aquifer recharge areas
Goal: Minnesotans will conserve water supplies and maintain the diverse characteristics of water resources togive future generations a healthy environment and a strong economy.
OBJECTIVES INDICATORS
Manage drainage and retentionsystems to balance water flow forflood damage reduction, economicpurposes and natural resourceenhancements.
~ Number of acres of intensively farmed agricultural land receiving 10-year flood protection~ Monetary value of infrastructure receiving 100-year flood protection~ Reduction in flood damages~ Acres of intensively farmed marginal agricultural land in long-term protection
. . . . . . . . . . . . . . . . . . . . . . . . . . . . . . . . . . . . . . . . . . . . . . . . . . . . . . . . . . . . . . . . . . . . . . . . . . . . . . . . . . . . . . . . . . . . . . . . . . . . . . . . . . . . . . . . . . . . . . . . . . . . . . . . . . . . . . . . . . . . . . . . . . . . . . . . . . . . . . . . . . . . . . . . .
32 Minnesota Environmental Quality Board
Upper Mississippi River Basin. . . . . . . . . . . . . . . . . . . . . . . . . . . . . . . . . . . . . . . . . . . . . . . . . . . . . . . . . . . . . . . . . . . . . . . . . . . . . . . . . . . . . . . . . . . . . . . . . . . . . . . . . . . . . . . . . . . . . . . . . . . . . . . . . . . . . . . . . . . . . . . . . . . . . . . . . . . . . . . . . . . . . . . . .
The Upper Mississippi River Basin is large and complex, draining all or portions of 30counties and three ecoregions. The numerous lakes and streams found in the basin aregenerally thought to have good clarity. The northern portion is characterized by forestsand wetlands with a significant number of seasonal homes. Agriculture is also a majorland use in portions of the basin.
The basin is a diverse area including the cities of Minneapolis and St. Paul, most of therest of the Twin Cities metropolitan area, the St. Cloud metropolitan area and much ofthe central lakes resort area of the state. It includes more than half of the state’s popu-lation and many of the rapidly growing areas as well as some areas declining inpopulation. For example, Sherburne County tops the state in growth with a 42 percentincrease between 1990 and 1998 and the basin has five of the fastest growing cities.But St. Paul and Minneapolis, accounting for a fourth of the basin population, de-creased in size. Some portions of the basin have experienced population growth inexcess of 110 percent in the past 25 years. Between 1990 and 1998, the basin as awhole has gained 9.2 percent in population.
Status of basin planning
The conditions of the water resources in the Upper Mississippi River Basin are generallygood in the north and somewhat impaired in the south. For this reason, water pro-grams and activities of local governments tend to be aimed at protection in the northand restoration in the south. A water quality plan for the basin will be completed bythe Pollution Control Agency in 2001. Other state efforts include establishing totalmaximum daily loads for rivers and lakes with a response plan and source water as-sessments in select areas. At the local level, three of the basin’s six watershed districtsoutside of the Twin Cities metropolitan area are revising their plans, and 21 countieswill update their comprehensive local water plans between 2000 and 2005.
Statewide goals, objectives and indicators of particular importance
Given the basin’s large and diverse landscape, it is important that the indicators reflectlocal water quality characteristics. Dissolved oxygen, pH and phosphorous levels, aswell as macroinvertebrate communities, are important indicators of water quality ofstreams, rivers and lakes. Measuring chlorophyll-a, trophic state indexes and totalortho-phosphorous will give a good indication of lake water quality in the basin.
Biological indicators are especially useful, including populations of native mussels andBlanding’s turtles. As a general rule, however, the team believes that indicators arebest developed at the local level and endorsed by local governments.
Unique objectives and environmental indicators
Development poses a threat to the water resources throughout the area. It is importantto monitor indicators measuring the cumulative impact of development on key lakes asthey are converted from an undeveloped to a developed state. Changes in upland andaquatic vegetation, as well as the percentage of shoreland altered, are examples of keyenvironmental indicators.
The basin team recommends using surveys of recreational users and land owners,among others, as an indicator of water quality and recreation satisfaction.
The Upper Mississippi RiverBasin drains over 20,089 squaremiles.
PERCENT OF CROPLAND ERODINGABOVE TOLERANCE LEVELS
1982 1987 1992___________________________________________________
Wind 30.8 37.1 37.8___________________________________________________
Water 13.3 12.5 12.3___________________________________________________
LAND USE CHANGES1992 Acres Percent change
in thousands 1982-1992___________________________________________________
Cropland 3,580 -6.71%___________________________________________________
Grassland 1,284 6.11___________________________________________________
Forest 4,175 -2.23___________________________________________________
Urban 861 14.14___________________________________________________
Wetland 3,938 -.16___________________________________________________
Source: U.S. Department of Agriculture NaturalResources Conservation Service
POPULATION1990 1998 Percent change
___________________________________________________
2,330,502 2,545,189 9.21%___________________________________________________
Source: Minnesota Planning
Watermarks: Gauging the Flow of Progress 2000 – 2010 33. . . . . . . . . . . . . . . . . . . . . . . . . . . . . . . . . . . . . . . . . . . . . . . . . . . . . . . . . . . . . . . . . . . . . . . . . . . . . . . . . . . . . . . . . . . . . . . . . . . . . . . . . . . . . . . . . . . . . . . . . . . . . . . . . . . . . . . . . . . . . . . . . . . . . . . . . . . . . . . . . . . . . . . . .
Unique objectives and pressure indicators
Because population growth poses the biggest threat to waterresources, tracking demographic and socioeconomic trends willhelp document these influences that may not show up in waterdata for some time, perhaps years. Indicators that show long-term, cumulative impacts are especially helpful, including thosethat reveal how environmental or natural resource impactsaffect tax burdens and revenues. Shifts in land property valuesand uses also can be indicators. The number of nonconformingon-site sewage treatment systems affects both ground andsurface water and should be monitored.
Since the devastating floods of 1997, the state has assisted localcommunities by cost-sharing the removal of about 2,500 structuresfrom the 100-year flood plain.
Other issues of significance in the basin
The basin team received many comments about programs andissues relating to general water management. Suggestionsinclude having the state develop a universal methodology forrecording land use information, increasing the analysis of datacollected and improving mechanisms for transferring informationto local units of government. Optimum flows need to be estab-lished on rivers for fish habitat and waste assimilation as wellas for local needs. To prevent decline, some undeveloped lakes,
as well as the use of groundwater, should be monitored for cumu-lative impacts from development. Tracking the number of landacquisitions by conservancy groups would be one measure ofpreservation efforts. In addition, counting the number of com-munities delineating wellhead protection areas and developingsource water protection plans would show protection efforts.
While water levels in all lakes fluctuate, some landlocked lakesexperience large long-term fluctuations because outflow may onlyoccur at very high levels. For example, since 1991, Sarah Lake in Polkcounty and Long Lost Lake in Clearwater County increased over 11 and9 feet respectively.
Next steps
The Pollution Control Agency will complete a water quality planfor the basin by May 2001.
Basin team members
Board of Water and Soil Resources; Pollution Control Agency;Minnesota departments of Natural Resources, Health and Agri-culture; Metropolitan Council; U.S. Department of AgricultureNatural Resources Conservation Service and U.S. Army Corps ofEngineers. Private organizations, citizens and other interestsprovided assistance.
~ Number of public riparian zones or beaches
SELECTED UNIQUE ENVIRONMENTAL CONDITION INDICATORS IN THE UPPER MISSISSIPPI RIVER BASIN
Goal: Minnesotans will improve the quality of water resources.
OBJECTIVES INDICATORS
Protect and improve water quality inrivers, streams and other water-courses.
~ Cumulative number of acres converted to land development~ Changes in land use and vegetation~ Number of pesticides detected in surface waters~ Percent of shoreland protected by riparian buffer strips
Protect and improve lake waterquality.
~ Cumulative number of acres converted to land development~ Changes in land use and vegetation~ Number of pesticides detected in surface waters~ Percentage of shoreland protected by riparian buffer strips
Protect and improve groundwaterquality.
~ Amount of total organic carbon
Goal: Minnesotans will restore and maintain healthy aquatic ecosystems that support diverse plants and wildlife.
OBJECTIVES INDICATORS
Ensure aquatic environments haveconditions suitable for the mainte-nance of healthy self-sustainingcommunities of plants and animals.
~ Change in sensitive or native vegetation populations~ Change in natural mussel populations~ Changes in aquatic vegetation~ Changes in Blanding’s turtle populations
Goal: Minnesotans will have reasonable and diverse opportunities to enjoy the state’s water resources.
OBJECTIVES INDICATORS
Provide access to water recreationsites.
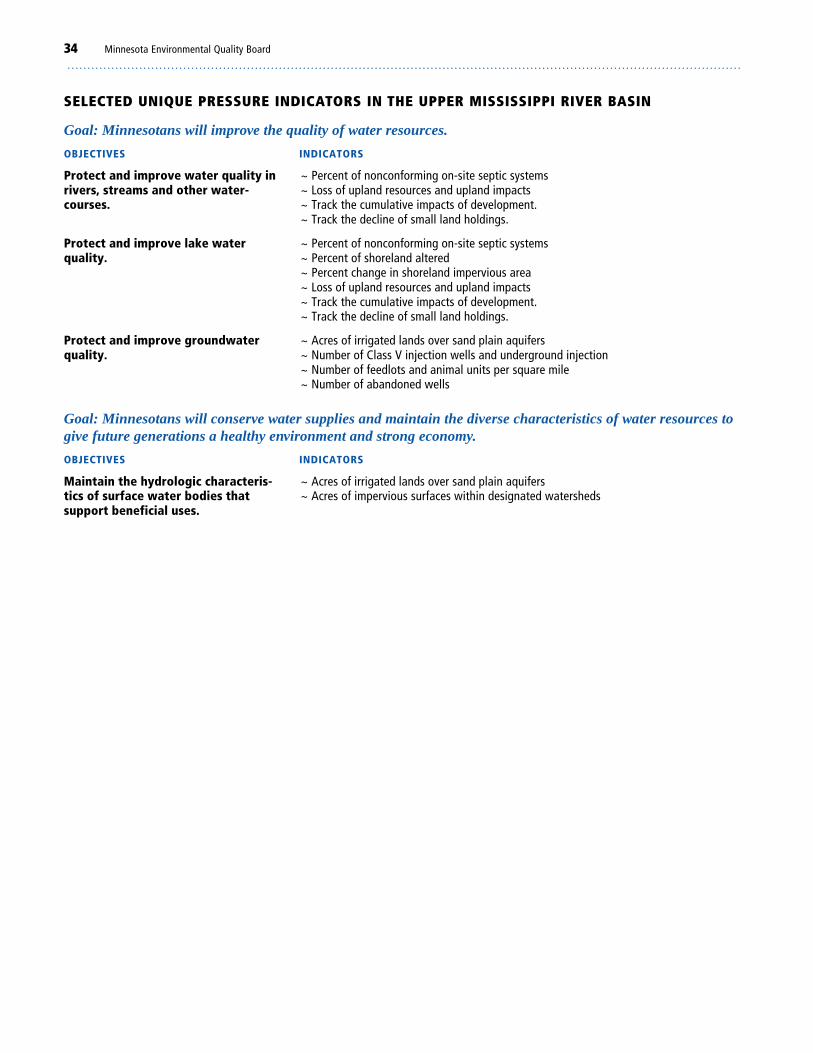
. . . . . . . . . . . . . . . . . . . . . . . . . . . . . . . . . . . . . . . . . . . . . . . . . . . . . . . . . . . . . . . . . . . . . . . . . . . . . . . . . . . . . . . . . . . . . . . . . . . . . . . . . . . . . . . . . . . . . . . . . . . . . . . . . . . . . . . . . . . . . . . . . . . . . . . . . . . . . . . . . . . . . . . . .
34 Minnesota Environmental Quality Board
SELECTED UNIQUE PRESSURE INDICATORS IN THE UPPER MISSISSIPPI RIVER BASIN
Goal: Minnesotans will improve the quality of water resources.
OBJECTIVES INDICATORS
Protect and improve water quality inrivers, streams and other water-courses.
~ Percent of nonconforming on-site septic systems~ Loss of upland resources and upland impacts~ Track the cumulative impacts of development.~ Track the decline of small land holdings.
Protect and improve lake waterquality.
~ Percent of nonconforming on-site septic systems~ Percent of shoreland altered~ Percent change in shoreland impervious area~ Loss of upland resources and upland impacts~ Track the cumulative impacts of development.~ Track the decline of small land holdings.
Protect and improve groundwaterquality.
~ Acres of irrigated lands over sand plain aquifers~ Number of Class V injection wells and underground injection~ Number of feedlots and animal units per square mile~ Number of abandoned wells
Goal: Minnesotans will conserve water supplies and maintain the diverse characteristics of water resources togive future generations a healthy environment and strong economy.
OBJECTIVES INDICATORS
Maintain the hydrologic characteris-tics of surface water bodies thatsupport beneficial uses.
~ Acres of irrigated lands over sand plain aquifers~ Acres of impervious surfaces within designated watersheds
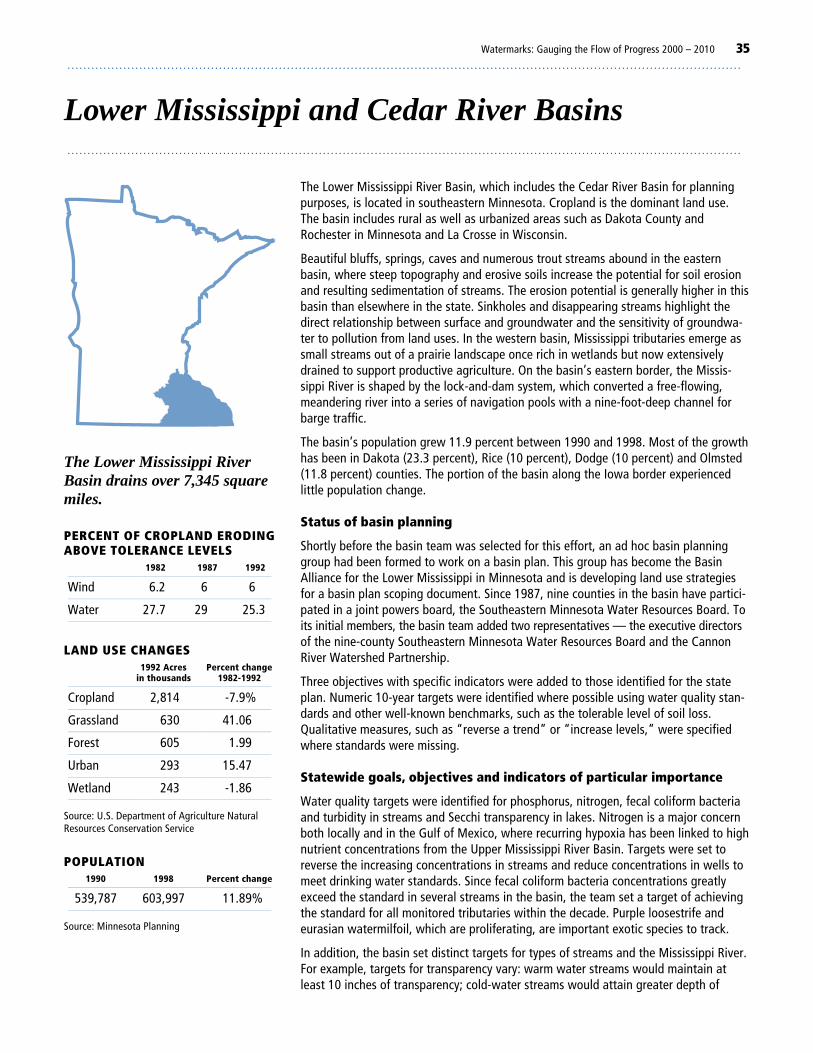
Watermarks: Gauging the Flow of Progress 2000 – 2010 35. . . . . . . . . . . . . . . . . . . . . . . . . . . . . . . . . . . . . . . . . . . . . . . . . . . . . . . . . . . . . . . . . . . . . . . . . . . . . . . . . . . . . . . . . . . . . . . . . . . . . . . . . . . . . . . . . . . . . . . . . . . . . . . . . . . . . . . . . . . . . . . . . . . . . . . . . . . . . . . . . . . . . . . . .
Lower Mississippi and Cedar River Basins. . . . . . . . . . . . . . . . . . . . . . . . . . . . . . . . . . . . . . . . . . . . . . . . . . . . . . . . . . . . . . . . . . . . . . . . . . . . . . . . . . . . . . . . . . . . . . . . . . . . . . . . . . . . . . . . . . . . . . . . . . . . . . . . . . . . . . . . . . . . . . . . . . . . . . . . . . . . . . . . . . . . . . . . .
The Lower Mississippi River Basin, which includes the Cedar River Basin for planningpurposes, is located in southeastern Minnesota. Cropland is the dominant land use.The basin includes rural as well as urbanized areas such as Dakota County andRochester in Minnesota and La Crosse in Wisconsin.
Beautiful bluffs, springs, caves and numerous trout streams abound in the easternbasin, where steep topography and erosive soils increase the potential for soil erosionand resulting sedimentation of streams. The erosion potential is generally higher in thisbasin than elsewhere in the state. Sinkholes and disappearing streams highlight thedirect relationship between surface and groundwater and the sensitivity of groundwa-ter to pollution from land uses. In the western basin, Mississippi tributaries emerge assmall streams out of a prairie landscape once rich in wetlands but now extensivelydrained to support productive agriculture. On the basin’s eastern border, the Missis-sippi River is shaped by the lock-and-dam system, which converted a free-flowing,meandering river into a series of navigation pools with a nine-foot-deep channel forbarge traffic.
The basin’s population grew 11.9 percent between 1990 and 1998. Most of the growthhas been in Dakota (23.3 percent), Rice (10 percent), Dodge (10 percent) and Olmsted(11.8 percent) counties. The portion of the basin along the Iowa border experiencedlittle population change.
Status of basin planning
Shortly before the basin team was selected for this effort, an ad hoc basin planninggroup had been formed to work on a basin plan. This group has become the BasinAlliance for the Lower Mississippi in Minnesota and is developing land use strategiesfor a basin plan scoping document. Since 1987, nine counties in the basin have partici-pated in a joint powers board, the Southeastern Minnesota Water Resources Board. Toits initial members, the basin team added two representatives — the executive directorsof the nine-county Southeastern Minnesota Water Resources Board and the CannonRiver Watershed Partnership.
Three objectives with specific indicators were added to those identified for the stateplan. Numeric 10-year targets were identified where possible using water quality stan-dards and other well-known benchmarks, such as the tolerable level of soil loss.Qualitative measures, such as “reverse a trend” or “increase levels,” were specifiedwhere standards were missing.
Statewide goals, objectives and indicators of particular importance
Water quality targets were identified for phosphorus, nitrogen, fecal coliform bacteriaand turbidity in streams and Secchi transparency in lakes. Nitrogen is a major concernboth locally and in the Gulf of Mexico, where recurring hypoxia has been linked to highnutrient concentrations from the Upper Mississippi River Basin. Targets were set toreverse the increasing concentrations in streams and reduce concentrations in wells tomeet drinking water standards. Since fecal coliform bacteria concentrations greatlyexceed the standard in several streams in the basin, the team set a target of achievingthe standard for all monitored tributaries within the decade. Purple loosestrife andeurasian watermilfoil, which are proliferating, are important exotic species to track.
In addition, the basin set distinct targets for types of streams and the Mississippi River.For example, targets for transparency vary: warm water streams would maintain atleast 10 inches of transparency; cold-water streams would attain greater depth of
The Lower Mississippi RiverBasin drains over 7,345 squaremiles.
PERCENT OF CROPLAND ERODINGABOVE TOLERANCE LEVELS
1982 1987 1992___________________________________________________
Wind 6.2 6 6___________________________________________________
Water 27.7 29 25.3___________________________________________________
LAND USE CHANGES1992 Acres Percent change
in thousands 1982-1992___________________________________________________
Cropland 2,814 -7.9%___________________________________________________
Grassland 630 41.06___________________________________________________
Forest 605 1.99___________________________________________________
Urban 293 15.47___________________________________________________
Wetland 243 -1.86___________________________________________________
Source: U.S. Department of Agriculture NaturalResources Conservation Service
POPULATION1990 1998 Percent change
___________________________________________________
539,787 603,997 11.89%___________________________________________________
Source: Minnesota Planning
. . . . . . . . . . . . . . . . . . . . . . . . . . . . . . . . . . . . . . . . . . . . . . . . . . . . . . . . . . . . . . . . . . . . . . . . . . . . . . . . . . . . . . . . . . . . . . . . . . . . . . . . . . . . . . . . . . . . . . . . . . . . . . . . . . . . . . . . . . . . . . . . . . . . . . . . . . . . . . . . . . . . . . . . .
36 Minnesota Environmental Quality Board
transparency to reduce the number of days turbidity exceeds thestate standard; and the sediment load to the Mississippi Riverfrom tributaries would be reduced.
Unique objectives and environmental indicators
An array of birds, fish and other species is considered useful fortracking ecosystem health in this region. Indicators were se-lected to reflect species pertinent to the region and includedifferent fish indicators for cold and warm water streams andthe Mississippi River.
Understanding the satisfaction of boaters, anglers, birdwatchersand swimmers will help shape opportunities for recreationaluse. In addition, determining the number and water quality ofswimming beaches will be useful.
The U.S. Geological Survey analyzed historical pesticide informationand found that land use and pesticide use affect detections ofpesticides in streams. In the Mississippi River basin, pesticides werefound in or downstream of agricultural and urban areas. Atrazine,cyanazine, metolachlor and alachlor were the four herbicides mostfrequently found. Agricultural pesticide use was greatest in theMinnesota River Basin. Most concentrations were below levelsconsidered harmful to human and aquatic health.
Unique objectives and pressure indicators
The new objective “manage land to support water quality andecosystems” is measured by 10 indicators with targets. The indi-cators also provide measures for other objectives, and listing themtogether reflects their interrelationship. Land management is amajor focus of local and tribal governments as well as state andfederal laws and programs, and they have the authority to actto reduce detrimental effects. Targets were established to reducesoil erosion and improve farm and urban nutrient management,as well as to increase perennial vegetation and wetlands.
Another objective singles out the Mississippi River as a majorwater body with special needs. The lock-and-dam system main-taining the nine-foot channel greatly increased the rate ofsediment deposition, including fine sediments in backwaterareas. Frequent resuspension of these sediments creates a de-gree of turbidity that limits light penetration and impedes thegrowth of submersed aquatic vegetation, which greatly limitsbiodiversity in these potentially rich ecosystems. Reducing sedi-ment loads from the tributaries would reduce the burden on theriver systems.
Additional targets aim to reduce the frequency of severe algaeblooms in several major lakes of the basin, including Pepin,Byllesby and Zumbro. This will require reducing phosphorusconcentrations upstream in the Vermillion, Cannon and ZumbroRivers, which is how progress toward protecting and improvinglake quality will be measured.
The extent of water conservation efforts will be measured bytracking domestic, commercial, industrial and agricultural waterconsumption.
Other issues of significance in the basin
Engaging local organizations and citizens in water resourcerestoration activities was selected by the basin team as an ob-jective that emphasizes the importance of the local and publicinvolvement in water resources. The number of citizen monitor-ing projects and the number of watershed projects show citizeninterest in water management. Comprehensive strategies forreducing key pollutants and creating good habitat conditions areplanned for Vermillion, Cannon, Zumbro, Whitewater and RootRiver watersheds. Since land use may directly affect groundwa-ter quality, a priority is to ensure that uses are compatible inareas affecting wells. Evaluating whether land uses are consis-tent with the wellhead plans developed by local communitiesprovides a measure of efforts to protect drinking water supplies.
Next steps
The basin team will work to determine how each indicator andtarget could be measured and by whom. Work also will com-mence on evaluating programs and developing strategies toachieve the objectives.
Basin team members
Pollution Control Agency; Minnesota departments of NaturalResources, Health and Agriculture; Board of Water and SoilResources; U.S. Department of Agriculture Natural ResourcesConservation Service; and Metropolitan Council. The initial teamwas expanded to include the executive directors of the South-eastern Minnesota Water Resources Board and the CannonRiver Watershed Partnership. An ad hoc basin planning group,established during the summer of 1999, provided considerableinput on land use objectives. In addition to representatives ofstate agencies, other members of this ad hoc group includedrepresentatives of soil and water conservation districts, coun-ties, the University of Minnesota Extension Service, theMinnesota-Wisconsin Boundary Area Commission, WhitewaterRiver Watershed Project and South Zumbro Watershed Partner-ship. The Prairie Island Indian Community also participated inthe water plan discussions.
Soil tests have shown that most lawns in the Twin Cities have very highlevels of phosphorus. If phosphorus fertilizer is applied to these lawns,much of it runs off—to be carried to lakes, streams and wetlands. Yetin 1996 only about one quarter of the fertilizer sold in Minnesotacontained less than 1 percent phosphate and over 21 percent containedover 10 percent, according to an analysis by University of Minnesotaresearchers reported in September 1999 CURA Reporter.
Watermarks: Gauging the Flow of Progress 2000 – 2010 37. . . . . . . . . . . . . . . . . . . . . . . . . . . . . . . . . . . . . . . . . . . . . . . . . . . . . . . . . . . . . . . . . . . . . . . . . . . . . . . . . . . . . . . . . . . . . . . . . . . . . . . . . . . . . . . . . . . . . . . . . . . . . . . . . . . . . . . . . . . . . . . . . . . . . . . . . . . . . . . . . . . . . . . . .
SELECTED UNIQUE ENVIRONMENTAL CONDITION INDICATORS IN THE LOWER MISSISSIPPI RIVER BASIN
Goal: Minnesotans will improve the quality of water resources.
OBJECTIVES INDICATORS AND TARGETS
Protect and improve water quality inrivers, streams and other watercourses.
~ Nitrogen concentrations in streams: reverse increasing trend~ Stream transparency: minimum of 10 inches (25 centimeters) attained for warm water~ Phosphorous loads: reduce to decrease algae blooms and maintain oxygen levels in lakes
Goal: Minnesotans will restore and maintain healthy ecosystems that support diverse plants and wildlife.
OBJECTIVES INDICATORS AND TARGETS
Ensure that aquatic environmentshave conditions suitable for themaintenance of healthy, self-sustain-ing communities of plants andanimals.
~ Diversity of native mussel species~ Fish populations: introduce and maintain brook trout in cold water streams; maintain andincrease smallmouth bass in warm water streams; and maintain and increase walleyepopulation in the Mississippi River~ Bird populations: maintain and increase populations of perching birds, shore birds,puddle ducks and diving ducks
Reduce sedimentation and slow theaging of navigation pools, maximiz-ing biodiversity in backwaters whilemeeting reasonable transportationneeds.
~ Sediment loads from tributaries to the Mississippi River: reduce
SELECTED UNIQUE PRESSURE INDICATORS IN THE LOWER MISSISSIPPI RIVER BASIN
Goal: Minnesotans will improve the quality of water resources.
OBJECTIVES INDICATORS AND TARGETS
Manage land to support water qual-ity and ecosystem health.
~ Area in pasture and uncultivated cropland: restore to 1982 levels (630,000 acres) fromcurrent estimates (448,000 acres)~ Miles of stream riparian buffers: increase to least 50 feet on protected waters with nativevegetation.~ Miles of river where the flood plain is connected to the main channel during higher flowperiods: maintain and increase~ Buildings, fillings and impervious surface areas in and affecting flood plains: minimize~ Soil loss of less than tolerance: achieve throughout basin by 2010~ Percentage of buffered surface tile intakes and drainage ditches: increase~ Fall application of nitrogen fertilizer in the karst region: reduce and eventually eliminate~ Use of phosphate-free fertilizer on lawns, golf courses and other urban areas: increase~ Integrated pest management: increase~ Percentage of population with properly functioning septic systems: increase~ Phosphorus from wastewater treatment facilities upstream of the Zumbro, Byllesby andPepin lakes: remove~ Amount of acres where land is managed to protect and enhance wetland functions: increase~ Feedlots, manure storage and management and other practices: ensure all feedlots are incompliance with feedlot rules by 2009
Goal: Minnesotans will conserve water supplies and maintain the diverse characteristics of water resources togive future generations a healthy environment and a strong economy.
OBJECTIVES INDICATORS AND TARGETS
Maintain groundwater levels tosustain surface water bodies such aslakes, wetlands, fens and rivers andprovide water supplies for humandevelopment.
~ Domestic, commercial, industrial and agricultural consumption of water
Goal: Minnesotans will have diverse opportunities to enjoy the state’s water resources.
OBJECTIVES INDICATORS AND TARGETS
Improve or maintain the quality ofwater recreation.
~ Swimmer and birdwatcher satisfaction surveys~ Fecal coliform bacteria monitoring at beaches
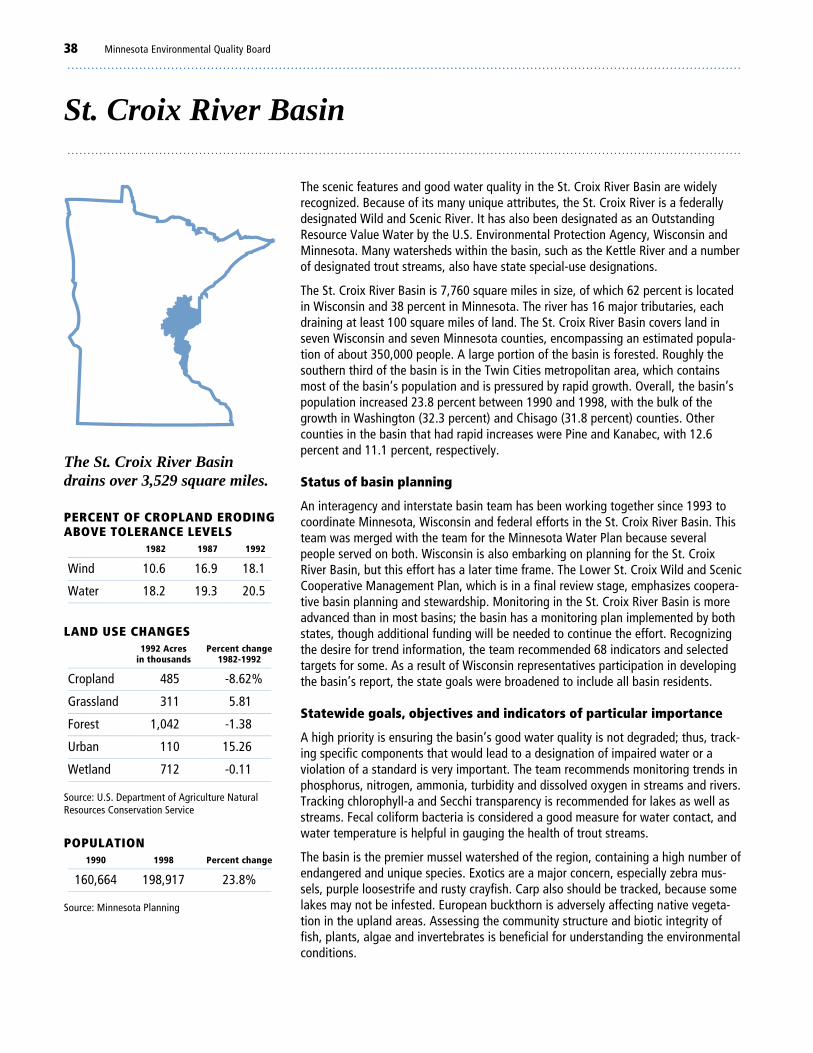
. . . . . . . . . . . . . . . . . . . . . . . . . . . . . . . . . . . . . . . . . . . . . . . . . . . . . . . . . . . . . . . . . . . . . . . . . . . . . . . . . . . . . . . . . . . . . . . . . . . . . . . . . . . . . . . . . . . . . . . . . . . . . . . . . . . . . . . . . . . . . . . . . . . . . . . . . . . . . . . . . . . . . . . . .
38 Minnesota Environmental Quality Board
St. Croix River Basin. . . . . . . . . . . . . . . . . . . . . . . . . . . . . . . . . . . . . . . . . . . . . . . . . . . . . . . . . . . . . . . . . . . . . . . . . . . . . . . . . . . . . . . . . . . . . . . . . . . . . . . . . . . . . . . . . . . . . . . . . . . . . . . . . . . . . . . . . . . . . . . . . . . . . . . . . . . . . . . . . . . . . . . . .
The scenic features and good water quality in the St. Croix River Basin are widelyrecognized. Because of its many unique attributes, the St. Croix River is a federallydesignated Wild and Scenic River. It has also been designated as an OutstandingResource Value Water by the U.S. Environmental Protection Agency, Wisconsin andMinnesota. Many watersheds within the basin, such as the Kettle River and a numberof designated trout streams, also have state special-use designations.
The St. Croix River Basin is 7,760 square miles in size, of which 62 percent is locatedin Wisconsin and 38 percent in Minnesota. The river has 16 major tributaries, eachdraining at least 100 square miles of land. The St. Croix River Basin covers land inseven Wisconsin and seven Minnesota counties, encompassing an estimated popula-tion of about 350,000 people. A large portion of the basin is forested. Roughly thesouthern third of the basin is in the Twin Cities metropolitan area, which containsmost of the basin’s population and is pressured by rapid growth. Overall, the basin’spopulation increased 23.8 percent between 1990 and 1998, with the bulk of thegrowth in Washington (32.3 percent) and Chisago (31.8 percent) counties. Othercounties in the basin that had rapid increases were Pine and Kanabec, with 12.6percent and 11.1 percent, respectively.
Status of basin planning
An interagency and interstate basin team has been working together since 1993 tocoordinate Minnesota, Wisconsin and federal efforts in the St. Croix River Basin. Thisteam was merged with the team for the Minnesota Water Plan because severalpeople served on both. Wisconsin is also embarking on planning for the St. CroixRiver Basin, but this effort has a later time frame. The Lower St. Croix Wild and ScenicCooperative Management Plan, which is in a final review stage, emphasizes coopera-tive basin planning and stewardship. Monitoring in the St. Croix River Basin is moreadvanced than in most basins; the basin has a monitoring plan implemented by bothstates, though additional funding will be needed to continue the effort. Recognizingthe desire for trend information, the team recommended 68 indicators and selectedtargets for some. As a result of Wisconsin representatives participation in developingthe basin’s report, the state goals were broadened to include all basin residents.
Statewide goals, objectives and indicators of particular importance
A high priority is ensuring the basin’s good water quality is not degraded; thus, track-ing specific components that would lead to a designation of impaired water or aviolation of a standard is very important. The team recommends monitoring trends inphosphorus, nitrogen, ammonia, turbidity and dissolved oxygen in streams and rivers.Tracking chlorophyll-a and Secchi transparency is recommended for lakes as well asstreams. Fecal coliform bacteria is considered a good measure for water contact, andwater temperature is helpful in gauging the health of trout streams.
The basin is the premier mussel watershed of the region, containing a high number ofendangered and unique species. Exotics are a major concern, especially zebra mus-sels, purple loosestrife and rusty crayfish. Carp also should be tracked, because somelakes may not be infested. European buckthorn is adversely affecting native vegeta-tion in the upland areas. Assessing the community structure and biotic integrity offish, plants, algae and invertebrates is beneficial for understanding the environmentalconditions.
The St. Croix River Basindrains over 3,529 square miles.
PERCENT OF CROPLAND ERODINGABOVE TOLERANCE LEVELS
1982 1987 1992___________________________________________________
Wind 10.6 16.9 18.1___________________________________________________
Water 18.2 19.3 20.5___________________________________________________
LAND USE CHANGES1992 Acres Percent change
in thousands 1982-1992___________________________________________________
Cropland 485 -8.62%___________________________________________________
Grassland 311 5.81___________________________________________________
Forest 1,042 -1.38___________________________________________________
Urban 110 15.26___________________________________________________
Wetland 712 -0.11___________________________________________________
Source: U.S. Department of Agriculture NaturalResources Conservation Service
POPULATION1990 1998 Percent change
___________________________________________________
160,664 198,917 23.8%___________________________________________________
Source: Minnesota Planning
Watermarks: Gauging the Flow of Progress 2000 – 2010 39. . . . . . . . . . . . . . . . . . . . . . . . . . . . . . . . . . . . . . . . . . . . . . . . . . . . . . . . . . . . . . . . . . . . . . . . . . . . . . . . . . . . . . . . . . . . . . . . . . . . . . . . . . . . . . . . . . . . . . . . . . . . . . . . . . . . . . . . . . . . . . . . . . . . . . . . . . . . . . . . . . . . . . . . .
Unique objectives and environmental indicators
Maintaining the quality and diversity of lakes, rivers and wet-lands in the St. Croix River Basin are priorities and relate to anew objective to protect scenic and ecological values; this ob-jective is delineated more fully in the discussion of pressureindicators. Trout streams abound in the basin, offering excep-tional, nearby recreational opportunities for metropolitanresidents. The team suggests tracking changes in the health ofstreams, lakes and wetlands by monitoring such things as indi-cators of biotic integrity (when developed), unionid musselpopulations, populations and habitats of loons and bald eagles,and average percent of “embeddedness” of coarse substrates(the degree to which larger particles such as pebbles and gravelare surrounded or covered by fine sediment such as sand or silt).
Fishing is important in the basin, and tracking health advisoriesfor water and fish consumption could show trends in pollutantsand their spread. Urban and industrial sources of contaminationcould be tracked by monitoring mercury, PCBs, copper andheavy metals in sediment. In addition, the popular basin areaneeds diverse types of public access, since it contains a widevariety of unique waters that must be treated and accessed indifferent ways. Besides the intense boat use of the lower St.Croix River and recreational lakes, the basin is used by shoreanglers, hikers, bird watchers, canoeists and shorelandowners.
Unique objectives and pressure indicators
A new objective was added to protect the scenic and ecologicalvalues of basin lakes and streams, particularly the Wild andScenic St. Croix River and streams of special interest such asdesignated trout streams. This addition seeks to recognize thatwhat is done to the shoreline of waters profoundly affects aquality water resource. Basin residents rank development pres-sures and land use changes as major concerns. Several otherland use indicators are stressed, such as tracking impervioussurfaces and the percent of floodplains lost by filling or diking.When floodplains are altered, floodwater storage is lost.
Urban and industrial wastes affect the quality of the land, andsediment contamination from mercury, PCBs, copper and otherheavy metals also must be addressed. Counting the number ofsuspected abandoned wells and the number of class 5 injectionwells could help find potential contamination sources ofgroundwater.
The basin team is studying the effects of dams. Both Wisconsinand Minnesota have been promoting the removal of dams,where feasible. While only the St. Croix Falls’ dam and severalin Wisconsin deviate from run-of-the-river operation, the basinteam set a target for 100 percent of the dams operating run-of-the-river by 2010. Because the patterns of stream flowcontinually change, base flow of streams should be monitoredto develop adequate trend data. The volume of groundwaterappropriated is important, and increases in domestic, agricul-tural or industrial use can signal problems.
While recreation is important, it is also a major threat to waterresources. The 211-mile-long St. Croix riverway is heavily used
by watercraft of all sizes. The upper portion experiences largelynonmotorized use, while the lower portion is used primarily bylarger motorized watercraft. Thus, while access is important forthe public, it also may lead to overuse and affect the satisfac-tion of those not using motor boats for recreation. Heavy usecreates noise problems along some stretches of the riverway,and increasing noise levels could signal changes in use or be-havior. Stream bank erosion due to large wakes produced byboaters is also a concern, and studies have been conducted toidentify those areas within the riverway where special restric-tions on wakes may be necessary.
Other issues of significance in the basin
The basin team has proposed a goal that basin residents andtheir respective governments will have an accountable, locallyresponsive and coordinated management of water-related ini-tiatives. It developed a new objective to improve coordinationamong levels of government so public resources are better usedto address watershed problems and to reduce the number ofconflicts between Minnesota’s and Wisconsin’s standards andrules. Indicators include the amount of resources allocated byeach state and agency. In addition, the team recommends creat-ing a coordinator’s office for the basin.
Because of land use concerns, the basin is working to developfuture best management practices for controlling rain-inducedpollution that would apply to specific land uses to address soilloss, phosphorus runoff and biosolids management.
Improved educational efforts and data sharing also are needed.Another objective encourages education and stewardship withindicators to track educational funding and data management.Since much of the existing water data is disorganized, the teamaims to reduce the number of watershed-related data sites,along with the time and cost needed to obtain watershed-re-lated information. Since local governments regulate land usechanges, their tracking of land use effects on water quality withthe aid of geographic information system technology can be animportant local indicator.
Next steps
The basin team must consider how to measure trends for thenew indicators, as well as who will be charged with monitoringthe indicators. The basin will need to evaluate suggested strate-gies and approaches to move toward the suggested goals andobjectives.
Basin team members
Pollution Control Agency; Minnesota departments of NaturalResources, Agriculture and Health; Board of Water and SoilResources; U.S. Department of the Interior National Park Ser-vice; Minnesota Wisconsin Boundary Area Commission;Metropolitan Council: University of Minnesota; University ofWisconsin; U.S. Geological Survey; U.S. Environmental Protec-tion Agency; U.S. Department of Agriculture Natural ResourcesConservation Service; and the St. Croix Band of Chippewa.
. . . . . . . . . . . . . . . . . . . . . . . . . . . . . . . . . . . . . . . . . . . . . . . . . . . . . . . . . . . . . . . . . . . . . . . . . . . . . . . . . . . . . . . . . . . . . . . . . . . . . . . . . . . . . . . . . . . . . . . . . . . . . . . . . . . . . . . . . . . . . . . . . . . . . . . . . . . . . . . . . . . . . . . . .
40 Minnesota Environmental Quality Board
SELECTED UNIQUE ENVIRONMENTAL CONDITION INDICATORS IN THE ST. CROIX RIVER BASIN
Goal: St. Croix River Basin residents will improve the quality of water resources.
OBJECTIVES INDICATORS AND TARGETS
Protect and improve water quality inlakes, wetlands, rivers and streamsand establish priorities for theirprotection.
~ Total and ortho-phosphorus: set a standard for discharges so that they do not exceed 1milligram per liter and there is no net increase of phosphorous~ Water temperature~ Health advisories for water use and fish consumption
Protect the scenic and ecologicalvalues of lakes and streams, particu-larly the Wild and Scenic St. CroixRiver and other lakes and streams ofspecial interest, such as designatedtrout streams.
~ Percent of stable shoreline: increase~ Percent of shoreland with buffers~ Percent loss of native aquatic plan habitat
Goal: St. Croix River Basin residents will restore and maintain healthy ecosystems that support diverse plantsand wildlife.
OBJECTIVES INDICATORS AND TARGETS
Ensure aquatic environments haveconditions suitable for the mainte-nance of healthy, self-sustainingcommunities of plants and animals.
~ Population of unionid mussels~ Average percent of “embeddedness” of coarse substrates
Goal: St. Croix River Basin residents will have diverse opportunities to enjoy the state’s water resources.
OBJECTIVES INDICATORS AND TARGETS
Provide access to water recreationsites.
~ Numbers of sites for boat launching and parking spaces
Improve or maintain the quality ofwater recreation.
~ Riparian homeowner satisfaction surveys~ Riparian parks and trail user satisfaction surveys
SELECTED UNIQUE PRESSURE INDICATORS IN THE ST. CROIX RIVER BASIN
Goal: St. Croix River Basin residents will improve the quality of water resources.
OBJECTIVES INDICATORS AND TARGETS
Protect and improve water quality inlakes, wetlands, rivers and streamsand establish priorities for theirprotection.
~ Sediment contamination tied to likely urban and industrial sources~ Watershed land use changes
Protect the scenic and ecologicalvalues of lakes and streams, particu-larly the Wild and Scenic St. CroixRiver and other lakes and streams ofspecial interest, such as designatedtrout streams.
~ Delta depositional areas associated with external sources such as storm sewers~ Percent of shoreland developed~ Changes in monetary value of shoreland properties~ Increased noise levels on and along waters of special interest
Protect and improve groundwaterquality.
~ Number of suspected abandoned wells~ Number of class 5 injection wells
Watermarks: Gauging the Flow of Progress 2000 – 2010 41. . . . . . . . . . . . . . . . . . . . . . . . . . . . . . . . . . . . . . . . . . . . . . . . . . . . . . . . . . . . . . . . . . . . . . . . . . . . . . . . . . . . . . . . . . . . . . . . . . . . . . . . . . . . . . . . . . . . . . . . . . . . . . . . . . . . . . . . . . . . . . . . . . . . . . . . . . . . . . . . . . . . . . . . .
Goal: St. Croix River Basin residents will conserve water supplies and maintain the diverse characteristics ofwater resources.
OBJECTIVES INDICATORS AND TARGETS
Maintain the hydrologic characteris-tics of surface water bodies thatsupport beneficial uses.
~ Percent impervious surfaces~ Volume of groundwater appropriated
Maintain flow of rivers and streamswithin historical range of variation.
~ Number of dam operations that deviate from run-of-the-river operation: all damsoperated run-of-the-river by 2010~ Number of dams removed~ Percent of floodplains lost
Maintain the quality and diversity ofthe St. Croix River Basin’s lakes,streams and wetlands while ac-knowledging regional variation.
~ Net increase in wetland acres~ Changes in wetland types and quality~ Changes in stream types
Goal: St. Croix River Basin residents will have diverse opportunities to enjoy the state’s water resources.
OBJECTIVES INDICATORS AND TARGETS
Provide appropriate access to waterrecreation sites.
~ Boat number and type surveys and counts
. . . . . . . . . . . . . . . . . . . . . . . . . . . . . . . . . . . . . . . . . . . . . . . . . . . . . . . . . . . . . . . . . . . . . . . . . . . . . . . . . . . . . . . . . . . . . . . . . . . . . . . . . . . . . . . . . . . . . . . . . . . . . . . . . . . . . . . . . . . . . . . . . . . . . . . . . . . . . . . . . . . . . . . . .
42 Minnesota Environmental Quality Board
Going Forward. . . . . . . . . . . . . . . . . . . . . . . . . . . . . . . . . . . . . . . . . . . . . . . . . . . . . . . . . . . . . . . . . . . . . . . . . . . . . . . . . . . . . . . . . . . . . . . . . . . . . . . . . . . . . . . . . . . . . . . . . . . . . . . . . . . . . . . . . . . . . . . . . . . . . . . . . . . . . . . . . . . . . . . . .
The goals and objectives detailed in this report provide a frame-work for managing water resources for the next 10 years. Overthe next two years, the Water Resources Committee and TaskForce will work with the basin teams to develop key strategiesand evaluate current activities to move toward achieving thegoals and objectives. The statewide indicators will be used totrack progress. Decisions will be made about the priority as wellas the feasibility of tracking the condition indicators and pres-sures recommended by basin teams. Emphasis also will continueon setting targets both for the statewide indicators and forindicators specific to some basins.
The basin teams involved local governments in helping to shapethe statewide and basin reports, and the role of local govern-
ment in water management was stressed by all the basin teams.A pilot program of the Board of Government Innovation andCooperation offers local government new approaches for man-aging natural resources. Created by the 2000 MinnesotaLegislature, the program provides local government with theability to consolidate or create types of local government struc-tures to strengthen natural resource management. Creative useof this program could address some local funding and gover-nance problems.
This water planning effort initiated a new process for managingone of Minnesota’s most vital resources. Continuing efforts willbe tracked in a follow-up report in September 2002.
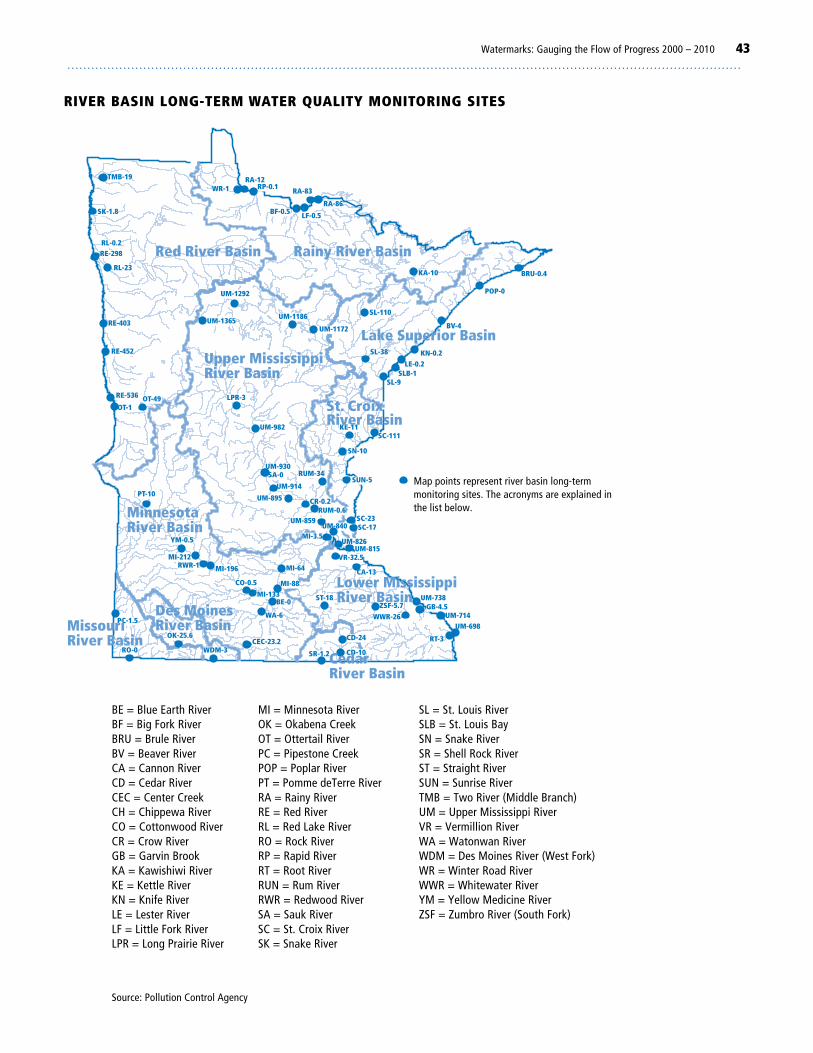
Watermarks: Gauging the Flow of Progress 2000 – 2010 43. . . . . . . . . . . . . . . . . . . . . . . . . . . . . . . . . . . . . . . . . . . . . . . . . . . . . . . . . . . . . . . . . . . . . . . . . . . . . . . . . . . . . . . . . . . . . . . . . . . . . . . . . . . . . . . . . . . . . . . . . . . . . . . . . . . . . . . . . . . . . . . . . . . . . . . . . . . . . . . . . . . . . . . . .
BV-4
SL-9
SA-0
WA-6
RT-3
OT-1
WR-1
POP-0
SL-38
LPR-3
PT-10
RWR-1
KE-11
SC-17
CA-13
OT-49
RL-23KA-10
RA-86
KN-0.2
SL-110
MI-212
YM-0.5
SC-111
UM-738
RE-452
BF-0.5
UM-1292
BE-0
RO-0
SLB-1
MI-88
MI-64
SN-10
SC-23
SUN-5
ST-18
CD-10
CD-24
WDM-3
RA-83
RA-12
RE-298
LE-0.2
UM-982
UM-895
UM-914
UM-930
CR-0.2
UM-826
UM-840UM-859
RUM-34
MI-133
MI-196
CO-0.5
MI-3.5
WWR-26GB-4.5
UM-698UM-714
SR-1.2
RE-536
RE-403
RL-0.2
SK-1.8
TMB-19
LF-0.5
RP-0.1
PC-1.5
BRU-0.4
UM-1186UM-1365UM-1172
RUM-0.6
VR-32.5
ZSF-5.7
OK-25.6CEC-23.2
UM-815
Red River Basin Rainy River Basin
Upper MississippiRiver Basin
Lake Superior Basin
St. CroixRiver Basin
Lower MississippiRiver Basin
CedarRiver Basin
MinnesotaRiver Basin
MissouriRiver Basin
Des MoinesRiver Basin
BE = Blue Earth RiverBF = Big Fork RiverBRU = Brule RiverBV = Beaver RiverCA = Cannon RiverCD = Cedar RiverCEC = Center CreekCH = Chippewa RiverCO = Cottonwood RiverCR = Crow RiverGB = Garvin BrookKA = Kawishiwi RiverKE = Kettle RiverKN = Knife RiverLE = Lester RiverLF = Little Fork RiverLPR = Long Prairie River
RIVER BASIN LONG-TERM WATER QUALITY MONITORING SITES
Map points represent river basin long-termmonitoring sites. The acronyms are explained inthe list below.
MI = Minnesota RiverOK = Okabena CreekOT = Ottertail RiverPC = Pipestone CreekPOP = Poplar RiverPT = Pomme deTerre RiverRA = Rainy RiverRE = Red RiverRL = Red Lake RiverRO = Rock RiverRP = Rapid RiverRT = Root RiverRUN = Rum RiverRWR = Redwood RiverSA = Sauk RiverSC = St. Croix RiverSK = Snake River
SL = St. Louis RiverSLB = St. Louis BaySN = Snake RiverSR = Shell Rock RiverST = Straight RiverSUN = Sunrise RiverTMB = Two River (Middle Branch)UM = Upper Mississippi RiverVR = Vermillion RiverWA = Watonwan RiverWDM = Des Moines River (West Fork)WR = Winter Road RiverWWR = Whitewater RiverYM = Yellow Medicine RiverZSF = Zumbro River (South Fork)
Source: Pollution Control Agency
. . . . . . . . . . . . . . . . . . . . . . . . . . . . . . . . . . . . . . . . . . . . . . . . . . . . . . . . . . . . . . . . . . . . . . . . . . . . . . . . . . . . . . . . . . . . . . . . . . . . . . . . . . . . . . . . . . . . . . . . . . . . . . . . . . . . . . . . . . . . . . . . . . . . . . . . . . . . . . . . . . . . . . . . .
44 Minnesota Environmental Quality Board
Aquatic invertebrates Animals without a backbone or spinalcolumn that are found in lakes, streams, ponds, marshes andpuddles. They help maintain the health of the water ecosystemby eating bacteria and dead, decaying plants and animals.
Aquifer A water-bearing porous rock or soil layer that yieldswater to wells.
Best management practice Voluntary practices used toprevent or minimize sources of nonpoint source pollution.
Biochemical oxygen demand Measures the amount ofoxygen demanded by decomposition and respiration as organicmatter contained in a given sample or body of water is consumed.
Ecoregion Areas of relative homogeneity defined for Minne-sota based on land use, soils, landform and potential naturalvegetation.
Ecosystem A community of plants and animals and the physi-cal and chemical environment in which it exists.
Exotic species Nonnative species that adversely affect nativespecies.
Erosion The wearing away of land surface by water or wind. Itoccurs naturally from weather or runoff but often is intensifiedby human activities.
Fecal coliform bacteria This bacteria is present in the intes-tines of humans and other animals. If found in water resources,it indicates sewage contamination has occurred and suggeststhe presence of disease-causing bacteria and viruses.
Hydrology The study of water that considers water flow,changes of state and interaction with the earth’s surface andsub-surface.
Impervious surface Ground cover such as asphalt, concrete,hard-packed soil or rock that does not allow for the infiltrationof water. Such surfaces increase the volume and speed of runoffafter a rainfall.
Karst or karst terrain Topography of fractured or channeledlimestone, dolomite or gypsum formed by the dissolution ofthese rocks by rain and underground water. Karst topography,largely found in southeast Minnesota, is characterized by closeddepressions, sinkholes and underground drainage.
Nitrogen Nitrogen gas, nitrate, nitrite and ammonia are formsof nitrogen related through a complex cycle. Nitrate is the mostcommon form of nitrogen in oxygenated water.
Nonpoint source pollution Pollution that arises from diffusesources such as runoff from cultivated fields or urban areas.
Nutrients Elements or compounds essential to growth. Phos-phorus and nitrogen are the two most common nutrients inrunoff that threaten water resources. Sources include fertilizerand human and animal waste.
Pesticide A chemical substance used to kill or repel pests.Pesticides include herbicides to kill weeds, insecticides to killinsects and fungicides to kill fungi.
Phosphorus A chemical element that is necessary for algalgrowth. Sources include fertilizer, animal and human waste andplant matter.
River basin The surrounding land area that drains into a riveror river system.
Secchi transparency A measure of water clarity that alsocould provide an indirect measure of the amount of algae in thewater.
Suspended solids Particles of such things as dirt, plants andanimals that hang in water and decrease the amount of lightavailable for aquatic life, making it difficult for fish and otheraquatic animals to breathe and feed. Erosion is a major cause ofsolids.
Volatile organic compounds Chemicals contained in avariety of commercial, industrial and household products thatcan evaporate rapidly from water into air at normal temperatures.
Watershed The surrounding land area that drains into a lake,river or river system. Minnesota has 81 major watersheds.
Water table The upper surface of the saturated zone. Belowthe water table all spaces in soil or rock are filled with water.
Wetlands Low-lying lands that frequently have standing wateron them, such as swamps, marshes and meadows.
Zone of hypoxia An area along the Louisiana-Texas coast inwhich water near the bottom of the Gulf of Mexico contains lessthan 2 parts per million of dissolved oxygen. Hypoxia can causestress or death in bottom-dwelling organisms that cannot moveout of the zone.
Glossary. . . . . . . . . . . . . . . . . . . . . . . . . . . . . . . . . . . . . . . . . . . . . . . . . . . . . . . . . . . . . . . . . . . . . . . . . . . . . . . . . . . . . . . . . . . . . . . . . . . . . . . . . . . . . . . . . . . . . . . . . . . . . . . . . . . . . . . . . . . . . . . . . . . . . . . . . . . . . . . . . . . . . . . . .
Watermarks: Gauging the Flow of Progress 2000 – 2010 45. . . . . . . . . . . . . . . . . . . . . . . . . . . . . . . . . . . . . . . . . . . . . . . . . . . . . . . . . . . . . . . . . . . . . . . . . . . . . . . . . . . . . . . . . . . . . . . . . . . . . . . . . . . . . . . . . . . . . . . . . . . . . . . . . . . . . . . . . . . . . . . . . . . . . . . . . . . . . . . . . . . . . . . . .
Contributors. . . . . . . . . . . . . . . . . . . . . . . . . . . . . . . . . . . . . . . . . . . . . . . . . . . . . . . . . . . . . . . . . . . . . . . . . . . . . . . . . . . . . . . . . . . . . . . . . . . . . . . . . . . . . . . . . . . . . . . . . . . . . . . . . . . . . . . . . . . . . . . . . . . . . . . . . . . . . . . . . . . . . . . . .
EQB Water Resources Committee
Paul Toren (chair)Carolyn Engebretson (vice-chair)Marilyn Lundberg (director), Minnesota PlanningPat Bloomgren, Department of HealthPatrick Brezonik, University of Minnesota Water Resources CenterGreg Buzicky, Department of AgricultureRon Harnack, Board of Water and Soil ResourcesKent Lokkesmoe, Department of Natural ResourcesGary Oberts, Metropolitan CouncilTim Scherkenbach, Pollution Control AgencyDavid Southwick, Minnesota Geological Survey
Water Management Unification Task Force
Marilyn Lundberg, EQB Water Resources Committee Director;Paul Toren, EQB Water Resources Committee Chair; BarbaraBlackstone (facilitator), Office of Dispute Resolution; Jim Birkholz,Greg Larson and Doug Thomas, Board of Water and Soil Resources;David Brostrom, River Defense Network; Molly MacGregor,Minnesota Rivers Council; Tim Koehler, U.S. Department ofAgriculture Natural Resources Conservation Service; Bruce Olsenand Art Persons, Department of Health; Bob Patton, MinnesotaDepartment of Agriculture; Paul Schmiechen and Glenn Skuta,Pollution Control Agency; Jack Skrypek, Sarah Tufford, ClarenceTurner, Keith Wendt and David Wright, Department of NaturalResources; David Southwick and Bob Tipping, MinnesotaGeological Survey; Judy Sventek, Metropolitan Council
Original basin team members
Lake Superior Basin: Brian Fredrickson (chair), Pollution ControlAgency; Joel Peterson (vice-chair), Pollution Control Agency; MarkNelson (vice-chair), Board of Water and Soil Resources; B. KevinDaw (primary) and Kelly Voigt (alternate), U.S. Department ofAgriculture Natural Resources Conservation Services; Mark Dittrichor Mark Zabel, Minnesota Department of Agriculture; Beth Kluthe,Department of Health; Mark Nelson, Board of Water and SoilResources; Roger Nelson, Pollution Control Agency; Dan Retka,Department of Natural Resources
Lower Mississippi and Cedar River Basins: Mark Dittrich (co-chair), Minnesota Department of Agriculture; Norm Senjem (co-chair),Pollution Control Agency; John Nicholson (primary) and Mark Kunz(alternate), U.S. Department of Agriculture Natural ResourcesConservation Service; Art Persons, Department of Health; DavePeterson, Board of Water and Soil Resources; Walt Popp,Department of Natural Resources; Judy Sventek, MetropolitanCouncil; Mark Zabel, Minnesota Department of Agriculture
Minnesota, Des Moines and Missouri River Basins: TerryBovee (co-chair), Department of Health; Larry Gunderson (co-chair),Pollution Control Agency; Mike Appel (primary) and Ann English(alternate), U.S. Department of Agriculture Natural ResourcesConservation Service; Mark Dittrich or Mark Zabel, Department of
Agriculture; Jack Frost, Metropolitan Council; Mark Hanson,Pollution Control Agency; Cheryl Heide, Department of NaturalResources; Chris Hughes, Board of Water and Soil Resources; DaveLeuthe, Department of Natural Resources
Rainy River Basin: Nolan Baratano (chair), Pollution ControlAgency; Howard Christman, Department of Natural Resources;B. Kevin Daw (primary) and Kelly Voigt (alternate), U.S.Department of Agriculture Natural Resources Conservation Service;Mark Dittrich or Mark Zabel, Department of Agriculture; BethKluthe, Department of Health; Mark Nelson, Board of Water andSoil Resources
Red River Basin: Brian Dwight (co-chair), Board of Water andSoil Resources; Lisa Scheirer (co-chair), Pollution Control Agency;Mark Dittrich or Mark Zabel, Department of Agriculture; MikeHowe and Beth Kluthe, Department of Health; Glen Kajewski(primary) and Jim Ayres (alternate), U.S. Department of AgricultureNatural Resources Conservation Service; Paul Swenson,Department of Natural Resources
St. Croix River Basin: Keith Grow (co-chair), Board of Water andSoil Resources; Dale Homuth (co-chair), Department of NaturalResources; Tori Boers, Metropolitan Council; Mark Dittrich or MarkZabel, Department of Agriculture; Mike Howe, Department ofHealth; Rita O’Connell, Pollution Control Agency; HarveySundmacker (primary) and B. Kevin Daw (alternate), U.S.Department of Agriculture Natural Resources Conservation Service
Upper Mississippi River Basin: Jim Hodgson (co-chair),Pollution Control Agency; Dan Steward (co-chair), Board of Waterand Soil Resources; Jim Ayres (primary) and Harvey Sundmacker(alternate), U.S. Department of Agriculture Natural ResourcesConservation Service; C. B. Bylander, Department of NaturalResources; Mark Dittrich or Mark Zabel, Department of Agriculture;Beth Kluthe, Department of Health; Judy Sventek, MetropolitanCouncil
Metro Committee: Steve Woods (co-chair), Board of Water andSoil Resources; Jack Frost (co-chair), Metropolitan Council; JudySventek (alternate co-chair), Metropolitan Council; Wayne Barstad,Department of Natural Resources; Tori Boers, Metropolitan Council;Art Persons, Department of Health; Glenn Skuta, Pollution ControlAgency; Harvey Sundmacker (primary) and Ed Musielewicz(alternate), U.S. Department of Agriculture Natural ResourcesConservation Service
Other contributors: Numerous others provided assistancewith this report, including Renee Anderson, Susanne Maeder,Marilynn Taylor and Michael Tietz, Minnesota Planning; CarrieBartz and Dave Christopherson, Pollution Control Agency;Marybeth Block, Board of Water and Soil Resources; John Hines,Department of Agriculture; Sheila Grow, Department of Health;Tim Kelly, Nick Proulx and Jay Rendall, Department of NaturalResources