miniature pressuremeter and miniature cone penetrometer testing in calibration chamber with...
TRANSCRIPT
Miniature Pressuremeter and Miniature Cone Penetrometer Testing
in Calibration Chamber with Unsaturated Soil Beds
By
Norman K. Tan
Outline
• Introduction• Objective• Research task• Why calibration chamber?• OU calibration chamber• Preparation of soil beds• Test results• Research question.

Introduction
• Cone Penetrometer (CPT) & Pressuremeter (PMT)– Popular in situ testing devices– Give estimates of in situ soil properties– Methods developed to interpret results focus around:
• Saturated soil• Dry sand
• About 1/3 of earth ~ arid/semi arid regions• Behavior of unsaturated soil is different from saturated soil• Motivation: No methods for interpreting CPT & PMT in
unsaturated soil
Objective
• Develop a method to predict PMT and CPT responses for various matric suction based on one test result

Research Task
• Calibration chamber testing
• Numerical and analytical analysis and modeling
• Laboratory testing
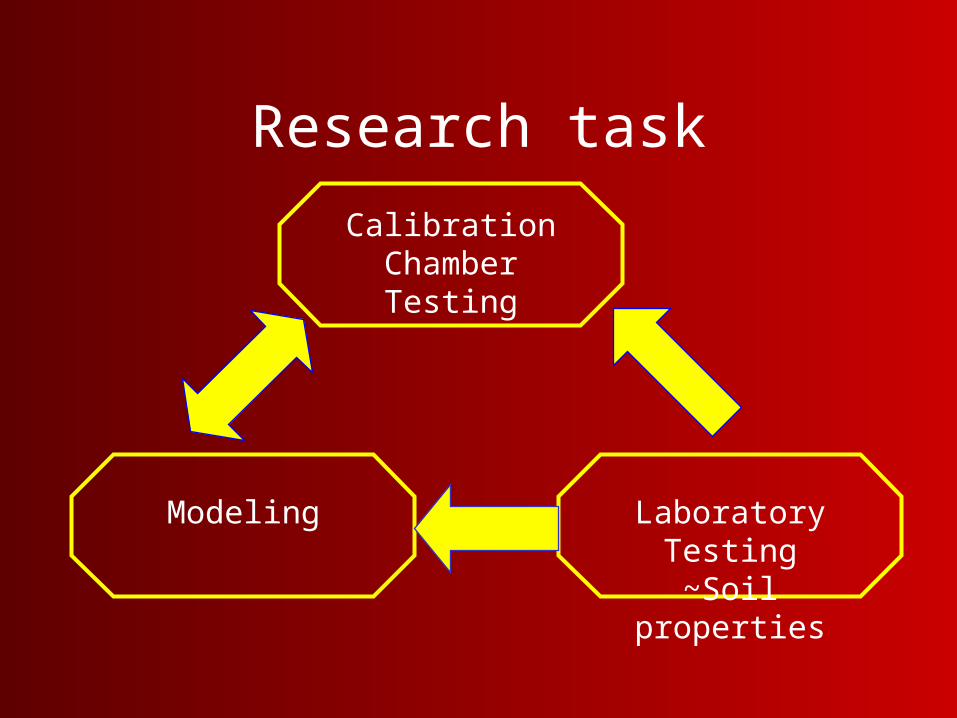
Research task
Calibration Chamber Testing
Modeling Laboratory Testing~Soil properties

Why Calibration Chamber?
• Field Testing– Easy and cheaper– Lack of control over the boundary conditions– Heterogeneous of soil– Unknown stress history, stress state, etc.
• Calibration Chamber Testing– Controlled environment
• Boundary condition• Stress state• Homogeneous soil beds• Etc.
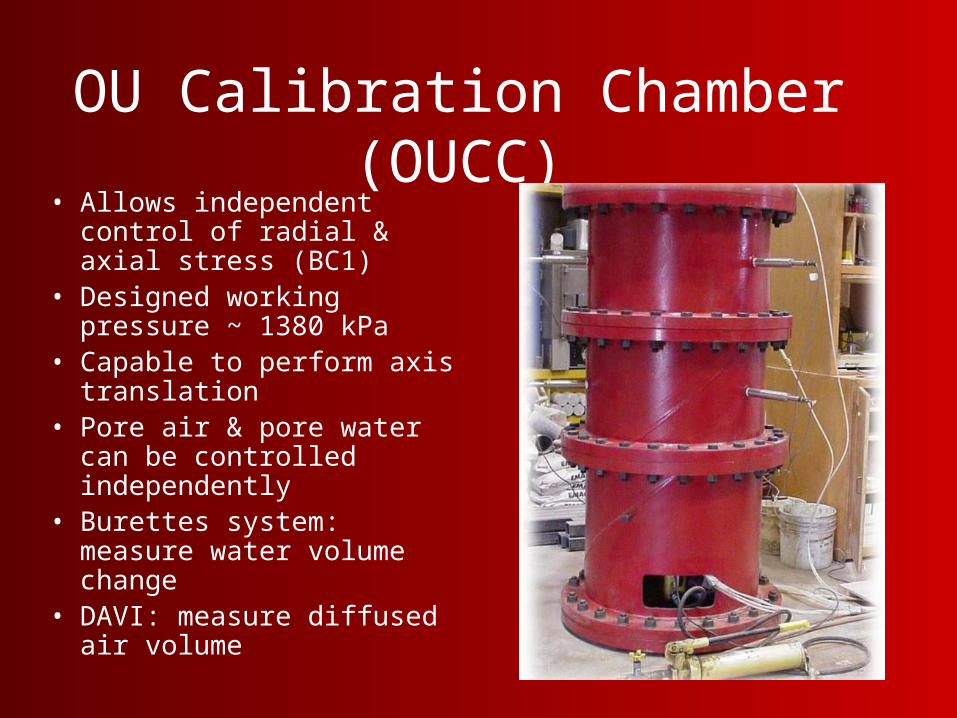
OU Calibration Chamber (OUCC)• Allows independent control
of radial & axial stress (BC1)• Designed working pressure ~
1380 kPa• Capable to perform axis
translation• Pore air & pore water can be
controlled independently• Burettes system: measure
water volume change• DAVI: measure diffused air
volume
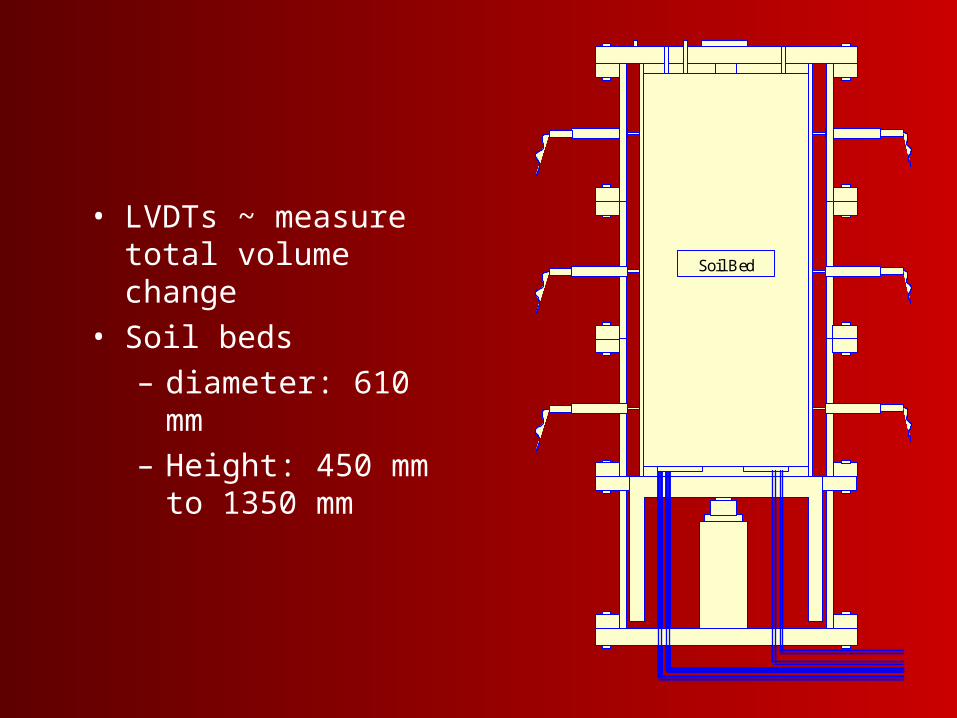
• LVDTs ~ measure total volume change
• Soil beds
– diameter: 610 mm
– Height: 450 mm to 1350 mm
Soil BedSoil BedSoil BedSoil BedSoil BedSoil BedSoil BedSoil BedSoil BedSoil BedSoil BedSoil BedSoil BedSoil BedSoil BedSoil BedSoil BedSoil BedSoil Bed
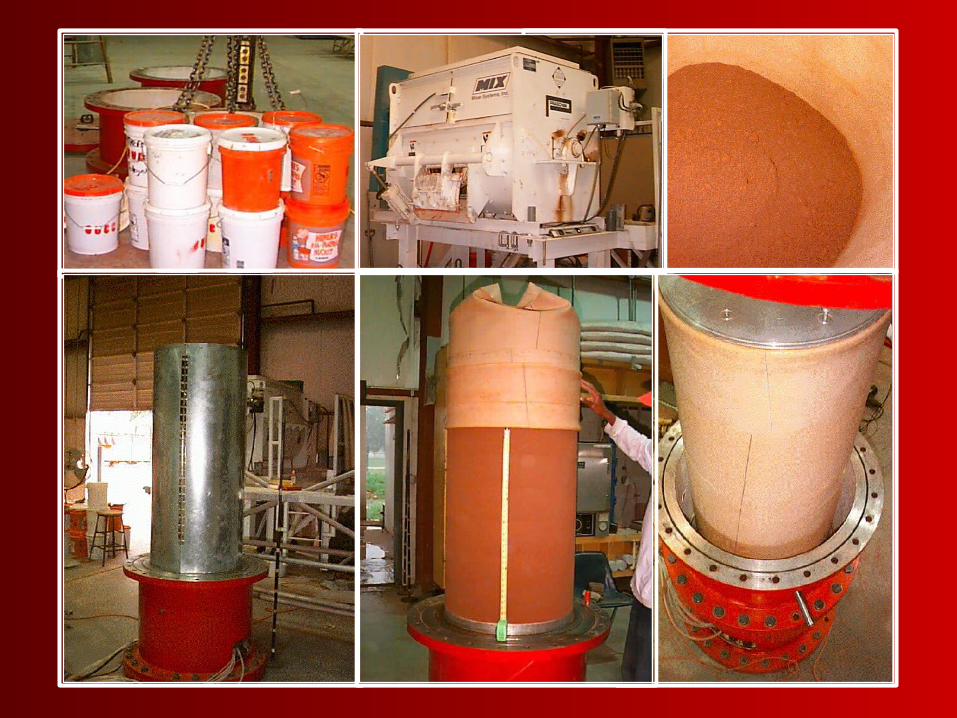
Preparation of Soil Beds• Soil used:
– Minco Silt– From Tuttle, OK– CL-ML soil– PI: 8
• Soil bed preparation:– Statically compacted– 152 mm/layer
• Soil preparation:– Oven dried
– Pass #10 sieve
– Mixed with water in large concrete mixer
– Store in 5 gallon pails for minimum of 1 day
• Soil bed consolidation– 35 kPa increment
– Up to 103 kPa
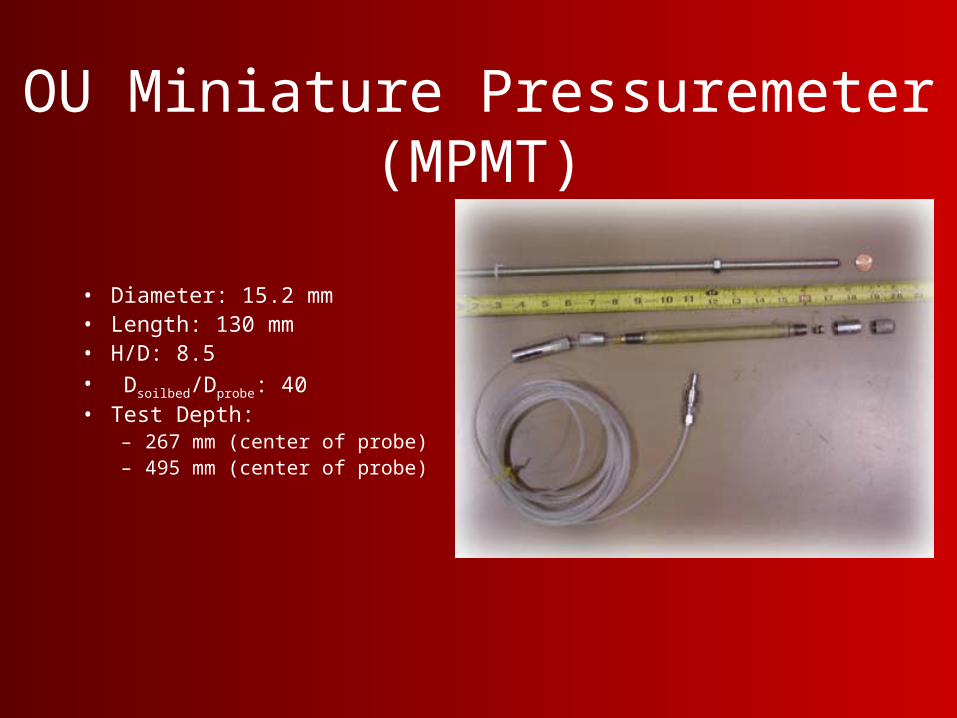
OU Miniature Pressuremeter (MPMT)
• Diameter: 15.2 mm• Length: 130 mm• H/D: 8.5• Dsoilbed/Dprobe: 40• Test Depth:
– 267 mm (center of probe)– 495 mm (center of probe)
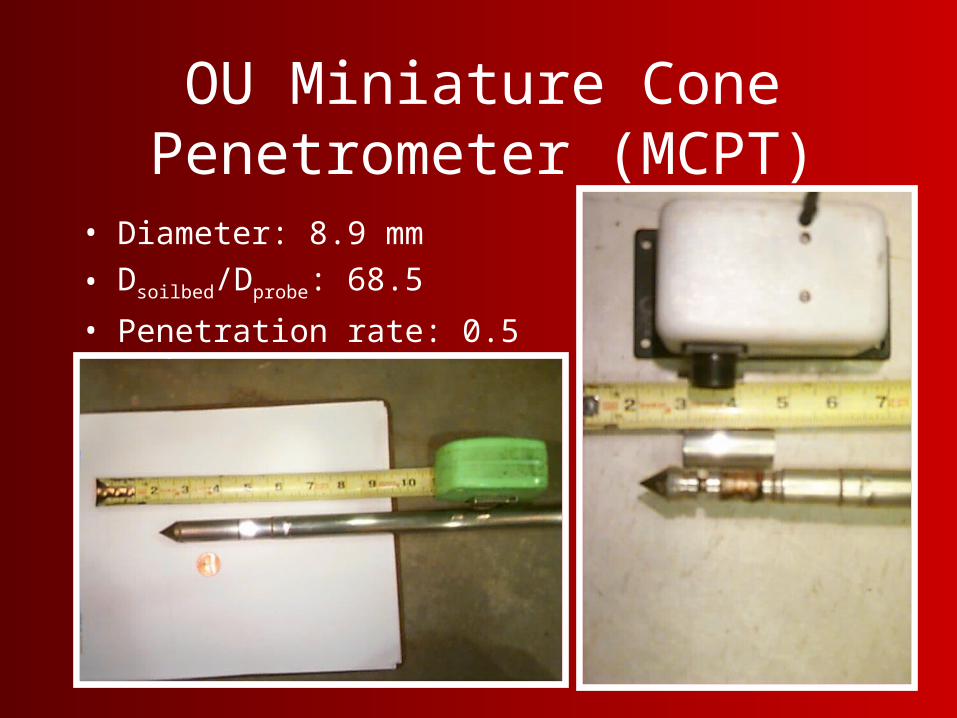
OU Miniature Cone Penetrometer (MCPT)
• Diameter: 8.9 mm
• Dsoilbed/Dprobe: 68.5
• Penetration rate: 0.5 cm/sec

Typical MPMT Results
• Limit Pressure
~ defined as pressure at which vol. of the cavity is twice of initial soil cavity volume
~ determined using 1/v vs P plot
•From test: CCT6 PMT 6-2
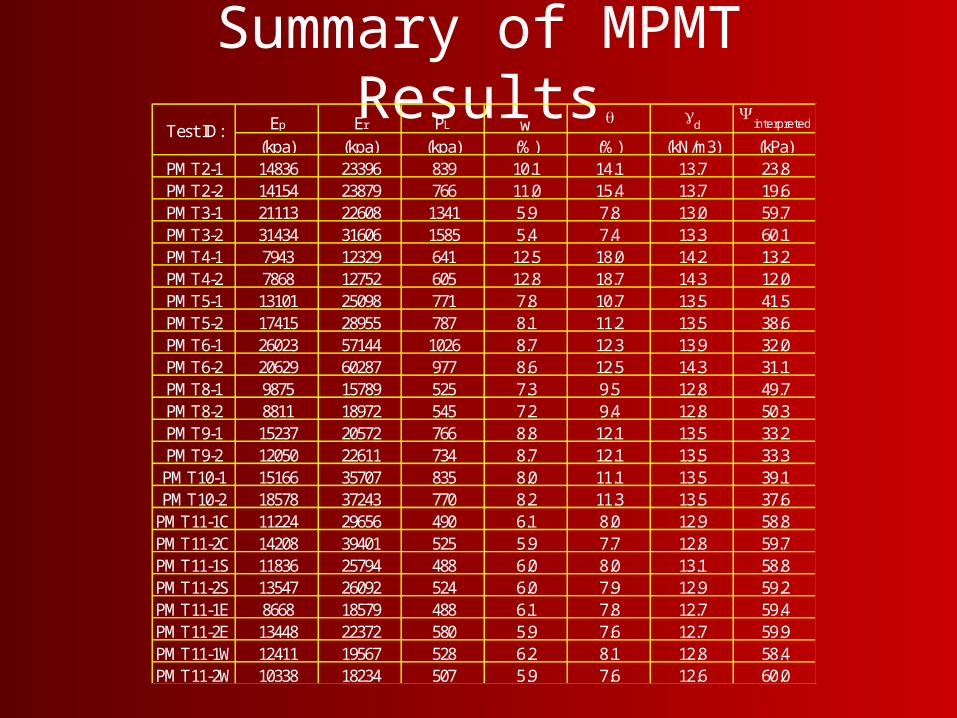
Summary of MPMT Results(kpa) (kpa) (kpa) (%) (%) (kN/m3) (kPa)
PMT2-1 14836 23396 839 10.1 14.1 13.7 23.8PMT2-2 14154 23879 766 11.0 15.4 13.7 19.6PMT3-1 21113 22608 1341 5.9 7.8 13.0 59.7PMT3-2 31434 31606 1585 5.4 7.4 13.3 60.1PMT4-1 7943 12329 641 12.5 18.0 14.2 13.2PMT4-2 7868 12752 605 12.8 18.7 14.3 12.0PMT5-1 13101 25098 771 7.8 10.7 13.5 41.5PMT5-2 17415 28955 787 8.1 11.2 13.5 38.6PMT6-1 26023 57144 1026 8.7 12.3 13.9 32.0PMT6-2 20629 60287 977 8.6 12.5 14.3 31.1PMT8-1 9875 15789 525 7.3 9.5 12.8 49.7PMT8-2 8811 18972 545 7.2 9.4 12.8 50.3PMT9-1 15237 20572 766 8.8 12.1 13.5 33.2PMT9-2 12050 22611 734 8.7 12.1 13.5 33.3PMT10-1 15166 35707 835 8.0 11.1 13.5 39.1PMT10-2 18578 37243 770 8.2 11.3 13.5 37.6
PMT11-1C 11224 29656 490 6.1 8.0 12.9 58.8PMT11-2C 14208 39401 525 5.9 7.7 12.8 59.7PMT11-1S 11836 25794 488 6.0 8.0 13.1 58.8PMT11-2S 13547 26092 524 6.0 7.9 12.9 59.2PMT11-1E 8668 18579 488 6.1 7.8 12.7 59.4PMT11-2E 13448 22372 580 5.9 7.6 12.7 59.9PMT11-1W 12411 19567 528 6.2 8.1 12.8 58.4PMT11-2W 10338 18234 507 5.9 7.6 12.6 60.0
Test ID: Ep Er PL
interpretedw d

MPMT Results
0
200
400
600
800
1000
1200
1400
1600
1800
0.0 10.0 20.0 30.0 40.0 50.0 60.0 70.0
Interpreted Matric Suction (kPa)
Lim
it P
ress
ure
(kP
a)
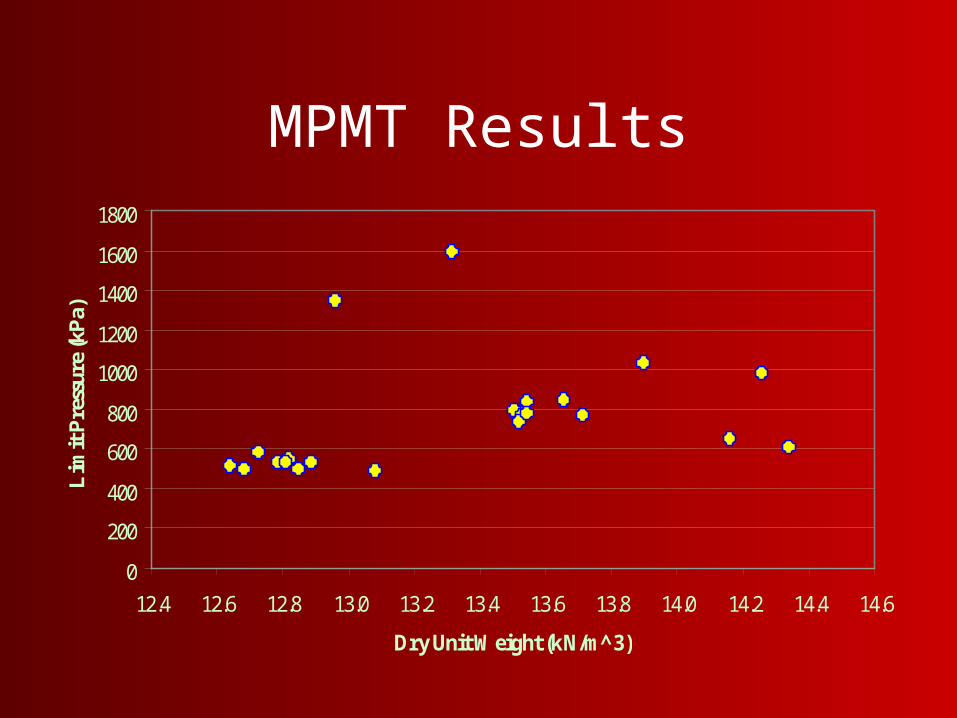
MPMT Results
0
200
400
600
800
1000
1200
1400
1600
1800
12.4 12.6 12.8 13.0 13.2 13.4 13.6 13.8 14.0 14.2 14.4 14.6
Dry Unit Weight (kN/m^3)
Lim
it P
ress
ure
(kP
a)
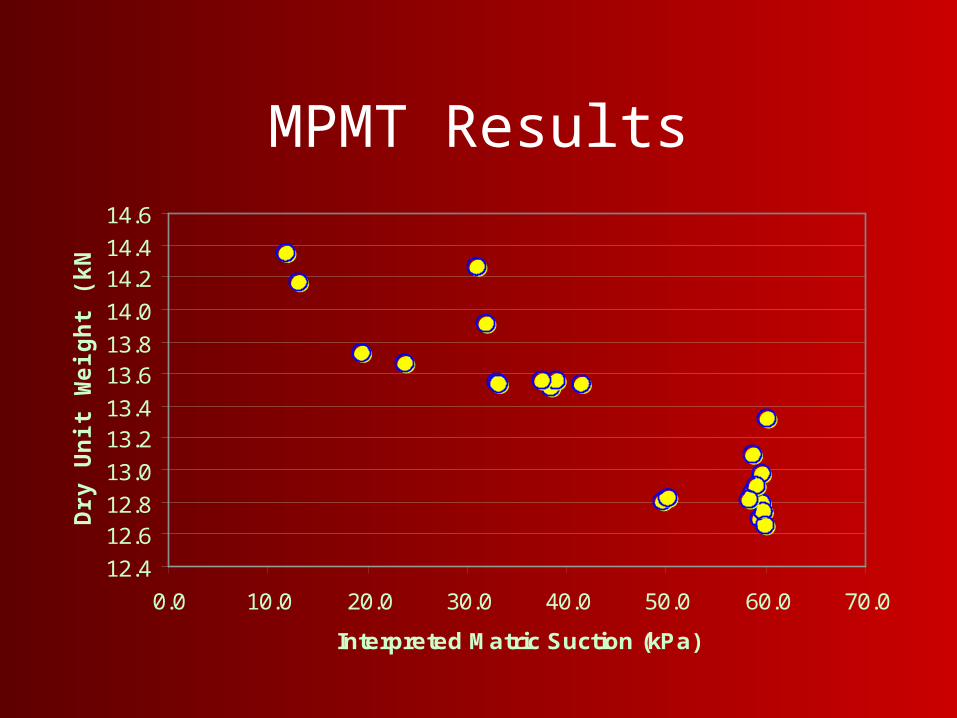
MPMT Results
12.4
12.612.8
13.0
13.213.4
13.613.8
14.0
14.214.4
14.6
0.0 10.0 20.0 30.0 40.0 50.0 60.0 70.0
Interpreted Matric Suction (kPa)
Dry
Un
it W
eig
ht
(kN
/m^
3)
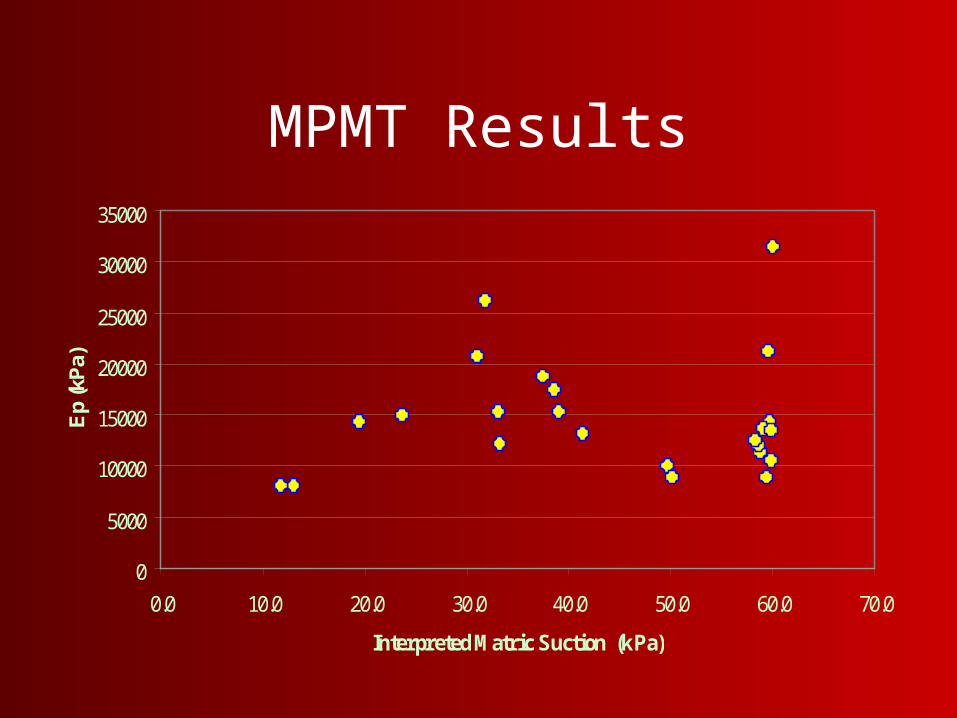
MPMT Results
0
5000
10000
15000
20000
25000
30000
35000
0.0 10.0 20.0 30.0 40.0 50.0 60.0 70.0
Interpreted Matric Suction (kPa)
Ep
(kP
a)
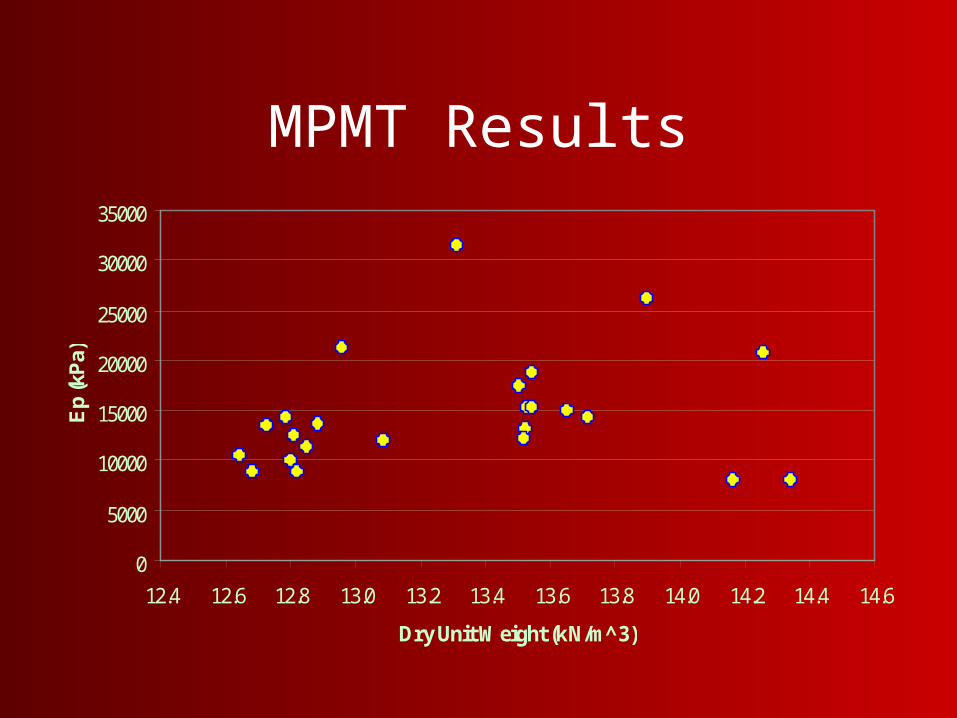
MPMT Results
0
5000
10000
15000
20000
25000
30000
35000
12.4 12.6 12.8 13.0 13.2 13.4 13.6 13.8 14.0 14.2 14.4 14.6
Dry Unit Weight (kN/m^3)
Ep
(kP
a)
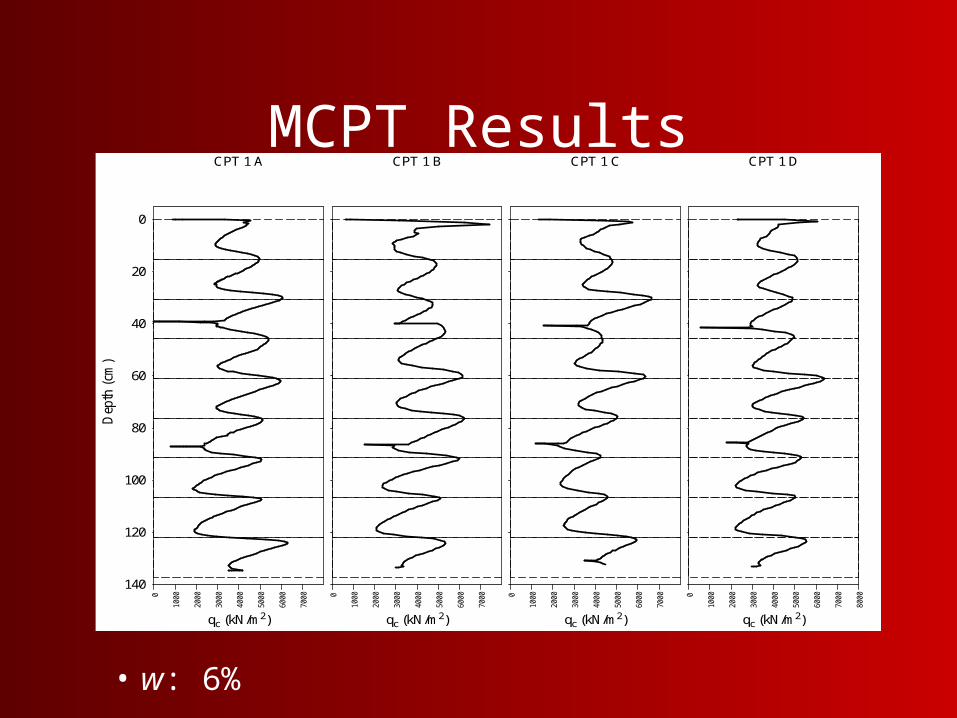
MCPT Results
• w: 6%
CPT 1 A
qc (kN/m2)
0
1000
2000
3000
4000
5000
6000
7000
Dep
th (
cm)
0
20
40
60
80
100
120
140
CPT 1 B
qc (kN/m2)
0
1000
2000
3000
4000
5000
6000
7000
CPT 1 C
qc (kN/m2)
0
1000
2000
3000
4000
5000
6000
7000
CPT 1 D
qc (kN/m2)
0
1000
2000
3000
4000
5000
6000
7000
8000

MCPT Results
• w: 8%
CPT 2 A
qc (kN/m2)
0
1000
2000
3000
4000
5000
6000
7000
Dep
th (
cm)
0
20
40
60
80
100
120
140
CPT 2 B
qc (kN/m2)
0
1000
2000
3000
4000
5000
6000
7000
CPT 2 C
qc (kN/m2)
0
1000
2000
3000
4000
5000
6000
7000
CPT 2 D
qc (kN/m2)
0
1000
2000
3000
4000
5000
6000
7000
8000
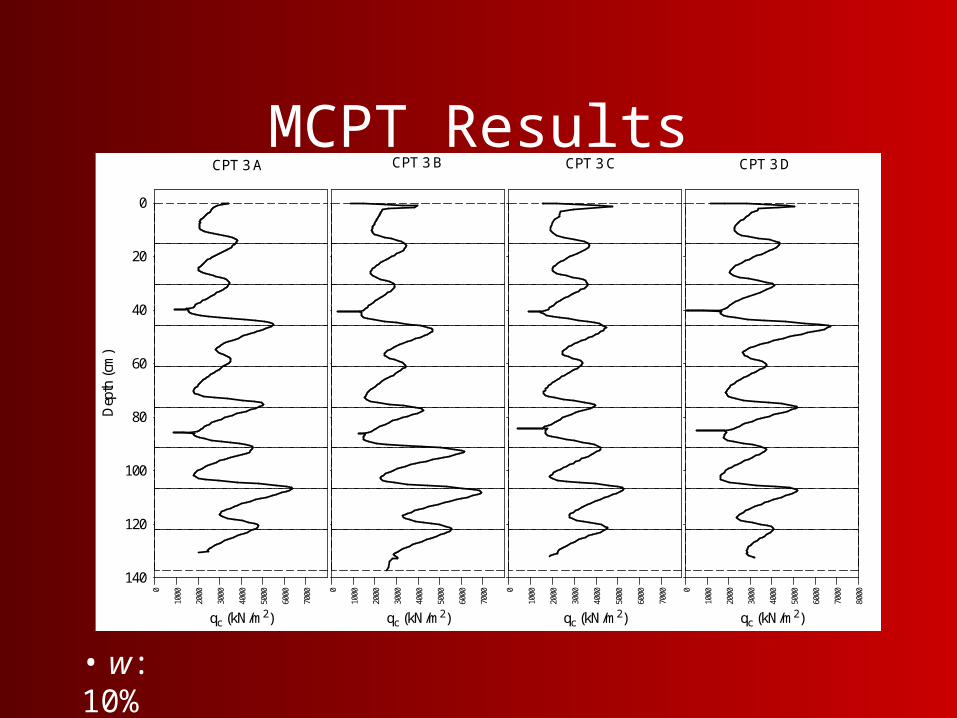
MCPT Results
• w: 10%
CPT 3 A
qc (kN/m2)
0
1000
2000
3000
4000
5000
6000
7000
Dep
th (
cm)
0
20
40
60
80
100
120
140
CPT 3 B
qc (kN/m2)
0
1000
2000
3000
4000
5000
6000
7000
CPT 3 C
qc (kN/m2)
0
1000
2000
3000
4000
5000
6000
7000
CPT 3 D
qc (kN/m2)
0
1000
2000
3000
4000
5000
6000
7000
8000
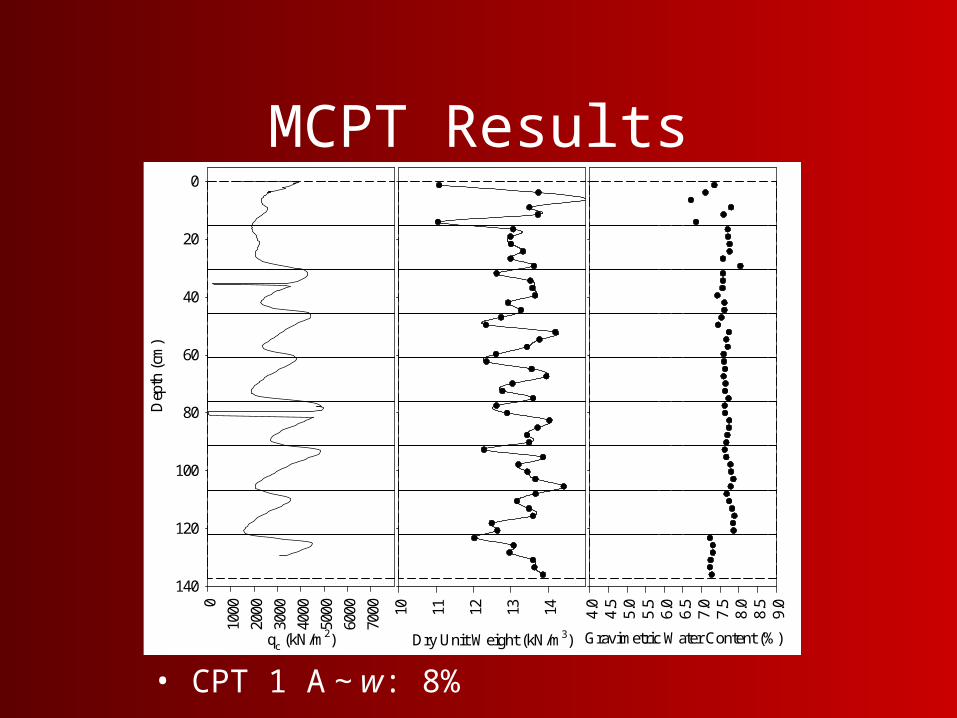
MCPT Results
• CPT 1 A ~ w: 8%
qc (kN/m2)
0
1000
2000
3000
4000
5000
6000
7000
Dep
th (
cm)
0
20
40
60
80
100
120
140
Dry Unit Weight (kN/m3)
10 11 12 13 14
Gravimetric Water Content (%)
4.0
4.5
5.0
5.5
6.0
6.5
7.0
7.5
8.0
8.5
9.0
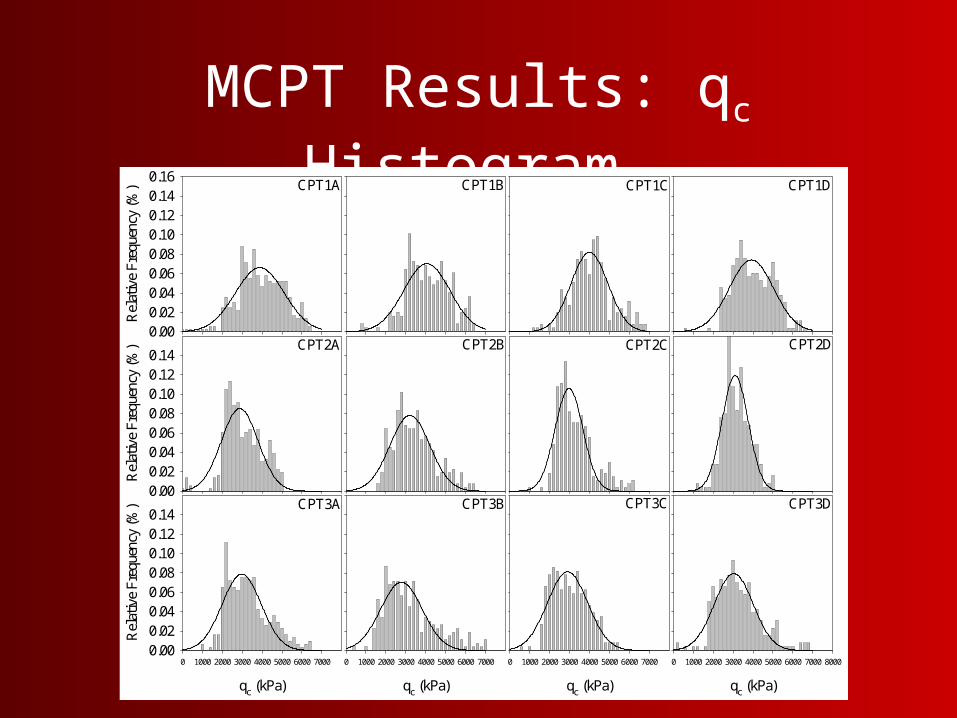
MCPT Results: qc Histogram CPT1A
Rel
ativ
e Fr
eque
ncy
(%)
0.000.020.040.060.080.100.120.140.16
CPT1B CPT1C CPT1D
CPT2A
Rel
ativ
e Fr
eque
ncy
(%)
0.000.020.040.060.080.100.120.14
CPT2B CPT2C CPT2D
CPT3A
qc (kPa)
0 1000 2000 3000 4000 5000 6000 7000
Rel
ativ
e Fr
eque
ncy
(%)
0.000.020.040.060.080.100.120.14
CPT3B
qc (kPa)
0 1000 2000 3000 4000 5000 6000 7000
CPT3C
qc (kPa)
0 1000 2000 3000 4000 5000 6000 7000
CPT3D
qc (kPa)
0 1000 2000 3000 4000 5000 6000 7000 8000
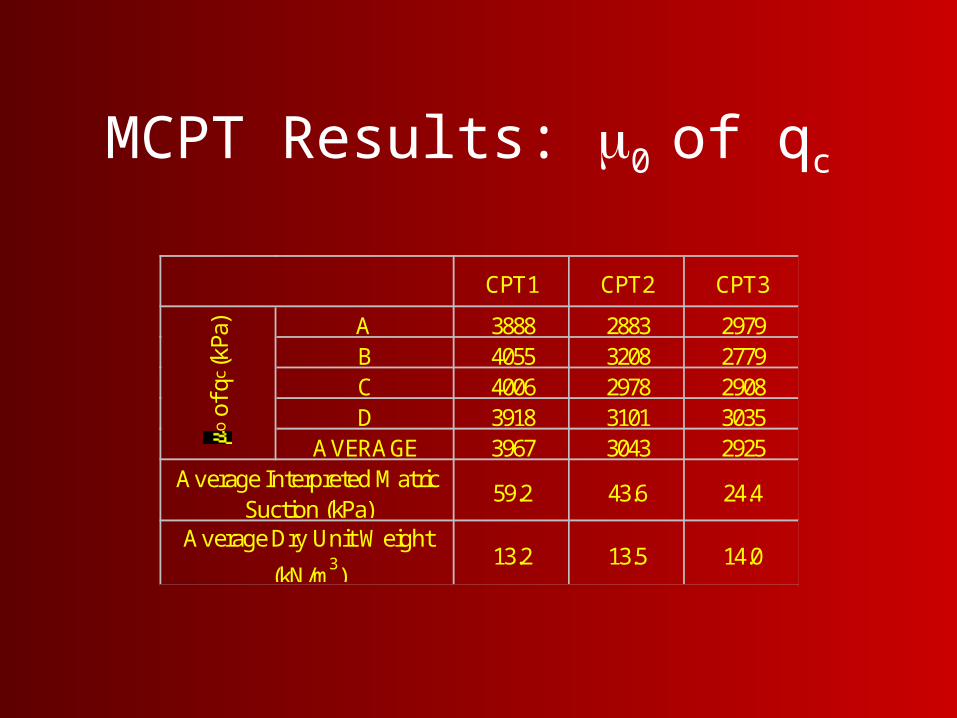
MCPT Results: 0 of qc
CPT1 CPT2 CPT3
A 3888 2883 2979B 4055 3208 2779C 4006 2978 2908D 3918 3101 3035
AVERAGE 3967 3043 2925
59.2 43.6 24.4
13.2 13.5 14.0Average Dry Unit Weight
(kN/m3)
o o
f qc (k
Pa)
Average Interpreted Matric Suction (kPa)
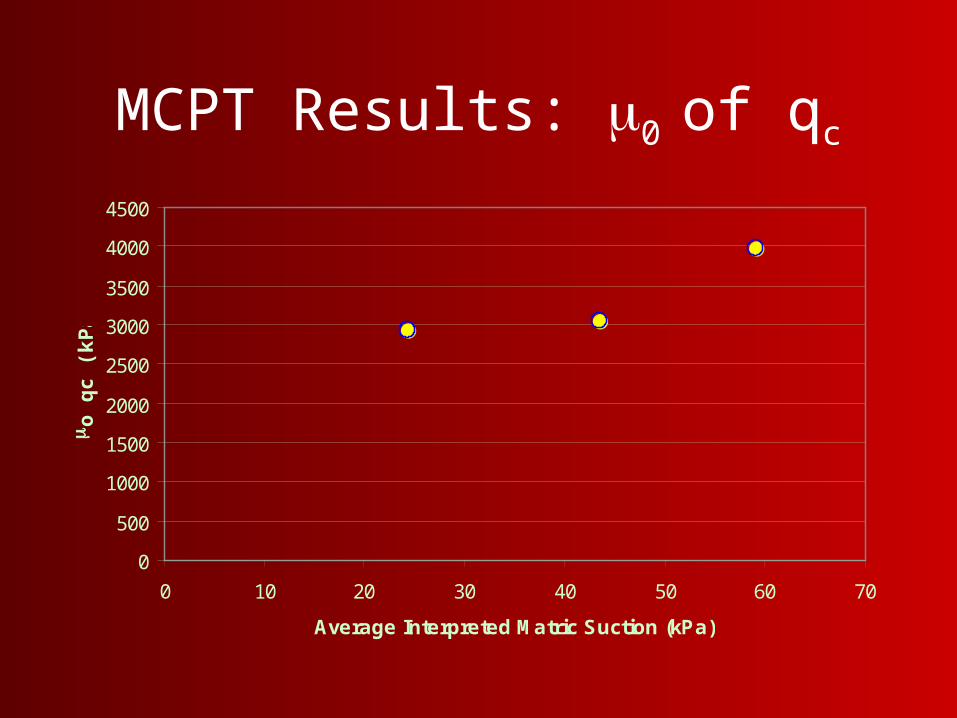
MCPT Results: 0 of qc
0
500
1000
1500
2000
2500
3000
3500
4000
4500
0 10 20 30 40 50 60 70
Average Interpreted Matric Suction (kPa)
o q
c (k
Pa)
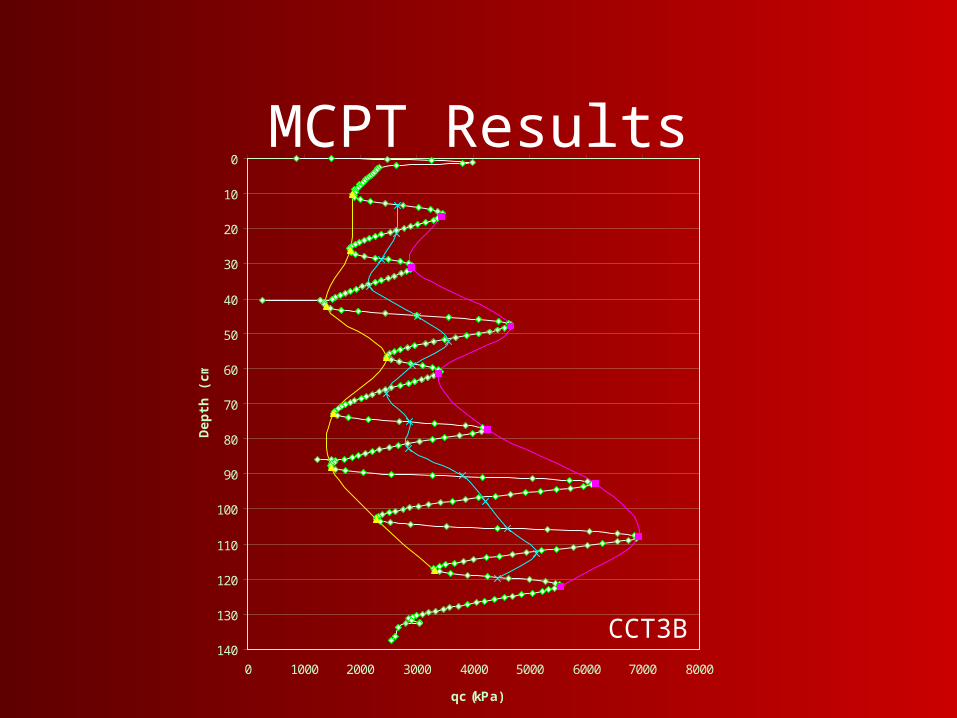
MCPT Results0
10
20
30
40
50
60
70
80
90
100
110
120
130
140
0 1000 2000 3000 4000 5000 6000 7000 8000
qc (kPa)
Dep
th (
cm)
CCT3B
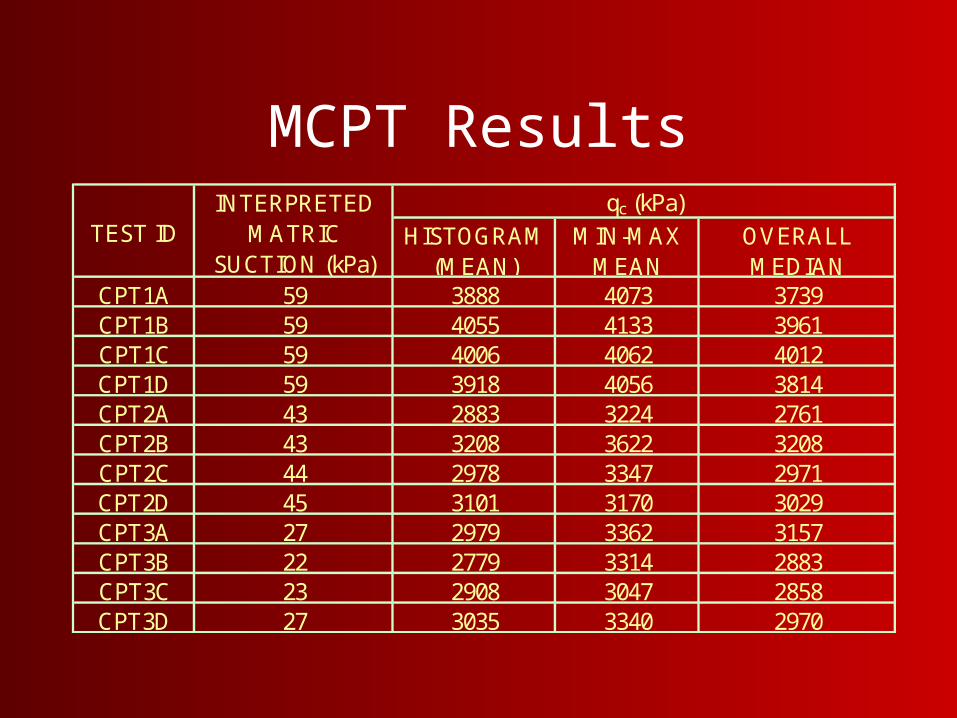
MCPT Results
HISTOGRAM (MEAN)
MIN-MAX MEAN
OVERALL MEDIAN
CPT1A 59 3888 4073 3739CPT1B 59 4055 4133 3961CPT1C 59 4006 4062 4012CPT1D 59 3918 4056 3814CPT2A 43 2883 3224 2761CPT2B 43 3208 3622 3208CPT2C 44 2978 3347 2971CPT2D 45 3101 3170 3029CPT3A 27 2979 3362 3157CPT3B 22 2779 3314 2883CPT3C 23 2908 3047 2858CPT3D 27 3035 3340 2970
qc (kPa)INTERPRETED MATRIC
SUCTION (kPa)TEST ID
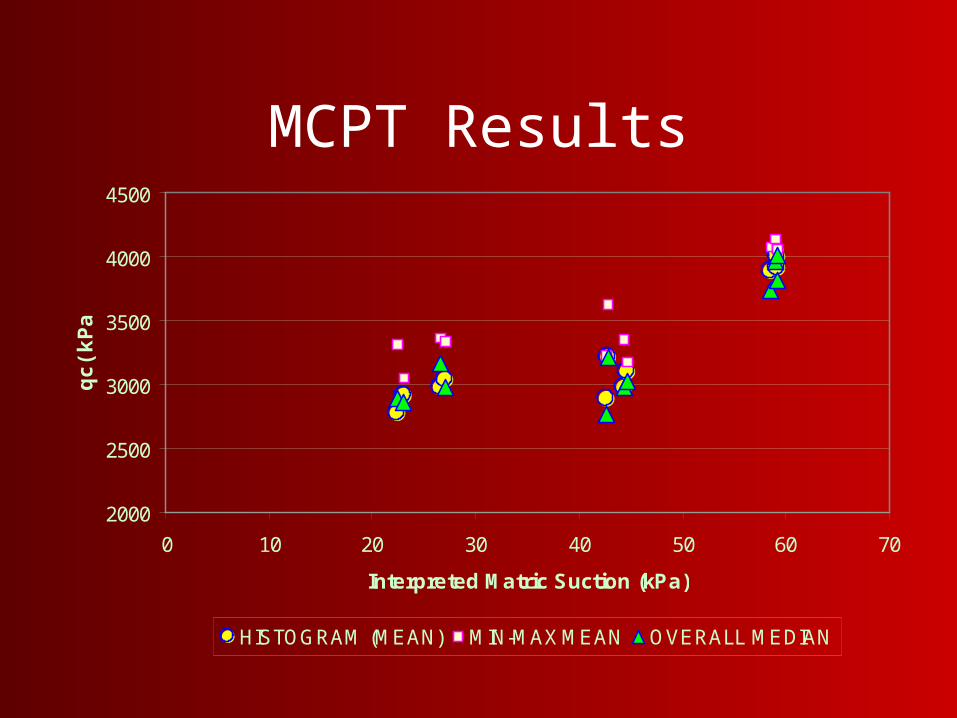
MCPT Results
2000
2500
3000
3500
4000
4500
0 10 20 30 40 50 60 70
Interpreted Matric Suction (kPa)
qc(
kPa)
HISTOGRAM (MEAN) MIN-MAX MEAN OVERALL MEDIAN
Research Questions ???
• What is the true value of H, v for Minco Silt?
• Does c`, `, b varies with initial water content, dry unit weight? How significant?
• Are the interpreted matric suctions the true matric suctions?
• Explanations for the PMT response:
~ trend in ua-uw vs. Pl plot

Thank you !!!