mineral resources and ore reserves report...mineral resource & reserve report 2014 page 7 of 79...
TRANSCRIPT

2014
MINERAL
RESOURCES AND ORE
RESERVES REPORT
Mineral Resource & Reserve Report 2014 Page 2 of 79
TABLE OF CONTENTS
TABLE OF CONTENTS ........................................................................................................................... 2
TABLE OF FIGURES ............................................................................................................................... 4
LIST OF TABLES .................................................................................................................................... 5
LIST OF GRAPHS ................................................................................................................................... 5
1. INTRODUCTION ............................................................................................................................ 6
2. ATTRIBUTABLE REPORTING ..................................................................................................... 6
2.1 Mineral assets 100% attributable to Exxaro Resources ...................................................... 7
2.2 Mineral Assets not 100% attributable to Exxaro .................................................................. 7
3. GOVERNANCE ............................................................................................................................12
4. COMPETENT PERSONS ............................................................................................................13
5. MINERAL RIGHTS AND SECURITY OF TENURE ....................................................................18
6. RISK, LIABILITY AND ASSURANCE .........................................................................................19
7. GROUP SUMMARY OF RESOURCE AND RESERVE ESTIMATES ........................................21
8. ATTRIBUTABLE RESOURCES AND YEAR-ON-YEAR MODIFICATIONS ..............................42
8.1 Attributable tonnage ...........................................................................................................42
9. ANNUAL MINERAL RESOURCE MOVEMENTS .......................................................................43
10. ANNUAL ORE RESERVE MOVEMENTS ...................................................................................45
11. ESTIMATION METHODOLOGY SUMMARY ..............................................................................45
11.1 Mineral resources...............................................................................................................45
11.2 Ore reserves ......................................................................................................................49
12. ANCILLARY RESOURCE AND RESERVE INFORMATION BY OPERATION .........................51
12.1 Arnot coal mine ..................................................................................................................51
12.2 Belfast Project ....................................................................................................................53
12.3 Grootegeluk coal mine .......................................................................................................55
12.4 Thabametsi Project ............................................................................................................57
12.5 Inyanda coal mine ..............................................................................................................59
12.6 Leeuwpan coal mine ..........................................................................................................61
12.7 Matla coal mine ..................................................................................................................62
12.8 NBC coal mine ...................................................................................................................63
12.9 Tshikondeni coal mine .......................................................................................................64
12.10 Mayoko Iron Ore project ....................................................................................................65
13. EXPLORATION ...........................................................................................................................67
13.1 NCC Coal Mine ..................................................................................................................67
13.2 Grootegeluk Coal Mine ......................................................................................................68
13.3 Arnot Coal Mine .................................................................................................................68
13.4 Matla Coal Mine .................................................................................................................69
13.5 NBC Coal Mine ..................................................................................................................69
13.6 Leeuwpan Coal Mine .........................................................................................................70
13.7 Thabametsi project ............................................................................................................71

Mineral Resource & Reserve Report 2014 Page 3 of 79
13.8 Coal Summary ...................................................................................................................71
13.9 Mayoko Project ..................................................................................................................73
13.10 Exploration of areas not included in the Mineral Resource and Reserve Statement ........75
13.10.1 Zonderwater project area ......................................................................................75
13.10.2 Mayoko project ......................................................................................................77
14. ENDORSEMENT .........................................................................................................................79
Mineral Resource & Reserve Report 2014 Page 4 of 79
Table of figures
Figure 1: Locality of Exxaro fully owned and managed operations and projects .................................... 8
Figure 2: Arnot mine locality map .......................................................................................................... 51
Figure 3: Arnot resource areas .............................................................................................................. 52
Figure 4: Location map of Belfast project .............................................................................................. 53
Figure 5: Locality of coal seams over project area ................................................................................ 54
Figure 6: Locality of Grootegeluk mine and Thabametsi project area .................................................. 55
Figure 7: Grootegeluk area view ........................................................................................................... 56
Figure 8: Locality of Thabametsi project area ....................................................................................... 57
Figure 9: Thabametsi geology comparison and proposed bench definition .......................................... 58
Figure 10: Thabametsi proposed mining method .................................................................................. 59
Figure 11: Inyanda locality map ............................................................................................................ 60
Figure 12: Inyanda beneficiation plant .................................................................................................. 60
Figure 13: Leeuwpan coal mine locality map ........................................................................................ 61
Figure 14: Matla mine locality map ........................................................................................................ 62
Figure 15: Matla conveyor system to the power station ........................................................................ 63
Figure 16: NBC locality map with mine and project areas .................................................................... 63
Figure 17: Tshikondeni locality map ...................................................................................................... 65
Figure 18: Location of the Mayoko iron ore deposit .............................................................................. 66
Figure 19: Mayoko ore deposit – schematic representation ................................................................. 67
Figure 20: Grootegeluk coal mine ......................................................................................................... 68
Figure 21: Arnot coal mine .................................................................................................................... 68
Figure 22: Matla coal mine .................................................................................................................... 69
Figure 23: NBC coal mine ..................................................................................................................... 69
Figure 24: Leeuwpan coal mine ............................................................................................................ 70
Figure 25: Grootegeluk West coal project ............................................................................................. 71
Figure 26: Exploitation and exploration permits .................................................................................... 74
Figure 27: Zonderwater location ............................................................................................................ 75
Figure 28: Zonderwater exploration ...................................................................................................... 77
Mineral Resource & Reserve Report 2014 Page 5 of 79
List of tables
Table 1: Shareholding of reported coal resources and reserves ........................................................... 9
Table 2: Exxaro reporting structure ....................................................................................................... 13
Table 3: 2014 competent persons register* ......................................................................................... 15
Table 4: Coal resources reported for 2014 ........................................................................................... 22
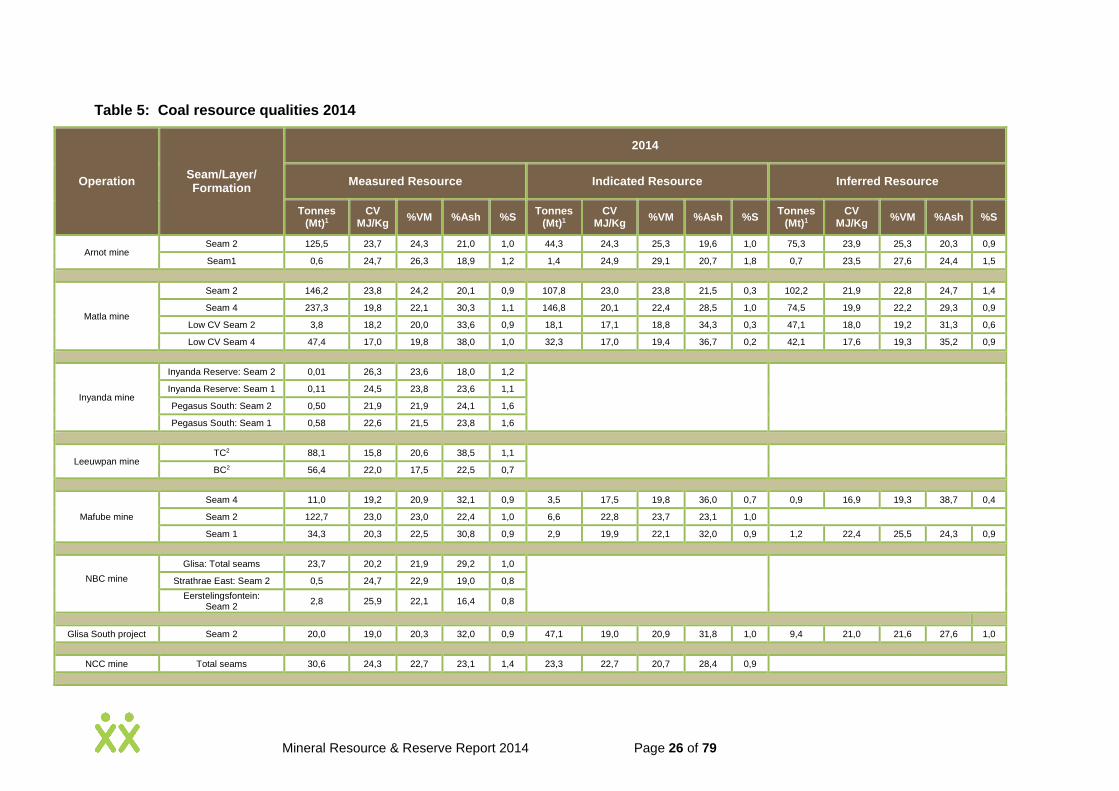
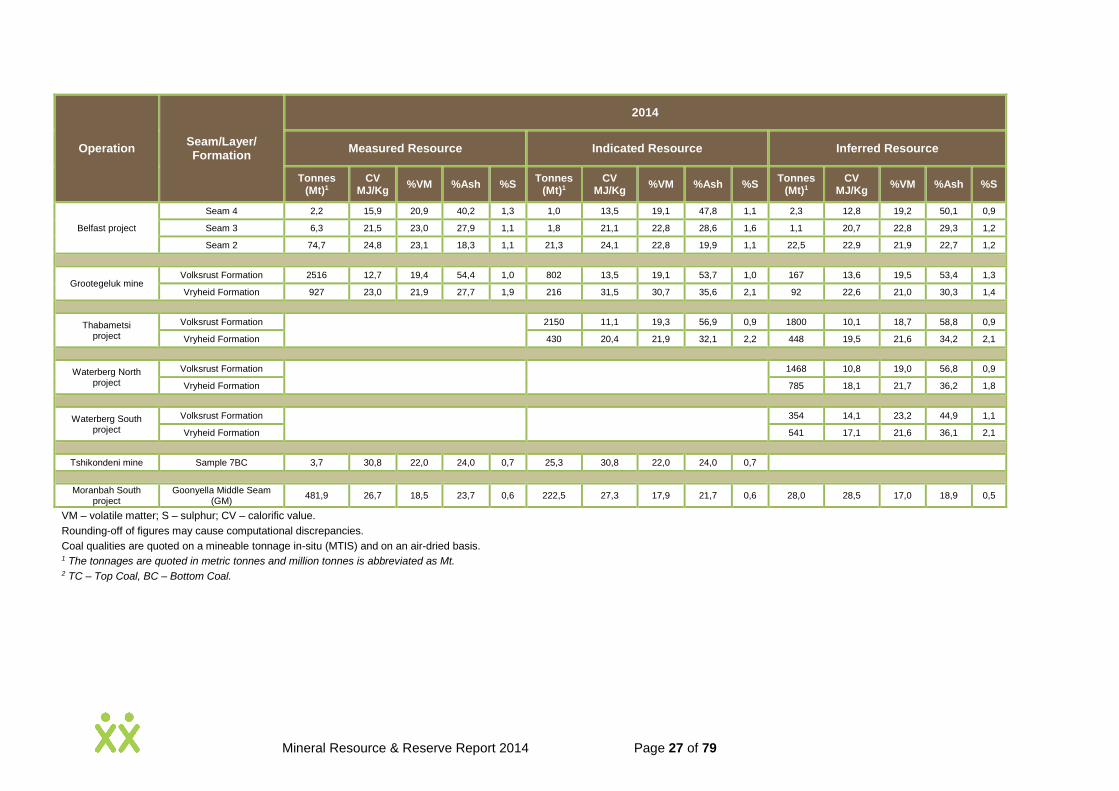
Table 5: Coal resource qualities 2014 .................................................................................................. 26
Table 6: Coal reserves reported for 2014 ............................................................................................. 28
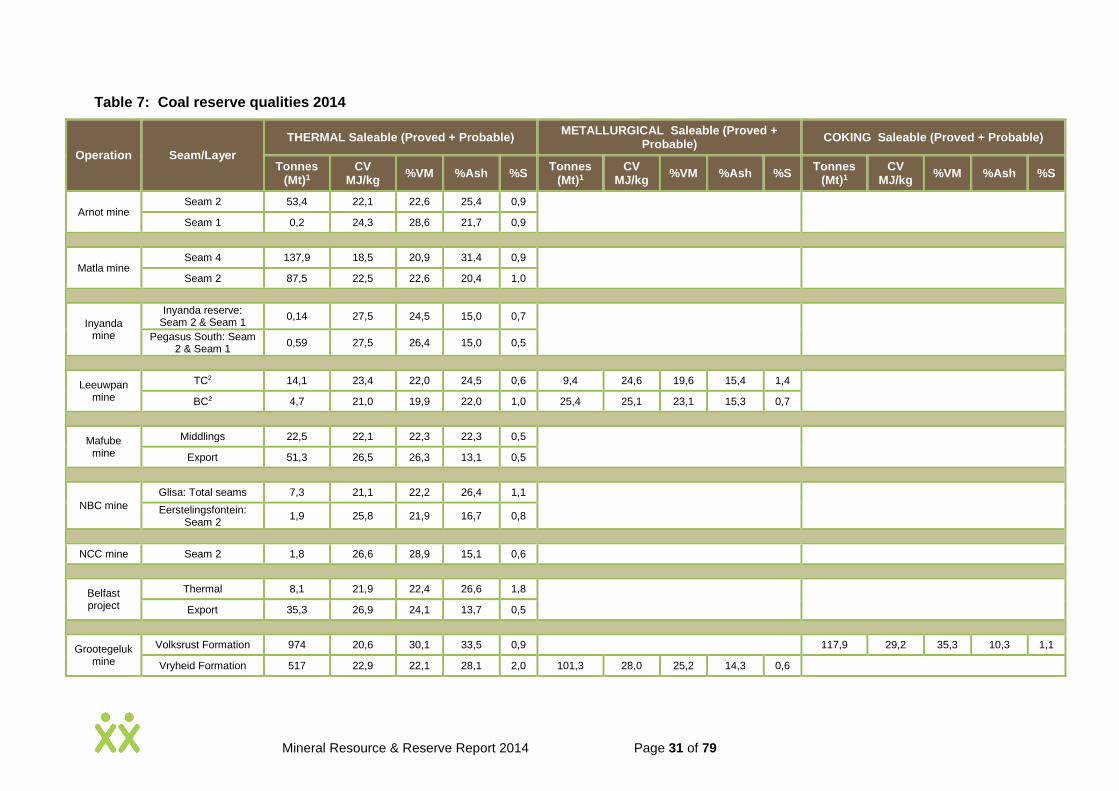
Table 7: Coal reserve qualities 2014 .................................................................................................... 31
Table 8: Mineral sands resources reported for 2014 ........................................................................... 33
Table 9: Mineral sands reserves reported for 2014 ............................................................................. 36
Table 10: Base metals resources reported for 2014 ............................................................................ 38
Table 11: Base metals reserves reported for 2014 .............................................................................. 40
Table 12: Iron ore resources reported for 2014 ................................................................................... 41
Table 13: Attributable resource tonnages (MTIS) ................................................................................. 42
Table 14: Attributable reserve tonnages (ROM).................................................................................... 42
Table 15: Resource applied cut-off ....................................................................................................... 48
Table 16: Summary of exploration expenditure for coal ........................................................................ 72
Table 17: Summary of exploration expenditure .................................................................................... 75
Table 18: Zonderwater exploration summary ........................................................................................ 77
List of graphs
Graph 1: Highveld Coal Mineral Resources Movement from 2013 to 2014 .......................................... 43
Graph 2: Limpopo coal annual resource movement from 2013 to 2014 ............................................... 43
Graph 3: Iron ore annual resource movement 2013 to 2014 ................................................................ 44
Graph 4: Highveld coal annual reserve movement (ROM) ................................................................... 45
Graph 5: Limpopo coal annual reserve movement ............................................................................... 45
Mineral Resource & Reserve Report 2014 Page 6 of 79
1. INTRODUCTION
Exxaro Resources continuously strives to enhance the level of estimation and reporting of mineral resources and reserves. The group is committed to the principles of transparency, materiality and competence in reporting its mineral resources and ore reserves.
The reported Exxaro mineral resources and reserves are presented in the integrated report as a summarised introduction of governance, assurance, methodologies applied, mineral resource and reserve estimates and an overview of significant tenure-related matters during the review period. That summary is supplemented by the information in this report, which is aligned with JSE Listings Requirements (section 12) and encapsulates information on reporting governance, competence, tenure, risk, liabilities and assurance as well as auxiliary descriptions of applicable projects, operations and exploration activities.
Exxaro reports mineral estimates that are directly under its management control (100% shareholding) and includes estimates for entities in which we hold a 25% interest or more. Mineral resource and ore reserve estimates are stated in full (as 100% shareholding). References are made to sources of information in cases where Exxaro holds less than 100% shareholding but where it is deemed necessary to provide additional information to support the principles of materiality and transparency. Exxaro does not presently report on Kumba Iron Ore (19,98% Exxaro ownership), in line with the Exxaro directive above. The inclusion of Kumba’s mineral resource and reserve statement will be considered for the 2015 reporting year given the substantial contribution to Exxaro’s net profit.
The mineral resources and ore reserves underpinning Exxaro’s current operations and growth projects are summarised in the tables on pages 22 to 41. Mineral resources and ore reserves are reported as those remaining on 31 December 2014 and mineral resources are reported inclusive of those resources that have been converted to ore reserves and at 100%, irrespective of the percentage attributable to Exxaro. An exception is our reporting for Gamsberg and Black Mountain, as figures received from Vedanta Resources plc (JORC Code, 2012) represent resources, exclusive of those mineral resources converted to reserves, and reported on 31 March 2014. Significant changes in the resource or reserve figures are explained by footnotes to each table. Ore reserves have the same meaning as mineral reserves as defined in the applicable reporting codes and, in some cases, where it is deemed necessary to clearly emphasise the difference from mineral resources.
Mineral resources and ore reserves were estimated by competent persons on an operational or project basis and in accordance with the SAMREC Code (2009) for African properties, except for Vedanta’s property, and the JORC Code (2012) for Australian properties.
2. ATTRIBUTABLE REPORTING
Exxaro reports mineral estimates that are directly under its management control (100% shareholding) and includes estimates for entities in which Exxaro holds a 25% interest or more. Mineral resource and ore reserve estimates are stated in full (as 100% shareholding). For Kumba Iron Ore, where Exxaro owns 19,98% of Kumba subsidiary Sishen Iron Ore Company (SIOC) but which accounts for a material percentage of our net profit before tax, the reader is referred to the Kumba mineral resources and ore reserves at www.kumbaironore.co.za/reports. The inclusion of
Mineral Resource & Reserve Report 2014 Page 7 of 79
the Kumba Iron Ore mineral resource and reserve statement will be considered for the 2015 reporting year.
2.1 MINERAL ASSETS 100% ATTRIBUTABLE TO EXXARO RESOURCES
Arnot coal mine in Mpumalanga province, near the town of Hendrina
Matla coal mine in Mpumalanga province, near the town of Kriel
Inyanda coal mine in Mpumalanga province, near the town of eMalahleni
Leeuwpan coal mine in Mpumalanga province, near the town of Delmas
North Block Complex (NBC) coal mine in Mpumalanga province, near the town of Belfast
Glisa South coal project in Mpumalanga province, adjacent to NBC coal mine
Belfast project in Mpumalanga province, near the town of Belfast
New Clydesdale Colliery (NCC) coal mine in Mpumalanga province, near the town of eMalahleni
Grootegeluk coal mine in Limpopo province, near the town of Lephalale
Thabametsi project in Limpopo province, adjacent to Grootegeluk coal mine
Waterberg North project in Limpopo province, north-west of the town of Lephalale
Waterberg South project in Limpopo province, north-west of the town of Lephalale
Tshikondeni coal mine in Limpopo province, near the town of Masisi
Lekoumou and Ngongo iron ore projects (part of the larger Mayoko project), near the town of Mayoko in the Republic of the Congo (RoC).
2.2 MINERAL ASSETS NOT 100% ATTRIBUTABLE TO EXXARO
Mafube coal mine in Mpumalanga province, near the town of Middelburg
Moranbah South project near the town of Moranbah, eastern Australia
Hillendale, Braeburn and extension, Fairbreeze, Block P and Port Dunford in KwaZulu-Natal province, near the town of Empangeni
Gravelotte mineral sands project in Limpopo province, near the town of Gravelotte
Namakwa Sands mineral sands mine in Northern Cape province, near the town of Lutzville
Cooljarloo mineral sands mine and Cooljarloo West, North-West, Jurien and Dongara projects in Western Australia
The Deeps, Swartberg Gamsberg zinc, lead, copper and silver mines and Gamsberg East project in Northern Cape province
Exploration properties of Ngoubou-Ngoubou in the Mayoko region in the Republic of the Congo (RoC).

Mineral Resource & Reserve Report 2014 Page 8 of 79
Figure 1: Locality of Exxaro fully owned and managed operations and projects
Mineral Resource & Reserve Report 2014 Page 9 of 79
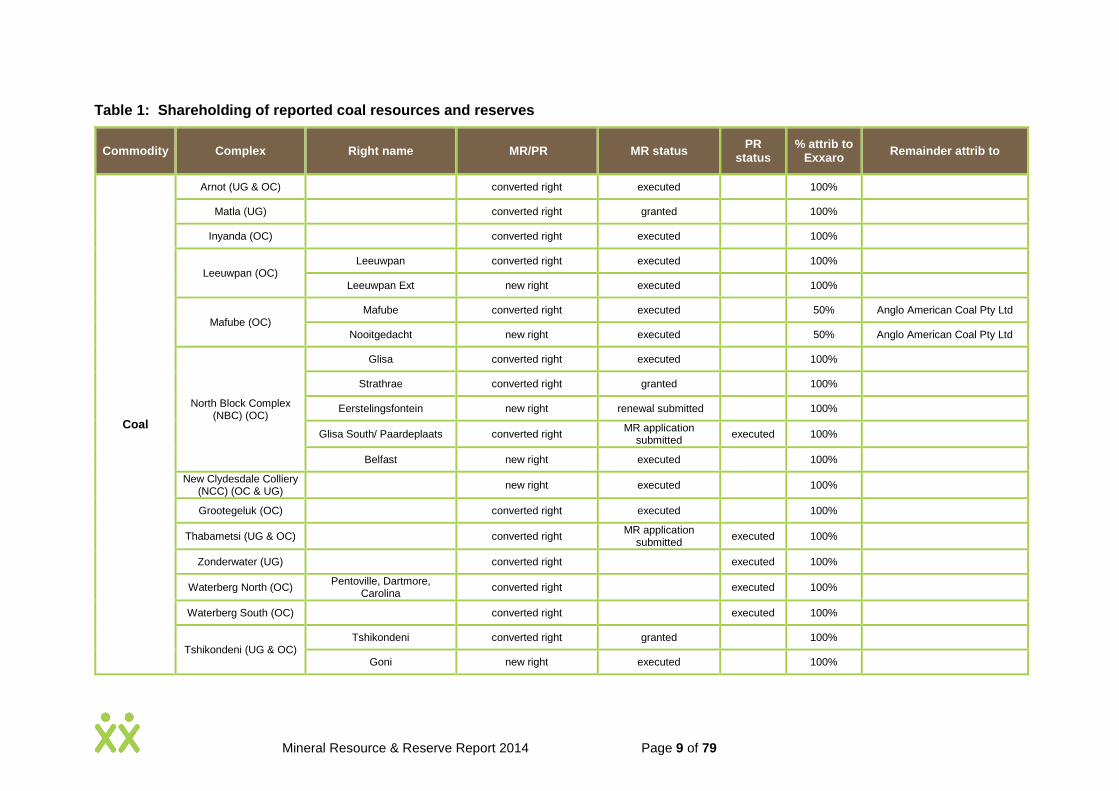
Table 1: Shareholding of reported coal resources and reserves
Commodity Complex Right name MR/PR MR status PR
status % attrib to
Exxaro Remainder attrib to
Coal
Arnot (UG & OC) converted right executed 100%
Matla (UG) converted right granted 100%
Inyanda (OC) converted right executed 100%
Leeuwpan (OC) Leeuwpan converted right executed 100%
Leeuwpan Ext new right executed 100%
Mafube (OC) Mafube converted right executed 50% Anglo American Coal Pty Ltd
Nooitgedacht new right executed 50% Anglo American Coal Pty Ltd
North Block Complex (NBC) (OC)
Glisa converted right executed 100%
Strathrae converted right granted 100%
Eerstelingsfontein new right renewal submitted 100%
Glisa South/ Paardeplaats converted right MR application
submitted executed 100%
Belfast new right executed 100%
New Clydesdale Colliery (NCC) (OC & UG)
new right executed 100%
Grootegeluk (OC) converted right executed 100%
Thabametsi (UG & OC) converted right MR application
submitted executed 100%
Zonderwater (UG) converted right executed 100%
Waterberg North (OC) Pentoville, Dartmore,
Carolina converted right executed 100%
Waterberg South (OC) converted right executed 100%
Tshikondeni (UG & OC) Tshikondeni converted right granted 100%
Goni new right executed 100%

Mineral Resource & Reserve Report 2014 Page 10 of 79
Commodity Complex Right name MR/PR MR status PR
status % attrib to
Exxaro Remainder attrib to
Moranbah South (UG & OC)
MDL 277 and 377 mining licence submitted 50% Anglo American Coal Pty Ltd
EPC 584 and 602 exploration licence executed 50% Anglo American Coal Pty Ltd
Commodity Complex Right name Status MR status PR
status % attrib to
Exxaro Remainder attrib to
Iron ore Mayoko (OC)
Lekoumou exploitation right mining licence granted 100%
Ngoubou-Ngoubou exploration licence granted 85% River SARLU - 10%, Byron SARLU - 5%
Ngongo exploration licence granted 100%
Commodity Complex Right name Status MR status PR
status % attrib to
Exxaro Remainder attrib to
Mineral sands
Hillendale Mine + Braeburn + Braeburn Extension, Block P
converted right executed 58,55% Tronox
Fairbreeze A+B+C+C Ext +D
converted right executed 58,55% Tronox
Port Durnford project converted right executed 58,55% Tronox
Gravelotte sand and rock
converted right executed 100,00% Tronox
Namakwa Sands mine converted right executed 58,55% Tronox
Tiwest: Cooljarloo, Jurien
mining licence executed 43,98% Tronox
Cooljarloo West project, Cooljarloo North-west project,
Dongara
exploration licence executed 43,98% Tronox

Mineral Resource & Reserve Report 2014 Page 11 of 79
Commodity Complex Right name Status MR status PR
status % attrib to
Exxaro Remainder attrib to
Base metals
Deeps & Swartberg (zinc, lead, copper and
silver) converted right executed 26% Vedanta Resources plc
Gamsberg North and Gamsberg East
prospecting (zinc) converted right executed executed 26% Vedanta Resources plc
PR – Prospecting rights
MR – Mining rights
Mineral Resource & Reserve Report 2014 Page 12 of 79
3. GOVERNANCE
Exxaro mineral resources and reserves reporting is compiled from various projects and operations upwards, thus from descriptive detail to integrated summarised results.
Mineral resources and ore reserves were estimated by competent persons on an operational or project basis and in accordance with the SAMREC Code (2009) for African properties, except for Vedanta’s property, and the JORC Code (2012) for Australian properties.
In addition, the annual estimation and reporting process is managed through the Exxaro geosciences policy and associated mineral resource and reserve reporting and mineral resource estimation procedures. Both policy and procedures are aligned with the guidelines of the SAMREC Code and, for South African coal reporting, SANS (SANS 10320:2004).
The policy and procedures dictate technical requirements for estimation and reporting, and include guidelines on methodologies, processes and deliverables. Procedures are also implemented for the geophysical, rock engineering, geotechnical, structural geology, tenure management, hydro-geological and mine planning disciplines that prescribe methodologies and minimum standards for compliance.
The mineral resource and ore reserve tables are compiled from comprehensive independent statements received from appointed resource and reserve competent persons.
Each statement is supported by a mineral resource and reserve report in the format aligned with table 1 of the SAMREC Code, which encapsulates the systematic and detailed estimation process conducted or supervised by the applicable competent person. Each mineral resource and reserve report includes a descriptive reserve fact pack, when mineral reserves are reported, outlining the assumptions and various modifying factors considered when converting resources to reserves. The content of each report is reviewed and signed off by the applicable competent persons, their supporting technical teams and the operational management team. Individual mineral resource and reserve reports are available from the Exxaro company secretary on request. The Exxaro mineral resource and reserve report, from which information is sourced for the integrated report, is compiled from the various individual mineral resource and reserve reports and signed off by the Exxaro lead competent persons.

Mineral Resource & Reserve Report 2014 Page 13 of 79
Table 2: Exxaro reporting structure
Exxaro reporting governance framework
Regulatory Governance Deliverables Assurance
JSE Listings Requirements (section 12)
SAMREC Code (2009) table 1
SANS (SANS 10320:2004)
JORC Code
(2012)
Geosciences policy
Geosciences, mineral asset
management and exploration
strategy
Exxaro mineral resource and
reserve reporting procedure
Exxaro mineral
resource estimation procedure
Exxaro mineral
reserve estimation procedure
Annual resource and reserve estimation
schedule
Mineral resource and reserve fact pacts
Annual
operation/project mineral resource and
reserve report
Consolidated Exxaro mineral resource and
reserve report and statement (CMRR)
Annual review and update of policy and
procedures
Competent person’s critical skills register update and review
Annual individual
mineral resource and reserve report review and lead competent
person sign off
Applicable competent person and technical team
sign off
Internal and external review/audit process
4. COMPETENT PERSONS
Mineral resources and ore reserves were estimated by competent persons on an operational or project basis and in accordance with the SAMREC Code (2009) for African properties, except for Vedanta’s property, and the JORC Code (2012) for Australian properties.
Exxaro has three levels of ‘competency’ applicable to the estimation of mineral resources and ore reserves, namely:
Competent person (as defined in the SAMREC and JORC Codes) at each operation who officially takes responsibility for estimating and reporting mineral resources and/or ore reserves on an ‘operational level’.
Technical specialists, who contribute in any way to the estimation of mineral resources and/or ore reserves and are named and provide sign-off on each operation’s mineral resource and ore reserve statement. These people may be ‘competent’ in their own right in terms of what is required for competency under the SAMREC and JORC Codes, however, they do not take overall responsibility for the mineral resources and ore reserves reported, and as such are not the ‘competent person’. Technical specialists could include geologists, mining engineers, geohydrologists, geotechnicians, financial experts, economists, etc.
Person/s designated to take ‘corporate responsibility’ for the mineral resource and ore reserve estimates presented in the consolidated report. This definition clearly differentiates the competent person on an operational level from the person(s) who takes overall corporate responsibility for the mineral resource and ore reserve estimates presented in this report.
Mineral Resource & Reserve Report 2014 Page 14 of 79
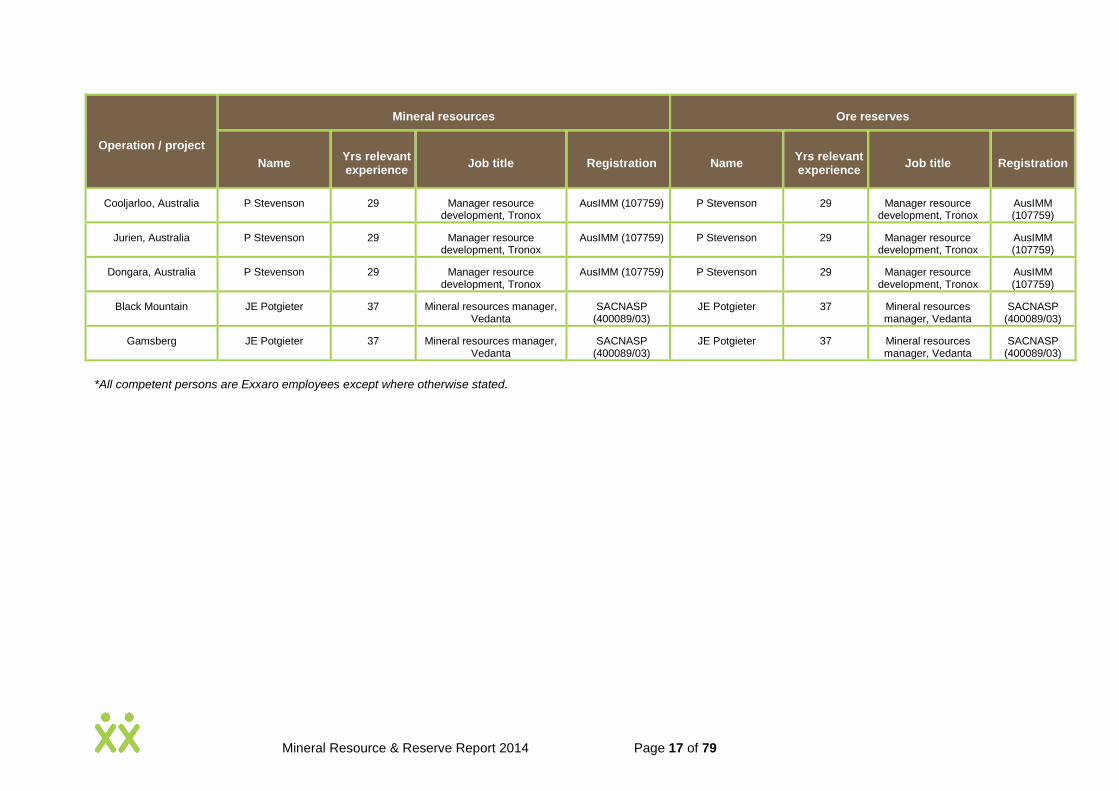
Exxaro’s mineral resources and ore reserves have been estimated or supervised by the competent persons listed in Table 3 on an operational basis in accordance with the SAMREC Code for South African properties and the JORC Code for Australian properties. All competent persons have sufficient relevant experience in the style of mineralisation, type of deposit and/or mining method(s) under consideration and/or being mined and for the activity they have taken responsibility for, to qualify as ‘competent persons’ as defined in the applicable codes at the time of reporting. The appointed competent persons have signed off their respective estimates in the original mineral resource and reserve statements for the various operations, and consent to the inclusion of the information in this report in the form and context in which it appears in the consolidated mineral resource and reserve report. Technical specialists who contributed to the estimation of the operation’s mineral resources and ore reserves are included in the original documentation, where their contributions are specified and their signatures appear.
The Exxaro lead competent persons are appointed by the Exxaro management team. The Exxaro lead mineral resource competent person is Henk Lingenfelder, a member of the Geological Society of South Africa (GSSA) and registered (400038/11) with the South African Council for Natural Scientific Professions. He has a BSc (Hons) in geology and 20 years of experience as an exploration and mining geologist in coal, iron ore and industrial minerals. The Exxaro lead mineral reserve competent person is Johann Hager, a mining engineer registered (20050209) with the Engineering Council of South Africa. He is a mining engineer with 25 years of experience in iron ore, base metals and coal in various technical and management roles.

Mineral Resource & Reserve Report 2014 Page 15 of 79
Table 3: 2014 competent persons register*
Operation / project
Mineral resources Ore reserves
Name Yrs relevant experience
Job title Registration Name Yrs relevant experience
Job title Registration
Lead CP, Exxaro JH Lingenfelder 20 Manager geosciences SACNASP (400038/11)
J Hager 25 Manager mining processes
ECSA (20050209)
Arnot colliery MV Sambo 7 Resident geologist, Arnot SACNASP (400369/12)
MX Shezi 17 Planning & optimisation manager
ECSA
(200910007)
Belfast project FJP Schutte 32 Principal geologist, coal, HQ, SACNASP (400007/92)
PDM Lourens 10 Principle mining engineer SAIMM (702550)
Glisa South project FJP Schutte 32 Principal geologist, coal, HQ, SACNASP (400007/92)
Grootegeluk coal mine CW van Heerden 12 Resident geologist, Grootegeluk
SACNASP (400069/04)
J Hager 25 Manager mining processes
ECSA
(20050209)
Inyanda coal J Maseko 9 Senior geologist, Inyanda GSSA (966522) SM Mazubane 7 Manager mining SAIMM (703195)
Leeuwpan coal mine M Steenkamp 4 Resident geologist, Leeuwpan SACNASP (400173/13)
M Sethethi 9 Manager mining ECSA (20095030)
Mayoko W van der Schyff 24 Principal geologist, iron ore SACNASP (400176/05)
Matla TF Moabi 9 Senior geologist SACNASP (400067/08)
B Young 19 Planning & optimisation manager
PLATO, PMS (0182)
NBC G Gcayi 7 Resident geologist, NBC SACNASP (400299/11)
E Croeser 8 Manager mining ECSA (201110024)
NCC FJP Schutte 32 Principal geologist, coal, HQ, Exxaro
SACNASP (400007/92)
MX Shezi 17 Planning & optimisation manager
ECSA
(200910007)
Thabametsi project FJP Schutte 32 Principal geologist, coal, HQ, Exxaro
SACNASP (400007/92)
Tshikondeni coal mine M Ngobeli 8 Senior geologist, Tshikondeni SACNASP (100195/13)
K Sithomola 10 Chief surveyor IMSSA (2029)

Mineral Resource & Reserve Report 2014 Page 16 of 79
Operation / project
Mineral resources Ore reserves
Name Yrs relevant experience
Job title Registration Name Yrs relevant experience
Job title Registration
Waterberg North project FJP Schutte 32 Principal geologist, coal, HQ, Exxaro
SACNASP (400007/92)
Waterberg South project FJP Schutte 32 Principal geologist, coal, HQ, Exxaro
SACNASP (400007/92)
Mafube (Nooitgedacht & Wildfontein)
D Xaba 15 Geology manager, Anglo Coal SACNASP (400019/05)
D Xaba 15 Geology manager, Anglo Coal
SACNASP (400019/05)
Mafube colliery (Springboklaagte)
D Xaba 15 Geology manager, Anglo Coal SACNASP (400019/05)
D Xaba 15 Geology manager, Anglo Coal
SACNASP (400019/05)
Moranbah South, Australia
AJ Laws 19 Specialist resource geologist, Anglo American Coal
AusIMM (209913)
Hillendale mine, Extension
D Sibiya 19 Geologist, Tronox SACNASP (400294/06)
H Kruger 14 Mine manager, Tronox ECSA (C20100270)
Fairbreeze A+B+C+C Ext
D Sibiya 19 Geologist, Tronox SACNASP (400294/06)
H Kruger 14 Mine manager, Tronox ECSA (C20100270)
Block P & Block extension
D Sibiya 19 Geologist, Tronox SACNASP (400294/06)
Port Dunford D Sibiya 19 Geologist, Tronox SACNASP (400294/06)
Fairbreeze D D Sibiya 19 Geologist, Tronox SACNASP (400294/06)
H Kruger 14 Mine manager, Tronox ECSA (C20100270)
Eastern Cape D Sibiya 19 Geologist, Tronox SACNASP (400294/06)
Namakwa Sands M Alchin 12 Manager planning & optimisation, Tronox
SACNASP (400126/11)
M Alchin 12 Manager planning & optimisation, Tronox
SACNASP (400126/11)
Gravelotte sand W van der Schyff 24 Principal geologist, iron ore SACNASP (400176/05)
Gravelotte rock W van der Schyff 24 Principal geologist, iron ore SACNASP (400176/05)
Mineral Resource & Reserve Report 2014 Page 17 of 79
Operation / project
Mineral resources Ore reserves
Name Yrs relevant experience
Job title Registration Name Yrs relevant experience
Job title Registration
Cooljarloo, Australia P Stevenson 29 Manager resource development, Tronox
AusIMM (107759) P Stevenson 29 Manager resource development, Tronox
AusIMM (107759)
Jurien, Australia P Stevenson 29 Manager resource development, Tronox
AusIMM (107759) P Stevenson 29 Manager resource development, Tronox
AusIMM (107759)
Dongara, Australia P Stevenson 29 Manager resource development, Tronox
AusIMM (107759) P Stevenson 29 Manager resource development, Tronox
AusIMM (107759)
Black Mountain JE Potgieter 37 Mineral resources manager, Vedanta
SACNASP (400089/03)
JE Potgieter 37 Mineral resources manager, Vedanta
SACNASP (400089/03)
Gamsberg JE Potgieter 37 Mineral resources manager, Vedanta
SACNASP (400089/03)
JE Potgieter 37 Mineral resources manager, Vedanta
SACNASP (400089/03)
*All competent persons are Exxaro employees except where otherwise stated.
Mineral Resource & Reserve Report 2014 Page 18 of 79
5. MINERAL RIGHTS AND SECURITY OF TENURE
Mineral resources and mineral reserves quoted for Exxaro managed assets fall within existing Exxaro mine or prospecting rights. Mining rights are of sufficient duration (or convey a legal right to convert or renew for sufficient duration) to enable all reserves to be mined in accordance with current production schedules. The only exception is Grootegeluk mine where the new-order mine right, registered in June 2012, was granted for a period of 30 years and where there are adequate reserves for a life of mine extending well beyond this period.
The status of prospecting and mining rights is presented in Table 1.
The converted mining right for Arnot mine, a dedicated coal supplier to Eskom, is executed. This mine, which traditionally consisted of underground workings and extracting coal seam 2, also includes open-cut developments on the farms Mooifontein and Grootlaagte, targeting coal seams 1, 2, 4 and 5. Ongoing technical studies, surface acquisition and environmental authorisations (e.g. Mooifontein Re, 1, 7 and Grootlaagte) for the various farms’ portions in the open-cut areas are progressing well and at varying levels of finalisation.
The converted mining right of Matla mine, a dedicated coal supplier to Eskom, has been granted. Execution of the right is expected to be concluded in the first part of 2015.
The converted mining right and adjacent new mining right at Leeuwpan mine have both been executed. The approval of a ministerial consent (section 102) submitted to amalgamate the two rights is pending. All environmental approvals for the strategic Leeuwpan OI reserve were submitted timeously and Exxaro has a reasonable expectation that approvals will not be withheld. Exxaro owns all surface rights for phase 1 and 2 of the OI reserve and negotiations for the surface rights for phase 3 are under way.
North Block Complex includes the traditional mining areas of Glisa (converted mining right), Strathrae (converted mining right) and Eerstelingsfontein, an executed new mining right. Environmental approvals for Eerstelingsfontein have been granted and approval for the renewal of the mining right, timeously submitted in March 2013, is pending. In addition, a renewal for a prospecting right and a new mining right for the Glisa South project area, immediately adjacent to Glisa, was timeously submitted in November 2013. An appeal received is currently being addressed through the regional mining development and environment committee.
In 2013, Exxaro initiated a process to disinvest from New Clydesdale Colliery. An application for a ministerial consent (section 11) was submitted in April 2014 to cede the mining right. All requests for additional information by the DMR have been timeously addressed and approval is pending.
The Belfast mining right was received in October 2013 and subsequently executed. All environmental authorisations were received at the time of reporting and operational implementation will proceed.
A prospecting right renewal was timeously submitted for the Thabametsi project area, a resource adjacent to the Grootegeluk coal mine. In addition, a new mining right application was submitted in April 2012. Environmental approvals have been received (pending water use license) as on 31 December 2014 and Exxaro has a reasonable expectation that the mining right will be granted in 2015.

Mineral Resource & Reserve Report 2014 Page 19 of 79
The Moranbah South project area in Australia includes two mineral development licenses (MDL) and two exploration permits for coal (EPC). Both mineral development licenses expired between July and September 2013, but renewals for MDL 277 and MDL 377 were timeously submitted in January 2013 and March 2013 respectively. Exxaro has a reasonable expectation that approvals for both licenses will not be withheld. EPC 548 expires in February 2017 and EPC 602 in December 2018. Exploration activities comply with all license requirements.
In the Republic of the Congo (RoC), the Mayoko-Lekoumou exploitation permit for iron was granted in August 2013 for 25 years and will be renewable in line with the provisions of the mining code of the RoC. The Mayoko mining exploitation convention was concluded between the RoC government and Exxaro Mayoko SA on 29 January 2014. This convention is still subject to fulfilling certain conditions precedent, such as concluding all agreements on access to rail and port infrastructure.
Immediately north of the Lekoumou exploitation permit, the Ngongo exploration permit for iron was granted in April 2014. This exploration permit was granted for three years and will be renewable twice for periods of two years in line with the provisions of the RoC mining code. In addition, to the far north, the Ngoubou-Ngoubou exploration permit for iron was granted in December 2012 for a period of three years and may be renewed twice for periods of two years in line with the provisions of the RoC mining code.
6. RISK, LIABILITY AND ASSURANCE
Assurance is implemented on a two-tier level aligned with the guidelines of the Exxaro mineral resource and reserve reporting procedure.
Assurance is firstly addressed concurrently on each individual operation/project during the resource and reserve estimation process, which is executed according to a formal schedule. The prior-year mineral resource and reserve estimates as well as the mineral resource and reserve fact packs that encapsulate all relevant information considered during estimation are reviewed at the start of every reporting year by the applicable CPs and management teams to establish what actions are required.
All modifying factors considered with the conversion of resources to reserves are reviewed and any significant change will trigger a formal review and possible implementation of a corrective measure, e.g. updating the life of mine plan. Resource and reserve estimation is conducted on a formal signed-off schedule and the process may not proceed without a review, possible corrections and sign-off from the applicable CP and internal reviewer. As example, a database validation, subsequent proposed corrections and sign-off is required to proceed to data analysis and then modelling. The sign-off validation for resources and reserves is incorporated into the individual competent person’s report.
On tier two, the Exxaro mining and exploration operations are internally reviewed on a three-year cycle aligned with the applicable mineral resource and reserve procedure. The reviews are conducted by the lead CPs, technical experts from the central geological and mining consulting services and CPs (peer) from other operations. The outcome of the reviews is prioritised and tracked continuously to ensure corrective measures are applied.
For mineral resources, as with the previous year, the most frequent finding revolved around the use of historical holes in the resource-estimation process. This finding is especially applicable in historical operations like Arnot, NBC, Matla and Belfast. A

Mineral Resource & Reserve Report 2014 Page 20 of 79
process was implemented to review the geological logs of historical holes, confirm seam definitions and evaluate correlation with surrounding holes. The structure models of Arnot, Matla, Leeuwpan (OI) and Grootegeluk were reviewed and incorporated into the geological model updates.
The review and sign-off on mineral reserve fact packs (assumptions related to modifying factors considered for conversion of resources to reserves) are conducted between February and June each year. Exploration plans are reviewed in September (for following year budget purposes) and signed off in January of the reporting year by the applicable exploration manager, commodity geologist and Exxaro lead resource CP.
Calculations associated with the mineral resource estimates have been audited by internal competent persons and are audited by external consultants when deemed essential to establish transparency. Open tenders from the industry are invited for external reviews of mineral resource and reserve estimation processes and reviews on the Grootegeluk and Leeuwpan mines and the Belfast and Mayoko projects were conducted in 2014.
For Grootegeluk mine, audited by Golder Associates, the overall outcome of the review was positive. The methodologies and application of first geological principles on data capture, sampling and subsequent analysis are deemed correct and the geological model is accepted as a realistic representation of captured geological and analytical results. Recommendations included that a number of approaches should be tested in using faulted boreholes. Currently faulted holes are modelled using only original point of observation. The use of substitute holes to ensure a practical interpretation for mining purposes is recommended and the approach will be considered when reviewing the model in 2015/2016. In addition, minor corrections in the database are required and a number of anomalous quality data should be investigated. A recommendation that cubic spline or least-squares regression formulas should be used for wash table data will be considered.
The MSA Group reviewed a number of Leeuwpan resource areas (OWM, UB and OH). In summary, spatial data were deemed adequate for resource modelling and the available points of information sufficient to appreciate the geology. The reporting of MTIS and applied classification are considered acceptable. Recommendations included that the low level of recovery in certain boreholes might suggest that the drilling and sampling methodology may have to be reassessed to achieve the 95% recoveries as stipulated in SANS 10320:2004. This recommendation is currently evaluated specifically in relation to the high frequency of large and numerous smaller dykes that occur in the area of investigation and the implementation of future more-frequent down-hole geophysical logging is considered. It was recommend that, although core logging practice is adequate, geological logging should be enhanced to include more detail and per example the implementation of core photographs. All recommendations have been prioritised, and evaluation and implementation of corrective measures are tracked and documented.
For the Belfast project, audited by The Mineral Corporation, a number of valid and constructive recommendations were made on data management, modelling methodology, process documentation and reporting of coal resources. The inclusion of historical drillholes was highlighted specifically because of the lack of supporting documentation. Exxaro has done a comparison between geological models including and excluding the historical holes and differences on quality, volume and tonnage are deemed negligible. However, the geological model and resource estimate will be reviewed during the reporting year specifically to evaluate and
Mineral Resource & Reserve Report 2014 Page 21 of 79
document the inclusion or exclusion of each historical hole. Recommendations are prioritised and corrective measures/evaluation tracked.
For the Mayoko iron ore project, the MSA Group considers that the data acquisition and analytical methods are of an appropriate standard for a typical iron ore deposit. MSA considers that the geological and geostatistical methodology used is reasonable, although a number of minor modifications to the processes were identified that could enhance the estimate. Minor errors in coding the block model were identified, and should be corrected, however, these errors will not materially impact on the accuracy of the overall mineral resource.
In MSA’s opinion, the mineral resource has generally been prepared and documented in accordance with SAMREC (2007) guidelines. A number of items could be included in supporting documentation for the mineral resource estimate, such as an opinion by Exxaro’s competent person on the effect of core and reverse circulation drilling recovery results on the mineral resource.
Although there are a number of areas of improvement, as detailed in this report, no fatal flaws were identified that would affect the reported mineral resource. In summary, MSA is satisfied that the work is being conducted in a competent and professional manner.
7. GROUP SUMMARY OF RESOURCE AND RESERVE ESTIMATES
This document indicates Exxaro’s mineral resources and ore reserves remaining after the company’s financial year end on 31 December 2014. Mineral resource and ore reserve figures are not an inventory of all mineral occurrences drilled or sampled, but a realistic record of those, which under assumed and justifiable technical and economic conditions, may be economically extractable currently and in future.
Mineral resources and ore reserves are reported inclusive of those resources that have been converted to ore reserves and at 100%, irrespective of the percentage attributable to Exxaro. An exception is reporting for Gamsberg and Black Mountain, because figures received from Vedanta plc (JORC Code) represent resources exclusive of reserves and reported on 31 March 2014.

Mineral Resource & Reserve Report 2014 Page 22 of 79
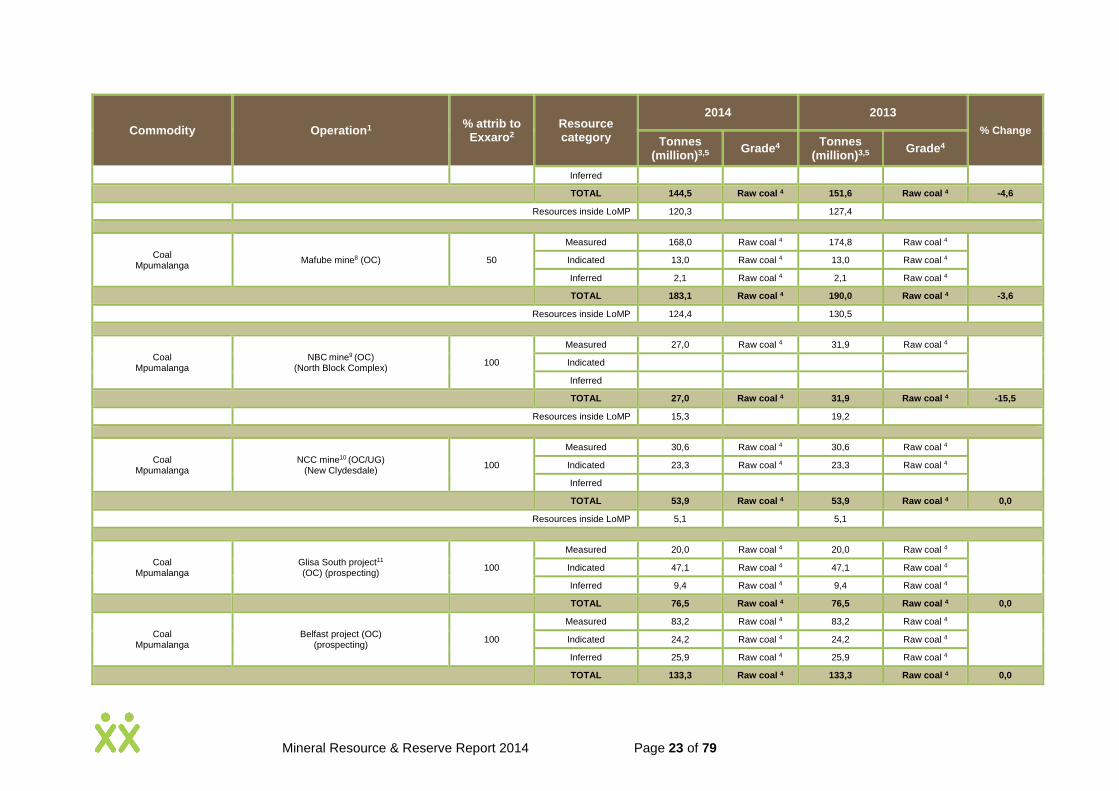
Table 4: Coal resources reported for 2014
Commodity Operation1 % attrib to
Exxaro2 Resource category
2014 2013
% Change Tonnes
(million)3,5 Grade4
Tonnes (million)3,5
Grade4
Coal Mpumalanga
Arnot mine (UG/OC)(6)
(captive market) 100
Measured 126,1 Raw coal 4 166,0 Raw coal 4
Indicated 45,7 Raw coal 4 37,6 Raw coal 4
Inferred 78,5 Raw coal 4 27,1 Raw coal 4
TOTAL 250,3 Raw coal 4 230,7 Raw coal 4 8,5
Resources inside life-of-mine plan (LoMP) 138,9 83,2
Coal Mpumalanga
Matla mine (UG) (>18MJ/kg, 26% DAV)
100
Measured 383,5 Raw coal 4 365,4 Raw coal 4
Indicated 254,6 Raw coal 4 257,6 Raw coal 4
Inferred 176,6 Raw coal 4 198,6 Raw coal 4
TOTAL 814,8 Raw coal 4 821,5 Raw coal 4 -0,8
Coal Mpumalanga
Matla mine (UG) (Low CV 15-18MJ/kg, 30% Ash)
100
Measured 51,1 Raw coal 4 55,1 Raw coal 4
Indicated 52,5 Raw coal 4 47,3 Raw coal 4
Inferred 89,3 Raw coal 4 93,7 Raw coal 4
TOTAL 192,9 Raw coal 4 196,1 Raw coal 4 -1,7
Coal Mpumalanga
Matla mine total (UG) (captive market)
100
Measured 434,7 Raw coal 4 420,5 Raw coal 4
Indicated 307,1 Raw coal 4 304,9 Raw coal 4
Inferred 265,9 Raw coal 4 292,3 Raw coal 4
TOTAL 1007,6 Raw coal 4 1017,6 Raw coal 4 -1,0
Resources inside LoMP 532,0 473,8
Coal Mpumalanga
Inyanda mine7 (OC) 100
Measured 1,20 Raw coal 4 3,40 Raw coal 4
Indicated
Inferred
TOTAL 1,20 Raw coal 4 3,40 Raw coal 4 -64,7
Resources inside LoMP 1,20 3,40
Coal Mpumalanga
Leeuwpan mine (OC) 100 Measured 144,5 Raw coal 4 151,6 Raw coal 4
Indicated
Mineral Resource & Reserve Report 2014 Page 23 of 79
Commodity Operation1 % attrib to
Exxaro2 Resource category
2014 2013
% Change Tonnes
(million)3,5 Grade4
Tonnes (million)3,5
Grade4
Inferred
TOTAL 144,5 Raw coal 4 151,6 Raw coal 4 -4,6
Resources inside LoMP 120,3 127,4
Coal Mpumalanga
Mafube mine8 (OC) 50
Measured 168,0 Raw coal 4 174,8 Raw coal 4
Indicated 13,0 Raw coal 4 13,0 Raw coal 4
Inferred 2,1 Raw coal 4 2,1 Raw coal 4
TOTAL 183,1 Raw coal 4 190,0 Raw coal 4 -3,6
Resources inside LoMP 124,4 130,5
Coal Mpumalanga
NBC mine9 (OC) (North Block Complex)
100
Measured 27,0 Raw coal 4 31,9 Raw coal 4
Indicated
Inferred
TOTAL 27,0 Raw coal 4 31,9 Raw coal 4 -15,5
Resources inside LoMP 15,3 19,2
Coal Mpumalanga
NCC mine10 (OC/UG) (New Clydesdale)
100
Measured 30,6 Raw coal 4 30,6 Raw coal 4
Indicated 23,3 Raw coal 4 23,3 Raw coal 4
Inferred
TOTAL 53,9 Raw coal 4 53,9 Raw coal 4 0,0
Resources inside LoMP 5,1 5,1
Coal Mpumalanga
Glisa South project11
(OC) (prospecting) 100
Measured 20,0 Raw coal 4 20,0 Raw coal 4
Indicated 47,1 Raw coal 4 47,1 Raw coal 4
Inferred 9,4 Raw coal 4 9,4 Raw coal 4
TOTAL 76,5 Raw coal 4 76,5 Raw coal 4 0,0
Coal Mpumalanga
Belfast project (OC) (prospecting)
100
Measured 83,2 Raw coal 4 83,2 Raw coal 4
Indicated 24,2 Raw coal 4 24,2 Raw coal 4
Inferred 25,9 Raw coal 4 25,9 Raw coal 4
TOTAL 133,3 Raw coal 4 133,3 Raw coal 4 0,0

Mineral Resource & Reserve Report 2014 Page 24 of 79
Commodity Operation1 % attrib to
Exxaro2 Resource category
2014 2013
% Change Tonnes
(million)3,5 Grade4
Tonnes (million)3,5
Grade4
Resources inside LoMP 60,1 60,1
Coal Limpopo
Grootegeluk mine (OC) 100
Measured 3 443 Raw coal 4 2 442 Raw coal 4
Indicated 1 017 Raw coal 4 1 581 Raw coal 4
Inferred 258 Raw coal 4 734 Raw coal 4
TOTAL 4 719 Raw coal 4 4 758 Raw coal 4 -0,8
Resources inside LoMP 3 511 3 666
Coal Limpopo
Thabametsi project12
(OC) (prospecting) 100
Measured
Indicated 2 579 Raw coal 4 2 579 Raw coal 4
Inferred 2 249 Raw coal 4 2 249 Raw coal 4
TOTAL 4 828 Raw coal 4 4 828 Raw coal 4 0,0
Coal Limpopo
Waterberg North project (OC) (prospecting)
100
Measured
Indicated
Inferred 2 253 Raw coal 4 2 253 Raw coal 4
TOTAL 2 253 Raw coal 4 2 253 Raw coal 4 0,0
Coal Limpopo
Waterberg South project (OC) (prospecting)
100
Measured
Indicated
Inferred 895 Raw coal 4 895 Raw coal 4
TOTAL 895 Raw coal 4 895 Raw coal 4 0,0
Coal Limpopo
Tshikondeni mine 13
(UG) (captive market)
100
Measured 3,7 Raw coal 4 4,1 Raw coal 4
Indicated 25,1 Raw coal 4 25,1 Raw coal 4
Inferred
TOTAL 28,8 Raw coal 4 29,2 Raw coal 4 -1,5
Resources inside LoMP 0,7
Coal Australia
Moranbah South project 14 (UG) (prospecting)
50
Measured 481,9 Raw coal 4 487,1 Raw coal 4
Indicated 222,5 Raw coal 4 208,1 Raw coal 4
Inferred 28,0 Raw coal 4 30,3 Raw coal 4
TOTAL 732,4 Raw coal 4 725,6 Raw coal 4 0,9

Mineral Resource & Reserve Report 2014 Page 25 of 79
Rounding-off of figures may cause computational discrepancies.
All changes more than 10% (significant) are explained. 1 Mining method: OC – open-cut, UG – underground. 2 Figures are reported at 100% irrespective of percentage attributable to Exxaro and refer to 2014 only. 3 Tonnages are quoted in metric tonnes and million tonnes is abbreviated as Mt. Coal resources are quoted on a mineable tonnage in-situ (MTIS) and on an air-dried basis. 4 Coal qualities are reported inTable 5 and quoted on a Mineable Tonnage Insitu (MTIS) and on an air-dried basis. 5 Coal resources are quoted Inclusive of Coal Resources that have been modified to Coal Reserves unless otherwise stated. 6 Additional resources realised during the 2013/14 drilling campaigns will be considered for the updated 2015 life-of-mine plan. 7 The decrease of 2,3Mt is the result of mining depletion. 8 Estimates are received from Anglo American Coal and were not audited by Exxaro. 9 NBC includes the resource areas of Glisa, Strathrae and Eerstelingsfontein. The decrease is primarily the result of mining depletion (3,81Mt). 10 Exxaro is divesting from New Clydesdale. 11 The project is adjacent to the current Glisa (NBC) resource area and will be an extension of the current operation. A new mining right was timeously submitted in November 2013. 12 The previous project name of Grootegeluk West was changed to Thabametsi. 13 Tshikondeni is in the process of mine closure, and was a dedicated metallurgical coal supplier for Arcelor Mittal. The remaining coal resource reported is located in Makanja (~25Mt) as well as the Mutale west and Perdeskoen areas (3,7Mt). 14 Estimates are received from Anglo American Coal and not audited by Exxaro.
Mineral Resource & Reserve Report 2014 Page 26 of 79
Table 5: Coal resource qualities 2014
Operation Seam/Layer/ Formation
2014
Measured Resource Indicated Resource Inferred Resource
Tonnes (Mt)1
CV MJ/Kg
%VM %Ash %S Tonnes
(Mt)1 CV
MJ/Kg %VM %Ash %S
Tonnes (Mt)1
CV MJ/Kg
%VM %Ash %S
Arnot mine Seam 2 125,5 23,7 24,3 21,0 1,0 44,3 24,3 25,3 19,6 1,0 75,3 23,9 25,3 20,3 0,9
Seam1 0,6 24,7 26,3 18,9 1,2 1,4 24,9 29,1 20,7 1,8 0,7 23,5 27,6 24,4 1,5
Matla mine
Seam 2 146,2 23,8 24,2 20,1 0,9 107,8 23,0 23,8 21,5 0,3 102,2 21,9 22,8 24,7 1,4
Seam 4 237,3 19,8 22,1 30,3 1,1 146,8 20,1 22,4 28,5 1,0 74,5 19,9 22,2 29,3 0,9
Low CV Seam 2 3,8 18,2 20,0 33,6 0,9 18,1 17,1 18,8 34,3 0,3 47,1 18,0 19,2 31,3 0,6
Low CV Seam 4 47,4 17,0 19,8 38,0 1,0 32,3 17,0 19,4 36,7 0,2 42,1 17,6 19,3 35,2 0,9
Inyanda mine
Inyanda Reserve: Seam 2 0,01 26,3 23,6 18,0 1,2
Inyanda Reserve: Seam 1 0,11 24,5 23,8 23,6 1,1
Pegasus South: Seam 2 0,50 21,9 21,9 24,1 1,6
Pegasus South: Seam 1 0,58 22,6 21,5 23,8 1,6
Leeuwpan mine TC2 88,1 15,8 20,6 38,5 1,1
BC2 56,4 22,0 17,5 22,5 0,7
Mafube mine
Seam 4 11,0 19,2 20,9 32,1 0,9 3,5 17,5 19,8 36,0 0,7 0,9 16,9 19,3 38,7 0,4
Seam 2 122,7 23,0 23,0 22,4 1,0 6,6 22,8 23,7 23,1 1,0
Seam 1 34,3 20,3 22,5 30,8 0,9 2,9 19,9 22,1 32,0 0,9 1,2 22,4 25,5 24,3 0,9
NBC mine
Glisa: Total seams 23,7 20,2 21,9 29,2 1,0
Strathrae East: Seam 2 0,5 24,7 22,9 19,0 0,8
Eerstelingsfontein: Seam 2
2,8 25,9 22,1 16,4 0,8
Glisa South project Seam 2 20,0 19,0 20,3 32,0 0,9 47,1 19,0 20,9 31,8 1,0 9,4 21,0 21,6 27,6 1,0
NCC mine Total seams 30,6 24,3 22,7 23,1 1,4 23,3 22,7 20,7 28,4 0,9
Mineral Resource & Reserve Report 2014 Page 27 of 79
Operation Seam/Layer/ Formation
2014
Measured Resource Indicated Resource Inferred Resource
Tonnes (Mt)1
CV MJ/Kg
%VM %Ash %S Tonnes
(Mt)1 CV
MJ/Kg %VM %Ash %S
Tonnes (Mt)1
CV MJ/Kg
%VM %Ash %S
Belfast project
Seam 4 2,2 15,9 20,9 40,2 1,3 1,0 13,5 19,1 47,8 1,1 2,3 12,8 19,2 50,1 0,9
Seam 3 6,3 21,5 23,0 27,9 1,1 1,8 21,1 22,8 28,6 1,6 1,1 20,7 22,8 29,3 1,2
Seam 2 74,7 24,8 23,1 18,3 1,1 21,3 24,1 22,8 19,9 1,1 22,5 22,9 21,9 22,7 1,2
Grootegeluk mine Volksrust Formation 2516 12,7 19,4 54,4 1,0 802 13,5 19,1 53,7 1,0 167 13,6 19,5 53,4 1,3
Vryheid Formation 927 23,0 21,9 27,7 1,9 216 31,5 30,7 35,6 2,1 92 22,6 21,0 30,3 1,4
Thabametsi project
Volksrust Formation
2150 11,1 19,3 56,9 0,9 1800 10,1 18,7 58,8 0,9
Vryheid Formation 430 20,4 21,9 32,1 2,2 448 19,5 21,6 34,2 2,1
Waterberg North project
Volksrust Formation
1468 10,8 19,0 56,8 0,9
Vryheid Formation 785 18,1 21,7 36,2 1,8
Waterberg South project
Volksrust Formation
354 14,1 23,2 44,9 1,1
Vryheid Formation 541 17,1 21,6 36,1 2,1
Tshikondeni mine Sample 7BC 3,7 30,8 22,0 24,0 0,7 25,3 30,8 22,0 24,0 0,7
Moranbah South project
Goonyella Middle Seam (GM)
481,9 26,7 18,5 23,7 0,6 222,5 27,3 17,9 21,7 0,6 28,0 28,5 17,0 18,9 0,5
VM – volatile matter; S – sulphur; CV – calorific value.
Rounding-off of figures may cause computational discrepancies.
Coal qualities are quoted on a mineable tonnage in-situ (MTIS) and on an air-dried basis. 1 The tonnages are quoted in metric tonnes and million tonnes is abbreviated as Mt. 2 TC – Top Coal, BC – Bottom Coal.

Mineral Resource & Reserve Report 2014 Page 28 of 79
Table 6: Coal reserves reported for 2014
Commodity
Operation1
% attrib to
EXXARO5
Reserve category
2014
2013
% Change
LoMP Years
ROM (Mt)2,3
Saleable product (Mt)2,4 ROM (Mt)2,3
Saleable product (Mt)2,4
Coking Thermal Metallurgical Coking Thermal Metallurgical
Coal Mpumalanga
Arnot mine (OC/UG) (captive market)
100
Proved 17,1 N/A 17,1 N/A 17,5 N/A 17,5 N/A
Probable 37,1 N/A 37,1 N/A 37,0 N/A 36,1 N/A
TOTAL 54,2 N/A 54,2 N/A 54,5 N/A 53,6 N/A -0,6 19
Inferred Resources in life-of-mine plan (LoMP)6 0,8 0,6
Coal Mpumalanga
Matla mine (UG)
(captive market)
100
Proved 140,9 N/A 140,2 N/A 133,9 N/A 132,2 N/A
Probable 84,4 N/A 84,0 N/A 92,6 N/A 92,1 N/A
TOTAL 225,3 N/A 224,2 N/A 226,5 N/A 224,3 N/A -0,5 24
Inferred Resources in LoMP6 67,7 67,7
A-grade export steam coal A-grade export steam coal
Coal Mpumalanga
Inyanda mine7
(OC) 100
Proved 0,20 0,14 2,04 1,54
Probable 0,97 0,59 0,97 0,59
TOTAL 1,17 0,73 3,01 2,13 -61,1 0,5
Inferred Resources in LoMP6 - -
Export Thermal Metallurgical Export Thermal Metallurgical
Coal Mpumalanga
Leeuwpan mine (OC)
100 Proved 27,8 1,2 11,4 4,1 35,5 1,6 15,9 5,1
Probable 81,3 1,6 7,4 27,9 80,5 1,6 7,4 27,9
TOTAL 109,1 2,8 18,8 32,0 116,0 3,2 23,3 33,0 -5,9 15
Inferred Resources in LoMP6 - -
Coal Mpumalanga
Mafube mine8
(OC) 50
Proved 5,8 2,9 1,4 N/A 10,2 5,3 2,6 N/A
Probable 113,0 48,4 21,1 N/A 113,0 48,4 21,1 N/A
TOTAL 118,7 51,3 22,5 N/A 123,2 53,7 23,7 N/A -3,6 17
Inferred Resources in LoMP6 0,9 0,9
Coal 100 Proved 11,5 N/A 9,2 N/A 15,1 N/A 9,8 N/A

Mineral Resource & Reserve Report 2014 Page 29 of 79
Commodity
Operation1
% attrib to
EXXARO5
Reserve category
2014
2013
% Change
LoMP Years
ROM (Mt)2,3
Saleable product (Mt)2,4 ROM (Mt)2,3
Saleable product (Mt)2,4
Mpumalanga NBC mine
(OC)9 Probable N/A N/A 3,1 N/A 2,0 N/A
TOTAL 11,5 N/A 9,2 N/A 18,2 N/A 11,8 N/A -36,5 2,5
Inferred Resources in LoMP6 - -
Coal Mpumalanga
NCC mine10
(UG/OC) 100
Proved 2,7 N/A N/A 2,7 N/A 1,8 N/A
Probable N/A N/A N/A N/A
TOTAL 2,7 N/A N/A 2,7 N/A 1,8 N/A 0,0 2.5
Inferred Resources in LoMP6 - -
Coal Mpumalanga
Belfast project11 (OC) (prospecting)
100 Proved 45,7 35,3 8,1 N/A 45,7 35,3 8,1 N/A
Probable N/A 11,5 5,4 3,6 N/A
TOTAL 45,7 35,3 8,1 N/A 57,2 40,7 11,7 N/A -20,1 17
Inferred Resources in LoMP6 0,5 0,5
Coking Thermal Metallurgical Coking Thermal Metallurgical
Coal Limpopo
Grootegeluk mine (OC)
100 Proved 2724 95 1243 90 2050 82 965 74
Probable 537 23 248 11 996 61 419 21
TOTAL 3261 118 1491 101 3046 143 1384 95 7,1 30+
Inferred Resources in LoMP6 69 390
Coal Limpopo
Tshikondeni mine12 (UG)
(captive market)
100
Proved
0,43 0,19 N/A N/A
Probable N/A N/A
TOTAL 0,43 0,19 N/A N/A 0
Inferred Resources in LoMP6 - -
Rounding-off of figures may cause computational discrepancies.
All changes more than 10% (significant) are explained. 1 Mining method: OC – open-cut, UG – underground. 2 Tonnages are quoted in metric tonnes and million tonnes is abbreviated as Mt. 3 Coal reserves are quoted on a run-of-mine (ROM) reserve tonnage basis which represents tonnages delivered to the plant at an applicable moisture and quality.
Mineral Resource & Reserve Report 2014 Page 30 of 79
4 Saleable reserve tonnage represents the product tonnes of coal available for sale on an applicable moisture basis. Qualities of Saleable Products are provided in Table 7. 5 Figures are reported at 100% irrespective of percentage attributable to Exxaro and refer to 2014 only. 6 Inferred Resources in life-of-mine plan (LoMP) refer to inferred resources considered for the life-of-mine plan. 7 The decrease is primarily the result of mining (2,16Mt). 8 Estimates are received from Anglo American Coal and were not audited by Exxaro. 9 Strathrae (0,49Mt) was excluded from the NBC reserve after a technical review. Changes are primarily the result of mining (3,6Mt) and economic assumptions (2,5Mt) at the Glisa reserve. Contractual constraints of the Eskom contract limit the LoMP to 2,5 years. 10 The operation was placed under care and maintenance pending the finalisation of the NCC divesting process. 11 A section of the reserve (11,5Mt), scheduled as phase 2 and tail-end of the mine plan, was excluded from the reserve as a result of ongoing surface rights negotiations. Exxaro reasonably expects that negotiations will be successfully concluded within the strategy time frame of the project. 12 Production was concluded in the last quarter of the reporting year as per mine-closure schedule.
Mineral Resource & Reserve Report 2014 Page 31 of 79
Table 7: Coal reserve qualities 2014
Operation Seam/Layer
THERMAL Saleable (Proved + Probable) METALLURGICAL Saleable (Proved +
Probable) COKING Saleable (Proved + Probable)
Tonnes (Mt)1
CV MJ/kg
%VM %Ash %S Tonnes
(Mt)1
CV MJ/kg
%VM %Ash %S Tonnes
(Mt)1
CV MJ/kg
%VM %Ash %S
Arnot mine Seam 2 53,4 22,1 22,6 25,4 0,9
Seam 1 0,2 24,3 28,6 21,7 0,9
Matla mine Seam 4 137,9 18,5 20,9 31,4 0,9
Seam 2 87,5 22,5 22,6 20,4 1,0
Inyanda mine
Inyanda reserve: Seam 2 & Seam 1
0,14 27,5 24,5 15,0 0,7
Pegasus South: Seam
2 & Seam 1 0,59 27,5 26,4 15,0 0,5
Leeuwpan mine
TC2 14,1 23,4 22,0 24,5 0,6 9,4 24,6 19,6 15,4 1,4
BC2 4,7 21,0 19,9 22,0 1,0 25,4 25,1 23,1 15,3 0,7
Mafube mine
Middlings 22,5 22,1 22,3 22,3 0,5
Export 51,3 26,5 26,3 13,1 0,5
NBC mine
Glisa: Total seams 7,3 21,1 22,2 26,4 1,1
Eerstelingsfontein: Seam 2
1,9 25,8 21,9 16,7 0,8
NCC mine Seam 2 1,8 26,6 28,9 15,1 0,6
Belfast project
Thermal 8,1 21,9 22,4 26,6 1,8
Export 35,3 26,9 24,1 13,7 0,5
Grootegeluk mine
Volksrust Formation 974 20,6 30,1 33,5 0,9 117,9 29,2 35,3 10,3 1,1
Vryheid Formation 517 22,9 22,1 28,1 2,0 101,3 28,0 25,2 14,3 0,6
Mineral Resource & Reserve Report 2014 Page 32 of 79
Saleable reserve tonnage represents the product tonnes of coal available for sale on an applicable moisture and air-dried quality basis.
VM – volatile matter; S – sulphur; CV – calorific value.
Rounding-off of figures may cause computational discrepancies. 1 Saleable product tonnages are quoted in metric tonnes and million tonnes is abbreviated as Mt. 2 TC – Top Coal BC – Bottom Coal.
Mineral Resource & Reserve Report 2014 Page 33 of 79
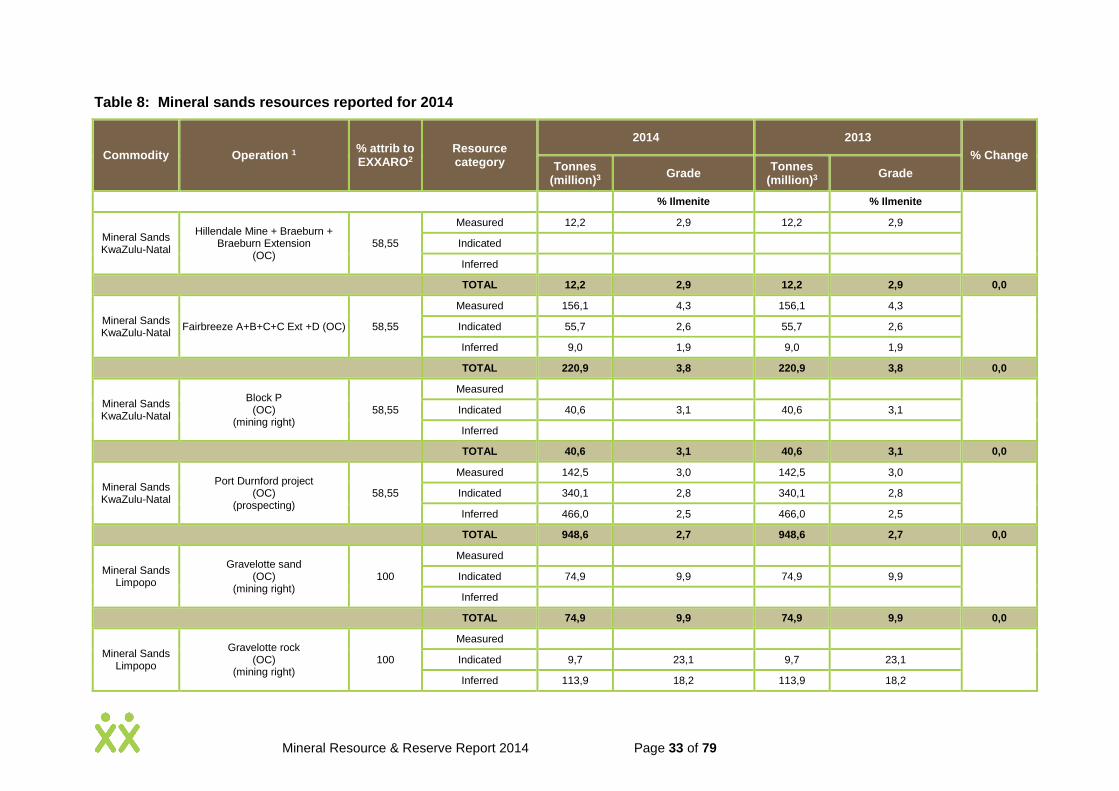
Table 8: Mineral sands resources reported for 2014
Commodity Operation 1 % attrib to EXXARO2
Resource category
2014 2013
% Change Tonnes
(million)3 Grade Tonnes
(million)3 Grade
% Ilmenite % Ilmenite
Mineral Sands KwaZulu-Natal
Hillendale Mine + Braeburn + Braeburn Extension
(OC) 58,55
Measured 12,2 2,9 12,2 2,9
Indicated
Inferred
TOTAL 12,2 2,9 12,2 2,9 0,0
Mineral Sands KwaZulu-Natal
Fairbreeze A+B+C+C Ext +D (OC) 58,55
Measured 156,1 4,3 156,1 4,3
Indicated 55,7 2,6 55,7 2,6
Inferred 9,0 1,9 9,0 1,9
TOTAL 220,9 3,8 220,9 3,8 0,0
Mineral Sands KwaZulu-Natal
Block P (OC)
(mining right) 58,55
Measured
Indicated 40,6 3,1 40,6 3,1
Inferred
TOTAL 40,6 3,1 40,6 3,1 0,0
Mineral Sands KwaZulu-Natal
Port Durnford project (OC)
(prospecting) 58,55
Measured 142,5 3,0 142,5 3,0
Indicated 340,1 2,8 340,1 2,8
Inferred 466,0 2,5 466,0 2,5
TOTAL 948,6 2,7 948,6 2,7 0,0
Mineral Sands Limpopo
Gravelotte sand (OC)
(mining right) 100
Measured
Indicated 74,9 9,9 74,9 9,9
Inferred
TOTAL 74,9 9,9 74,9 9,9 0,0
Mineral Sands Limpopo
Gravelotte rock (OC)
(mining right) 100
Measured
Indicated 9,7 23,1 9,7 23,1
Inferred 113,9 18,2 113,9 18,2
Mineral Resource & Reserve Report 2014 Page 34 of 79
Commodity Operation 1 % attrib to EXXARO2
Resource category
2014 2013
% Change Tonnes
(million)3 Grade Tonnes
(million)3 Grade
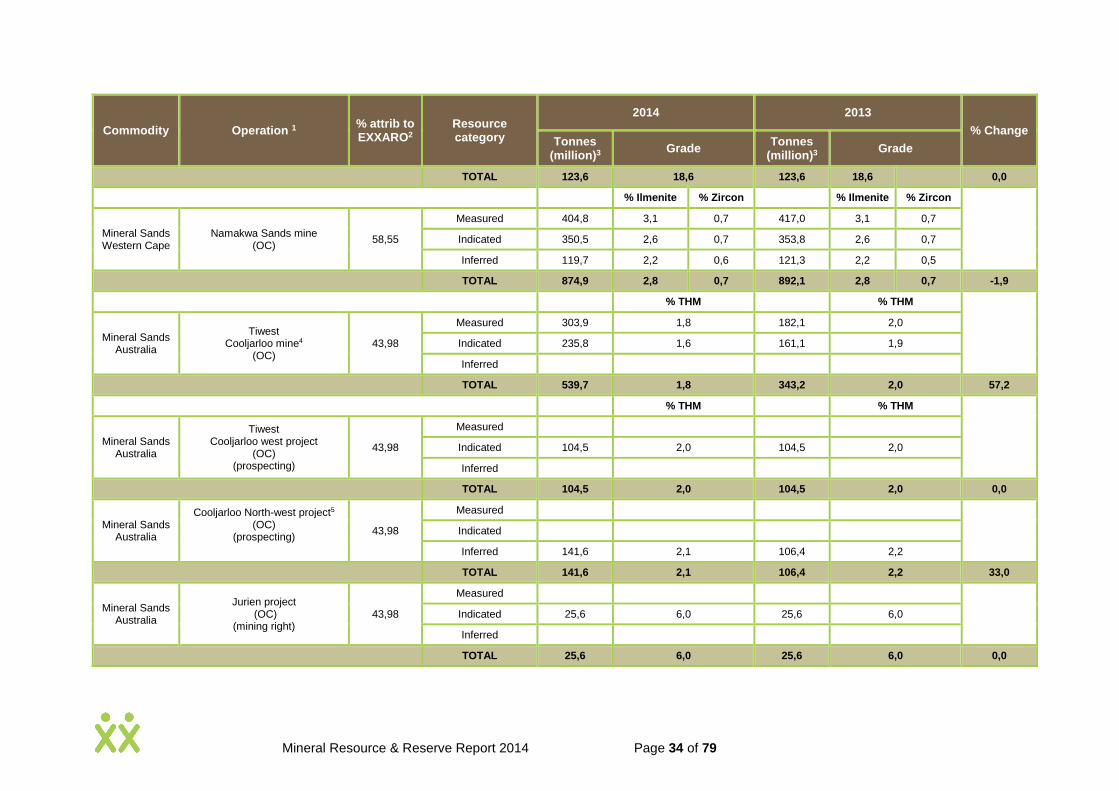
TOTAL 123,6 18,6 123,6 18,6 0,0
% Ilmenite % Zircon % Ilmenite % Zircon
Mineral Sands Western Cape
Namakwa Sands mine (OC)
58,55
Measured 404,8 3,1 0,7 417,0 3,1 0,7
Indicated 350,5 2,6 0,7 353,8 2,6 0,7
Inferred 119,7 2,2 0,6 121,3 2,2 0,5
TOTAL 874,9 2,8 0,7 892,1 2,8 0,7 -1,9
% THM % THM
Mineral Sands Australia
Tiwest Cooljarloo mine4
(OC) 43,98
Measured 303,9 1,8 182,1 2,0
Indicated 235,8 1,6 161,1 1,9
Inferred
TOTAL 539,7 1,8 343,2 2,0 57,2
% THM % THM
Mineral Sands Australia
Tiwest Cooljarloo west project
(OC) (prospecting)
43,98
Measured
Indicated 104,5 2,0 104,5 2,0
Inferred
TOTAL 104,5 2,0 104,5 2,0 0,0
Mineral Sands Australia
Cooljarloo North-west project5
(OC) (prospecting)
43,98
Measured
Indicated
Inferred 141,6 2,1 106,4 2,2
TOTAL 141,6 2,1 106,4 2,2 33,0
Mineral Sands Australia
Jurien project (OC)
(mining right) 43,98
Measured
Indicated 25,6 6,0 25,6 6,0
Inferred
TOTAL 25,6 6,0 25,6 6,0 0,0

Mineral Resource & Reserve Report 2014 Page 35 of 79
Commodity Operation 1 % attrib to EXXARO2
Resource category
2014 2013
% Change Tonnes
(million)3 Grade
Tonnes (million)3
Grade
Mineral Sands Australia
Dongara project (OC)
(prospecting) 43,98
Measured 105,9 4,0 105,9 4,0
Indicated 12,8 4,5 12,8 4,5
Inferred 37,8 2,7 37,8 2,7
TOTAL 156,4 3,7 156,4 3,7 0,0
Estimates are received from Tronox and not audited by Exxaro.
%THM – per cent total heavy minerals.
Mineral sands resources are quoted inclusive of mineral sands resources that have been modified to mineral sands reserves unless otherwise stated.
Rounding-off of figures may cause computational discrepancies.
All changes more than 10% (significant) are explained. 1 Mining method: OC – open-cut, UG – underground. 2 Figures are reported at 100% irrespective of percentage attributable to Exxaro and refer to 2014 only. 3 Tonnages are quoted in metric tonnes and million tonnes is abbreviated as Mt. 4 An increase of ~197Mt is the result of updating the geological model with new information. 5 The increase of ~35Mt is the result of updating the geological model with new information.

Mineral Resource & Reserve Report 2014 Page 36 of 79
Table 9: Mineral sands reserves reported for 2014
Commodity Operation1 % attrib to EXXARO2
Reserve category
2014 2013 %
Change LoMP Years
ROM (Mt)3 Grade
Total heavy mineral (THM) composition
ROM (Mt)3 Grade
Total heavy mineral (THM) composition
% THM %
Ilmenite % Rutile % Zircon
% Leucoxene
% THM %
Ilmenite % Rutile % Zircon
% Leucoxene
Mineral Sands KwaZulu-Natal
Fairbreeze A+B+C+ C ext.+D (OC) (mining right)
58,55 Proved 139,0 7,1 62,1 3,5 8,4 1,7 139,0 7,1 62,1 3,5 8,4 1,7
Probable 45,3 4,6 53,2 3,2 7,3 1,8 45,3 4,6 53,2 3,2 7,3 1,8
TOTAL 184,3 6,5 60,5 3,4 8,2 1,7 184,3 6,5 60,5 3,4 8,2 1,7 1,5 13
Inferred Resources in life-of-mine plan (LoMP)4 6,8 6,8
Mineral Sands Western Cape
Namakwa Sands mine
(OC)
58,55 Proved 370,9 7,6 40,0 2,5 9,5 5,8 385,8 7,9 39,5 2,5 9,4 5,8
Probable 296,9 6,3 39,9 2,6 9,9 5,8 300,3 6,4 40,4 2,6 10,2 5,8
TOTAL 667,8 7,1 39,9 2,6 9,7 5,8 686,0 7,2 39,9 2,6 9,7 5,8 -2,7 30+
Inferred Resources in LoMP4 103,0 103,0
Mineral Sands Australia
Northern operations – Cooljarloo mine5
(OC) 43,98
Proved 237,7 2,0 60,9 5,1 9,7 2,5 182,1 2,0 61,0 5,0 9,4 2,6
Probable 21,6 2,6 62,9 5,5 12,9 2,3
TOTAL 237,7 2,0 60,9 5,1 9,7 2,5 203,7 2,1 61,2 5,1 9,9 2,6 16,7 15+
Inferred Resources in LoMP4 - -
Mineral Sands Australia
Northern operations – Cooljarloo West6 (OC) (prospecting)
43,98 Proved
Probable 104,5 2,0 60,5 5,4 12,2 2,9
TOTAL 104,5 2,0 60,5 5,4 12,2 2,9
Inferred Resources in LoMP4 - -
Mineral Sands Australia
Northern operations – Dongara project
(OC) (prospecting) 43,98
Proved 64,6 5,1 49,2 6,2 11,1 2,7 64,6 5,1 49,2 6,2 11,1 2,7
Probable
TOTAL 64,6 5,1 49,2 6,2 11,1 2,7 64,6 5,1 49,2 6,2 11,1 2,7 0,0 20
Inferred Resources in LoMP4 - -

Mineral Resource & Reserve Report 2014 Page 37 of 79
Estimates are received from Tronox and not audited by Exxaro.
%THM – per cent total heavy minerals.
Rounding-off of figures may cause computational discrepancies.
All changes more than 10% (significant) are explained. 1 Mining method: OC – open-cut, UG – underground.
2 Figures are reported at 100% irrespective of percentage attributable to Exxaro and refer to 2014 only.
3 Tonnages are quoted in metric tonnes and million tonnes is abbreviated as Mt.
4 Inferred resources in life-of-mine plan (LoMP) refer to inferred resources considered for the life-of-mine plan. 5 The increase is primary the result of revised economic assumptions following the conclusion of LoMP review and the change in the resource base. 6 Reserves are declared for the first time after the conclusion of metallurgical test work and a subsequent optimisation study.
Mineral Resource & Reserve Report 2014 Page 38 of 79
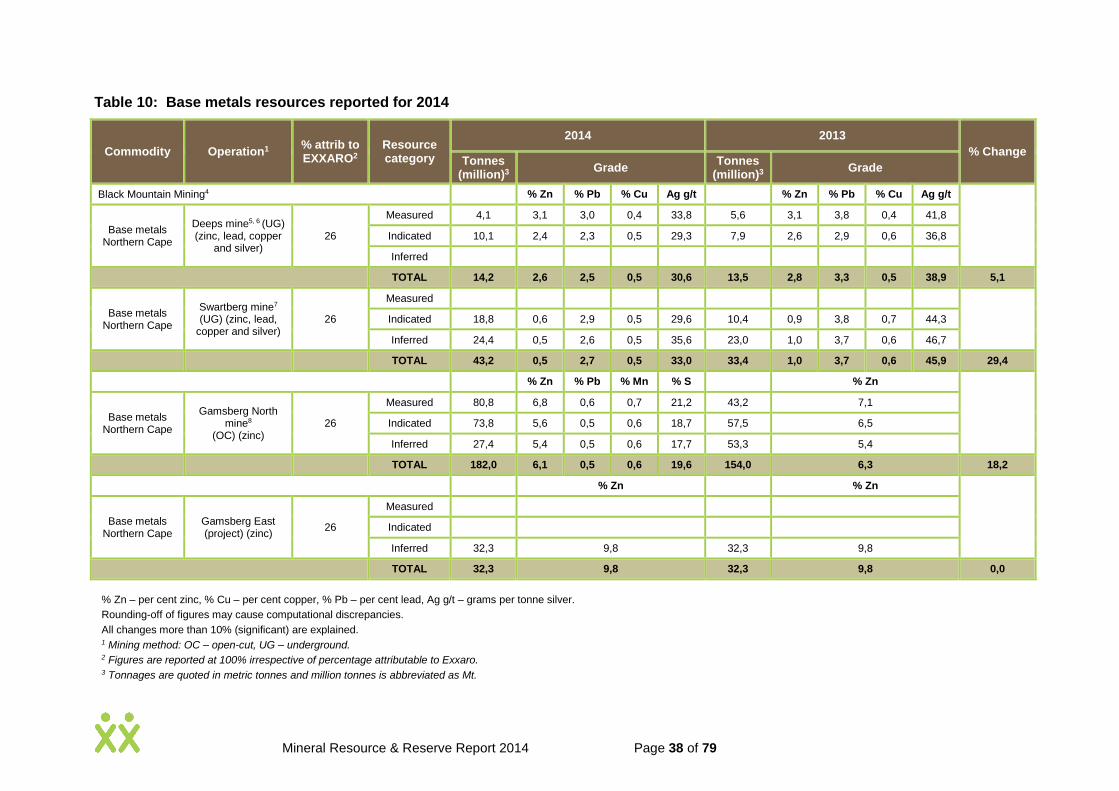
Table 10: Base metals resources reported for 2014
Commodity Operation1 % attrib to EXXARO2
Resource category
2014 2013
% Change Tonnes
(million)3 Grade Tonnes
(million)3 Grade
Black Mountain Mining4 % Zn % Pb % Cu Ag g/t % Zn % Pb % Cu Ag g/t
Base metals Northern Cape
Deeps mine5, 6 (UG) (zinc, lead, copper
and silver) 26
Measured 4,1 3,1 3,0 0,4 33,8 5,6 3,1 3,8 0,4 41,8
Indicated 10,1 2,4 2,3 0,5 29,3 7,9 2,6 2,9 0,6 36,8
Inferred
TOTAL 14,2 2,6 2,5 0,5 30,6 13,5 2,8 3,3 0,5 38,9 5,1
Base metals Northern Cape
Swartberg mine7
(UG) (zinc, lead, copper and silver)
26
Measured
Indicated 18,8 0,6 2,9 0,5 29,6 10,4 0,9 3,8 0,7 44,3
Inferred 24,4 0,5 2,6 0,5 35,6 23,0 1,0 3,7 0,6 46,7
TOTAL 43,2 0,5 2,7 0,5 33,0 33,4 1,0 3,7 0,6 45,9 29,4
% Zn % Pb % Mn % S % Zn
Base metals Northern Cape
Gamsberg North mine8
(OC) (zinc)
26
Measured 80,8 6,8 0,6 0,7 21,2 43,2 7,1
Indicated 73,8 5,6 0,5 0,6 18,7 57,5 6,5
Inferred 27,4 5,4 0,5 0,6 17,7 53,3 5,4
TOTAL 182,0 6,1 0,5 0,6 19,6 154,0 6,3 18,2
% Zn % Zn
Base metals Northern Cape
Gamsberg East (project) (zinc)
26
Measured
Indicated
Inferred 32,3 9,8 32,3 9,8
TOTAL 32,3 9,8 32,3 9,8 0,0
% Zn – per cent zinc, % Cu – per cent copper, % Pb – per cent lead, Ag g/t – grams per tonne silver.
Rounding-off of figures may cause computational discrepancies.
All changes more than 10% (significant) are explained. 1 Mining method: OC – open-cut, UG – underground.
2 Figures are reported at 100% irrespective of percentage attributable to Exxaro.
3 Tonnages are quoted in metric tonnes and million tonnes is abbreviated as Mt.
Mineral Resource & Reserve Report 2014 Page 39 of 79
4 Estimates are received from Vedanta Resources plc as at 31 March 2014 and not audited by Exxaro. 5 Resources are quoted in addition to those converted to ore reserves.
6 The increase (4,5Mt) is a result of revised economic assumptions and application of a lower cut-off applied.
7 Losses incurred after the conclusion of a detail mine design study (2,8Mt) in 2013 as well as mining sterilisation (3,9Mt) are off-set by an increase as a result of revised economic assumptions and update of geological model with new information received from a diamond drilling programme conducted in the 2014 reporting year (11,4Mt). 8 Increase is the result of updated geological model (~20Mt) with new information and revised economical assumptions (~7Mt).

Mineral Resource & Reserve Report 2014 Page 40 of 79
Table 11: Base metals reserves reported for 2014
Commodity Operation
1
% attrib to
Exxaro2
Reserve category
2014 2013 %
Change LoM YRS
ROM (Mt)3
Grade Contained metal ROM (Mt)3
Grade Contained metal
Black Mountain Mining % Zn
% Pb
% Cu
Ag g/t
zinc metal
(x 1000t)
lead metal
(x 1000t)
copper metal
(x 1000t)
silver metal
(x 1000t)
% Zn
% Pb
% Cu
Ag g/t
zinc metal
(x 1000t)
lead metal
(x 1000t)
copper metal
(x 1000t)
silver metal
(x 1000t)
Base metals (zinc, lead, copper and
silver)
Deeps5
(UG) Mining 26
Proved 3,8 3,0 3,9 0,3 41,5 113,4 147,3 12,1 0,2 3,3 3,2 4,0 0,4 42,9 105,1 128,7 11,3 0,1
Probable 7,9 2,5 2,3 0,6 28,9 194,1 184,6 50,1 0,2 7,2 2,7 2,5 0,7 30,2 192,2 181,6 48,4 0,2
TOTAL 11,7 2,6 2,8 0,5 33,0 307,5 331,9 62,2 0,4 10,4 2,9 3,0 0,6 34,1 297,3 310,3 59,7 0,4 12,3 6
Inferred Resources in LoMP4 - -
Base metals (zinc, lead, copper and
silver)
Swartberg6
(UG) 26
Proved
Not reported Probable 2,8 0,5 2,5 0,6 22,2 13,9 70,5 17,0 0,1
TOTAL 2,8 0,5 2,5 0,6 22,2 13,9 70,5 17,0 0,1 - 6
Inferred Resources in LoMP4 -
% Zn
% Pb
% Mn
% S
Not reported Base metals (zinc, lead, manganese and sulphur)
Gamsberg7
(OC) 26
Proved 39,1 6,9 0,5 0,8 21,6
Probable 9,5 5,5 0,5 0,7 16,6
TOTAL 48,6 6,6 0,5 0,7 20,6 - 6
Inferred Resources in LoMP4 1,8
% Zn – percent zinc, % Cu – percent copper, % Pb – percent lead, Ag g/t – grams per tonne silver, NA – Not Applicable. Rounding-off of figures may cause computational discrepancies. All changes more than 10% (significant) are explained. 1 Mining method: OC – open-cut, UG – underground. 2 Figures are reported at 100% irrespective of percentage attributable to Exxaro and refer to 2014 only. 3 Tonnages are quoted in metric tonnes and million tonnes is abbreviated as Mt. 4 Inferred resources in life-of-mine plan (LoMP) refer to inferred resources considered for the life-of-mine plan. 5 Estimates are received from Vedanta Resources plc as at 31 March 2014 and not audited by Exxaro. Mining depletion (1,2Mt) is off-set by revised economic assumptions and changes in the resource base. 6 Reserves are declared for the first time since underground operations ceased in 2006. Reporting is based on completion of an optimisation study in the reporting year. 7 Reserves are declared after the conclusion of a feasibility study.

Mineral Resource & Reserve Report 2014 Page 41 of 79
Table 12: Iron ore resources reported for 2014
Commodity Operation1 % attrib
to Exxaro2
Material type4
2014 2013
% Change
Measured resource (million tonnes)3
Indicated resources (million Tonnes)3
Inferred resources (million tonnes)3
Total (million tonnes)3
Grade
Fe %
Measured resource (million tonnes)3
Indicated resources
(million Tonnes)3
Inferred resources (million tonnes)3
Total (million tonnes)3
Grade
Fe %
Iron Ore Republic of
Congo (RoC)
Mayoko mine4 (OC)
100
Transported Ore 41 34 0 74 46,1 36 32 0 68 45,2
Capping 0 10 0 10 56,1 0 8 0 8 55,3
Enriched BIF 0 28 52 80 43,6 0 30 64 94 41,1
Transitional BIF 0 20 44 63 35,1 0 18 53 71 32,9
Fresh BIF 0 86 482 568 33,3 0 205 307 513 30,4
TOTAL 41 177 577 795 36,0 36 293 424 753 33,6 5,6
Fe % refers to in-situ Fe content, %Fe – per cent iron.
Rounding-off of figures may cause computational discrepancies.
All changes more than 10% (significant) are explained. 1 Mining method: OC, lithological boundary used, 20% Fe cut-off applied. 2 Figures are reported at 100% irrespective of percentage attributable to Exxaro and refer to 2014 only. 3 Tonnages are quoted in metric tonnes and million tonnes is abbreviated as Mt. 4 Transported ore consist primarily of hematite clasts in a clay matrix. Capping is hard consolidated ore formed by in-situ supergene enrichment of agglomerated hematite and goethite clasts. Enriched Banded Iron Formation (BIF) is weathered ferruginous quartzites, enriched through leaching quartz and oxidation of magnetite to hematite. Similar to enriched BIF, transitional BIF represents an equal to higher magnetite to hematite ratio. Fresh BIF is ferruginous quartzites (BIF) and magnetite ore with limited mineralogical changes. 5 Changes in the categories are the result of updating geological model with new drilling information which includes improved ore contacts determinations and revision of the resource classification methodology.

Mineral Resource & Reserve Report 2014 Page 42 of 79
8. ATTRIBUTABLE RESOURCES AND YEAR-ON-YEAR MODIFICATIONS
8.1 ATTRIBUTABLE TONNAGE
Exxaro includes all estimates that are directly under its management control (100% shareholding) and the estimates of entities in which Exxaro holds an equal or larger than 25% interest. Mineral resources and ore reserves are reported at 100%, irrespective of the percentage attributable to Exxaro.
The percentage attributable tonnage can be deducted from the attributable ownership stated in the summarised mineral resources and reserves tables. The summarised tonnages are presented in Table 13 and Table 14.
Table 13: Attributable resource tonnages (MTIS)
Coal Iron ore Mineral sands Base metals
2014 2013 2014 2013 2014 2013 2014 2013
Exxaro (Mt) 14 876 14 920 795 753 1 852 1 760 70,6 60,6
Other (Mt) 457 457 1 411 1 288 201,0 172,5
Table 14: Attributable reserve tonnages (ROM)
Coal Mineral sands Base metals
2014 2013 2014 2013 2014 2013
Exxaro (Mt) 3 770 3 586 678 628 16,4 2,7
Other (Mt) 59 62 581 511 46,7 7,7

Mineral Resource & Reserve Report 2014 Page 43 of 79
9. ANNUAL MINERAL RESOURCE MOVEMENTS
Graph 1: Highveld Coal Mineral Resources Movement from 2013 to 2014
Graph 2: Limpopo coal annual resource movement from 2013 to 2014
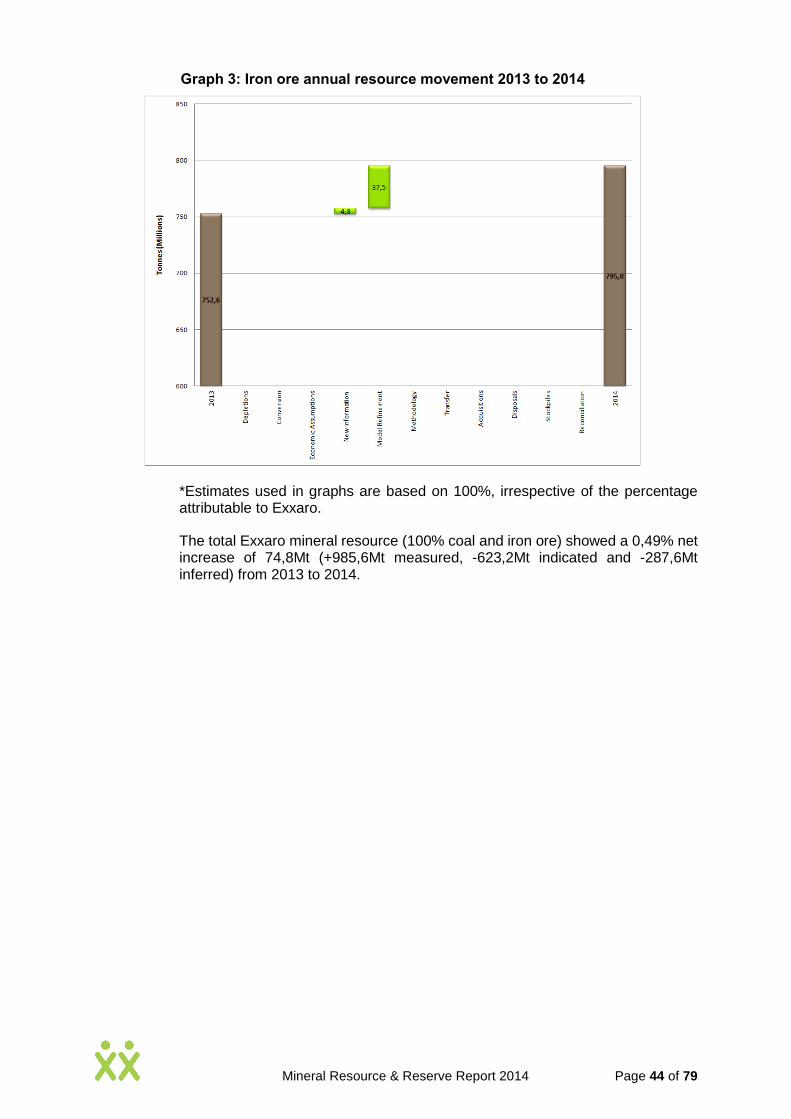
Mineral Resource & Reserve Report 2014 Page 44 of 79
Graph 3: Iron ore annual resource movement 2013 to 2014
*Estimates used in graphs are based on 100%, irrespective of the percentage attributable to Exxaro.
The total Exxaro mineral resource (100% coal and iron ore) showed a 0,49% net increase of 74,8Mt (+985,6Mt measured, -623,2Mt indicated and -287,6Mt inferred) from 2013 to 2014.
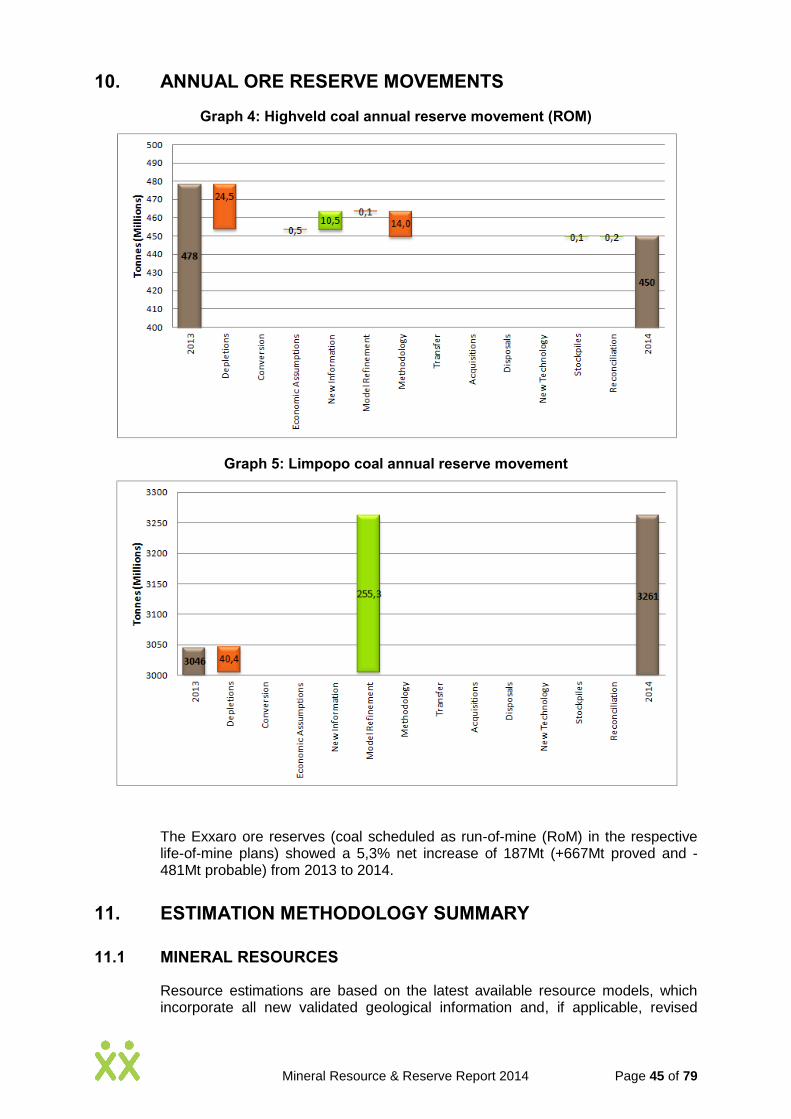
Mineral Resource & Reserve Report 2014 Page 45 of 79
10. ANNUAL ORE RESERVE MOVEMENTS
Graph 4: Highveld coal annual reserve movement (ROM)
Graph 5: Limpopo coal annual reserve movement
The Exxaro ore reserves (coal scheduled as run-of-mine (RoM) in the respective life-of-mine plans) showed a 5,3% net increase of 187Mt (+667Mt proved and -481Mt probable) from 2013 to 2014.
11. ESTIMATION METHODOLOGY SUMMARY
11.1 MINERAL RESOURCES
Resource estimations are based on the latest available resource models, which incorporate all new validated geological information and, if applicable, revised
Mineral Resource & Reserve Report 2014 Page 46 of 79
resource definitions and classifications. The resource models are compiled as a rule between May and August of the reporting year to align with the subsequent reserve estimation process. For the Exxaro operations and projects, Exxaro uses a systematic review process that measures the level of maturity of exploration work done, extent of geological potential, mine ability, security of tenure and associated geological risks/opportunities to establish an eventual extraction outline. The outline reflects the boundary within which mineral occurrences are considered to have reasonable and realistic prospects for eventual economic extraction. All mineral resources in which Exxaro holds the controlling interest was reviewed in 2014 comply with the “reasonable and realistic prospects for eventual economic extraction” (SAMREC Code 2007).
The location, quantity, quality and continuity of grade/quality and geology in this outline are known within varying degrees of confidence and are continuously tested through exploration activities such as geophysical surveys, drilling and, in specific instances, bulk sampling.
Combined with geological models, the validated assay data are used to interpolate grades/qualities and other parameters, including relative density, using a number of techniques (e.g. kriging, inverse distance or ECS growth technique), into predefined blocks or grids (coal) throughout the deposit to create and fill block models or stratified interpolated seam models (coal).
The interpolated grades/qualities and other parameters in the models are then used to estimate grades/qualities and tonnages of mineral resources under consideration.
In line with the SAMREC Code, mineral resources are classified according to the degree of confidence placed on the estimates. Mineral resources are classified into inferred, indicated or measured categories based on the degree of geological confidence.
This confidence is established as a function of several aspects, such as the complexity of the deposit with respect to the amount of information available. For coal, the guidelines of SANS Code (SANS 10320:2004, for thick interbedded and multi-seam coal deposits) are followed as a baseline approach, where valid points of observation (drill holes with thickness measurements and applicable quality analysis) are used for distance gridding to fulfil the prescribed classification guidelines (measured <350m, indicated 350-500m, inferred 500-1000m and reconnaissance <2000m borehole spacing). The competent person is, however, expected to consider all geological parameters (geological structure, type of drill holes, sample quality control) and based on his/her knowledge apply an applicable resource classification matrix. The classification matrix is tested annually for applicability. Distribution of points of observation (drilling positions, trenches, etc), quality control in sample collection, evaluation of structural complexities and, in the case of operations, reconciliation results are therefore considered in classifying resources. Percussion (open) holes drilled are geophysically logged with density, caliper and natural gamma probes, and used for structural and stratigraphical infill interpretation in special cases. All geophysical logged percussion boreholes are included in creating the geological model as physical points of observation to enhance the accuracy of the structural and stratigraphic model, but are excluded as points of observation for quality data and therefore also excluded for resource classification purposes.
A formal annually compiled and signed-off exploration strategy outlines planned activities to investigate areas of low confidence and/or geology or structural complexities to ensure resources with a high level of geological confidence are

Mineral Resource & Reserve Report 2014 Page 47 of 79
considered for mine planning. Exploration plans are available as supplementary information to the annual CPR.
Mineral resources are estimated as per the Exxaro resource estimation procedure that sets standards and guidelines for database validation, data analysis, modelling and classification. All operation and project estimation methodology results are captured in the individual mineral resource and reserve reports and available on request from the company secretary office at Exxaro.
Reporting is done by applying specific assumptions, which are project specific.

Mineral Resource & Reserve Report 2014 Page 48 of 79
Table 15: Resource applied cut-off
Operation Applied cut-off Comments
Arnot in situ raw coal (visually determined) laterally constrained by the approved mine layout area. Polygons are controlled by coal thickness >1,8m (UG) &
>1,0m (OC), Ash <35%.
excludes dolerite dykes, sills and associated devolatilised coal, large fault zones, weathered coal, also constraint by topography; Mineral Resources inside and
outside the approved mine layout are reported. Geological loss of 10% applied.
Inyanda in situ raw coal (visually determined) with lateral limits set by mining right
area. Seam thickness cut-off <1,0m is applied
excludes severely structurally disturbed areas; Mineral Resources inside and outside the approved mine layout are reported. 2 Coal seams are estimated and mined
separately. Geological loss of 5% applied.
Grootegeluk in situ raw coal (visually determined) with lateral limits set by mining right
area.
excludes severely structurally disturbed areas Mineral Resources inside and outside the approved mine layout are reported. Thin coal units contained within interburden
are excluded. Geological loss applied per bench.
Leeuwpan in situ raw coal (visually determined) with lateral limits set by mining right
area. Seam thickness cut-off <2,0m is applied.
excludes dolerite dykes and associated devolatilised coal, large fault zones and weathered coal; Mineral Resources inside and outside the approved mine layout are
reported. Geological loss of 5% applied.
Matla
in situ raw coal (visually determined) laterally constrained by the approved mine layout area (S2 & S4 - Min. Seam Thickness = 1,8m, Min. DAFV 26%, Min. Raw CV = 18MJ/Kg air dry, S5 - Min. Seam Thickness = 1,0m, DAFV
26%, Min. Raw CV = 18MJ/Kg air dry).
excludes dolerite dykes and associated devolatilised coal, large fault zones and weathered coal; Mineral Resources inside and outside the approved mine layout are
reported. Geological loss of 5-10% applied.
NBC
Glisa, Strathrae, Eerstelingsfontein
in situ raw coal (visually determined) laterally constrained by the approved mine layout area (Min. Seam Thickness = 0,5m).
excludes dolerite dykes and associated devolatilised coal, large fault zones and weathered coal; Mineral Resources inside and outside the approved mine layout are
reported. Geological loss of 5% applied.
New Clydesdale Colliery in situ raw coal (visually determined) laterally constrained by the approved
mine layout area, Min seam thickness=1,5m).
excludes dolerite dykes and associated devolatilised coal, large fault zones and weathered coal; Mineral Resources inside and outside the approved mine layout are
reported. Geological loss applied.
Tshikondeni in situ raw coal (visually determined) laterally constrained by the approved
mine layout area.
excludes dolerite dykes and associated devolatilised coal, large fault zones and weathered coal; Mineral Resources inside and outside the approved mine layout are
reported. Geological loss of 12% applied.
Belfast in situ raw coal (visually determined) with lateral limits set by mining right area
(Min. Seam Thickness = 0,5m). excludes dolerite dykes and associated devolatilised coal, large fault zones and
weathered coal. Geological loss of 5% applied.
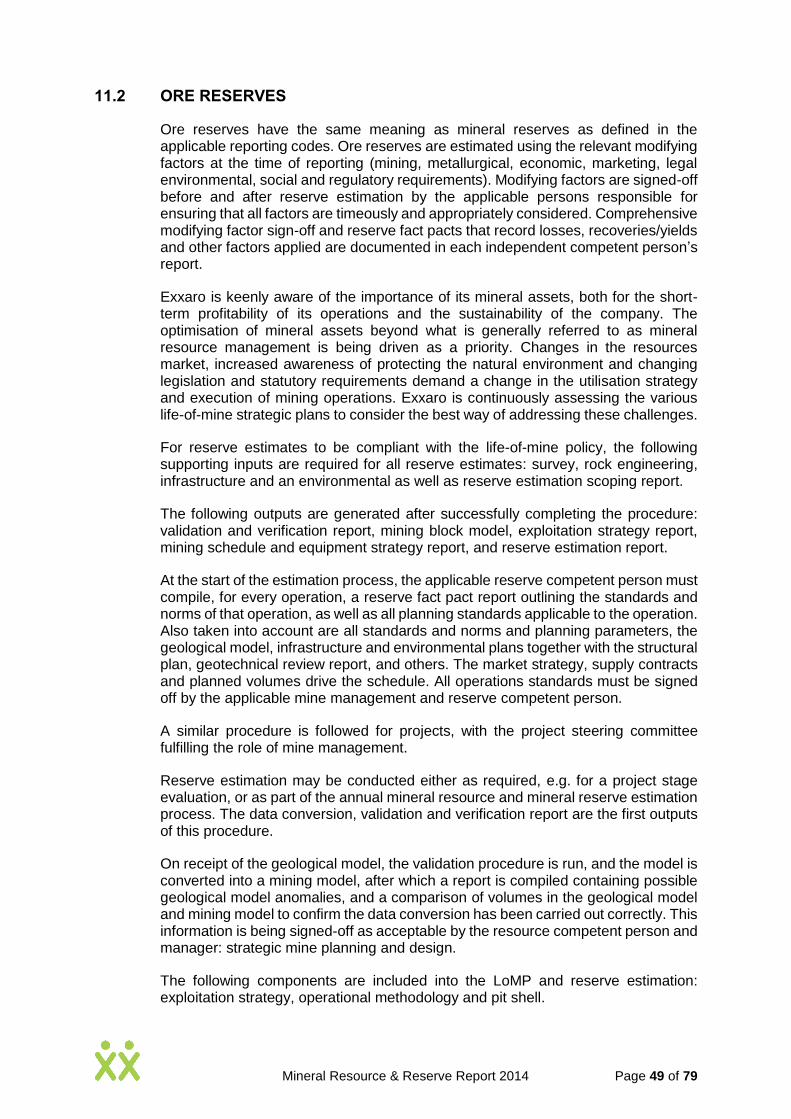
Mineral Resource & Reserve Report 2014 Page 49 of 79
11.2 ORE RESERVES
Ore reserves have the same meaning as mineral reserves as defined in the applicable reporting codes. Ore reserves are estimated using the relevant modifying factors at the time of reporting (mining, metallurgical, economic, marketing, legal environmental, social and regulatory requirements). Modifying factors are signed-off before and after reserve estimation by the applicable persons responsible for ensuring that all factors are timeously and appropriately considered. Comprehensive modifying factor sign-off and reserve fact pacts that record losses, recoveries/yields and other factors applied are documented in each independent competent person’s report.
Exxaro is keenly aware of the importance of its mineral assets, both for the short-term profitability of its operations and the sustainability of the company. The optimisation of mineral assets beyond what is generally referred to as mineral resource management is being driven as a priority. Changes in the resources market, increased awareness of protecting the natural environment and changing legislation and statutory requirements demand a change in the utilisation strategy and execution of mining operations. Exxaro is continuously assessing the various life-of-mine strategic plans to consider the best way of addressing these challenges.
For reserve estimates to be compliant with the life-of-mine policy, the following supporting inputs are required for all reserve estimates: survey, rock engineering, infrastructure and an environmental as well as reserve estimation scoping report.
The following outputs are generated after successfully completing the procedure: validation and verification report, mining block model, exploitation strategy report, mining schedule and equipment strategy report, and reserve estimation report.
At the start of the estimation process, the applicable reserve competent person must compile, for every operation, a reserve fact pact report outlining the standards and norms of that operation, as well as all planning standards applicable to the operation. Also taken into account are all standards and norms and planning parameters, the geological model, infrastructure and environmental plans together with the structural plan, geotechnical review report, and others. The market strategy, supply contracts and planned volumes drive the schedule. All operations standards must be signed off by the applicable mine management and reserve competent person.
A similar procedure is followed for projects, with the project steering committee fulfilling the role of mine management.
Reserve estimation may be conducted either as required, e.g. for a project stage evaluation, or as part of the annual mineral resource and mineral reserve estimation process. The data conversion, validation and verification report are the first outputs of this procedure.
On receipt of the geological model, the validation procedure is run, and the model is converted into a mining model, after which a report is compiled containing possible geological model anomalies, and a comparison of volumes in the geological model and mining model to confirm the data conversion has been carried out correctly. This information is being signed-off as acceptable by the resource competent person and manager: strategic mine planning and design.
The following components are included into the LoMP and reserve estimation: exploitation strategy, operational methodology and pit shell.

Mineral Resource & Reserve Report 2014 Page 50 of 79
The exploitation strategy needs to broadly demonstrate the pit/mining economics, in terms of resource boundaries, legal and other, i.e. servitudes. For example, when converting the resource to reserve, explain the economics, in terms of stripping ratio, underground versus open pit, etc. Lastly, the extraction sequence of mining different areas in terms of access, economics or other criteria deemed most appropriate.
Operational methodology takes cognisance of:
Material flow explains the flow of material over time, i.e. open-pit – ex-pit, distances horizontal and vertical; underground – geographical expansion versus stooping; and deep pit – push-back strategy, minimum and maximum stripping curves.
Equipment explains the size and type of equipment for to the design, including the life of equipment, major interventions and/or major changes (i.e. open-pit to underground) over the life of the resource.
Waste dumps (size and position), rehabilitation (main issues and interventions) together with legal and other – indicates licenses obtained and required.
Pit shell is the final delineation or envelope of the resource that will be converted to a reserve. The LoMP pit shell is the foundation of the business case and, as such, is based on the most accurate information available at that time.
Measured and indicated resources are used as basis for conversion. The first five years of the LoMP must be covered by at least 80% measured.
The resource volumes/tonnages are converted to reserve tonnages by applying the following mining modifying factors:
Mining efficiency losses – as per average cut thickness. This factor is applied to account for net losses of reserves due to mining equipment selection and mining method. The efficiency factor also accounts for the thickness of the selected ROM and waste horizons relative to selected mining equipment.
Layout losses account for the loss of reserves due to actual mining activities not reaching the defined reserve boundary or due to the geometry of the reserve block.
ROM extraction accounts for losses incurred through the selected mining method.
Contamination accounts for waste or inter-burden material unintentionally added to the mining horizon as a result of mining operations and equipment used.
Free moisture accounts for the change in the reserve tonnage due to the addition of moisture from bench-mining operations.

Mineral Resource & Reserve Report 2014 Page 51 of 79
12. ANCILLARY RESOURCE AND RESERVE INFORMATION BY OPERATION
Supplementary descriptions are provided for projects and operations directly under Exxaro’s management control (100% shareholding). For projects and operations included in the Exxaro mineral resource and reserve statement but in which Exxaro has ownership of 50% or less and does not have management control, the reader is referred to that company’s website for supplementary information.
Mafube coal operation and Moranbah South project the reader is referred to http://www.angloamerican.com/investors/annual-reporting.
Tronox mineral sands operations and projects the reader is referred to www.sec.gov/Archives/edgar/data/1530804/000156761915000183/s000750x1_10k.htm.
Vedanta Resources plc base metal projects and operations the reader is referred to http://www.vedantaresources.com/media/164998/VedantaAR2014.pdf.
12.1 ARNOT COAL MINE
Arnot, a dedicated coal supplier of Eskom, is located about 43km east of Middelburg, 65km from Carolina and some 25km from Hendrina along the N4 highway in Mpumalanga province, South Africa.
Figure 2: Arnot mine locality map
No 1 coal seam thickness is on average 1,23m and is characterised by a hard, good-quality mixed bright and dull banded coal with an average in-situ calorific value of 24,00MJ/kg on air-dried basis. The seam is primarily scheduled to be mined in the northern Mooifontein opencast portion of the mine right area.
The no 2 coal seam is continuous across the Arnot mine right area and varies from <1m to 4,5m in thickness, with an average of 3,1m. The seam generally sub-outcrops along the deeply incised valleys, with the depth to the top of coal of about 10m, but varying from 4m to 20m. The seam is site-specifically subdivided into lower (S2L); upper (S2U) and upper-upper (S2A) defined by two in-seam partings, namely the P2 and P3 parting. The S2L is the only coal seam being used in the underground

Mineral Resource & Reserve Report 2014 Page 52 of 79
resource areas and consists of dull to lustrous coal with several bright coal bands and occasional stone partings. It has a calorific value of 23,50-23,80MJ/kg (average 23,64MJ/kg) in the underground resource area and 24,45-25,23MJ/kg (average 24,78MJ/kg) in the northern opencast mining area. The number 3, 4 and 5 coal seams are sporadically developed in the mine right area and limited to topographically elevated areas.
Localised diabase intrusions are sporadically intersected. The dolerite dykes and sills have a devolatisation effect on the S2L coal seam, particularly in the southern part of the mine right area. The intersected dykes are generally thin (0,3-1,5m), discontinuous and sub-parallel to a sill in an east-west direction. This sill is well-developed (about 5-40m thick) and overlies the S2L coal seam along the south-eastern reserve boundary. Faults with displacement in excess of 2,5m are rare. The 2014 resource estimate was derived from a newly built 2014 Minex geological model.
Arnot’s no1, 2 and 3 shafts were established in 1969, with first coal supplied to the Arnot power station in 1971. Arnot currently extracts the no 2 lower coal seam from two underground shafts, no 8 and no 10, using mechanised mining equipment by means of bord-and-pillar extraction. The two shafts have a total of seven production sections and one development section. Mining activities at Mooifontein are subject to pending environmental authorisations. However, ongoing technical studies, surface acquisition and environmental authorisations (e.g. Mooifontein Re, 1, 7 and Grootlaagte) for the various farms’ portions in the open-cut areas are progressing well and at varying levels of finalisation. Planned mining at Mooifontein open-cut will use conventional truck-and-shovel, roll-over mining method to extract the no 2 coal seam lower and no 1 seam. No beneficiation is conducted, with ROM conveyed to Eskom’s Arnot power station stockpile yard. Annual ROM production to Eskom is 1,4Mt in comparison with 1,6Mt for 2013. Saleable product available for 2013, 2014 were 53,6Mt and 54,2Mt respectively.
Figure 3: Arnot resource areas

Mineral Resource & Reserve Report 2014 Page 53 of 79
Geology topographical highs have an adverse effect on the development and distribution of the no 2 lower coal seam. The effect is even more pronounced in underground mining areas where the seam typically and unexpectedly narrows and pinches out against palaeohighs, leading to uneconomic low seam heights and undulating coal floors which are usually not identified through the current resource drilling approach. A higher-resolution (closer grid spacing) drilling programme was implemented as well as a risk domain analysis process to proactively address these risks. The presence of dolerite dykes and sills poses a continuous high risk. Surface rights acquisitions and pending environmental approvals for various positions of the Mooifontein pose a challenge but ongoing technical studies, surface acquisition and environmental authorisations in the open-cut areas are progressing well and at varying levels of finalisation.
12.2 BELFAST PROJECT
The Belfast project is situated some 10km to the south-west of the town of Belfast. The project area is linked to the N4 national road between Belfast and Middelburg in Mpumalanga province and is linked to the main railway line to Maputo with the loading facility at Sunbery railway station. It is also connected via Carolina with the Richards Bay railway line.
Figure 4: Location map of Belfast project
Three coal seams in the project area can potentially be mined economically, the no 4, 3 and 2 coal seams. Coal seam 4 is on average thinner than 1m with only a small portion being thicker, and an area in the north-east being up to 4,5m thick. Coal seam 3 is thinner than 1m over most of the project area and never thicker than 1,8m, making underground mining of this seam currently uneconomical. Seam 2 is largely thicker than 1m over most of the project area. The average thickness of seam 2 is 2,8m with a maximum thickness of 4,5m to the north of the reserve area. Seam 4 is typically a lower-quality coal with an average calorific value (CV) of 15,93MJ/kg, ranging from 10MJ/kg in the north-west up to 25MJ/kg in the central west area. Seam 3 is a slightly better-quality coal with an average CV of 21,47MJ/kg, ranging from 15MJ/kg in the central part to 27MJ/kg in the southern part of the resource. Seam 2 has the highest-quality coal of the three seams, with an average CV of 24,77MJ/kg, ranging from 29MJ/kg in the south-west to 16MJ/kg in the north-east. Similarly to CVs, the percentage ash also decreases from seam 4 to the superior-quality seam 2. Average ash for seam 4, 3 and 2 is 40,21%, 27,85% and 18,26% respectively.
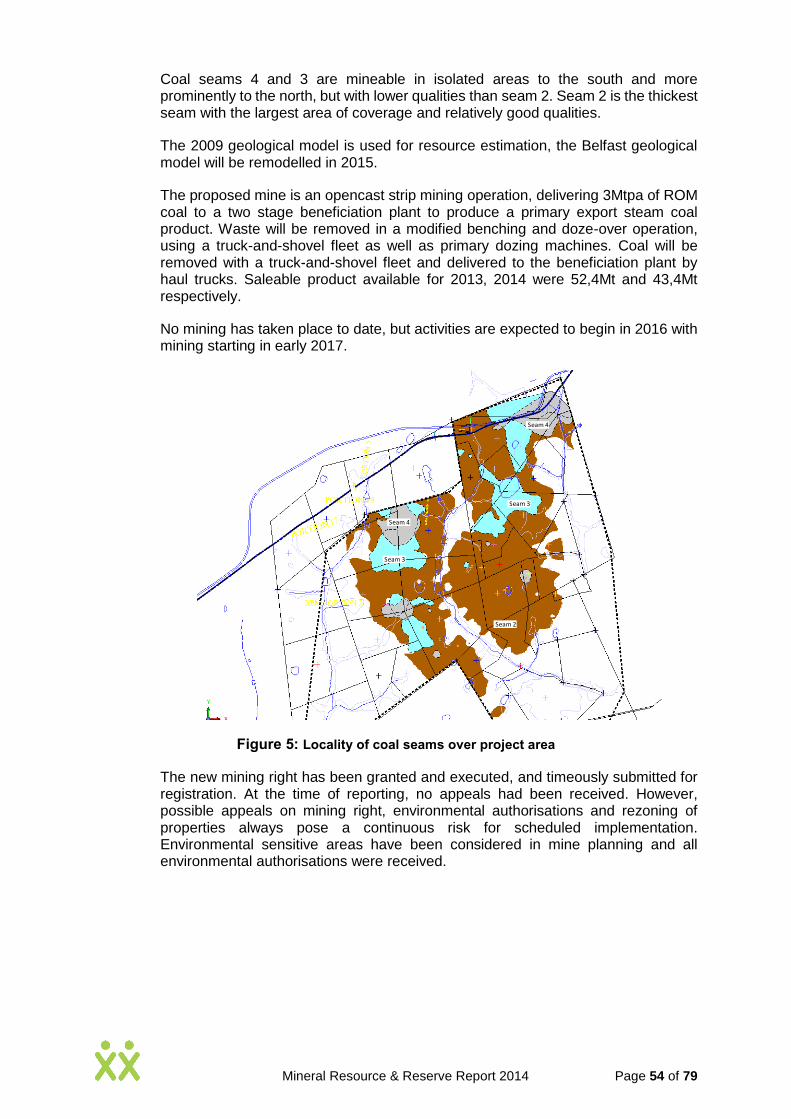
Mineral Resource & Reserve Report 2014 Page 54 of 79
Coal seams 4 and 3 are mineable in isolated areas to the south and more prominently to the north, but with lower qualities than seam 2. Seam 2 is the thickest seam with the largest area of coverage and relatively good qualities.
The 2009 geological model is used for resource estimation, the Belfast geological model will be remodelled in 2015.
The proposed mine is an opencast strip mining operation, delivering 3Mtpa of ROM coal to a two stage beneficiation plant to produce a primary export steam coal product. Waste will be removed in a modified benching and doze-over operation, using a truck-and-shovel fleet as well as primary dozing machines. Coal will be removed with a truck-and-shovel fleet and delivered to the beneficiation plant by haul trucks. Saleable product available for 2013, 2014 were 52,4Mt and 43,4Mt respectively.
No mining has taken place to date, but activities are expected to begin in 2016 with mining starting in early 2017.
Figure 5: Locality of coal seams over project area
The new mining right has been granted and executed, and timeously submitted for registration. At the time of reporting, no appeals had been received. However, possible appeals on mining right, environmental authorisations and rezoning of properties always pose a continuous risk for scheduled implementation. Environmental sensitive areas have been considered in mine planning and all environmental authorisations were received.
Seam 2
Seam 3
Seam 4
Seam 3
Seam 4

Mineral Resource & Reserve Report 2014 Page 55 of 79
12.3 GROOTEGELUK COAL MINE
Figure 6: Locality of Grootegeluk mine and Thabametsi project area
The mine is situated 18km west of Onverwacht and 22km west of Lephalale. Neighbouring towns include Thabazimbi (130km south), Vaalwater (90km south-east), and Mokopane (160km east-south-east). The Botswana border is 40km north of the mine, delineated by the Limpopo River.
The coal seams of the Waterberg coalfield occur in the Volksrust and Vryheid formations of the Karoo sequence. Numerous coal seams occur over a stratigraphic thickness of at least 115m. These seams are subdivided into 11 coal zones, which are further divided into separate coal and non-coal samples for analysis.
Grootegeluk is a surface coal-mining operation on the shallow open-castable portion of the Waterberg coalfield. A series of parallel mining benches advances progressively across the deposit via a process of drilling, blasting, loading and hauling with truck-and-shovel fleets. Pre-stripping of the overburden, in weathered areas consisting of weathered shale and coal, is accomplished by deploying hydraulic shovels, while areas with unweathered shale are drilled and blasted. Access to the different benches is provided by a series of inclined roads, arranged in a diverging manner from the pit top, situated along the northern and southern pit limits. Overburden and interburden waste is being backfilled in the mined-out void of the pit.

Mineral Resource & Reserve Report 2014 Page 56 of 79
Figure 7: Grootegeluk area view
The Vryheid formation (55m thick) forms the lower part of the coal deposit and comprises carbonaceous shale and sandstone with interbedded dull coal seams varying in thickness from 1,5 to 9m. Due to its nature, it is classified as a multiple seam deposit type according to the South African guide to the systematic evaluation of coal resources and coal reserves (SANS 10320, 2004). There are five coal zones in the Vryheid formation, predominantly dull coal, with some bright coal developed at the base of zones 2, 3 and 4. Due to lateral facies changes and variations in the depositional environment, these zones are characterised by a large variation in thickness and quality. It appears that these zones depreciate in a westerly direction as observed within the Grootegeluk mining right and adjacent prospecting right area of Thabametsi.
The top half of the stratigraphy comprises a thick interbedded seam deposit type (Volksrust formation) which resulted in establishing massive beneficiation capacity on site, to convert run-of-mine into saleable reserves. The coal resources of Grootegeluk mine was estimated using the Minex geological model that was created in 2013. Annual run-of-mine at Grootegeluk is 37,9Mt in comparison with 37,0Mt for 2013. The mine has a multiproduct output (thermal coal, semi-soft coking and metallurgical coal as well as semi-coke as a downstream char product) sold to a wide spectrum of domestic and international clients.
The main portion of the beneficiated product is power station coal with an average ash content of 35%. This coal is continuously dispatched to the nearby Matimba power station via a conveyer belt. Several sized metallurgical coal products at 15% ash and 11,25% ash, as well as semi-soft coking coal at 10,3% ash, are railed to various customers and shipped to international clients via export harbours. A small portion of the total product is sold on site to smaller customers and dispatched by road. Saleable product available for 2013, 2014 were 1622Mt and 1710Mt respectively.
A downstream char product, semi-coke, is also produced on site, using low phosphorus metallurgical coal at 15% ash as feedstock material, and sold to various customers.
The phosphorous content of bench 11 poses a risk to the continued production of semi-coke product. Increasing sulphur content in benches used for the production of semi-soft coking coal (SSCC) can clearly be observed (benches 2, 3 and 4). Research programmes to investigate, outline and manage these trends have been implemented.
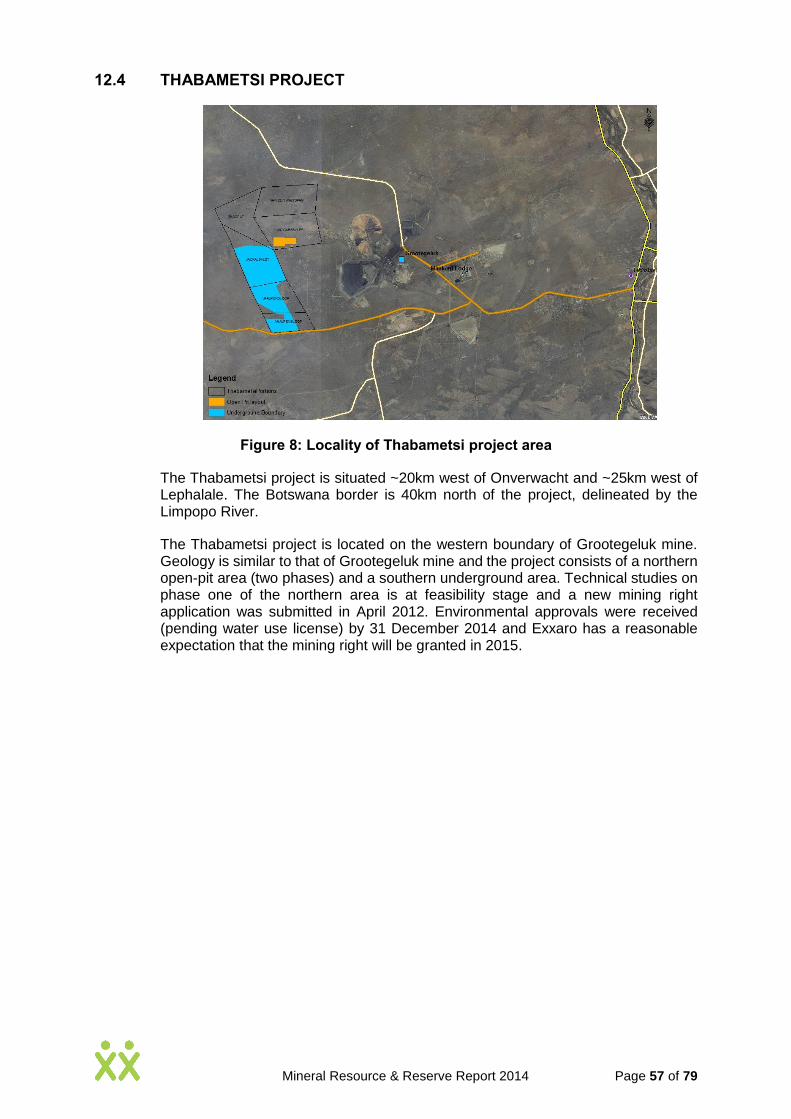
Mineral Resource & Reserve Report 2014 Page 57 of 79
12.4 THABAMETSI PROJECT
Figure 8: Locality of Thabametsi project area
The Thabametsi project is situated ~20km west of Onverwacht and ~25km west of Lephalale. The Botswana border is 40km north of the project, delineated by the Limpopo River.
The Thabametsi project is located on the western boundary of Grootegeluk mine. Geology is similar to that of Grootegeluk mine and the project consists of a northern open-pit area (two phases) and a southern underground area. Technical studies on phase one of the northern area is at feasibility stage and a new mining right application was submitted in April 2012. Environmental approvals were received (pending water use license) by 31 December 2014 and Exxaro has a reasonable expectation that the mining right will be granted in 2015.

Mineral Resource & Reserve Report 2014 Page 58 of 79
Figure 9: Thabametsi geology comparison and proposed bench definition
The entire mining area is relatively flat. Overburden thickness varies from 20m to almost 65m, due to the geological structure. Studies on the northern open-pit area (McCabesvley farm) focus on the upper five benches of the Volksrust formation and bench 6 of the Vryheid formation.
The following coal benches, according to the Grootegeluk bench definition, are present within the Thabametsi northern resource:
Bench 2, average raw CV 14,6MJ/kg and thickness 11,0m
Bench 3, average raw CV 10,2MJ/kg and thickness 14,4m
Bench 4, average raw CV 11,2MJ/kg and thickness 17,7m
Bench 5, average raw CV 9,1MJ/kg and thickness 18,4m
Bench 6, average raw CV 16,3MJ/kg and thickness 3,1m
Bench 9A, not present
Bench 9B, raw CV 25,1MJ/kg and thickness 1,5m
Bench 11, average raw CV 23,2MJ/kg and thickness 4.1m.
Bench 9A is not present and benches 9B and 11 are at lower quality and thickness compared to the Grootegeluk reserve. These benches are separated by partings, i.e. inter-burdens (benches 7, 8 and 10). The bench 10 sandstone is very thick, making it uneconomical to mine using open-pit methods.

Mineral Resource & Reserve Report 2014 Page 59 of 79
Due to geological structure and subsequent weathering, the Volksrust formation is not entirely present over the Thabametsi project area. On large areas of the farms Jackalsvley and Vaalpensloop, only coal of the Vryheid formation occurs. Resource estimation is based on the Grootegeluk 2010 Minex geological model.
The focus of technical studies in the northern project area is on establishing an open-pit on the farm McCabesvley. A new bench definition in comparison with Grootegeluk mine is proposed, i.e. three high benches, combining some of the Grootegeluk traditional benches. The high-bench mining method will use conventional drilling and blasting, i.e. 40-45m wide blasting block, including dozing blasted material to the shave, or a cast-blasting mining method of 20m wide blasting block to minimise the height of blasted material with minimum dozing involved. A box-cut is required to establish a haulage ramp and initial mining face for production ramp-up. After completing the box-cut, mining benches will be established on the northern face of the box-cut.
Figure 10: Thabametsi proposed mining method
The initial mining advance will proceed in a northerly direction until the northern pit limit is reached. In the initial phases 1, 2 and 3, a new face-line, i.e. benches, will be established on the western side of the ‘mini-pit’, enabling the start of phase 4 of mining, i.e. mining in a westerly direction.
The mining operation takes cognisance of different material categories that determine the mining method, applied technology and equipment selection. The proposed pit limits provide a minimum 30-year life-of-mine (LoM). Exploration activities are continues on the rest of the project area.
The success of the northern open-pit phase 1 is reliant on approval of the pending mining right and integrated water use licence applications.
12.5 INYANDA COAL MINE
Inyanda lies within the boundaries of the Nkangala district municipality in Mpumalanga province, South Africa. The mine is some 14km north of the town of eMalahleni on the eMalahleni-Zaaihoek tarred road on the farm Kalbasfontein 284JS.

Mineral Resource & Reserve Report 2014 Page 60 of 79
Figure 11: Inyanda locality map
Two well-developed coal seams (no 1 and 2) are present in the Vryheid formation at Kalbasfontein. The coal seams are close to horizontal but dip gently in a southerly direction. Slight undulations are probably due to differential compaction.
The no 1 and no 2 coal seams are separated by gritty feldspathic sandstone that varies in thickness. The S1 and S2 coal seams consist mainly of dull coal with a few bright coal laminae. The top coal seam (S2) occurs over a smaller area than the bottom seam (S1) due to weathering that defines the sub-outcrop. The area between sub-outcrops of the seams may also contain some clay as overburden that originated from the weathering of the top coal seam. Resource estimation is based on the 2013 Minex geological model.
The mine is a surface operation where both coal seams are mined separately across the deposit via a process of drilling and blasting, loading and hauling. The coal is beneficiated to produce A-grade steam coal with a minimum CV of 27,5MJ/Kg and maximum ash content of 15%. The coal seams are transported and washed separately, and only combined as a product. A-grade steam coal is transported via rail to RBCT for the export market. Annual run-of-mine is 2,16Mt in comparison with 1,99Mt for 2013. Saleable product available for 2013, 2014 were 2,13Mt and 0,73Mt respectively.
Figure 12: Inyanda beneficiation plant
The Inyanda operation is nearing closure (expected towards end-2015). However, the amendment of the environmental management programme to include the

Mineral Resource & Reserve Report 2014 Page 61 of 79
Pegasus South reserve area (in the existing mine right area) was received and will increase the mine life slightly.
12.6 LEEUWPAN COAL MINE
Leeuwpan is some 10km south-east of the town of Delmas, around 80km east of Johannesburg and 70km south-east of Pretoria, in Mpumalanga province. The mine is next to the R50 secondary road and serviced by a rail track that includes a rapid load-out station for loading trains.
Figure 13: Leeuwpan coal mine locality map
The coal mined at Leeuwpan is hosted in the sedimentary rocks of the Karoo super group. Two coal seams have been identified at Leeuwpan namely, upper coal zone (TC) and the bottom seam (BC). The BC correlates with the no 2 seam of the Witbank coalfield and the TC with the no 4 and 5 seams of the same. In the resource areas ODS, OWM and OI, the coal seams are subdivided into a BL1A, BB, 4Upper, 4Lower, 2Upper and 2Lower based on assay quality parameters. For the bottom coal, raw ash content <30% of which a 16% ash product can be produced at a yield of >60%. For the top coal, ash content >35% of which a 16% ash product cannot be produced at a yield >40%. Resource estimation is based on the Leeuwpan 2013 Minex geological model.
Mining is by open-pit in a modified terrace configuration using a conventional truck-and-shovel method. Hydraulic shovels and articulated dump trucks are used due to the soft, clayish overburden and complex geological conditions. Run-of-mine coal is selectively mined according to volatile and ash content to allow the beneficiation plant to blend coals to meet exact client specifications. Immediate backfilling into the pit with overburden and plant discard via a continuous haul-back technique creates a moving void. Annual run-of-mine at Leeuwpan is 6,6Mt in comparison with 5,8Mt for 2013 and supplies some 14% of Majuba power station’s coal requirement. Saleable product available for 2013, 2014 were 59,5Mt and 53,6Mt respectively.
All environmental approvals for the strategic Leeuwpan OI reserve were submitted timeously and Exxaro has a reasonable expectation that approvals will not be withheld. Exxaro owns all surface rights for phase 1 and 2 of the OI reserve and negotiations for the surface rights for phase 3 are under way.

Mineral Resource & Reserve Report 2014 Page 62 of 79
12.7 MATLA COAL MINE
Matla is in the Kriel district of Mpumalanga, some 20km west of Kriel, 50km south-west of Witbank and 30km south of Ogies. Matla is an underground operation with three mines, namely mine 1, mine 2 and mine 3. First production was in 1978.
Figure 14: Matla mine locality map
The stratigraphic sequence in the Matla area includes five coal seams that can be easily correlated with seams found in the Witbank coalfield. The principal economic coal seams currently exploited are the no 2 and 4 seams. Mining of no 5 seam as a power station feedstock was terminated in May 1998 because of high levels of contamination that resulted in an excessively high overall abrasive content. Average thickness of the no 5, 4 and 2 coal seams at Matla is 1,6m, 4m and 5m respectively. No 4 seam is strongly developed in the mine 1, mine 2 and southern reserve areas, and to a limited extent in the mine 3 area. At mine 3, no 4 seam splits into two thin, poor-quality horizons to the west, so we have excluded this coal from mineable reserves. In general, calorific value decreases from east to west with the best no 4 coal quality found at mine 1 and the eastern edges of mine 2. Over the total mining area, it is often necessary to leave a beam of dull to shaly coal, with inter-bedded shale bands, in the roof due to quality constraints. This coal forms a competent beam, resulting in good roof conditions. The mineable coal horizon of no 4 seam is restricted to the upper portion of the seam in areas where the in-seam parting in the lower portion exceeds 0,30m. In these areas, the bottom part of the seam is excluded from reserves. Resource estimation is based on the 2014 Minex geological model.
Mine 1 extracts no 4 coal seam through an underground bord-and-pillar operation, three continuous mining (CM) sections and a development section. Matla mine 2 and mine 3 use both bord-and-pillar and shortwall methods to mine no 2 and no 4 seam respectively. Coal is delivered to the Eskom Matla power station via a network of conveyor belts. Coal mined at Matla is not processed or beneficiated in any way, it is only screened and crushed before being sent to the power station. Annual run-of-mine at Matla is 10,4Mt in comparison with 10,1Mt for 2013. Saleable product available for 2013, 2014 were 224,2Mt and 224,3Mt respectively. With the current extraction rate, Matla is projected to be in production at least until 2033.
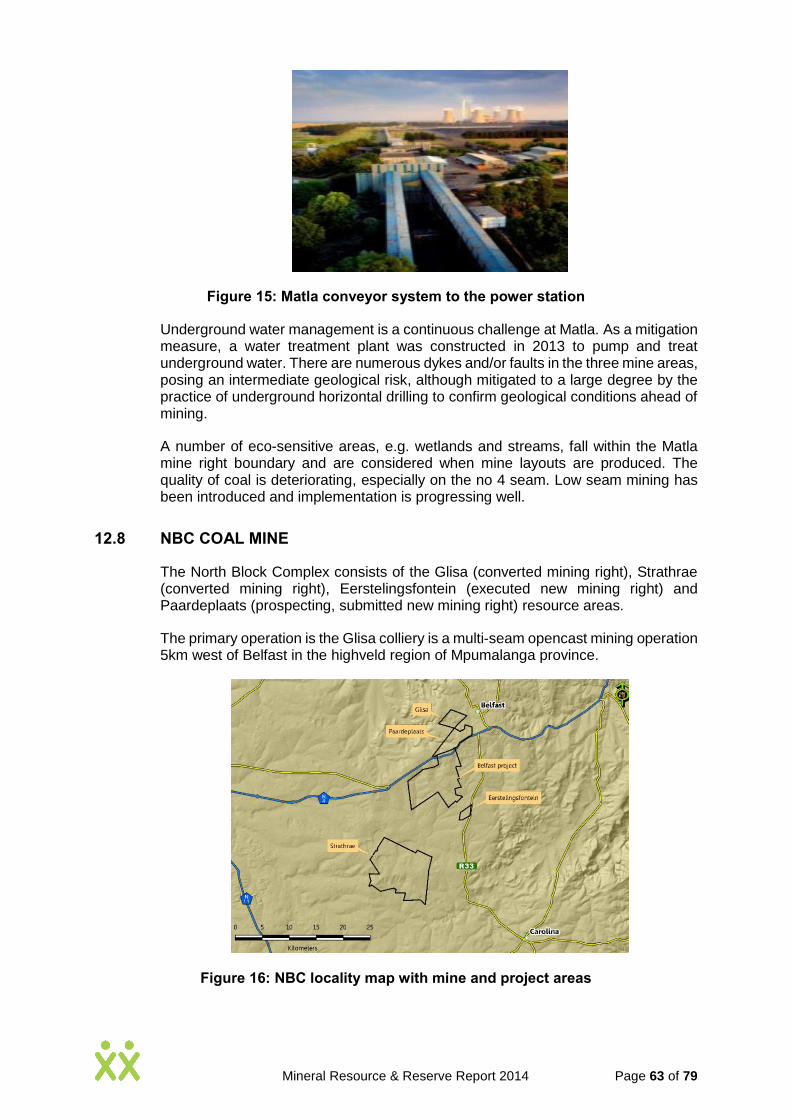
Mineral Resource & Reserve Report 2014 Page 63 of 79
Figure 15: Matla conveyor system to the power station
Underground water management is a continuous challenge at Matla. As a mitigation measure, a water treatment plant was constructed in 2013 to pump and treat underground water. There are numerous dykes and/or faults in the three mine areas, posing an intermediate geological risk, although mitigated to a large degree by the practice of underground horizontal drilling to confirm geological conditions ahead of mining.
A number of eco-sensitive areas, e.g. wetlands and streams, fall within the Matla mine right boundary and are considered when mine layouts are produced. The quality of coal is deteriorating, especially on the no 4 seam. Low seam mining has been introduced and implementation is progressing well.
12.8 NBC COAL MINE
The North Block Complex consists of the Glisa (converted mining right), Strathrae (converted mining right), Eerstelingsfontein (executed new mining right) and Paardeplaats (prospecting, submitted new mining right) resource areas.
The primary operation is the Glisa colliery is a multi-seam opencast mining operation 5km west of Belfast in the highveld region of Mpumalanga province.
Figure 16: NBC locality map with mine and project areas

Mineral Resource & Reserve Report 2014 Page 64 of 79
NBC (Glisa) mine resource area is close to the eastern edge of the Witbank coalfield, in the northern part of the Main Karoo basin. All Witbank coalfield seams, i.e. no 1, no 2, no 3, no 4 and no 5 seams, occur in the Glisa area, with the no 2, no 3 and no 4 seams being of economic importance. The stratigraphy consists predominantly of the different coal seams separated by fine- and medium- to coarse-grained sandstone, with subordinate mudstone, shale, sandstone and carbonaceous shale.
The Eerstelingsfontein block to the south-east of Glisa is composed of gently sloping topography. The coal resource at Eerstelingsfontein is contained in a single seam, the no 2 seam. This seam occurs as an erosional remnant on high ground at shallow depths, suitable for opencast mining. The thickness of the coal seam ranges from 0,46m to 3,10m with an average thickness of 2,29m. The coal seam is overlain by medium- to fine-grained sandstone with shaly bands. On top of the whole succession is the overburden material made of sandy soil and regolith. The average total depth to coal is relatively shallow at 10,69m. The maximum depth to top of coal in the area is 17,79m.
A study at the Paardeplaats project, adjacent to Glisa colliery, is at prefeasibility stage, and its mining right application was accepted in June 2012. Given its proximity to Glisa, its resources are expected to be a natural extension of the Glisa reserve base. Resource estimation is based on the 2013 Minex geological model.
The mining method at NBC is normal strip mining. NBC currently only supplies three Eskom power stations with coal, Arnot, Tutuka and Komati. NBC produced a total of 3,61Mt ROM in 2014 from the Glisa colliery in comparison with 3,60Mt for 2013, and a total of 2,60Mt of product. The majority of Glisa’s ROM (55%) is put through dry crushing and screening plants, from which the bulk of the product (~75%) is produced. Blending of the different seams is done raw blended to meet product specifications. The washing plant at Glisa was first commissioned in May 2010, and handled 260kt of ROM and produced 113kt of product (43% yield) for that year. In 2014, the washing plant processed 1,47Mt (45%) of ROM and produced 0,64Mt at a yield of 44%. Saleable product available for 2013, 2014 were 11,8Mt and 9,2Mt respectively.
12.9 TSHIKONDENI COAL MINE
Tshikondeni is a hard coking coal producer in the north-eastern corner of Limpopo province, some 100km east of Tshipise and 17km south-east of Masisi, adjacent to the Levuvhu River and Kruger National Park.
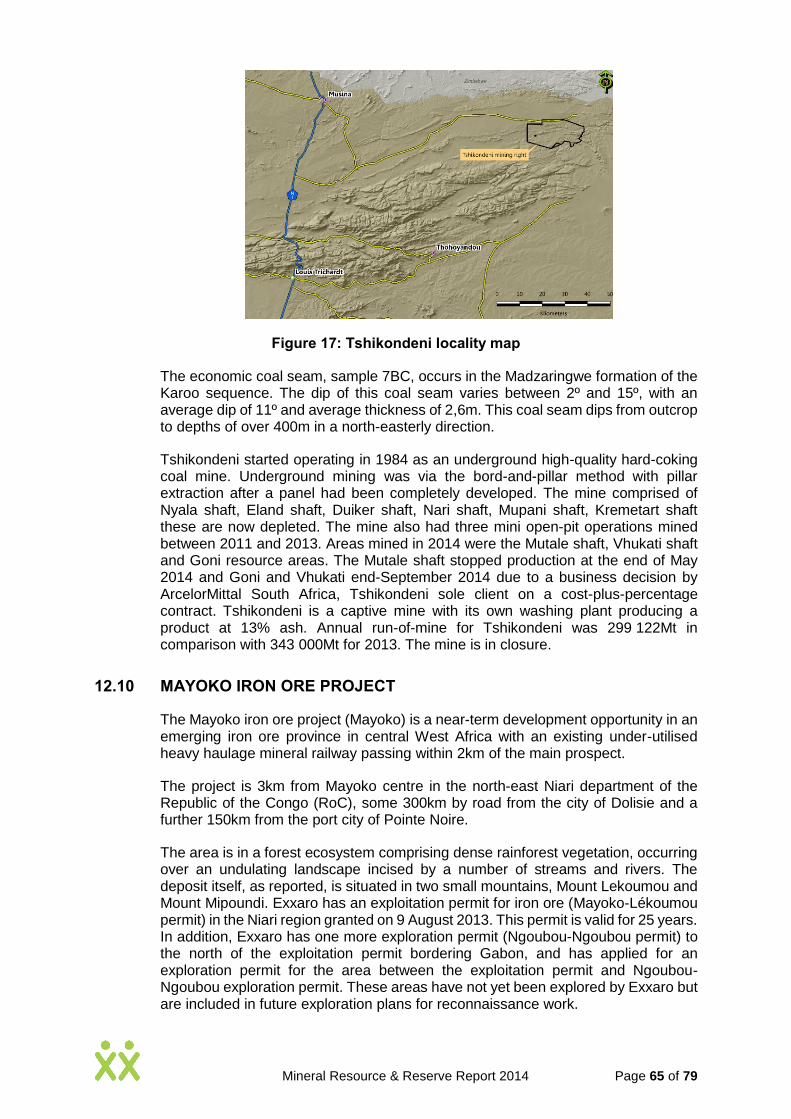
Mineral Resource & Reserve Report 2014 Page 65 of 79
Figure 17: Tshikondeni locality map
The economic coal seam, sample 7BC, occurs in the Madzaringwe formation of the Karoo sequence. The dip of this coal seam varies between 2º and 15º, with an average dip of 11º and average thickness of 2,6m. This coal seam dips from outcrop to depths of over 400m in a north-easterly direction.
Tshikondeni started operating in 1984 as an underground high-quality hard-coking coal mine. Underground mining was via the bord-and-pillar method with pillar extraction after a panel had been completely developed. The mine comprised of Nyala shaft, Eland shaft, Duiker shaft, Nari shaft, Mupani shaft, Kremetart shaft these are now depleted. The mine also had three mini open-pit operations mined between 2011 and 2013. Areas mined in 2014 were the Mutale shaft, Vhukati shaft and Goni resource areas. The Mutale shaft stopped production at the end of May 2014 and Goni and Vhukati end-September 2014 due to a business decision by ArcelorMittal South Africa, Tshikondeni sole client on a cost-plus-percentage contract. Tshikondeni is a captive mine with its own washing plant producing a product at 13% ash. Annual run-of-mine for Tshikondeni was 299 122Mt in comparison with 343 000Mt for 2013. The mine is in closure.
12.10 MAYOKO IRON ORE PROJECT
The Mayoko iron ore project (Mayoko) is a near-term development opportunity in an emerging iron ore province in central West Africa with an existing under-utilised heavy haulage mineral railway passing within 2km of the main prospect.
The project is 3km from Mayoko centre in the north-east Niari department of the Republic of the Congo (RoC), some 300km by road from the city of Dolisie and a further 150km from the port city of Pointe Noire.
The area is in a forest ecosystem comprising dense rainforest vegetation, occurring over an undulating landscape incised by a number of streams and rivers. The deposit itself, as reported, is situated in two small mountains, Mount Lekoumou and Mount Mipoundi. Exxaro has an exploitation permit for iron ore (Mayoko-Lékoumou permit) in the Niari region granted on 9 August 2013. This permit is valid for 25 years. In addition, Exxaro has one more exploration permit (Ngoubou-Ngoubou permit) to the north of the exploitation permit bordering Gabon, and has applied for an exploration permit for the area between the exploitation permit and Ngoubou-Ngoubou exploration permit. These areas have not yet been explored by Exxaro but are included in future exploration plans for reconnaissance work.
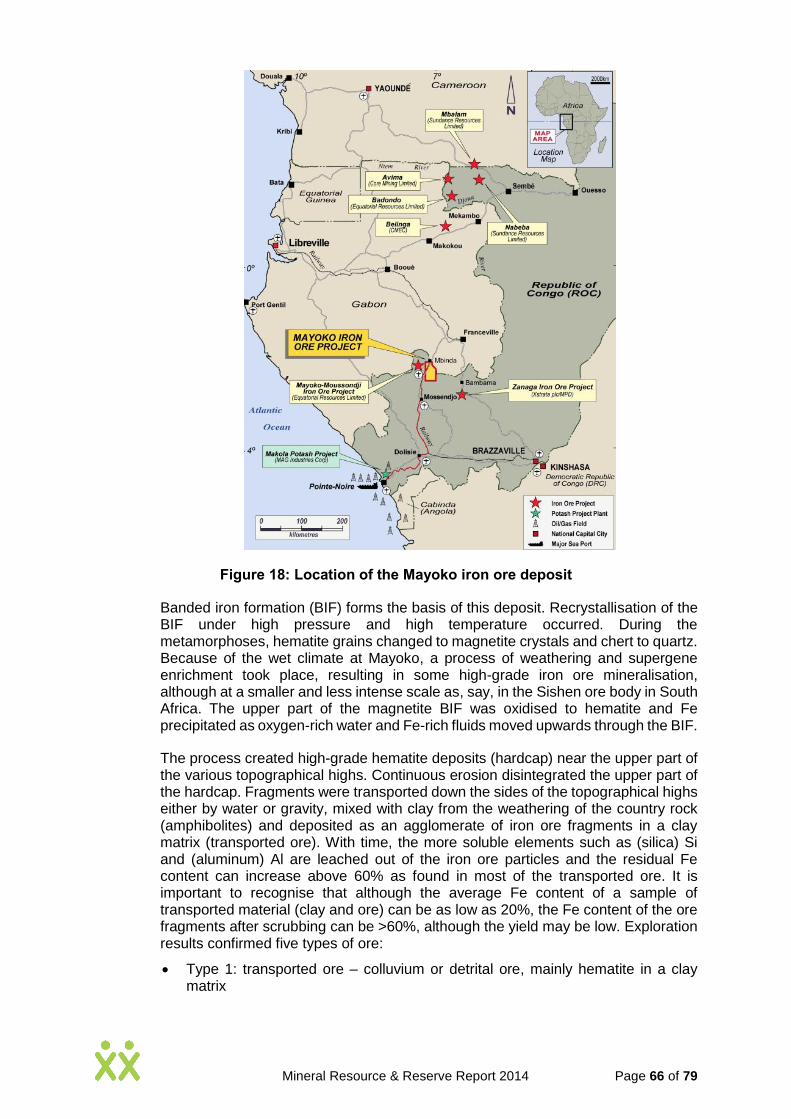
Mineral Resource & Reserve Report 2014 Page 66 of 79
Figure 18: Location of the Mayoko iron ore deposit
Banded iron formation (BIF) forms the basis of this deposit. Recrystallisation of the BIF under high pressure and high temperature occurred. During the metamorphoses, hematite grains changed to magnetite crystals and chert to quartz. Because of the wet climate at Mayoko, a process of weathering and supergene enrichment took place, resulting in some high-grade iron ore mineralisation, although at a smaller and less intense scale as, say, in the Sishen ore body in South Africa. The upper part of the magnetite BIF was oxidised to hematite and Fe precipitated as oxygen-rich water and Fe-rich fluids moved upwards through the BIF.
The process created high-grade hematite deposits (hardcap) near the upper part of the various topographical highs. Continuous erosion disintegrated the upper part of the hardcap. Fragments were transported down the sides of the topographical highs either by water or gravity, mixed with clay from the weathering of the country rock (amphibolites) and deposited as an agglomerate of iron ore fragments in a clay matrix (transported ore). With time, the more soluble elements such as (silica) Si and (aluminum) Al are leached out of the iron ore particles and the residual Fe content can increase above 60% as found in most of the transported ore. It is important to recognise that although the average Fe content of a sample of transported material (clay and ore) can be as low as 20%, the Fe content of the ore fragments after scrubbing can be >60%, although the yield may be low. Exploration results confirmed five types of ore:
Type 1: transported ore – colluvium or detrital ore, mainly hematite in a clay matrix

Mineral Resource & Reserve Report 2014 Page 67 of 79
Type 2: capping ore – iron oxide cap rock, ‘chapeau de fer’ or ‘hat of iron’, formed by supergene enrichment in situ. It consists of mainly hematite and goethite as an agglomeration of various-sized particles
Type 3: enriched BIF – weathered ferruginous quartzites (BIF), formed when the quartzite was leached out and magnetite mostly changed to hematite
Type 4: transitional BIF – ferruginous quartzites (BIF), where quartzite is still present but some of the magnetite was changed to hematite
Type 5: fresh BIF – ferruginous quartzites (BIF) still in the original form of magnetite and quartzites. Limited mineralogical changes occurred.
Resource estimation is based on the 2014 Surpac geological model.
The project is currently in a conceptual phase. All activities were been halted in early 2014 due to a technical and business review programme.
Figure 19: Mayoko ore deposit – schematic representation
13. EXPLORATION
Exploration conducted in the coal business in existing operations consisted of drilling (diamond core and reverse circulation) and limited surface geophysical surveys, and downhole geophysical logging. Exploration was mainly conducted on current mining right areas and two prospecting areas included in the mineral resource and reserve statement. Drilling was carried out for production purposes and to improve geological confidence, and to enhance future geological modelling and estimation. A limited amount of geotechnical drilling was conducted to improve mine planning parameters.
13.1 NCC COAL MINE
NCC is in the process of disinvestment and no exploration was conducted in 2014.

Mineral Resource & Reserve Report 2014 Page 68 of 79
13.2 GROOTEGELUK COAL MINE
Figure 20: Grootegeluk coal mine
The mining right area has been explored through diamond and open-hole drilling to enhance the various resource categories of inferred, indicated and measured. Drilling of nine boreholes were conducted, improving the level of confidence in the overall resource area and catering for the expected increase in mining tempo as a result of the Medupi ramp-up.
13.3 ARNOT COAL MINE
Figure 21: Arnot coal mine
Arnot is one of the oldest coal mines in the region and extensively explored. Production drilling and diamond exploration drilling were conducted in 2014 to increase the level of geological confidence in the underground and open-cut area.
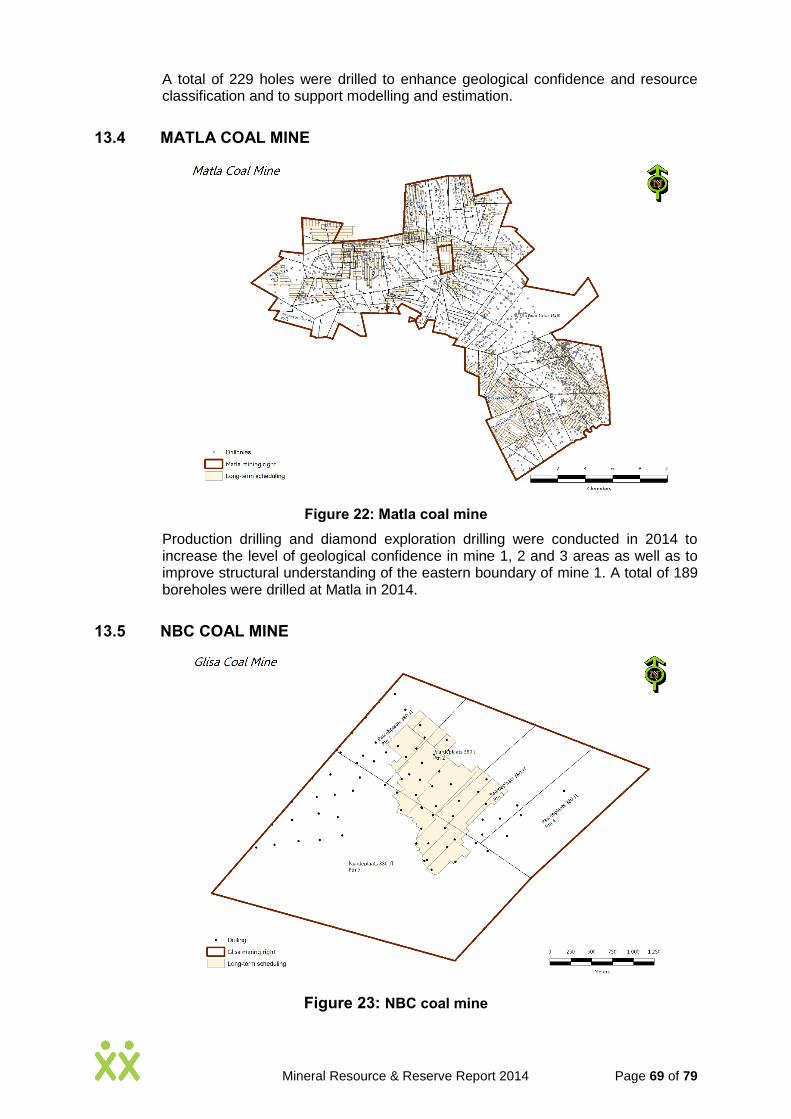
Mineral Resource & Reserve Report 2014 Page 69 of 79
A total of 229 holes were drilled to enhance geological confidence and resource classification and to support modelling and estimation.
13.4 MATLA COAL MINE
Figure 22: Matla coal mine
Production drilling and diamond exploration drilling were conducted in 2014 to increase the level of geological confidence in mine 1, 2 and 3 areas as well as to improve structural understanding of the eastern boundary of mine 1. A total of 189 boreholes were drilled at Matla in 2014.
13.5 NBC COAL MINE
Figure 23: NBC coal mine

Mineral Resource & Reserve Report 2014 Page 70 of 79
All NBC resources are in the measured resource category but five holes are planned for 2015 to explore thickness and coal quality of block C if required. No drilling was conducted in 2014.
13.6 LEEUWPAN COAL MINE
Figure 24: Leeuwpan coal mine
Drilling is done in the dry winter months only using conventional diamond core drilling with TNW size (60mm diameter) core at -90⁰ dip. Core is logged according to lithological contacts and marked on the core. A total of 65 boreholes were drilled in 2014 at three different resource areas (OL, OJ and OH) to enhance geological confidence.

Mineral Resource & Reserve Report 2014 Page 71 of 79
13.7 THABAMETSI PROJECT
Figure 25: Grootegeluk West coal project
Fifteen large diameter holes were drilled, 11 on the farm Jackalsvlei on a 500x500m grid and four infill boreholes on McCabesvlei.
The prospecting right is divided into a north and south project area. The northern project area is current at feasibility stage and drilling in 2014 was to improve the geological level of confidence in the northern planned open-pit area and to enhance rock engineering information.
13.8 COAL SUMMARY
Exploration conducted in the coal business in existing operations consisted primarily of drilling (diamond core and RC) and limited surface geophysical surveys, and downhole geophysical logging. Drilling was carried out to improve both geological confidence and future geological modelling and estimation. A limited amount of geotechnical drilling was conducted to enhance mine planning parameters. No exploration was conducted over the Waterberg North or Waterberg South prospecting right areas.

Mineral Resource & Reserve Report 2014 Page 72 of 79
Table 16: Summary of exploration expenditure for coal
Project or mining operation
2013 actual 2014 actual 2015 planning*
Boreholes Cost (Rm) Boreholes Cost (Rm) Boreholes Cost (Rm)
Number Total Number Drilling Analyses & other Total Number Total
NCC coal mine 7 1,2 None - - - None -
Grootegeluk coal mine 3 3,6 9 2,0 12,0 14,0 9 13,4
Arnot coal mine 181 4,3 229 11,8 0,8 12,6 160 23,5
Matla coal mine 150 8,5 189 13,0 4,0 17,0 150 16,7
NBC coal mine 26 1,2 None - - - None -
Leeuwpan coal mine 60 4,6 65 2,7 4,0 6,70 52 6,1
Thabametsi exploration 8 3,2 15 4,0 2,0 6,0 14 9,0
Total 435 16,5 608 33,5 22,8 56,3 400 78,7
Mining right areas 427 14,4 593 29,5 20,8 50,3 371 59,7
Prospecting right areas 8 3,2 15 4,0 2,0 6,0 14 9,0
*Non-committed

Mineral Resource & Reserve Report 2014 Page 73 of 79
13.9 MAYOKO PROJECT
Early exploration between 1929 and 1954 comprised regional and some local mapping, identifying iron ore mineralisation during this time. Between 1960 and 1964, the Congolese mining office carried out a geological research mission, but it was only in 1975 that the first chemical analyses of samples from over 40 drill holes were carried out by ICES.
Further exploration work was carried out by French company Bureau de Recherches Géologique et Maniéres (BRGM) in the 1980s. In December 2007, the project was acquired by DMC and a rock-chip sampling, geological mapping, trench sampling and resampling of historical pits were completed. DMC commissioned the Runge resource estimation in May 2008 which included introductory metallurgical test work from various surface and open-pit samples. In 2009, a high-resolution airborne geophysical survey, over the central portion of the 1 000km2 Mayoko exploration license (covering 220km2 on a 200m line spacing orientated north-south with a 20m average terrain clearance) was conducted. Subsequent mapping, trenching and sampling were completed and 18 diamond-cored exploration holes drilled at the Lekoumou deposit. Modelling of the magnetic data collected identified the potential exploration targets of Mipoundi North, Lekoumou South, Mbinda, Doumani and several unnamed regional targets. In 2011, African Iron (AKI) undertook the drilling of 20 diamond and 27 reverse circulation holes and completed geological models and resource statements in December 2011 and April 2012. Exxaro acquired the project in March 2012 and refocused the exploration programme to primarily delineate the transported ore and, secondly, improve the geological confidence of capping, enriched, transitional and fresh BIF materials at Lekoumou and Mipoundi. Some high-level field reconnaissance was undertaken of conceptual targets outside the Lekoumou and Mipoundi areas, but results are still being evaluated.

Mineral Resource & Reserve Report 2014 Page 74 of 79
2
Figure 26: Exploitation and exploration permits
An extensive exploration programme was conducted in 2013, focusing on Lekoumou and Mipoundi. Smaller grid RC and auger drilling was carried out to increase the level of geological confidence and metallurgical characterisation of the transported ore. In addition, a diamond-cored drilling programme was conducted to increase the geological confidence of the deeper located in-situ mineralisation (ore types) as well as selective geotechnical and rock engineering drilling for mine planning purposes. Some 23 000m were drilled during the year. Reverse circulation drilling on Mt Lekoumou focused on bringing the entire resource into the measured category, based on a 50m x 50m grid over the deposit, reaching 25m x 25m drill-hole spacing in critical areas for grade control purposes. The Mt Mipoundi RC drilling was conducted on a 50m x 100m grid to move the resource into the indicated category. Diamond drilling was continued on the Mt Lekoumou deposit on a 100m x 50m grid to move more of the in-situ resource into the indicated category and a 200m x 50m grid on Mt Mipoundi to increase the portion of the resource in the inferred category. The extensive drilling programme and subsequent modelling resulted in updating the mineral resource statement in 2013. One significant result of the 2013 RC drilling
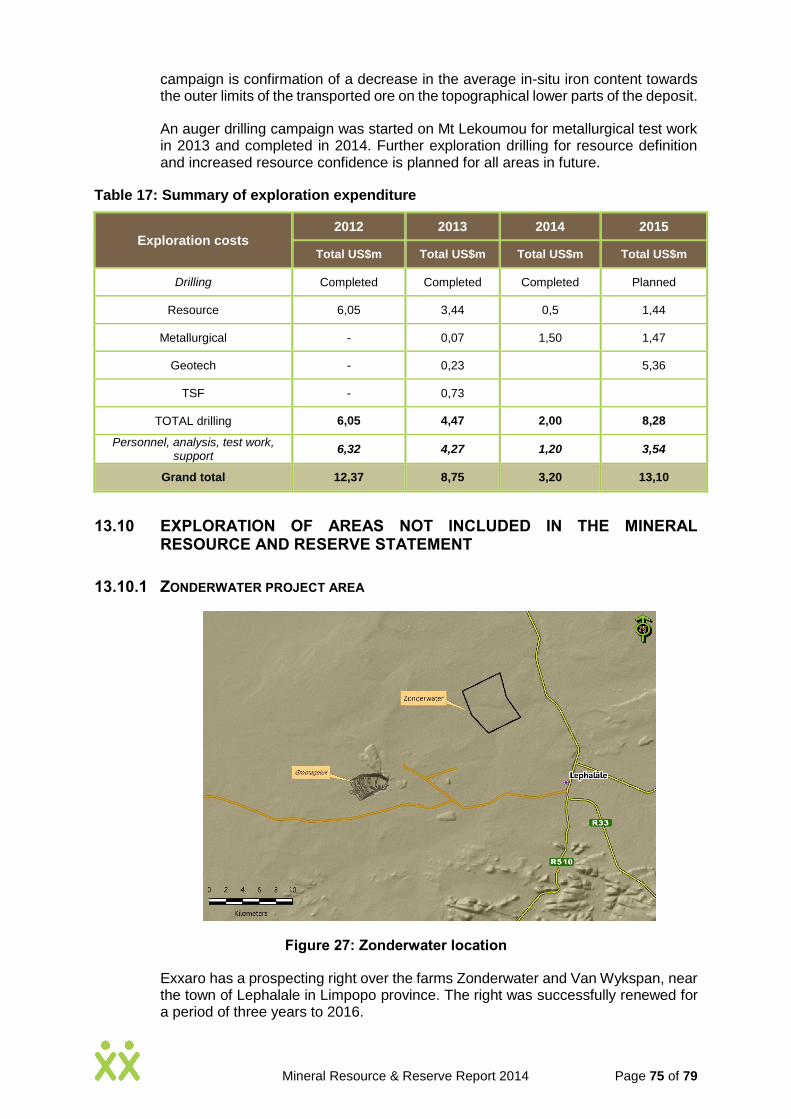
Mineral Resource & Reserve Report 2014 Page 75 of 79
campaign is confirmation of a decrease in the average in-situ iron content towards the outer limits of the transported ore on the topographical lower parts of the deposit.
An auger drilling campaign was started on Mt Lekoumou for metallurgical test work in 2013 and completed in 2014. Further exploration drilling for resource definition and increased resource confidence is planned for all areas in future.
Table 17: Summary of exploration expenditure
Exploration costs 2012 2013 2014 2015
Total US$m Total US$m Total US$m Total US$m
Drilling Completed Completed Completed Planned
Resource 6,05 3,44 0,5 1,44
Metallurgical - 0,07 1,50 1,47
Geotech - 0,23 5,36
TSF - 0,73
TOTAL drilling 6,05 4,47 2,00 8,28
Personnel, analysis, test work, support
6,32 4,27 1,20 3,54
Grand total 12,37 8,75 3,20 13,10
13.10 EXPLORATION OF AREAS NOT INCLUDED IN THE MINERAL RESOURCE AND RESERVE STATEMENT
13.10.1 ZONDERWATER PROJECT AREA
Figure 27: Zonderwater location
Exxaro has a prospecting right over the farms Zonderwater and Van Wykspan, near the town of Lephalale in Limpopo province. The right was successfully renewed for a period of three years to 2016.

Mineral Resource & Reserve Report 2014 Page 76 of 79
The major coal-bearing horizons of the Karoo supergroup are the Volksrust and Vryheid formations in the Ecca group. The Ecca group is underlain by the Dwyka group, a glaciofluvial deposit ranging from gravel to mudstone. The Dwyka group, in turn, is underlain by the Waterberg group which is characterised by coarse sandstone and conglomerates and sits unconformably on the basement which is Bushveld Complex in the south-eastern part of the Ellisras basin. Overlying the Ecca are the Beaufort and Stormberg groups. Volksrust formation coals are classified as thick interbedded deposit type while Vryheid formation coals are classified as multiple seam type.
The total thickness of the coal measures is some 120m. The general dip of the strata is 2° to 4° to the south-east across the Waterberg coalfield.
The upper coal or Volksrust formation is represented by interbedded carbonaceous shales and coal. At the Grootegeluk mine, this formation is divided into seven zones and mined in benches named from top to bottom as benches 1 to 5. The vitrinite content in the coal plies towards the top of the Volksrust formation, with a semi-soft coking coal yield. The rest of the Volksrust formation yields varying grades of thermal coal.
The Vryheid formation is locally made up of five distinct coal seams, composed of predominantly dull coal interbedded with minor carbonaceous mudstone and shale. These coal seams are named from bottom upwards from zone 1 through zone 4, with zone 4 being further subdivided into zone 4 seam at the top and zone 4A which is interbedded coal and shale towards the base.
Historical holes in the project area were drilled by Iscor or Exxaro. Current results indicate for zone 4 an average thickness of 2,2m with the seam floor intersected at 324m and, for zone 3, an avarege thickness of 8,7m and seam floor intersected at 343m.
For the Volksrust Formation, coal and non-coal occurring within the same sedimentary cycles (samples) are sampled separately on a centimetre scale, and are respectively composited (coal with coal, and non-coal with non-coal). The coal and non-coal samples for each sedimentary cycle are analysed separately due to their different yield ranges at the different relative density intervals.
For the Vryheid Formation, sampling intervals are not to centimetre detail. Thin non-coal plies present within a coal sample are sampled together with the coal and thin coal plies present within a shale sample are sampled together with the shale.
Samples are submitted to the Bureau Veritas laboratory in Pretoria where the samples are analysed. Quality control procedures are in place to manage the process.

Mineral Resource & Reserve Report 2014 Page 77 of 79
Figure 28: Zonderwater exploration
Seventeem holes were drilled in the general project area to increase points of observation and comply with the prospecting right programme. Results confirmed the previous thickness and quality continuity as outlined above.
Table 18: Zonderwater exploration summary
Project or mining operation
2013 actual 2014 actual 2015 planning*
Boreholes Cost (Rm)
Boreholes Cost (Rm)
Boreholes Cost (Rm)
Number Total Number Total Number Total
Zonderwater None - 17 9,9 7 4,5
13.10.2 MAYOKO PROJECT
Refer to the Mayoko iron ore project under point 11. Exploration.
The project is 3km from Mayoko centre in the north-east Niari department of the Republic of the Congo (RoC), some 300km by road from the city of Dolisie and a further 150km from the port city of Pointe Noire. The area is in a forest ecosystem comprising dense rainforest vegetation, over an undulating landscape incised by a number of streams and rivers. The deposit itself is situated in two small mountains, Mount Lekoumou and Mount Mipoundi. Exxaro has an exploitation permit for iron ore (Mayoko-Lékoumou permit) in the Niari region, granted on 9 August 2013 and valid for 25 years.

Mineral Resource & Reserve Report 2014 Page 78 of 79
Exxaro has two more exploration permits (Ngongo permit (pending) and Ngoubou-Ngoubou permit) adjacent to the exploitation permit. These areas have not yet been explored by Exxaro but are included in future exploration plans for reconnaissance work. Conceptual desktop studies and regional scouting have been conducted at the Ngoubou-Ngoubou permit and Mayoko-Lékoumou permit but results are still being evaluated.
Mineral Resource & Reserve Report 2014 Page 79 of 79
14. ENDORSEMENT
The Exxaro lead mineral resource competent person is Henk Lingenfelder, a member of the Geological Society of South Africa and registered (400038/11) with the South African Council for Natural Scientific Professions. He has a BSc (Hons) in geology and 19 years of experience as an exploration and mining geologist in coal, iron ore and industrial minerals, of which six are specific to coal and iron ore estimation.
The person in Exxaro designated to take corporate responsibility for mineral resources, JH Lingenfelder, the undersigned, has reviewed and endorsed the reported estimates.
JH Lingenfelder BSc geology (Hons) Pr Sci Nat (400038/11) Group manager geoscience Roger Dyason Road Pretoria West 0183
The Exxaro lead competent persons are appointed by the Exxaro executive management team. The Exxaro lead reserve competent person is Johann Hager, a mining engineer registered (20050209) with the Engineering Council of South Africa. He has 25 years of experience as an engineer in iron ore, base metals and coal in various technical and management roles, of which 15 years are specific to coal, base metal and iron ore estimation.
The person in Exxaro designated to take corporate responsibility for ore reserves, J Hager, the undersigned, has reviewed and endorsed the reported estimates.
J Hager MEng mining ECSA 20050209 Group manager mining processes Roger Dyason Road Pretoria West 0183