mind your step report
TRANSCRIPT

The land and water footprints of everyday products
Mind your step

2 Resource use in the supply chain
The land and water footprints of everyday products 3
Executive Summary 4
Introduction 6
The Products 13
A Pair of Boots 14
A Cotton T-Shirt 16
High Demand for Smartphones 18
Tea or Coffee? 22
A Chocolate Bar 24
A Ready Meal 26
Scaling Up 28
The retail clothing sector 30
The smartphone sector 32
The chocolate and confectionary sector 34
The toy and games sector 36
Recommendations 38
Appendix 1 40
Appendix 2 41
References and Notes 42
Table of Contents
Author: Helen BurleyFootprints modelling: TrucostDesign: Claire Bracegirdle, Glynn Perkins and Henry ChownEditing and proofing: Julian Kirby, Henry Chown, Gwen Buck and Chris Gordon-SmithFriends of the Earth Trust registered charity number 281681, company number 1533942. Friends of the Earth Limited company number 1012357. May 2015
4 Resource use in the supply chain
Executive summary
Growing global demand for consumer goods is putting key resources – and our economy – under increasing pressure, yet all too often companies are not fully aware of the true extent of their natural resource demands. This report explores the environmental footprints of everyday products, using a footprinting approach to measure the amount of land and water needed across the product’s supply chain. It argues that this information is crucial both to business and to policy makers in understanding and managing the full extent of our resource use in the face of growing future constraints.
Friends of the Earth commissioned environmental data analysts Trucost to estimate the total land and water footprint of seven generic everyday products: a cotton t-shirt, a smartphone, a cup of tea, a cup of coffee, a chicken curry ready meal, a pair of leather boots, and a chocolate bar. We also asked Trucost to estimate the company and sector footprints for three of the products (t-shirts, chocolate bars and smartphones) and the toy and game sector to gain an insight into the scale of resource demand generated by these products.
The results reveal the intensive resource demands of some products – a single smart phone for example requires 18m2 of land and nearly 13,000 litres (13 tonnes) of water. With a billion smartphones sold worldwide in 2013, the smartphone industry uses a significant amount of water. But the findings also reveal the importance of looking at the different stages of the supply chain. A pair of leather boots requires 50m2 of land and 25,000 litres of water, yet if the waste from the leather tanning process is treated in a waste treatment plant, water demand is reduced to 14,500 litres. How goods are made, how resources are treated, and how they are packaged all make a difference to the overall footprint.
Products that are made from crops, or from animals that are fed on crops (e.g. cotton clothing, leather goods, confectionary etc) tend to depend on access to large quantities of blue and green water (freshwater and rainwater), yet supplies of blue and green water face growing constraints in some parts of the world as a result of climate change. Products that use even tiny quantities of heavy metals and minerals (e.g. smartphones,
electronic devices, LED lights) generate large quantities of pollution, which if not treated efficiently, pollutes water courses. The ‘grey water’ required to safely dilute pollution presents another significant demand on water supplies which may already be stressed. If sufficient grey water is not available, or the pollution load is too high, communities may lose access to clean water, with the pollution posing a risk to agriculture, human health and biodiversity.
Analysis of company and sector level resource use revealed the scale of land and water use needed to drive the global economy.
These estimates are based on publicly available financial data for the individual companies and the sectors they operate in. The actual land and water footprints per unit turnover of these companies will vary according to the different mix of products that they make (e.g. Samsung Electronic makes fridges but Apple doesn’t) and the different resource efficiency policies they employ. Nevertheless these estimates give an indication to company shareholders and directors as to the companies demand for resources, which of course also means its exposure or vulnerability to shortages in and competition for those resources. The estimates are also a valuable signpost to policy-makers as to the implications of the growth in the various sectors of the economy, the vulnerability of society as a whole through its dependence on these sectors, and the sorts of policies (such as more and better reuse and recycling) that should be supported to address these concerns.
An estimate for the land-use for ten of the top clothing retail companies showed that their combined land requirements covered an area almost four times the size of Greater London. In the confectionary sector, market leader Kraft’s estimated land-use extended to an area the size of Belgium, with water-use equivalent to 7 million Olympic-sized swimming pools. Across the confectionary sector as a whole, 95% of the water demand was for green water. In a world undergoing climate change the reliability of previously predictable rainfall may no longer be taken for granted.
Sector-level analysis also revealed the significance
The land and water footprints of everyday products 5
of resource demand for packaging. In the clothing retail sector, 20% of the land and water footprints were attributed to packaging materials, while in the toy sector, packaging accounted for 84% of land-use. Replacing plastic packaging with plant-based materials, such as cardboard and bioplastics, increases the land and water footprints for these products.
This report focuses on the land and water footprints of the products analysed, not the full resource impacts. To obtain a fuller picture, it would be necessary both to use company-specific rather than generic data and to also consider the material resource use and the greenhouse gas footprint. More and more companies are now measuring their greenhouse gas emissions, and some are also measuring water use. But far greater progress is needed in accounting for all four footprints, as well as far greater transparency in revealing the levels of resources companies use.
Friends of the Earth believes there is a limit to what can be achieved through voluntary action and we have been calling for stronger legislation to require large companies to report on the social and environmental impacts of the products they sell, including through the supply chain. Footprints are a valuable tool in delivering this and could provide companies, policy makers and governments with a much better understanding of their resource dependency.
Friends of the Earth and its allies are also calling for the UK Treasury to conduct an assessment of national resource consumption and dependency: a ‘Stern for Resources’. The 2006 Stern report on the economic impacts of climate change concluded that the UK’s long-term economic health was far better served by weighting effort towards avoiding, rather than adapting to, climate change. Investors, manufacturers and other business leaders consistently sound the alarm that rising resource costs and insecurity of supply are real risks to their companies and the UK and global economy. Meanwhile the environmental destruction and related social upheaval caused by unfettered extraction of resources continues unabated. As one of the world’s most import-dependent economies, the UK must now conduct a ‘Stern-for-Resources’, going beyond specific
high risk materials by giving a headline account of consumption, including how much land, water, materials and carbon are used. Doing so would enable policy-makers to develop an effective and evidence-based national resource strategy for resource sufficiency and the protection of the global environment.
The data and analysis on product and company footprints are provided by Trucost. The views expressed in interpreting this data belong to Friends of the Earth. Whilst every care has been taken by Trucost in calculating data, Trucost accepts no liability whatsoever for any loss (including without limitation direct or indirect loss and any loss of profit, data, or economic loss) occasioned to any person nor for any damage, cost, claim or expense arising from any reliance on this report or any of its content.
6 Resource use in the supply chain
How much land and water are needed to keep the global population clothed, fed and watered? And how much more is needed to supply that population with electronic gadgets? As global consumption levels rise, the natural resources that underpin everything that we produce are under increasing pressure – with knock-on effects for the economy.
This report explores the environmental footprints of everyday products, tracing their impacts through the supply chain. While standard economic models examine the financial costs of products, the footprinting approach allows us to assess natural resource costs, from the amount of land, materials and water used, through to the greenhouse gas emissions. This report focuses on the footprints generated by land and water use.
All products, from a cup of tea to a cotton t-shirt, have resource costs and these costs accumulate across the supply chain. The footprint of a t-shirt, for example, includes the resources used to grow and harvest the cotton, turn this into fabric and manufacture into the final garment. Each of these stages requires varying amounts of land, water, material and energy.
Measuring levels of resource use at each stage of the supply chain provides valuable information for companies about the extent of their resource use and shows how efficient their production processes are in resource terms. It can also help identify areas where supply chains might be vulnerable.
Supply chain footprints can also be scaled up, providing policy makers and politicians with a valuable oversight of the overall efficiency of the economy.
To find out more about the environmental impacts of everyday products, Friends of the Earth commissioned environmental data analysts, Trucost, to model the land and water footprints of different items. These included a range of consumer items from food and beverages to clothing and smartphones. The results, based on the modelled outputs, are presented in this report.
What is resource footprinting?
Land and water footprints are two of the four key footprints increasingly being used to measure resource consumption. These four footprints measure land (hectares), material (tonnes), greenhouse gas emissions (carbon dioxide equivalents) and water use (litres) across the supply chain.
The four footprints approach was developed by Friends of the Earth with the Sustainable Europe Research Institute (SERI),1 and can be applied to individual products, to companies, entire sectors or indeed the whole economy. The approach has been adopted by a number of different bodies, including the European Resource Efficiency Platform,2 the European Commission’s Roadmap to a Resource Efficient Europe3, and forthcoming non-binding guidance for companies’ non-financial reporting requirements under the recently revised Accounting Directives4.
This report focuses on land and water – resources that are essential for any manufacturing process, but which are in finite supply and which face increasing demand. The examples presented in this report therefore do not include material or the more widely available greenhouse gas emissions footprints, which would provide equally significant information about a product’s impact on people and the natural world. Nonetheless it important when looking at the footprints of products, companies, economies and so on, to consider all four footprints together. This allows a holistic understanding of the resources required, and can show how they vary against one another when different product designs, business models or economy-level policies are explored.
The data and analysis on product and company footprints are provided by Trucost. The views expressed in interpreting this data belong to Friends of the Earth. Whilst every care has been taken by Trucost in calculating data, Trucost accepts no liability whatsoever for any loss (including without limitation direct or indirect loss and any loss of profit, data, or economic loss) occasioned to any person nor for any damage, cost, claim or expense arising from any reliance on this report or any of its content.
Introduction
The land and water footprints of everyday products 7
How is footprinting useful?
Footprinting allows manufacturers to better understand their dependence on finite natural resources – and to adapt their business models to improve resource efficiency, as evidenced by progress made by companies in cutting greenhouse gas emissions. It also allows policy makers to better understand the relationship between economic activity and natural resource use.
The advantage of footprinting across the range of resources is that it can provide an overview of the whole supply chain, measuring the use of different resources across the manufacturing process. While in some case, companies opt to look at part of their
footprint (e.g. within one country), an overview of the whole supply chain enables manufacturers to better understand their environmental costs and makes it easier to address any risks or constraints that they face.
Similarly an overview allows policy makers to consider the full resource picture, rather than ignoring impacts that happen overseas, or viewing one aspect (such as carbon) in isolation. Taking such a narrow approach often simply displaces the problem, as for example in the case of biofuel production, where attempts to reduce greenhouse gas emissions by substituting fossil fuels with agricultural crops led to rising food prices because the impacts on land use were not considered).
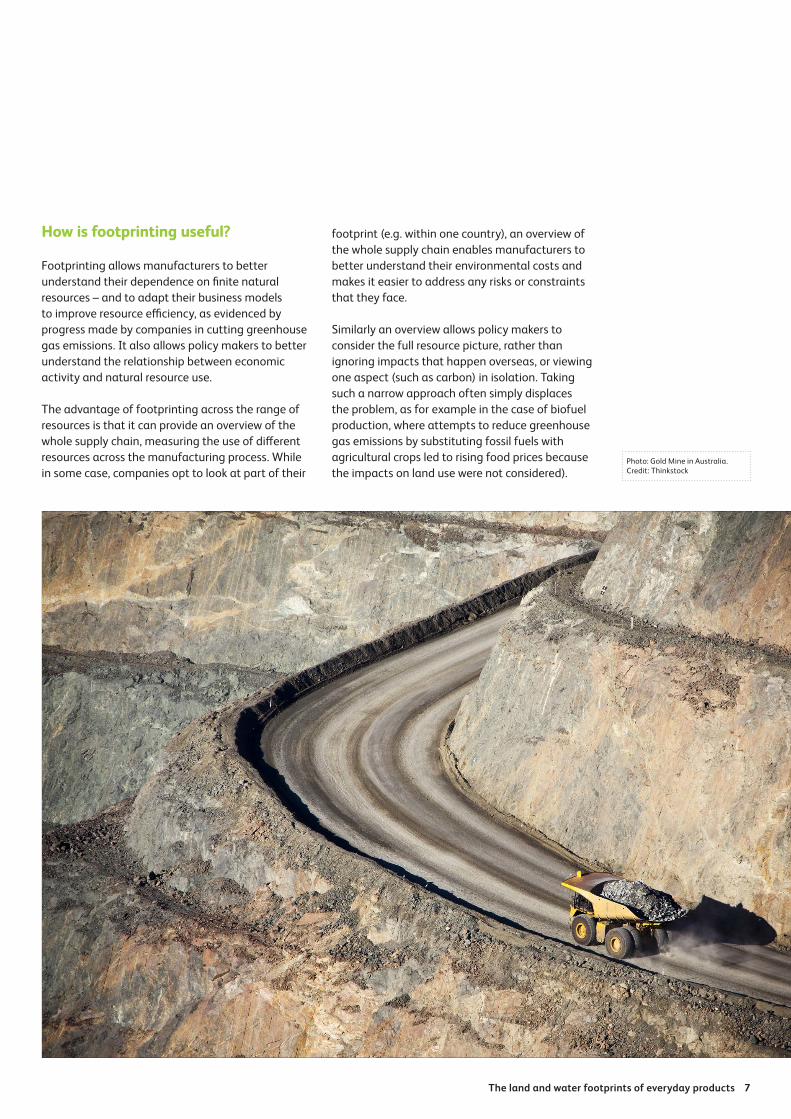
Photo: Gold Mine in Australia. Credit: Thinkstock
8 Resource use in the supply chain
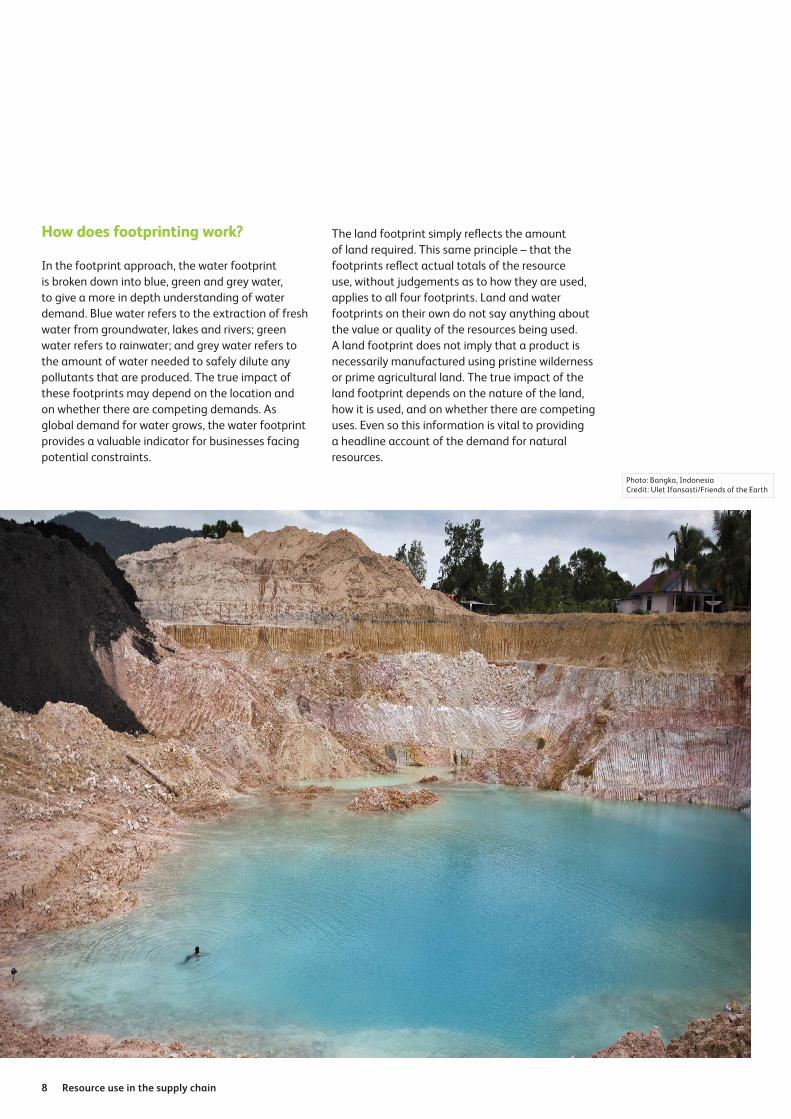
Photo: Bangka, IndonesiaCredit: Ulet Ifansasti/Friends of the Earth
How does footprinting work?
In the footprint approach, the water footprint is broken down into blue, green and grey water, to give a more in depth understanding of water demand. Blue water refers to the extraction of fresh water from groundwater, lakes and rivers; green water refers to rainwater; and grey water refers to the amount of water needed to safely dilute any pollutants that are produced. The true impact of these footprints may depend on the location and on whether there are competing demands. As global demand for water grows, the water footprint provides a valuable indicator for businesses facing potential constraints.
The land footprint simply reflects the amount of land required. This same principle – that the footprints reflect actual totals of the resource use, without judgements as to how they are used, applies to all four footprints. Land and water footprints on their own do not say anything about the value or quality of the resources being used. A land footprint does not imply that a product is necessarily manufactured using pristine wilderness or prime agricultural land. The true impact of the land footprint depends on the nature of the land, how it is used, and on whether there are competing uses. Even so this information is vital to providing a headline account of the demand for natural resources.
The land and water footprints of everyday products 9
The footprint approach does not directly reveal ecological or social impacts, such as child labour or poor working conditions, but it can indicate issues which may cause these problems. A large blue water footprint in an area prone to water shortages is likely to suggest potential problems with other water users who may depend on the same resource for sustaining ecosystems or irrigating farmland. A large grey water footprint suggests there is a high level of pollutants, possibly hazardous chemicals, which are likely to affect the workforce and local environment. A large land footprint may also reveal the potential for conflict with local communities if land is in short supply.
In time sufficiently robust and communicable biodiversity and pollution indicators could be recorded alongside the four footprints’ account of resource use. These should also be accompanied by social indicators including human rights impacts and labour conditions.
What the footprints in this report represent
For this report, the water footprint of products is the total volume of water required to make that product. The units are therefore litres.
For this report the water footprint of companies is the amount of water required to sustain that company’s operations during the financial year 2011-2012, i.e. for one year. If you wanted to extrapolate these estimates so that they gave an estimate of what companies or sectors used annually then the units would be litres per year (l/yr).
For this report, the land footprint of products is the total amount of land required to make that product, even if that land has been used over several years.
For this report the land footprint of companies is the amount of land required to sustain that company’s operations in the financial year 2011/2012. If you wanted to extrapolate these estimates so that they gave an estimate of what companies or sectors used annually then the units would be kilometres squared per year ((k)m2/yr).
The methodology
Friends of the Earth commissioned Trucost to estimate the total land and water footprints of seven generic everyday products: a cotton t-shirt, a smartphone, a cup of tea, a cup of coffee, a chicken curry ready meal, a pair of leather boots, and a chocolate bar. These products were selected because they were all familiar everyday items which illustrated a range of different supply chains stretching out across the globe.
To gain a broader understanding of the scale of the supply chain resource demand, we also asked Trucost to investigate individual company and sector-wide footprints for three of these products (t-shirts, chocolate bars and smartphones) as well as the toy manufacturing sector.
To assess the footprints of these products, Trucost used product lifecycle analysis and their own Environmental Input-Output (EI-O) model to estimate how much land and water was needed to produce a generic t-shirt, smartphone or chicken curry ready meal using sector averages. The EI-O model is based on in-depth profiles of industry sectors which quantify the environmental impacts of business activities. This allowed Trucost to identify “hotspots” within each product’s supply chain where resource use was highest.5
The information on the individual product footprints was then used to estimate company footprints based on the sectors in which they operate and their revenue. Sector level estimates were based on Trucost’s EI-O model using aggregate data from across different sectors. As such, the figures represent only ranges of magnitude. The model was used to identify sector “hotspots” – the activities across the supply chain which generate the most significant environmental impacts.
The footprint models used in this report are estimates and not accurate measures of the footprint of a specific brand product. Trucost’s modelling approach draws on industry data and can therefore be taken as a useful indicator. To obtain a full picture that accurately reflected the changing dynamics of resource use over time, companies would need to provide a detailed breakdown of their supply chains across all four footprints.

10 Resource use in the supply chain
Overview – the footprints
The footprints analysed for this report reveal the importance of the supply chain in assessing the impacts of any product. For almost all of the products analysed, the main impacts of the land and water footprints are found in the early stages of the supply chain and are linked to the raw materials used.
The nature of the components used and their different supply chains determine a product’s footprint and the level of resource use. This is also true when it comes to assessing the footprints of the overall economy. Different types of economies (high tech v agricultural for example) have different footprints and different resource needs.
Products that are sourced from the agricultural sector, including those that come from natural fibres such as leather and cotton, as well as food and drink, tend to have significant requirements for land and for green water. Blue water is also used for irrigating crops, and for some manufacturing processes. High grey water use reflects the quantity of pollutants created by the process.
Out of the products analysed for this report, the largest land and water footprints were for the pair of leather boots. Supply chain analysis shows that almost all of the demand for land (86%) is for the cattle that provide the leather. The water footprint is made up of green water, needed to grow the cattle feed, and grey water used both to deal with the pollutants from cattle farming and during the leather and tanning processes.6
Leather processing requires more water if the waste products are not dealt with in an effluent treatment plant – however the modelling showed that leather had the largest water footprint of all the products, even assuming a treatment plant was used.
While the footprint for leather is large, clearly leather is only one of the products to come from cattle, so it shares the environmental impact of rearing cattle with other products. The market for leather (including bags, shoes, and furniture) is however a factor in determining the economic basis for beef farming and the overall environmental impacts must be taken into account.
Even if the water used to raise the beef is discounted, the water footprint for leather (with no waste treatment) still exceeds the water footprints of the other products. In some parts of the world, such as Bangladesh, tanning plants do not generally use or have access to waste treatment facilities.
Other products also reveal proportionately high demands for land. The land footprint of a smartphone, for example, is significant, with hotspots in the supply chain coming from the raw materials used to manufacture the phone and from packaging. The grey water footprint for the smartphone supply chain is also significant. This reflects pollutants at various stages of the process, but grey water demand is particularly high for component manufacturing and assembly.
The figures here assume maximum permitted pollution levels are not exceeded. In reality many industries around the world regularly and significantly breach local pollution legislation. As the estimate for the leather grey water footprint without water treatment shows, the grey water and therefore total water footprints for other products, companies and sectors are likely to be much higher than the estimates given in this report. The smartphone impacts can be taken as indicative of the wider electronic sector, which includes Smart TVs, DVD players, computers and electronics used in other sectors, such as wind turbines, solar panels and electric cars, all of which use similar technology and manufacturing processing. Given the size and predicted growth of this market, the global imprint of this sector is likely to continue to grow, raising questions about its resource dependence in some parts of the world.
The land and water footprints of everyday products 11
Design matters
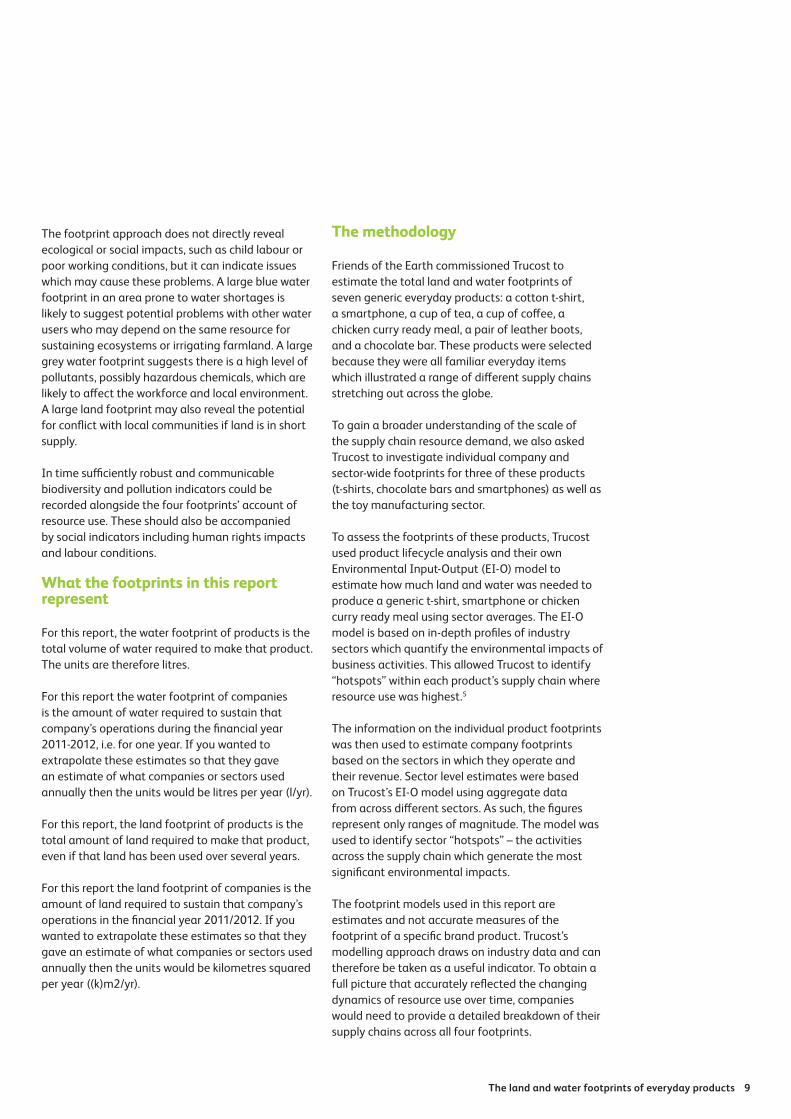
As the different sized footprints for the pair of boots show, how a product is made can make a big difference to its demand for natural resources. The smaller footprint is based on a pair of leather boots made from leather from a tannery that treats its waste water at a modern treatment plant. The larger footprint is for a pair of boots from a tannery where the waste is not treated, polluting local water courses, and having a far more damaging environmental impact.
Figure 1: The water footprint of a pair of leather boots, with and without effluent treatment
Different manufacturing processes affect the size of a product’s footprint, with some manufacturers putting greater emphasis on efficient resource use in their factories. The footprint given for a smartphone reflects the footprint of a generic product, based on the data that is available. Smartphones contain similar components, so this data reflects a typical product, but important variations exist between different brands, and different models. Using real world data would allow brands to calculate far more accurate footprints and identify how and where to reduce their demand for natural resources. Modelling can provide an approximation where data is not available, but companies can gain a far clearer insight into their resource use from data based on their supply chains.
Manufacturing processes and standards also vary from country to country as a result of different regulations and enforcement regimes, with lower standards of enforcement common in poorer countries. Low costs can tempt manufacturers not to ask too many questions about the health and safety standards when they are outsourcing supplies – but Friends of the Earth believes that they do have a responsibility for the products that they sell, and that they should be reporting on their human rights record, alongside resource use reporting.Not treated
25,024L
Treated
14,503L
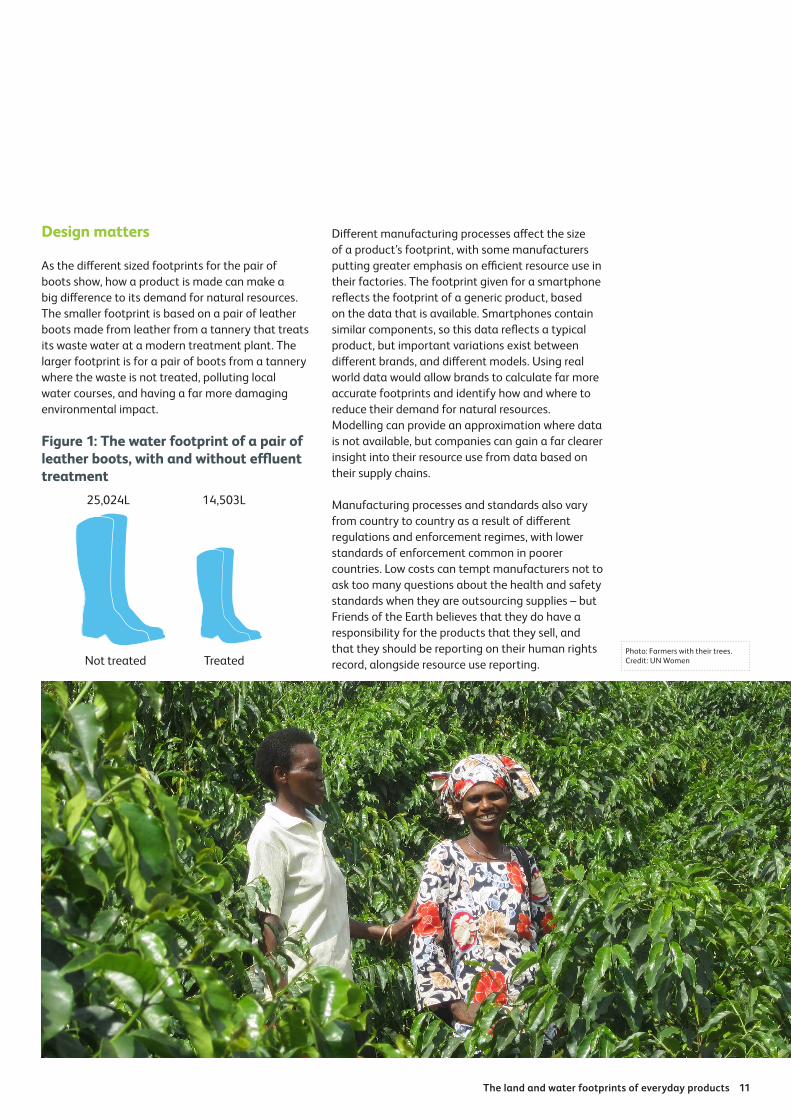
Photo: Farmers with their trees. Credit: UN Women
12 Resource use in the supply chain
Packaging
More than half of the land footprint for a smartphone (55%) can be traced back to demand for materials for packaging – and packaging is also a significant component in the footprint analysis of the toy sector (84% of land).
Packaging often uses paper and pulp (for cardboard), which can come from a variety of sources including trees, plants, and recycled fibre. Softwoods are often used for corrugated boxes and packaging. Industrial logging for timber, pulp and paper industry have devastated vast areas of the world’s rainforests, with companies such as Asia Pulp and Paper and Asia Pacific Resources International Limited (APRIL) responsible for having cleared vast areas in Indonesian rainforest. Pressure from individuals and NGOs has led to efforts to reduce the impacts of the pulp and paper industry on forests,7 but much remains to be done.
Warning signs
A large footprint does not necessarily mean there are problems with a product’s supply chain, but it can point to potential issues for the manufacturer. Demand for both land and water is increasing and can be a source of tension or conflict. A large footprint for grey water use indicates risks from pollution – which as in the case of untreated waste water from the leather tanning process may provide a warning that local water sources are being contaminated. Large demand for land, as for the leather industry, may be putting pressure on forests as cattle farming activities expand. In addition, in a world facing changing climate and weather patterns, green water can no longer be considered a reliable resource.
Companies need to be aware of these risks in their supply chains. Manufacturing depends on access to resources. Wasteful manufacturing processes and over-dependence on key resources can be important issues for companies to address.
On the following pages, we examine the footprints for our selected products and the supply chain stories, exploring some of the real world activities that the data represents.
A ‘Stern for Resources’
Friends of the Earth and its allies are also calling for the UK Treasury to conduct an assessment of national resource consumption and dependency: a ‘Stern for Resources’. The 2006 Stern report on the economic impacts of climate change concluded that the UK’s long-term economic health was far better served by weighting effort towards avoiding, rather than adapting to, climate change. Investors, manufacturers and other business leaders consistently sound the alarm that rising resource costs and insecurity of supply are real risks to their companies and the UK and global economy. Meanwhile the environmental destruction and related social upheaval caused by unfettered extraction of resources continues unabated. As one of the world’s most import-dependent economies, the UK must now conduct a ‘Stern for Resources’, going beyond specific high risk materials by giving a headline account of consumption, including how much land, water, materials and carbon are used. Doing so would enable policy-makers to develop an effective and evidence-based national resource strategy for resource sufficiency and the protection of the global environment.
28L
The land and water footprints of everyday products 13
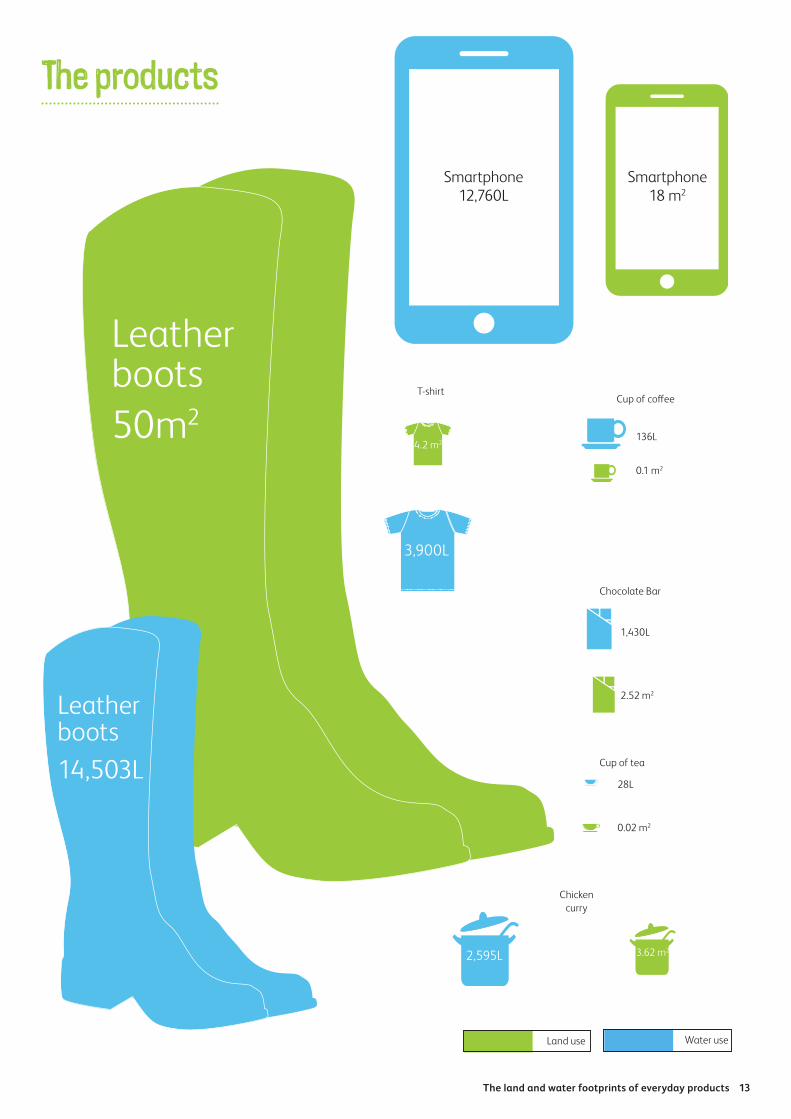
The products
3.62 m2
0.02 m2
0.1 m2
4.2 m2
Smartphone 18 m2
2.52 m2
Chicken curry
Cup of tea
Cup of coffee
Land use Water use
Chocolate Bar
T-shirt
Leather boots50m2
Smartphone 12,760L
Leather boots14,503L
3,900L
2,595L
136L
1,430L
14 Resource use in the supply chain
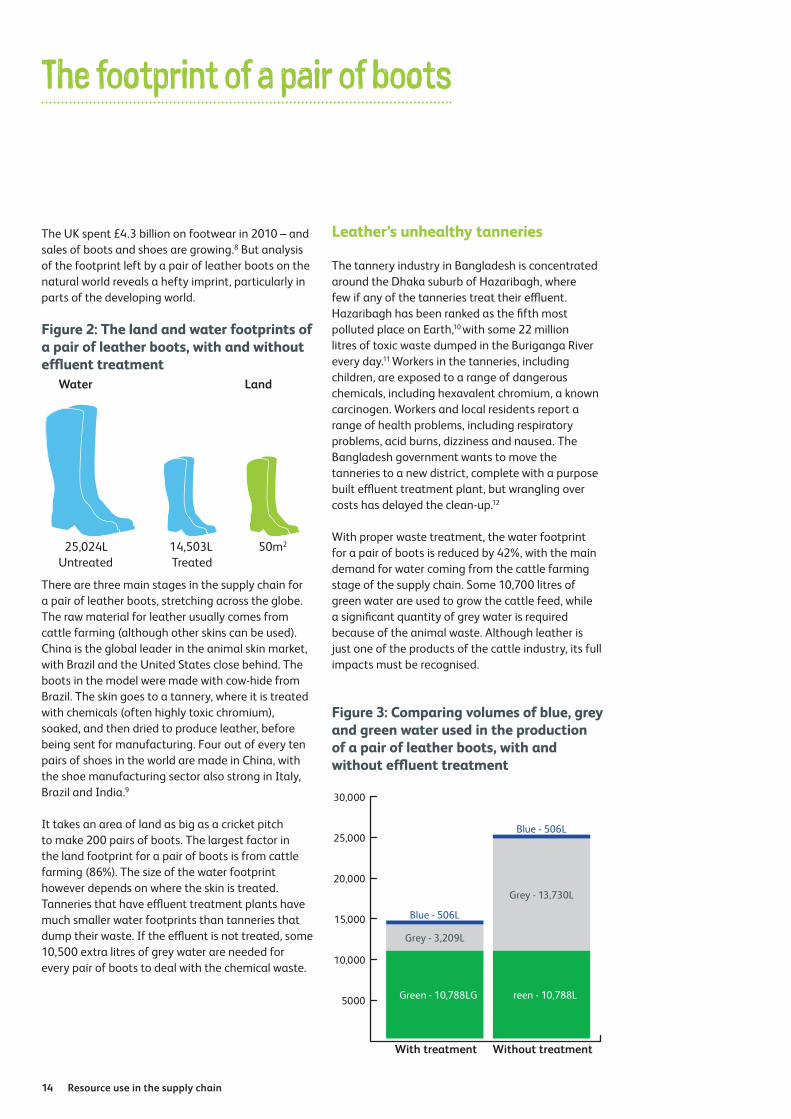
The UK spent £4.3 billion on footwear in 2010 – and sales of boots and shoes are growing.8 But analysis of the footprint left by a pair of leather boots on the natural world reveals a hefty imprint, particularly in parts of the developing world.
Figure 2: The land and water footprints of a pair of leather boots, with and without effluent treatment
There are three main stages in the supply chain for a pair of leather boots, stretching across the globe. The raw material for leather usually comes from cattle farming (although other skins can be used). China is the global leader in the animal skin market, with Brazil and the United States close behind. The boots in the model were made with cow-hide from Brazil. The skin goes to a tannery, where it is treated with chemicals (often highly toxic chromium), soaked, and then dried to produce leather, before being sent for manufacturing. Four out of every ten pairs of shoes in the world are made in China, with the shoe manufacturing sector also strong in Italy, Brazil and India.9
It takes an area of land as big as a cricket pitch to make 200 pairs of boots. The largest factor in the land footprint for a pair of boots is from cattle farming (86%). The size of the water footprint however depends on where the skin is treated. Tanneries that have effluent treatment plants have much smaller water footprints than tanneries that dump their waste. If the effluent is not treated, some 10,500 extra litres of grey water are needed for every pair of boots to deal with the chemical waste.
Leather’s unhealthy tanneries
The tannery industry in Bangladesh is concentrated around the Dhaka suburb of Hazaribagh, where few if any of the tanneries treat their effluent. Hazaribagh has been ranked as the fifth most polluted place on Earth,10 with some 22 million litres of toxic waste dumped in the Buriganga River every day.11 Workers in the tanneries, including children, are exposed to a range of dangerous chemicals, including hexavalent chromium, a known carcinogen. Workers and local residents report a range of health problems, including respiratory problems, acid burns, dizziness and nausea. The Bangladesh government wants to move the tanneries to a new district, complete with a purpose built effluent treatment plant, but wrangling over costs has delayed the clean-up.12
With proper waste treatment, the water footprint for a pair of boots is reduced by 42%, with the main demand for water coming from the cattle farming stage of the supply chain. Some 10,700 litres of green water are used to grow the cattle feed, while a significant quantity of grey water is required because of the animal waste. Although leather is just one of the products of the cattle industry, its full impacts must be recognised.
Figure 3: Comparing volumes of blue, grey and green water used in the production of a pair of leather boots, with and without effluent treatment
The footprint of a pair of boots
Treated14,503L
Water
Untreated25,024L
Land
50m2
Blue - 506L
Blue - 506L
5000
10,000
15,000
20,000
25,000
30,000
Grey - 3,209L
Green - 10,788LG reen - 10,788L
Grey - 13,730L
With treatment Without treatment

The land and water footprints of everyday products 15
Figure 4: Distribution of land and water use across the supply chain for a pair of leather boots, with waste treatment
Other 2%
Agriculture 28%
Power generation and supply
27%
All other raw material 18%
Leather tanning and finishing 4%
Packaging 6%
Chemical products manufacturing 6%
Blue water
Assumptions
The model assumed that a pair of boots required 0.46m2 of leather, including losses from offcuts, and that an average cow produces 6.1kg of leather, with 117 cattle per km2 in a mixed system and 67 animals per km2 in a grazing system (FAO data). Lifecycle analysis data and Trucost’s EI-O model were used to estimate the footprints.
Grey water
Cattle ranching
89%Other 4%
Green water
Agriculture100%
Other2%
Land use
Cattle ranching
86%
All other raw material7%
Agriculture5%
Overall water
Agriculture76%
Cattleranching20%
Other 11%
Miscellaneous manufacturing9%

16 Resource use in the supply chain
The cotton t-shirt
The global t-shirt industry is estimated to be worth more than US$2 billion,13 and represents just a fraction of the increasingly globalised clothing industry, estimated to be worth around $1,249.3bn in 2012.14 But how much land and water are needed to manufacture a generic cotton t-shirt?
Figure 5: The land and water footprints of a cotton t-shirt
This is based on the land and water used to manufacture the cotton including farming the cotton, bleaching, dyeing and printing the fabric, and manufacturing the garment.
Cotton farming is the most resource intensive part of the production process, accounting for 65% of the overall land footprint, and 68% of the total water use. On average, over 9,900 litres of water are needed to grow enough cotton seed for 1 tonne of cotton textile - the equivalent of more than 120 baths of water.15 Almost one third of the overall water use is blue water, used to irrigate the cotton crop.
The United States, India and China are the main producers of cotton globally, with the United States, India and Uzbekistan the largest exporters.16 Irrigated cotton is water intensive and cotton is estimated to consume 3% of the total water footprint for crop production globally.17 Cotton farming in Uzbekistan has almost completely drained the Aral Sea which has shrunk to 10 percent of its former volume.18
Grey water demand at the cotton farming stage is due to the nitrogen that leaches into the groundwater from the use of fertilizer and pesticides, and demand is also high at the processing stage because of the pollutants from bleaching, dyeing and printing the fabric. In places
where waste is not treated, the grey water footprint would be even higher.
Fabric’s toxic footprint
Before cotton can be dyed, it is bleached which, depending on the chemicals used, produces dioxins, which are persistent environmental pollutants that have been linked to cancers and are known to cause reproductive and developmental problems.19 Coloured dyes are fixed using compounds which usually include heavy metals such as cadmium, lead and mercury.20 These toxic pollutants are found in waste water from textile factories, which in some parts of the world may be released directly into rivers without treatment. Even where water treatment plants are used, some of the pollutants are difficult to remove and so remain.21 Water pollution from industry poses a threat to biodiversity and to drinking water supplies.
Figure 6: Volumes of Blue, Grey and Green water in the supply chain of a cotton T-shirt
Land
4.2m2
Water
3,900L
0
500
1000
1500
2000
2500
3000
3500
4000
Green - 2000L
Grey - 800L
Blue - 1,100L
The land and water footprints of everyday products 17
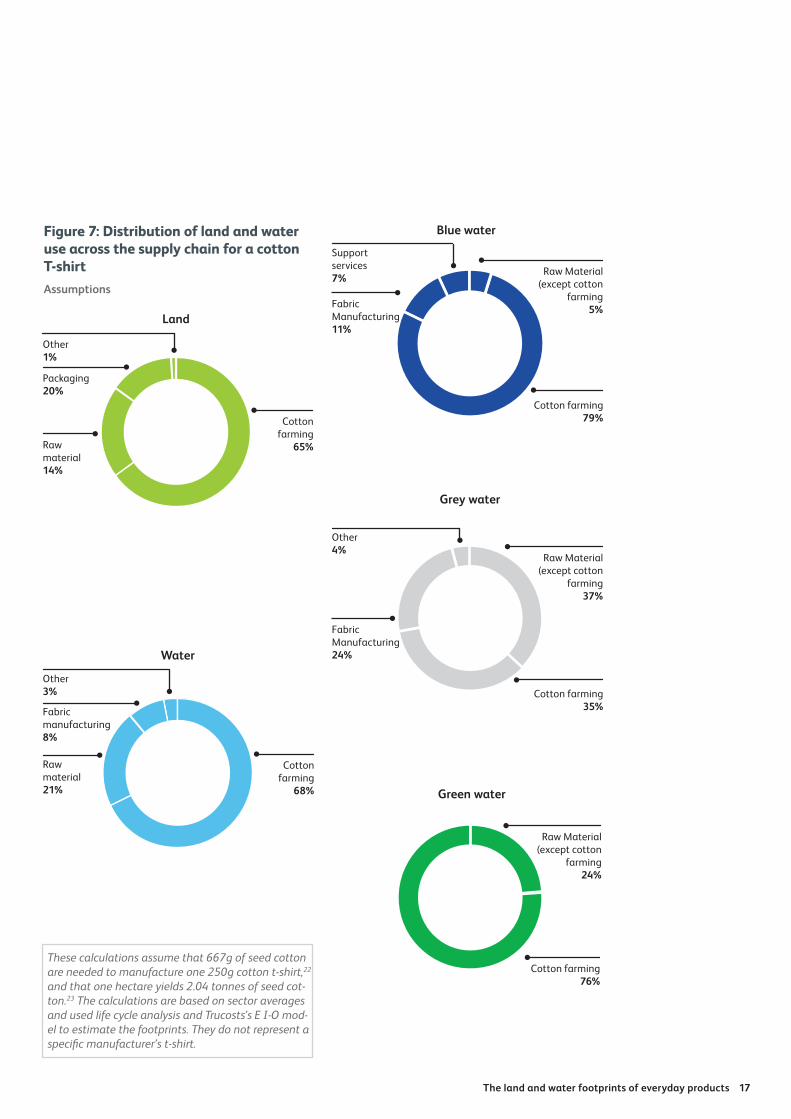
Land
Other 1%
Packaging20%
Raw material 14%
Cotton farming
65%
Water
Other 3%
Raw material21%
Fabric manufacturing8%
Cotton farming
68%
These calculations assume that 667g of seed cotton are needed to manufacture one 250g cotton t-shirt,22 and that one hectare yields 2.04 tonnes of seed cot-ton.23 The calculations are based on sector averages and used life cycle analysis and Trucosts’s E I-O mod-el to estimate the footprints. They do not represent a specific manufacturer’s t-shirt.
Blue water
Grey water
Green water
Raw Material (except cotton
farming5%
Cotton farming79%
FabricManufacturing11%
Support services7%
Raw Material (except cotton
farming37%
Cotton farming35%
FabricManufacturing24%
Other4%
Raw Material (except cotton
farming24%
Cotton farming76%
Figure 7: Distribution of land and water use across the supply chain for a cotton T-shirtAssumptions
18 Resource use in the supply chain
High demand for smartphones
The global market for smartphones is growing fast, with more than one billion handsets produced in 2013.24 The smartphone has revolutionised the way many of us live our lives, but these tiny pocket computers require raw materials extracted from across the globe and the manufacturing process has a significant footprint as well.
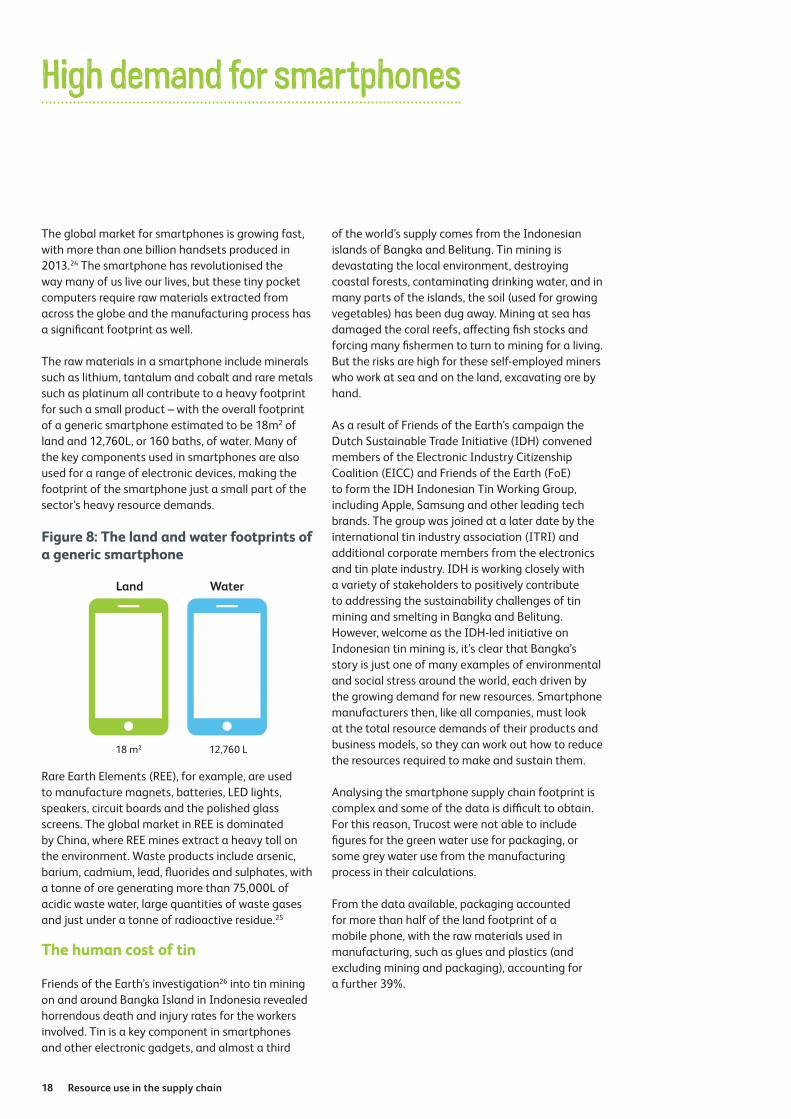
The raw materials in a smartphone include minerals such as lithium, tantalum and cobalt and rare metals such as platinum all contribute to a heavy footprint for such a small product – with the overall footprint of a generic smartphone estimated to be 18m2 of land and 12,760L, or 160 baths, of water. Many of the key components used in smartphones are also used for a range of electronic devices, making the footprint of the smartphone just a small part of the sector’s heavy resource demands.
Figure 8: The land and water footprints of a generic smartphone
Rare Earth Elements (REE), for example, are used to manufacture magnets, batteries, LED lights, speakers, circuit boards and the polished glass screens. The global market in REE is dominated by China, where REE mines extract a heavy toll on the environment. Waste products include arsenic, barium, cadmium, lead, fluorides and sulphates, with a tonne of ore generating more than 75,000L of acidic waste water, large quantities of waste gases and just under a tonne of radioactive residue.25
The human cost of tin
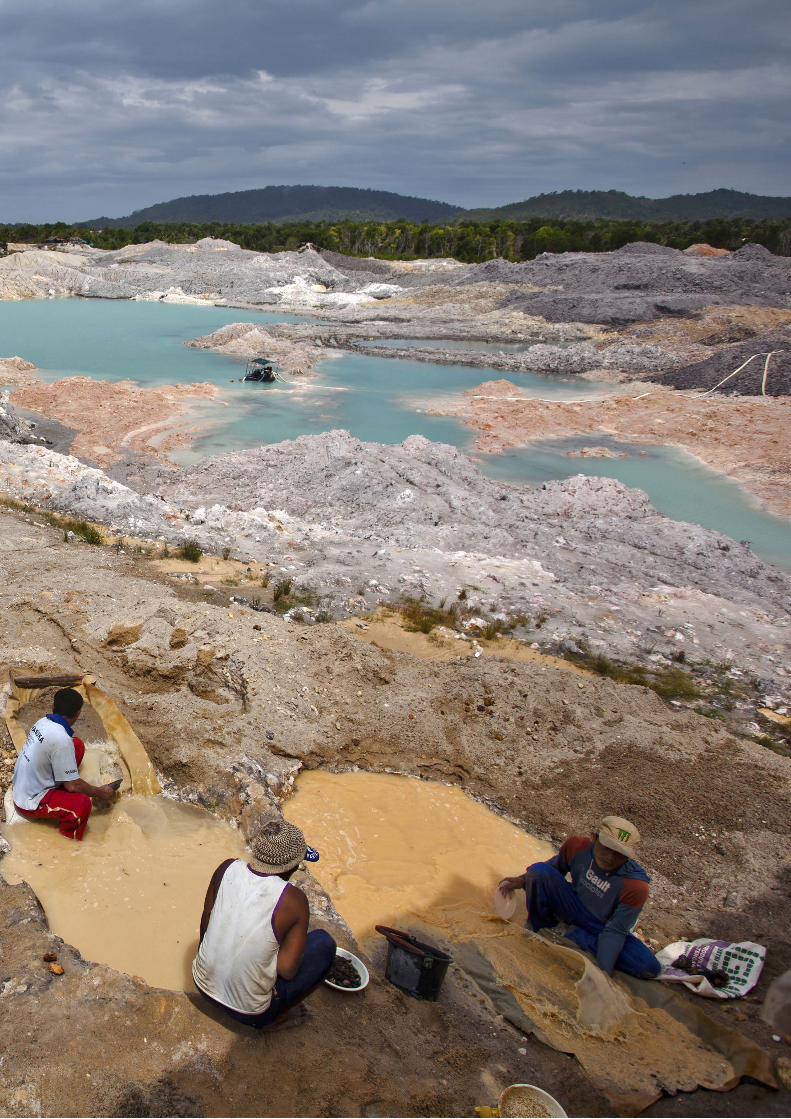
Friends of the Earth’s investigation26 into tin mining on and around Bangka Island in Indonesia revealed horrendous death and injury rates for the workers involved. Tin is a key component in smartphones and other electronic gadgets, and almost a third
of the world’s supply comes from the Indonesian islands of Bangka and Belitung. Tin mining is devastating the local environment, destroying coastal forests, contaminating drinking water, and in many parts of the islands, the soil (used for growing vegetables) has been dug away. Mining at sea has damaged the coral reefs, affecting fish stocks and forcing many fishermen to turn to mining for a living. But the risks are high for these self-employed miners who work at sea and on the land, excavating ore by hand.
As a result of Friends of the Earth’s campaign the Dutch Sustainable Trade Initiative (IDH) convened members of the Electronic Industry Citizenship Coalition (EICC) and Friends of the Earth (FoE) to form the IDH Indonesian Tin Working Group, including Apple, Samsung and other leading tech brands. The group was joined at a later date by the international tin industry association (ITRI) and additional corporate members from the electronics and tin plate industry. IDH is working closely with a variety of stakeholders to positively contribute to addressing the sustainability challenges of tin mining and smelting in Bangka and Belitung. However, welcome as the IDH-led initiative on Indonesian tin mining is, it’s clear that Bangka’s story is just one of many examples of environmental and social stress around the world, each driven by the growing demand for new resources. Smartphone manufacturers then, like all companies, must look at the total resource demands of their products and business models, so they can work out how to reduce the resources required to make and sustain them.
Analysing the smartphone supply chain footprint is complex and some of the data is difficult to obtain. For this reason, Trucost were not able to include figures for the green water use for packaging, or some grey water use from the manufacturing process in their calculations.
From the data available, packaging accounted for more than half of the land footprint of a mobile phone, with the raw materials used in manufacturing, such as glues and plastics (and excluding mining and packaging), accounting for a further 39%.
18 m2
Land
12,760 L
Water

The land and water footprints of everyday products 19
Worked to death?
Smartphone and other electronic device manufacturing is usually outsourced to factories in China, the Philippines, Singapore and Taiwan, where there have been numerous allegations of poor working conditions, use of child labour, and abuse of workers. iPhone manufacturer Apple claims to audit its suppliers, but has faced allegations of poor working conditions, with reports of worker suicides at Chinese factories run by the Foxconn Technology Group.27 In 2013, the audit report found evidence of excessive working hours, failure to protect juvenile workers and discriminatory practices. Apple asks suppliers to comply with a maximum of 60 working hours a week.28 In late 2012, Apple announced it was moving some of its manufacturing to the United States, although much of the production still remains overseas.29
Analysis of the water footprint showed that manufacturing of the components and assembly accounted for the largest sector of overall water use (40%) with grey water, used to dilute pollutants, accounting for almost all (95%) of this. This can be attributed to the chemicals in the glues and lubricants used in the manufacturing of the component parts, stretching back through the supply chain.
Land
Other 1%
Packaging 55%
Mining 5%
Raw material 39%
AssumptionsThe analysis of the land and water footprint of a generic smartphone assumed average com-pany sales of 63 million smartphones a year, an average market price of US$351, and that typical packaging contains an average of 50% recycled content. Truprint’s E I-O model was used to estimate the generic footprints, with publicly-available information used to estimate global sales of the top ten companies. Additional information made it possible to refine the calculations for the company level.
Figure 9: Distribution of land and water use across the supply chain for a generic smartphone
Overall water
Computer and electronic product manufacturing 14%
Final manufact-uring and assembly
40%Raw materials including Mining and Packaging 40%
Other 6%
0
3,000
6,000
9,000
12,000
15,000
Green - 3,720L
Grey - 7,590L
Blue - 1,460L
Raw materials including Mining
and Packaging 100%
Raw materials including Mining
and Packaging 35%
Raw materials including Mining
and Packaging 11%
Computer and electronic product
manufacturing 6%
Blue water
Grey water
Green water
Computer and electronic
product manufacturing
22%
Final manufact-uring and assembly 63%
Other 4%
Final manufacturing and assembly 18%
Power generation7%
Other 4%
Metalmanufacturing 19%
Chemicalmanufacturing 11%
Figure 10: Volumes of Blue, Grey and Green water in the supply chain of a generic smartphone

Miners sift through sand looking for tin ore at a mine in Tanjung Pesona, District Sungai Liat, Bangka, Indonesia.
Mining on the island is dominated by state-owned PT Timah which runs the world’s largest tin smelting operation, processing 50,000 tonnes of tin a year.
22 Resource use in the supply chain
Tea or coffee?
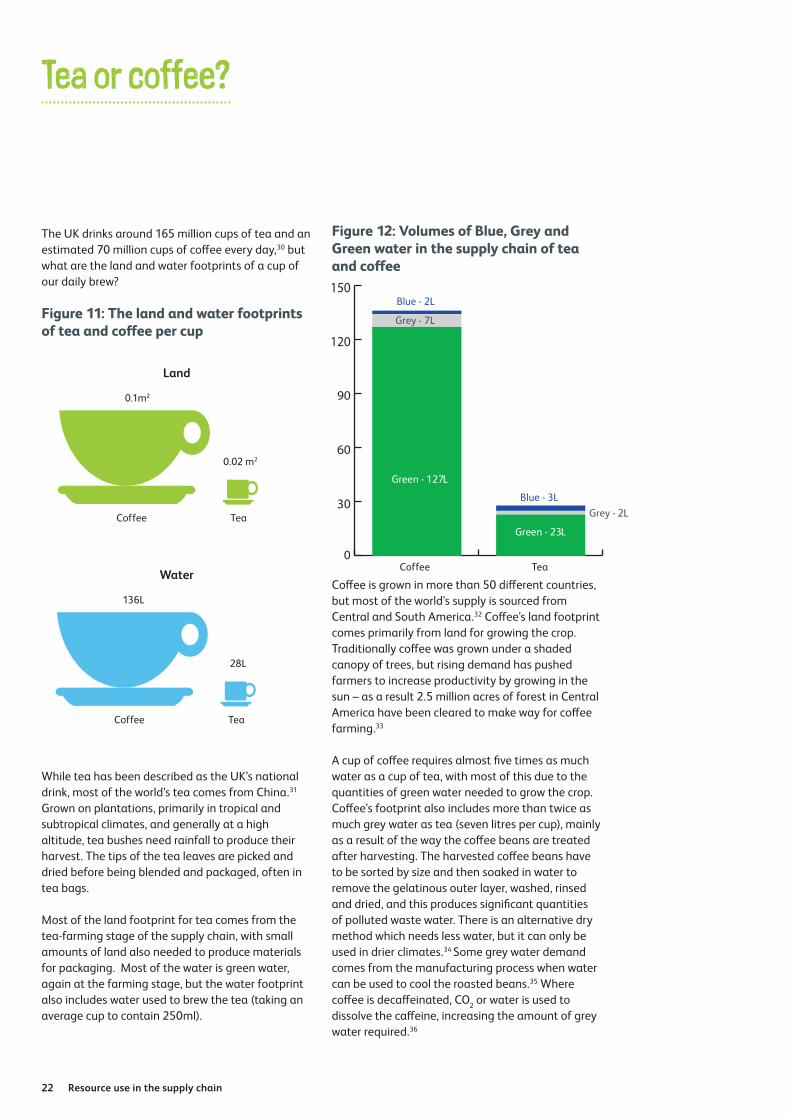
The UK drinks around 165 million cups of tea and an estimated 70 million cups of coffee every day,30 but what are the land and water footprints of a cup of our daily brew?
Figure 11: The land and water footprints of tea and coffee per cup
While tea has been described as the UK’s national drink, most of the world’s tea comes from China.31 Grown on plantations, primarily in tropical and subtropical climates, and generally at a high altitude, tea bushes need rainfall to produce their harvest. The tips of the tea leaves are picked and dried before being blended and packaged, often in tea bags.
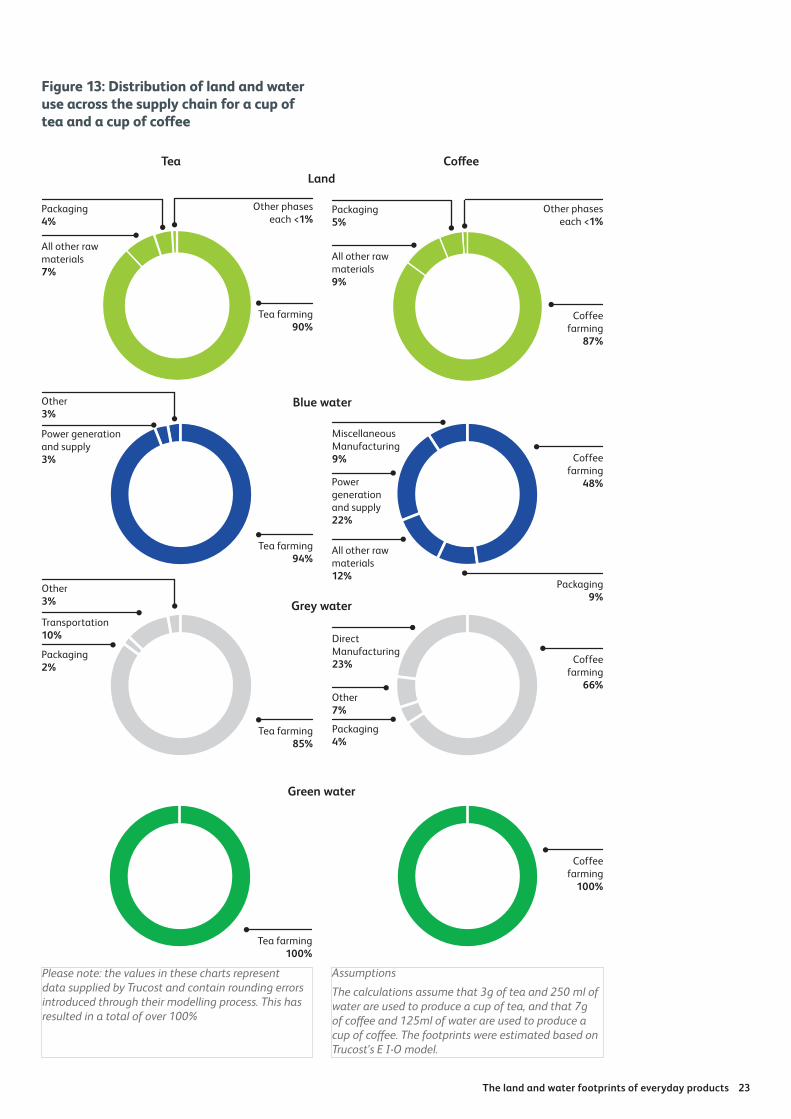
Most of the land footprint for tea comes from the tea-farming stage of the supply chain, with small amounts of land also needed to produce materials for packaging. Most of the water is green water, again at the farming stage, but the water footprint also includes water used to brew the tea (taking an average cup to contain 250ml).
Figure 12: Volumes of Blue, Grey and Green water in the supply chain of tea and coffee
Coffee is grown in more than 50 different countries, but most of the world’s supply is sourced from Central and South America.32 Coffee’s land footprint comes primarily from land for growing the crop. Traditionally coffee was grown under a shaded canopy of trees, but rising demand has pushed farmers to increase productivity by growing in the sun – as a result 2.5 million acres of forest in Central America have been cleared to make way for coffee farming.33
A cup of coffee requires almost five times as much water as a cup of tea, with most of this due to the quantities of green water needed to grow the crop. Coffee’s footprint also includes more than twice as much grey water as tea (seven litres per cup), mainly as a result of the way the coffee beans are treated after harvesting. The harvested coffee beans have to be sorted by size and then soaked in water to remove the gelatinous outer layer, washed, rinsed and dried, and this produces significant quantities of polluted waste water. There is an alternative dry method which needs less water, but it can only be used in drier climates.34 Some grey water demand comes from the manufacturing process when water can be used to cool the roasted beans.35 Where coffee is decaffeinated, CO2 or water is used to dissolve the caffeine, increasing the amount of grey water required.36
0.02 m2
TeaCoffee
0.1m2
Land
28L
TeaCoffee
136L
Water 0
30
60
90
120
150
Grey - 7L
Blue - 2L
Green - 127L
Green - 23L
Grey - 2LBlue - 3L
TeaCoffee
The land and water footprints of everyday products 23
Tea farming90%
All other raw materials 7%
Packaging 4%
Tea
Other phaseseach <1%
Coffee farming
87%
Packaging 5%
All other raw materials 9%
Coffee
Please note: the values in these charts represent data supplied by Trucost and contain rounding errors introduced through their modelling process. This has resulted in a total of over 100%
AssumptionsThe calculations assume that 3g of tea and 250 ml of water are used to produce a cup of tea, and that 7g of coffee and 125ml of water are used to produce a cup of coffee. The footprints were estimated based on Trucost’s E I-O model.
Other 3%
Power generation and supply3%
Other phaseseach <1%
Blue water
Grey water
Green water
Land
Tea farming94%
Tea farming100%
Tea farming85%
Packaging 2%
Transportation 10%
Other 3%
Coffee farming
48%
Coffee farming
66%
Coffee farming
100%
Packaging 9%
All other raw materials 12%
Power generation and supply22%
Miscellaneous Manufacturing 9%
Packaging 4%
Other 7%
Direct Manufacturing 23%
Figure 13: Distribution of land and water use across the supply chain for a cup of tea and a cup of coffee
24 Resource use in the supply chain
The footprint of a chocolate bar
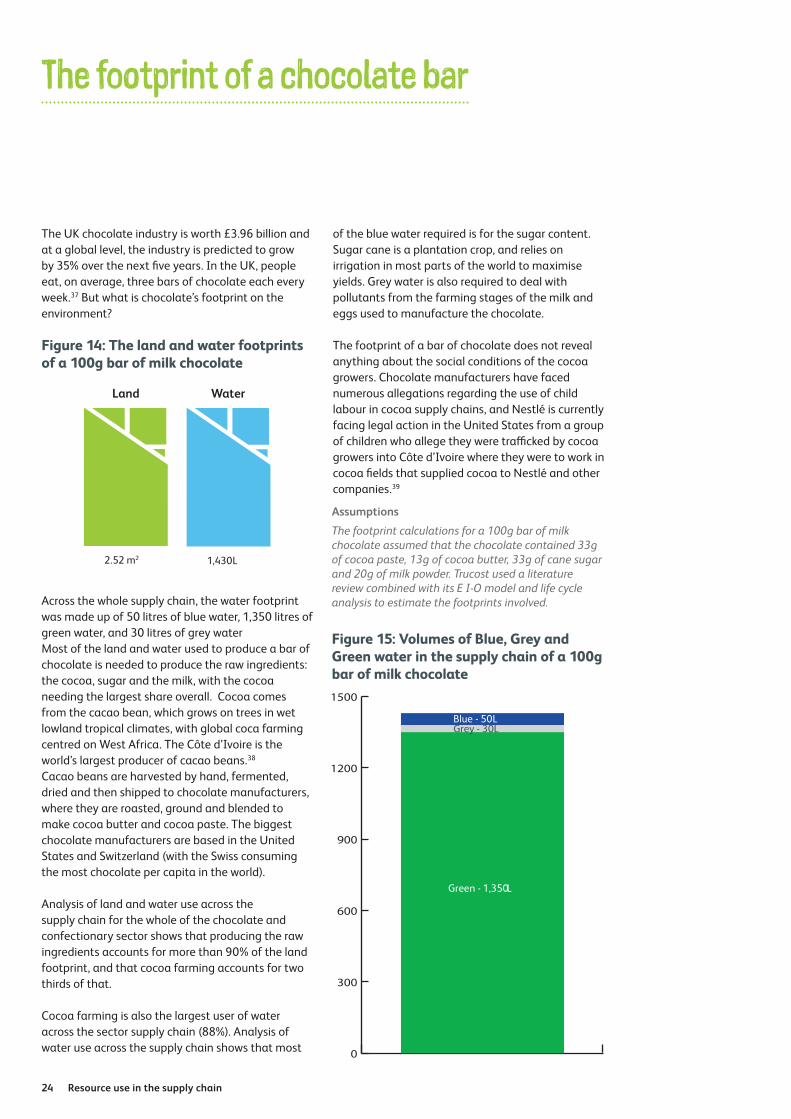
The UK chocolate industry is worth £3.96 billion and at a global level, the industry is predicted to grow by 35% over the next five years. In the UK, people eat, on average, three bars of chocolate each every week.37 But what is chocolate’s footprint on the environment?
Figure 14: The land and water footprints of a 100g bar of milk chocolate
Across the whole supply chain, the water footprint was made up of 50 litres of blue water, 1,350 litres of green water, and 30 litres of grey waterMost of the land and water used to produce a bar of chocolate is needed to produce the raw ingredients: the cocoa, sugar and the milk, with the cocoa needing the largest share overall. Cocoa comes from the cacao bean, which grows on trees in wet lowland tropical climates, with global coca farming centred on West Africa. The Côte d’Ivoire is the world’s largest producer of cacao beans.38
Cacao beans are harvested by hand, fermented, dried and then shipped to chocolate manufacturers, where they are roasted, ground and blended to make cocoa butter and cocoa paste. The biggest chocolate manufacturers are based in the United States and Switzerland (with the Swiss consuming the most chocolate per capita in the world).
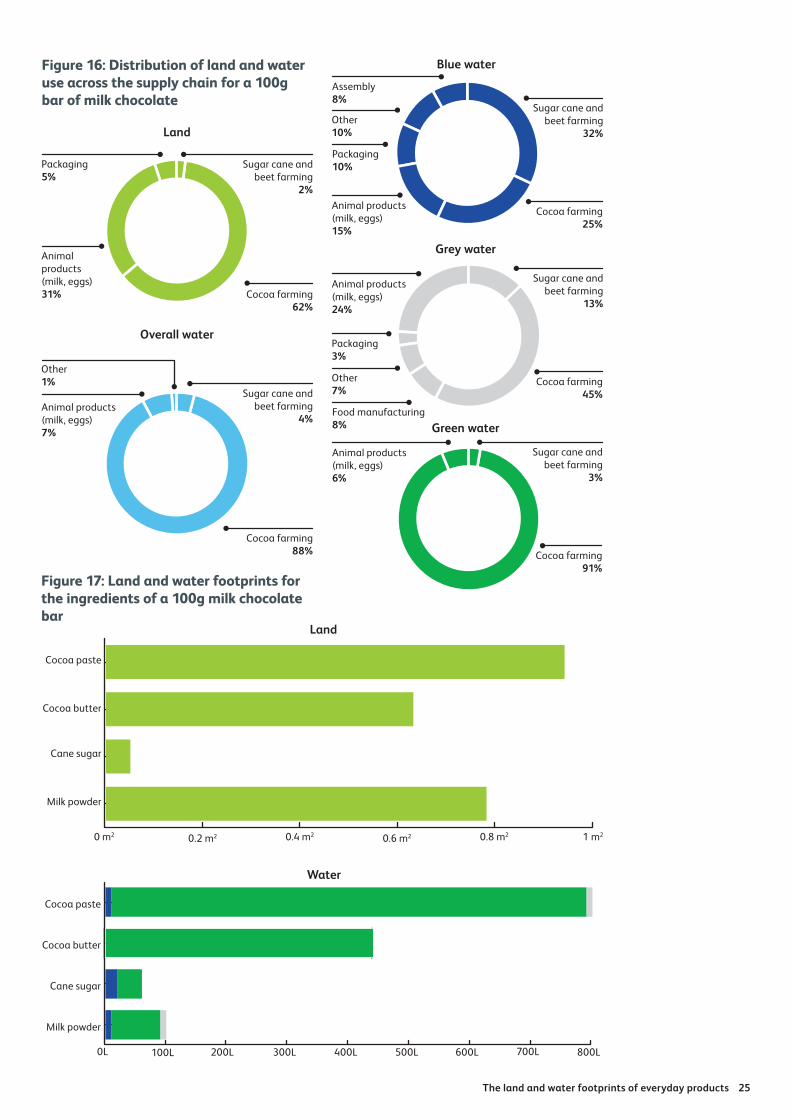
Analysis of land and water use across the supply chain for the whole of the chocolate and confectionary sector shows that producing the raw ingredients accounts for more than 90% of the land footprint, and that cocoa farming accounts for two thirds of that.
Cocoa farming is also the largest user of water across the sector supply chain (88%). Analysis of water use across the supply chain shows that most
2.52 m2
Land
1,430L
Water
of the blue water required is for the sugar content. Sugar cane is a plantation crop, and relies on irrigation in most parts of the world to maximise yields. Grey water is also required to deal with pollutants from the farming stages of the milk and eggs used to manufacture the chocolate.
The footprint of a bar of chocolate does not reveal anything about the social conditions of the cocoa growers. Chocolate manufacturers have faced numerous allegations regarding the use of child labour in cocoa supply chains, and Nestlé is currently facing legal action in the United States from a group of children who allege they were trafficked by cocoa growers into Côte d’Ivoire where they were to work in cocoa fields that supplied cocoa to Nestlé and other companies.39
AssumptionsThe footprint calculations for a 100g bar of milk chocolate assumed that the chocolate contained 33g of cocoa paste, 13g of cocoa butter, 33g of cane sugar and 20g of milk powder. Trucost used a literature review combined with its E I-O model and life cycle analysis to estimate the footprints involved.
Figure 15: Volumes of Blue, Grey and Green water in the supply chain of a 100g bar of milk chocolate
0
300
600
900
1200
1500
Green - 1,350L
Grey - 30LBlue - 50L
The land and water footprints of everyday products 25
0 m2 0.2 m2 0.4 m2 0.6 m2 0.8 m2 1 m2
Cocoa paste
Milk powder
Cane sugar
Cocoa butter
Land
0L 100L 200L 300L 400L 500L 600L 700L 800L
Cocoa paste
Milk powder
Cane sugar
Cocoa butter
Water
Figure 17: Land and water footprints for the ingredients of a 100g milk chocolate bar
Land
Overall water
Sugar cane and beet farming
2%
Cocoa farming62%
Animal products (milk, eggs) 31%
Packaging5%
Sugar cane and beet farming
4%
Cocoa farming 88%
Animal products (milk, eggs) 7%
Other 1%
Sugar cane and beet farming
32%
Cocoa farming 25%
Animal products (milk, eggs) 15%
Packaging 10%
Other 10%
Assembly 8%
Blue water
Grey water
Green water
Sugar cane and beet farming
13%
Cocoa farming 45%
Sugar cane and beet farming
3%
Cocoa farming 91%
Animal products (milk, eggs) 6%
Animal products (milk, eggs) 24%
Food manufacturing 8%
Other 7%
Packaging 3%
Figure 16: Distribution of land and water use across the supply chain for a 100g bar of milk chocolate
26 Resource use in the supply chain
The footprint of a ready meal
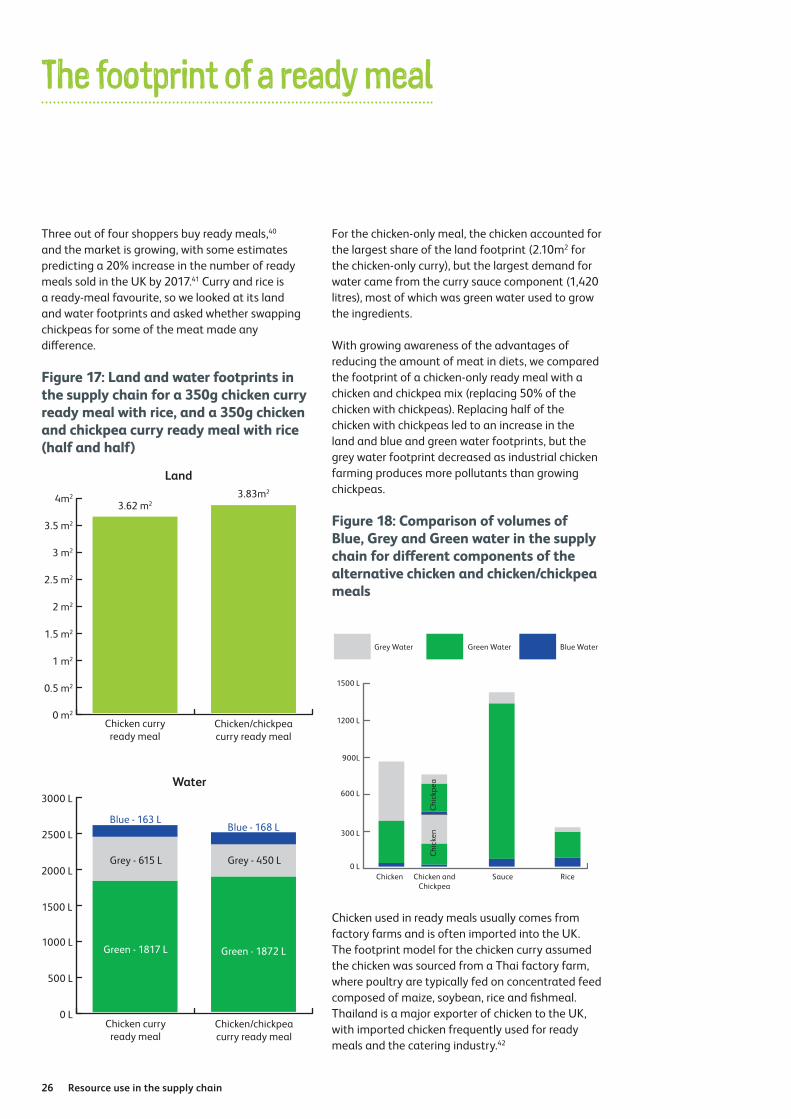
Three out of four shoppers buy ready meals,40
and the market is growing, with some estimates predicting a 20% increase in the number of ready meals sold in the UK by 2017.41 Curry and rice is a ready-meal favourite, so we looked at its land and water footprints and asked whether swapping chickpeas for some of the meat made any difference.
Figure 17: Land and water footprints in the supply chain for a 350g chicken curry ready meal with rice, and a 350g chicken and chickpea curry ready meal with rice (half and half)
For the chicken-only meal, the chicken accounted for the largest share of the land footprint (2.10m2 for the chicken-only curry), but the largest demand for water came from the curry sauce component (1,420 litres), most of which was green water used to grow the ingredients.
With growing awareness of the advantages of reducing the amount of meat in diets, we compared the footprint of a chicken-only ready meal with a chicken and chickpea mix (replacing 50% of the chicken with chickpeas). Replacing half of the chicken with chickpeas led to an increase in the land and blue and green water footprints, but the grey water footprint decreased as industrial chicken farming produces more pollutants than growing chickpeas.
Figure 18: Comparison of volumes of Blue, Grey and Green water in the supply chain for different components of the alternative chicken and chicken/chickpea meals
Chicken used in ready meals usually comes from factory farms and is often imported into the UK. The footprint model for the chicken curry assumed the chicken was sourced from a Thai factory farm, where poultry are typically fed on concentrated feed composed of maize, soybean, rice and fishmeal. Thailand is a major exporter of chicken to the UK, with imported chicken frequently used for ready meals and the catering industry.42
Land
4m2
3.5 m2
3 m2
2.5 m2
2 m2
1.5 m2
1 m2
0.5 m2
0 m2
Chicken curry ready meal
Chicken/chickpea curry ready meal
3.62 m23.83m2
3000 L
2500 L
2000 L
1500 L
1000 L
500 L
0 L Chicken curry ready meal
Chicken/chickpea curry ready meal
Blue - 163 L
Green - 1817 L
Grey - 615 L Grey - 450 L
Blue - 168 L
Green - 1872 L
Water
Grey Water Green Water Blue Water
Chicken and Chickpea
Sauce Rice
Chic
ken
Chic
kpea
Chicken
1500 L
1200 L
900L
600 L
300 L
0 L

The land and water footprints of everyday products 27
Factory farms
Broiler chickens raised in intensive (factory) farms are selectively bred to put on weight and fed a special diet, with many birds slaughtered for meat after around 40 days.43 The Thai chicken industry specialises in the export of boneless chicken, and vertically integrated commercial farms account for some 70% of poultry production. An average Thai poultry farm has some 37,000 birds.44 Welfare conditions for the chickens are reported to be better than on similar UK farms, with 13 birds per square metre, slower growing breeds, and longer periods of darkness45 allowing birds to rest, although birds do not have the freedom to roam offered by free range farms.
Concerns have been raised about the conditions of workers in the poultry industry, with high levels of injury and safety concerns.46 Cases of trafficked labour and debt bondage have been reported in the UK industry.47
While the carbon footprint of the chicken curry was not included in this model, other studies suggest that the carbon footprint from a chicken-only curry would be far higher than for a chicken and chickpea meal. 48
Higher welfare standards, or the use of free-range or organic chickens may increase the footprint of a chicken curry because of the need for more land as the birds move about more needing more energy – showing that increased resource use can in some situations reflect higher ethical standards. Innovative use of by-products and safe food waste as feed could reduce this impact. Animal welfare standards are not reflected in the footprint approach. Reducing consumption to accommodate higher standards as well as reducing resource use is another solution. Analysis of the supply chain for each of the components of the chicken curry meal showed that by far the largest share of the land footprint was due to the land needed for farming.
Land use chicken
Farming 93%
Other 7%
Land use chickpeas
Other 2%
Farming 98%
AssumptionsThe footprint for the chicken curry meal assumed that a 350g meal contained 147g of chicken, 203g of sauce plus 100g of rice added, and 73.5g of chicken and 73.5g of chickpeas in the 50% chickpea meal. Lifecycle analysis data and Trucost’s EI-O model were used to estimate the footprints.
Figure 19: Distribution of land use across the supply chain for chicken, chickpeas and rice
Land use rice
Packaging 2%
Farming 88%
Other raw materials 10%
28 Resource use in the supply chain
Scaling up
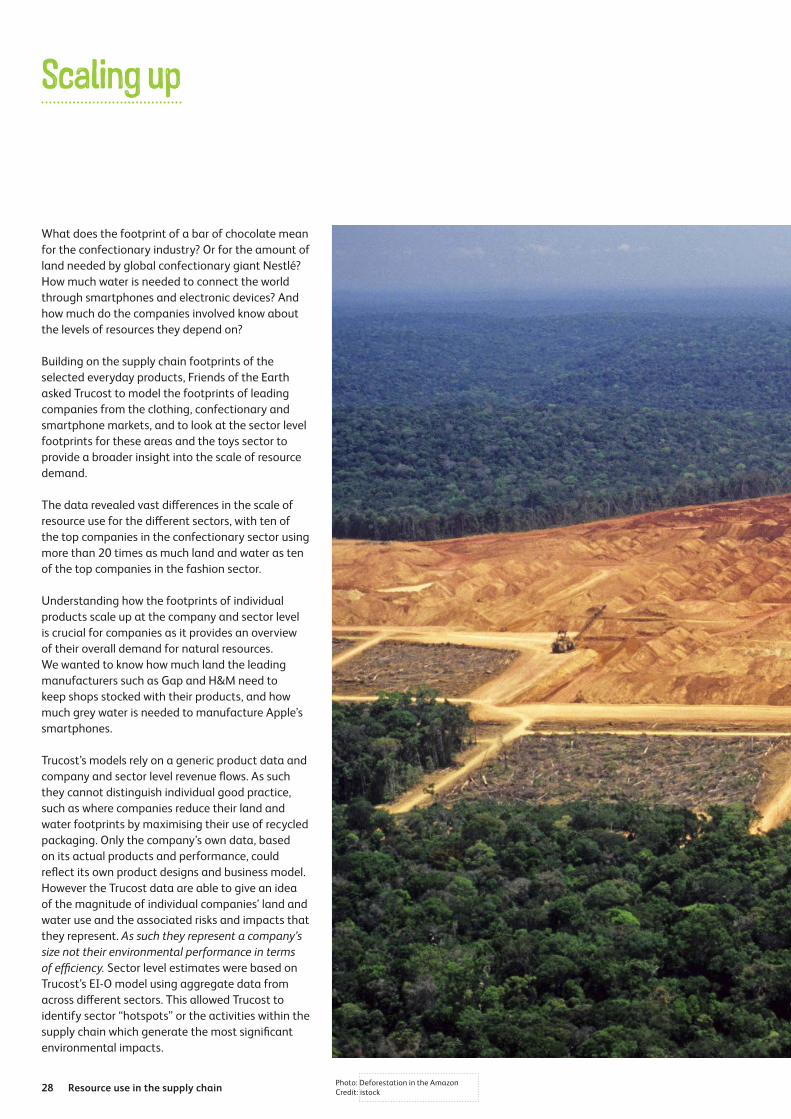
What does the footprint of a bar of chocolate mean for the confectionary industry? Or for the amount of land needed by global confectionary giant Nestlé? How much water is needed to connect the world through smartphones and electronic devices? And how much do the companies involved know about the levels of resources they depend on?
Building on the supply chain footprints of the selected everyday products, Friends of the Earth asked Trucost to model the footprints of leading companies from the clothing, confectionary and smartphone markets, and to look at the sector level footprints for these areas and the toys sector to provide a broader insight into the scale of resource demand.
The data revealed vast differences in the scale of resource use for the different sectors, with ten of the top companies in the confectionary sector using more than 20 times as much land and water as ten of the top companies in the fashion sector.
Understanding how the footprints of individual products scale up at the company and sector level is crucial for companies as it provides an overview of their overall demand for natural resources. We wanted to know how much land the leading manufacturers such as Gap and H&M need to keep shops stocked with their products, and how much grey water is needed to manufacture Apple’s smartphones.
Trucost’s models rely on a generic product data and company and sector level revenue flows. As such they cannot distinguish individual good practice, such as where companies reduce their land and water footprints by maximising their use of recycled packaging. Only the company’s own data, based on its actual products and performance, could reflect its own product designs and business model. However the Trucost data are able to give an idea of the magnitude of individual companies’ land and water use and the associated risks and impacts that they represent. As such they represent a company’s size not their environmental performance in terms of efficiency. Sector level estimates were based on Trucost’s EI-O model using aggregate data from across different sectors. This allowed Trucost to identify sector “hotspots” or the activities within the supply chain which generate the most significant environmental impacts.
Photo: Deforestation in the AmazonCredit: istock
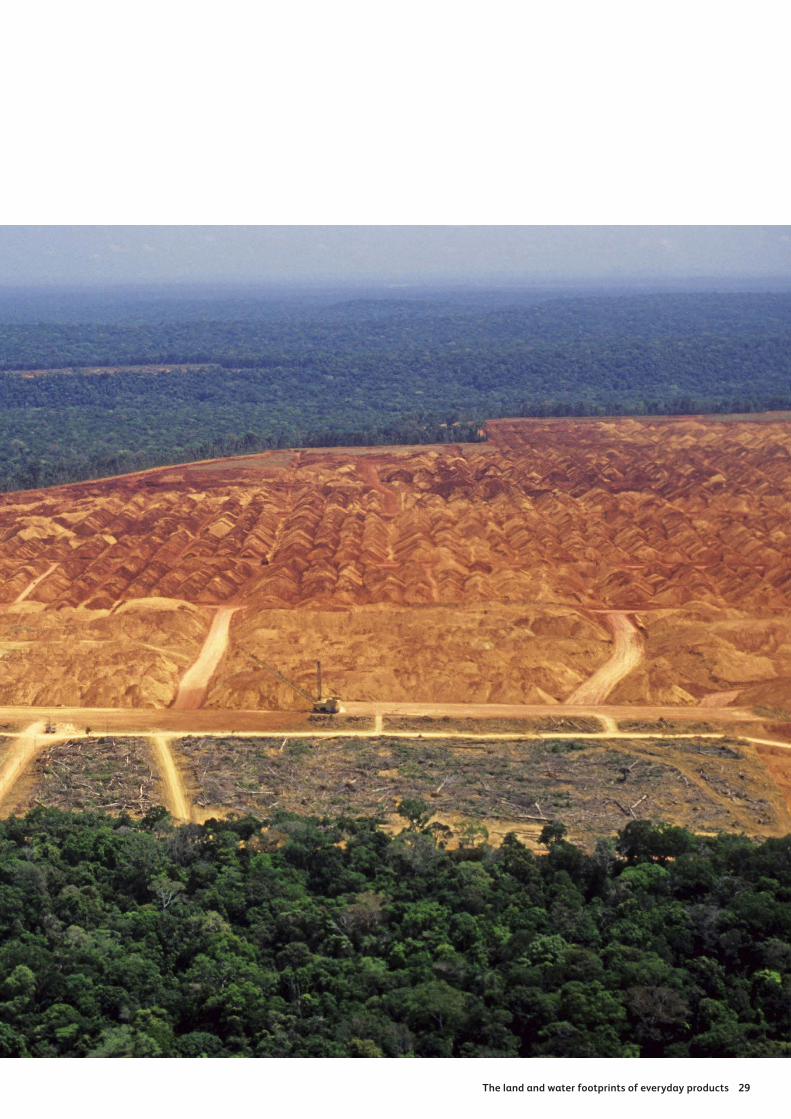
The land and water footprints of everyday products 29
30 Resource use in the supply chain
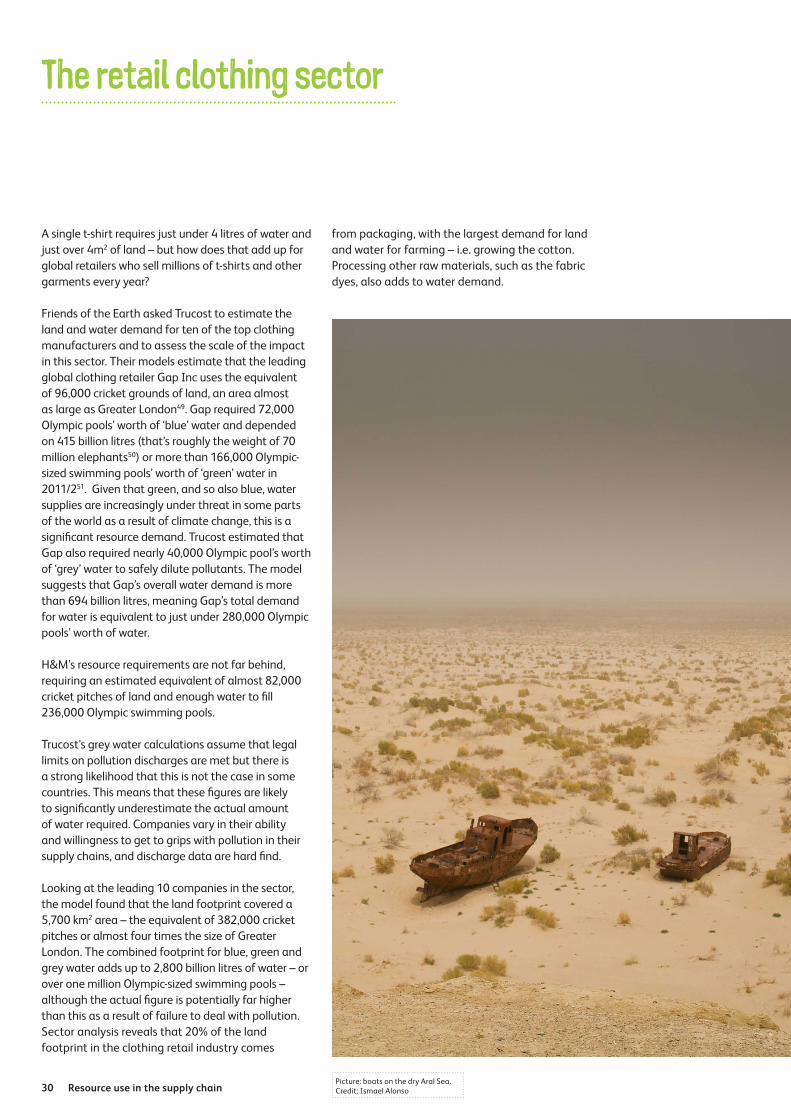
A single t-shirt requires just under 4 litres of water and just over 4m2 of land – but how does that add up for global retailers who sell millions of t-shirts and other garments every year?
Friends of the Earth asked Trucost to estimate the land and water demand for ten of the top clothing manufacturers and to assess the scale of the impact in this sector. Their models estimate that the leading global clothing retailer Gap Inc uses the equivalent of 96,000 cricket grounds of land, an area almost as large as Greater London49. Gap required 72,000 Olympic pools’ worth of ‘blue’ water and depended on 415 billion litres (that’s roughly the weight of 70 million elephants50) or more than 166,000 Olympic-sized swimming pools’ worth of ‘green’ water in 2011/251. Given that green, and so also blue, water supplies are increasingly under threat in some parts of the world as a result of climate change, this is a significant resource demand. Trucost estimated that Gap also required nearly 40,000 Olympic pool’s worth of ‘grey’ water to safely dilute pollutants. The model suggests that Gap’s overall water demand is more than 694 billion litres, meaning Gap’s total demand for water is equivalent to just under 280,000 Olympic pools’ worth of water.
H&M’s resource requirements are not far behind, requiring an estimated equivalent of almost 82,000 cricket pitches of land and enough water to fill 236,000 Olympic swimming pools.
Trucost’s grey water calculations assume that legal limits on pollution discharges are met but there is a strong likelihood that this is not the case in some countries. This means that these figures are likely to significantly underestimate the actual amount of water required. Companies vary in their ability and willingness to get to grips with pollution in their supply chains, and discharge data are hard find.
Looking at the leading 10 companies in the sector, the model found that the land footprint covered a 5,700 km2 area – the equivalent of 382,000 cricket pitches or almost four times the size of Greater London. The combined footprint for blue, green and grey water adds up to 2,800 billion litres of water – or over one million Olympic-sized swimming pools – although the actual figure is potentially far higher than this as a result of failure to deal with pollution.Sector analysis reveals that 20% of the land footprint in the clothing retail industry comes
from packaging, with the largest demand for land and water for farming – i.e. growing the cotton. Processing other raw materials, such as the fabric dyes, also adds to water demand.
The retail clothing sector
Picture: boats on the dry Aral Sea. Credit: Ismael Alonso
The land and water footprints of everyday products 31
1,500 km2
French Connection Group
H&M Hennes & Mauritz AB
Gap Inc.
Next PLC
Esprit Holdings Ltd.
Arcadia Group
Benetton Group
American Eagle Outfitters
Urban Outfitters Inc.
Abercrombie & Fitch Co.
Guess? Inc.
100bn L0 200bn L 300bn L 400bn L 500bn L 600bn L 700bn L 800bn L
Water
500 km2 1,000 km20
French Connection Group
H&M Hennes & Mauritz AB
Gap Inc.
Next PLC
Esprit Holdings Ltd.
Arcadia Group
Benetton Group
American Eagle Outfitters
Urban Outfitters Inc.
Abercrombie & Fitch Co.
Guess? Inc.
Land
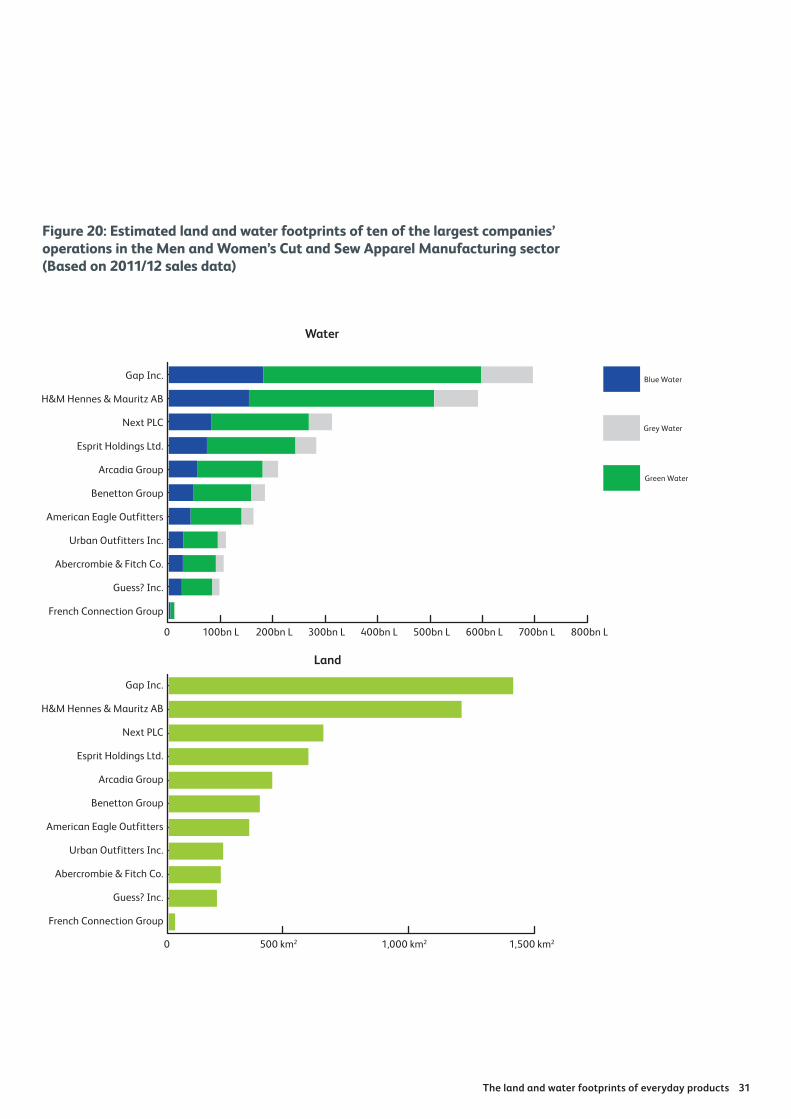
Figure 20: Estimated land and water footprints of ten of the largest companies’ operations in the Men and Women’s Cut and Sew Apparel Manufacturing sector (Based on 2011/12 sales data)
Grey Water
Green Water
Blue Water
32 Resource use in the supply chain
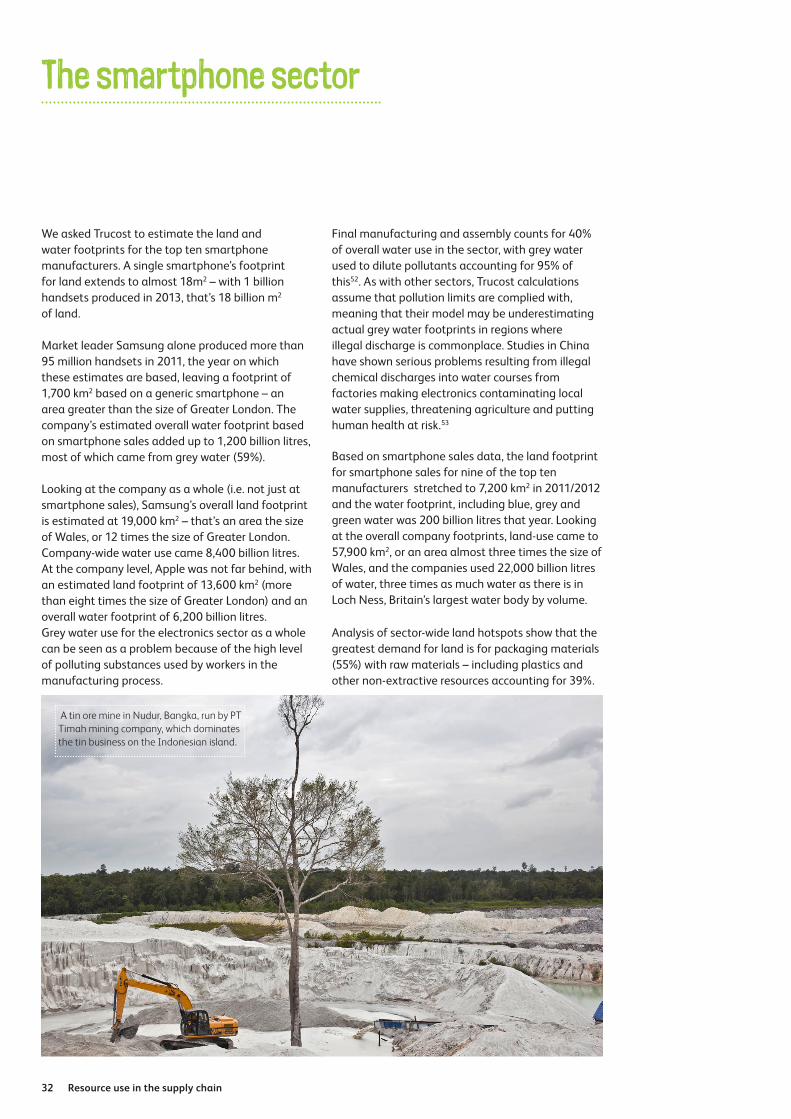
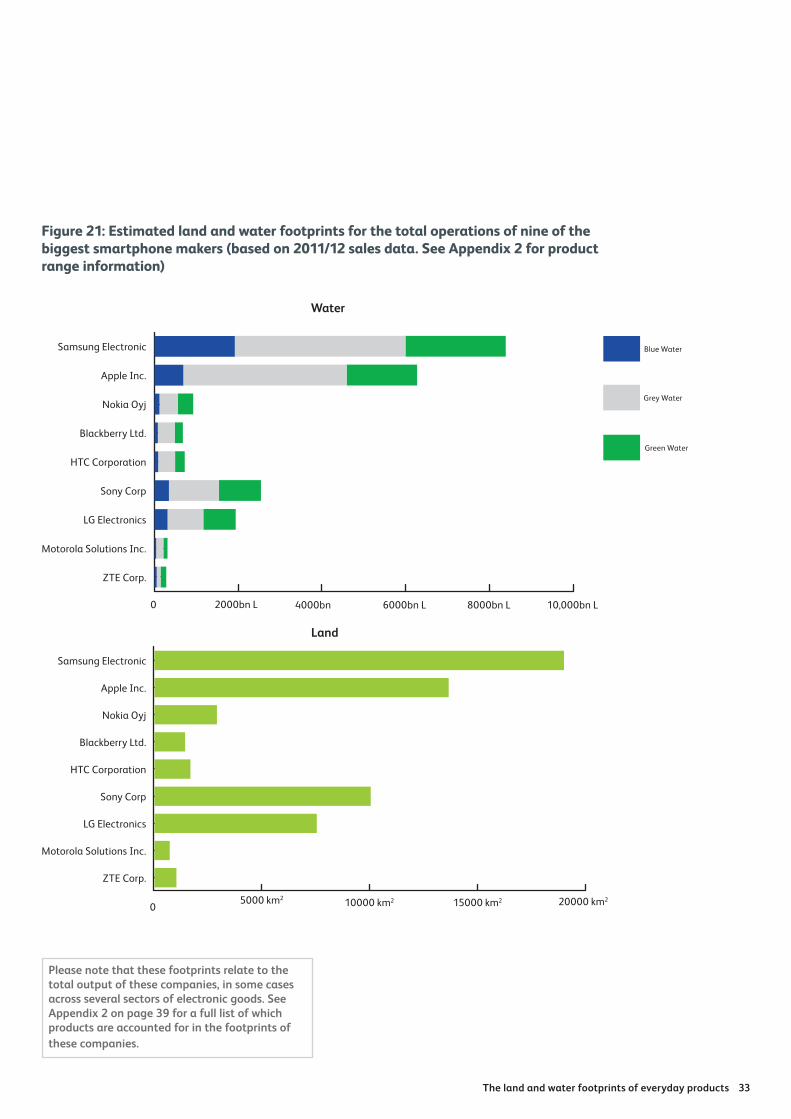
We asked Trucost to estimate the land and water footprints for the top ten smartphone manufacturers. A single smartphone’s footprint for land extends to almost 18m2 – with 1 billion handsets produced in 2013, that’s 18 billion m2 of land.
Market leader Samsung alone produced more than 95 million handsets in 2011, the year on which these estimates are based, leaving a footprint of 1,700 km2 based on a generic smartphone – an area greater than the size of Greater London. The company’s estimated overall water footprint based on smartphone sales added up to 1,200 billion litres, most of which came from grey water (59%).
Looking at the company as a whole (i.e. not just at smartphone sales), Samsung’s overall land footprint is estimated at 19,000 km2 – that’s an area the size of Wales, or 12 times the size of Greater London. Company-wide water use came 8,400 billion litres. At the company level, Apple was not far behind, with an estimated land footprint of 13,600 km2 (more than eight times the size of Greater London) and an overall water footprint of 6,200 billion litres.Grey water use for the electronics sector as a whole can be seen as a problem because of the high level of polluting substances used by workers in the manufacturing process.
Final manufacturing and assembly counts for 40% of overall water use in the sector, with grey water used to dilute pollutants accounting for 95% of this52. As with other sectors, Trucost calculations assume that pollution limits are complied with, meaning that their model may be underestimating actual grey water footprints in regions where illegal discharge is commonplace. Studies in China have shown serious problems resulting from illegal chemical discharges into water courses from factories making electronics contaminating local water supplies, threatening agriculture and putting human health at risk.53
Based on smartphone sales data, the land footprint for smartphone sales for nine of the top ten manufacturers stretched to 7,200 km2 in 2011/2012 and the water footprint, including blue, grey and green water was 200 billion litres that year. Looking at the overall company footprints, land-use came to 57,900 km2, or an area almost three times the size of Wales, and the companies used 22,000 billion litres of water, three times as much water as there is in Loch Ness, Britain’s largest water body by volume.
Analysis of sector-wide land hotspots show that the greatest demand for land is for packaging materials (55%) with raw materials – including plastics and other non-extractive resources accounting for 39%.
The smartphone sector
A tin ore mine in Nudur, Bangka, run by PT Timah mining company, which dominates the tin business on the Indonesian island.
The land and water footprints of everyday products 33
0 2000bn L 4000bn 6000bn L 8000bn L 10,000bn L
ZTE Corp.
Samsung Electronic
Apple Inc.
Nokia Oyj
Blackberry Ltd.
HTC Corporation
Sony Corp
LG Electronics
Motorola Solutions Inc.
Water
ZTE Corp.
Samsung Electronic
Apple Inc.
Nokia Oyj
Blackberry Ltd.
HTC Corporation
Sony Corp
LG Electronics
Motorola Solutions Inc.
05000 km2 10000 km2 15000 km2 20000 km2
Land
Figure 21: Estimated land and water footprints for the total operations of nine of the biggest smartphone makers (based on 2011/12 sales data. See Appendix 2 for product range information)
Please note that these footprints relate to the total output of these companies, in some cases across several sectors of electronic goods. See Appendix 2 on page 39 for a full list of which products are accounted for in the footprints of these companies.
Grey Water
Green Water
Blue Water
34 Resource use in the supply chain
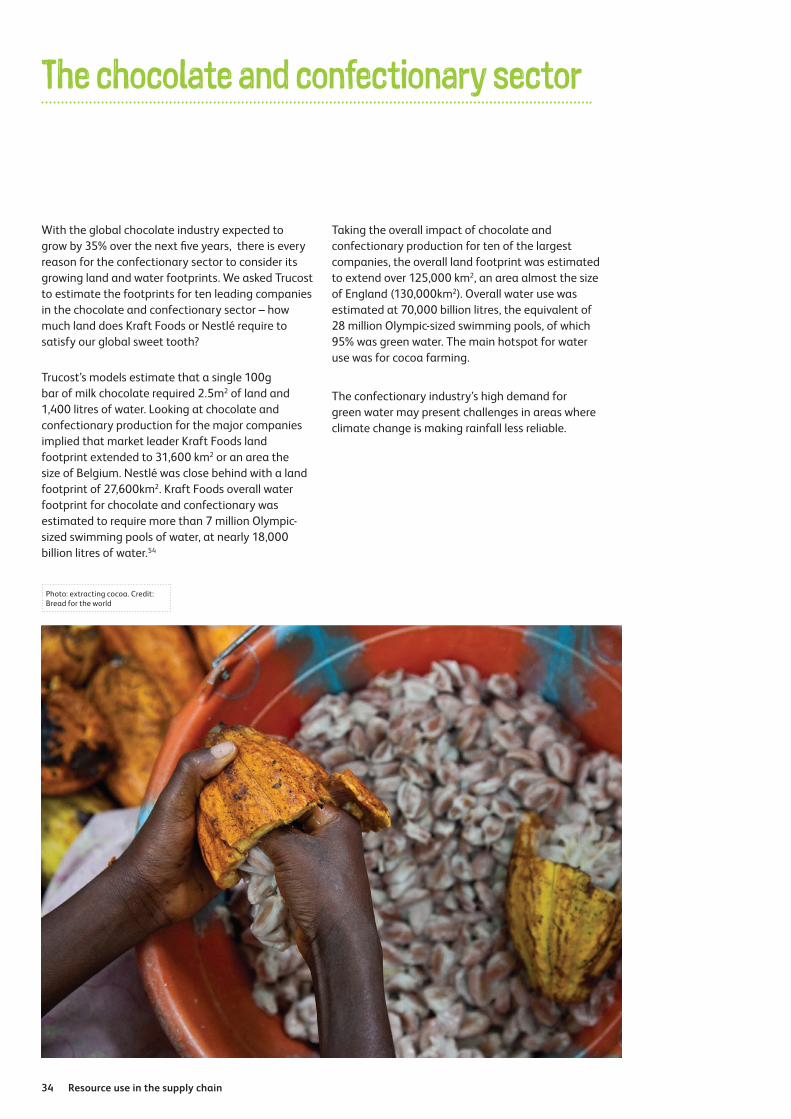
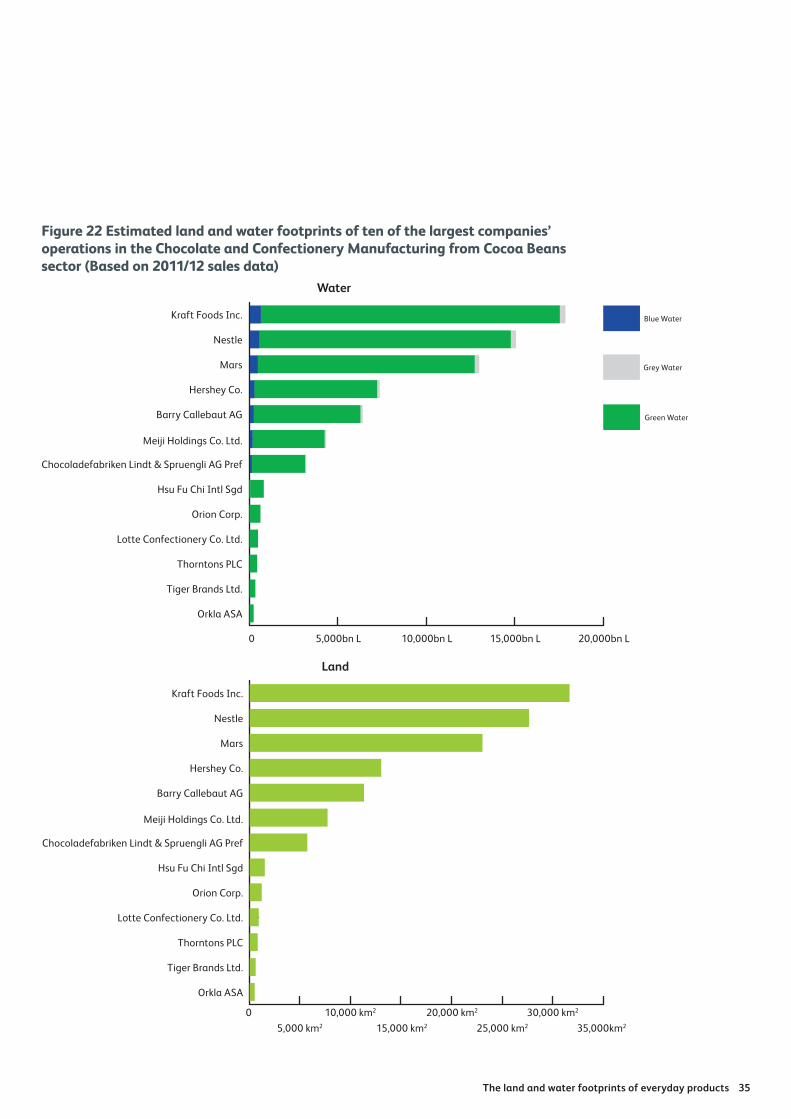
With the global chocolate industry expected to grow by 35% over the next five years, there is every reason for the confectionary sector to consider its growing land and water footprints. We asked Trucost to estimate the footprints for ten leading companies in the chocolate and confectionary sector – how much land does Kraft Foods or Nestlé require to satisfy our global sweet tooth?
Trucost’s models estimate that a single 100g bar of milk chocolate required 2.5m2 of land and 1,400 litres of water. Looking at chocolate and confectionary production for the major companies implied that market leader Kraft Foods land footprint extended to 31,600 km2 or an area the size of Belgium. Nestlé was close behind with a land footprint of 27,600km2. Kraft Foods overall water footprint for chocolate and confectionary was estimated to require more than 7 million Olympic-sized swimming pools of water, at nearly 18,000 billion litres of water.54
Taking the overall impact of chocolate and confectionary production for ten of the largest companies, the overall land footprint was estimated to extend over 125,000 km2, an area almost the size of England (130,000km2). Overall water use was estimated at 70,000 billion litres, the equivalent of 28 million Olympic-sized swimming pools, of which 95% was green water. The main hotspot for water use was for cocoa farming.
The confectionary industry’s high demand for green water may present challenges in areas where climate change is making rainfall less reliable.
Photo: extracting cocoa. Credit: Bread for the world
The chocolate and confectionary sector
The land and water footprints of everyday products 35
0 5,000bn L 10,000bn L 15,000bn L 20,000bn L
Orkla ASA
Kraft Foods Inc.
Nestle
Mars
Hershey Co.
Barry Callebaut AG
Meiji Holdings Co. Ltd.
Chocoladefabriken Lindt & Spruengli AG Pref
Hsu Fu Chi Intl Sgd
Orion Corp.
Lotte Confectionery Co. Ltd.
Thorntons PLC
Tiger Brands Ltd.
Water
Land
05,000 km2
10,000 km2
15,000 km2
20,000 km2
25,000 km2
30,000 km2
35,000km2
Orkla ASA
Kraft Foods Inc.
Nestle
Mars
Hershey Co.
Barry Callebaut AG
Meiji Holdings Co. Ltd.
Chocoladefabriken Lindt & Spruengli AG Pref
Hsu Fu Chi Intl Sgd
Orion Corp.
Lotte Confectionery Co. Ltd.
Thorntons PLC
Tiger Brands Ltd.
Figure 22 Estimated land and water footprints of ten of the largest companies’ operations in the Chocolate and Confectionery Manufacturing from Cocoa Beans sector (Based on 2011/12 sales data)
Grey Water
Green Water
Blue Water
36 Resource use in the supply chain
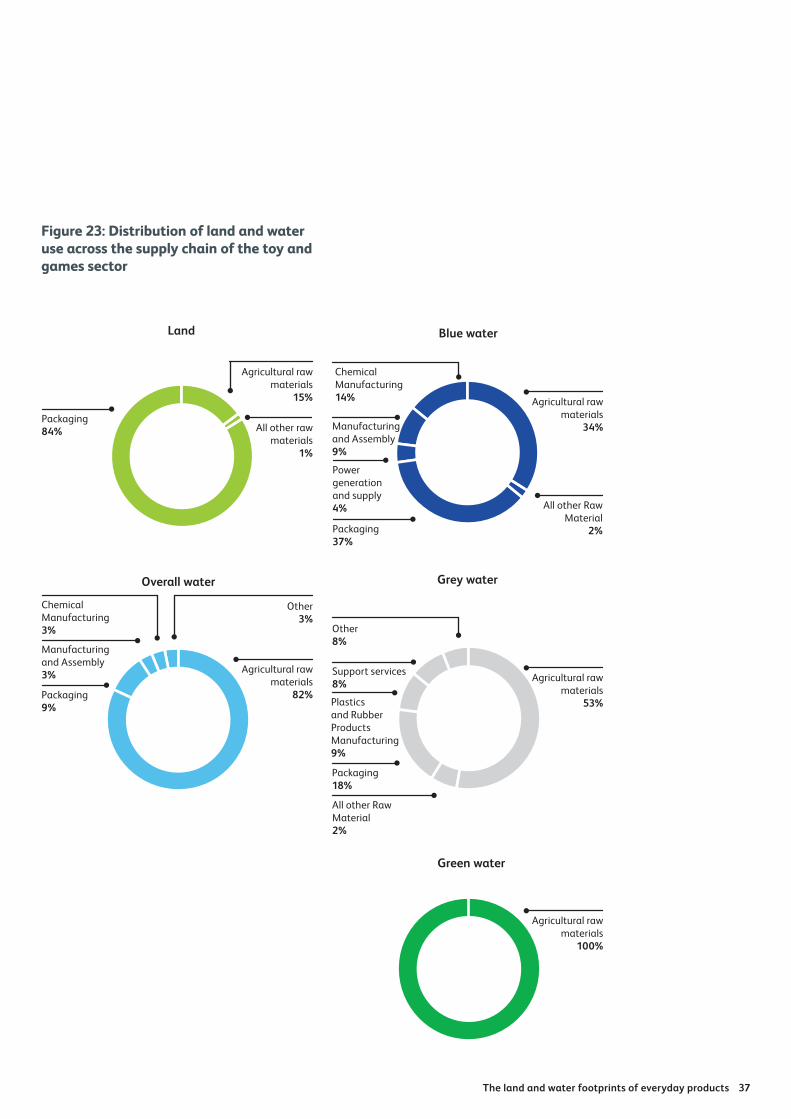
The global toy and games industry is expanding rapidly with predictions suggesting it will be worth around $100 billion by 201555. Children (and adults) are consuming more and more – from robotic pets to traditional board games, dolls and cuddly toys. British parents buy on average 41 toys per year56 – with top selling items for 2014 looking set to include smart children’s watches, TV games and Transformer robots57. The global toy sector was, until recently, dominated by US company Mattel but Danish company Lego has now taken first place, with Hasbro third58. But changing tastes and growing demand mean the market is shifting from the traditional toy makers towards apps, video games and interactive electronic toys59 – and as a result the footprint of the toy sector is changing too. We analysed the land and water hotspots for the global toy sector, covering dolls, toys and game manufacturing.
By far the biggest factor affecting the land use of the toy sector was demand for packaging materials – an estimated 267,000m2 or 27 cricket pitches for every US$1 million of sector revenue, accounting for 84% of the total land use.
Some toy manufacturers have sought to solve the packaging imprint by seeking out more efficient solutions, for example selling toy building bricks in re-usable storage bags60. While this may appeal to consumers, more durable packaging is likely to increase the footprint of the packaging as more resources are used.
Toy manufacturers and designers seeking to reduce the environmental impacts of packaging need to realise that using plant-based materials will increase the land and water footprints of the product. More emphasis needs to be put on reducing demand and phasing out the need for packaging materials.
While the resource use for packaging is significant in this sector, footprint analysis shows that the products themselves also require significant land and water for raw materials. The largest demand for water is for agricultural raw materials, with 84% of this demand for green water. Raw materials, which include wood, textiles, glues, paints and resins also account for most of the grey water used, although almost one fifth of the grey water use can be attributed to the packaging. Plastic and rubber
product manufacturing also requires significant amounts of grey water, and chemical manufacturing needs blue water, accounting for 3% of the total water use.
The toy and games sector
Photo: red christmas stocking filled with presents. Used as a christmas e-cardCredit: istock
The land and water footprints of everyday products 37
Agricultural raw materials
34%
All other Raw Material
2%Packaging 37%
Plastics and Rubber Products Manufacturing 9%
Power generation and supply 4%
Chemical Manufacturing 14%
Manufacturing and Assembly 9%
Agricultural raw materials
100%
Agricultural raw materials
53%
All other Raw Material 2%
Packaging 18%
Support services 8%
Other 8%
Blue water
Grey water
Green water
Agricultural raw materials
82%Packaging 9%
Manufacturing and Assembly 3%
Chemical Manufacturing 3%
Other3%
Overall water
Land
Packaging 84%
Agricultural raw materials
15%
All other raw materials
1%
Figure 23: Distribution of land and water use across the supply chain of the toy and games sector
38 Resource use in the supply chain
A role for companies
To assess how well companies are currently doing on measuring their footprints, Friends of the Earth examined the corporate social responsibility (CSR) records of the top ten best-selling smartphone manufacturers. Using publicly available data, either provided directly by the company in reports or online, or indirectly through data disclosure projects such as the Carbon Disclosure Project, we assessed how many footprints were being measured by the company, and the extent to which they measured across their supply chain.
We found that companies were starting to make progress on footprint reporting, particularly for greenhouse gas emissions and in some cases, also reporting on some form of blue water use (in some cases at a global level). Sony and Samsung also report on grey water use, and Sony reports on green water use in Japan and China. Several companies identified water supply risks, where suppliers are based in water stressed regions. Only one company, Nokia, reported on its land footprint. Sony is the only company measuring its annual global raw material use – which it measures across the supply chain.
This assessment has been extended by colleagues at Friends of the Earth in the Netherlands, who have assessed the responsibility of a range of electronic gadget manufacturers61.
While some companies have clearly recognised the benefits of measuring some, if not all of their impacts, it is clear that voluntary action by companies can only achieve so much. A common approach for companies working within a sector would make it easier for companies to obtain information from their supply chains, and would provide a more coherent picture of their impacts for the public and for investors.
As well as reporting on their resource use, Friends of the Earth also supports the need for companies to report on their social impacts and human rights record, and on the further environmental concerns of pollution and impacts on biodiversity.
A role for government
Because Friends of the Earth believes there is a limit to what can be achieved through voluntary action,
we have been calling for stronger legislation to require large companies to report on the social and environmental impacts of the products they sell, including through the supply chain. Footprints are a valuable tool in delivering this.
In April 2014, a European directive was passed which will require some large companies to do this, although gaps in the legislation mean that only publicly-listed companies are included. This means that five out of six large companies in the European Union will not be required to report. There is also no requirement to use common reporting methods, or for reports to be fully audited. And companies will not be required to disclose the full impact of their operations or the risks that they face.
Friends of the Earth believes that recent changes in the legislation do however represent an opportunity for companies to provide meaningful reports on the nature of their activities and to act on impacts which are damaging to the environment. The UK Government has a role to play in developing and strengthening company reporting legislation and encouraging best practice in UK companies and at European level.
Responding to public demand
There is growing awareness of the resource needs and damaging impacts of everyday products, with members of the public becoming more ethically aware. When Friends of the Earth published details of its investigation into tin mining in Bangka, Indonesia, supporters inundated smartphone manufacturers with requests to come clean. As a result of public pressure, the companies have formed a group to look at how they can clean up their supplies of tin.
Recommendations
The land and water footprints of everyday products 39
Economy level reporting of resource use: a ‘Stern for Resources’
In 2006 the Treasury commissioned economist Lord Stern to review the economics of climate change, including the relative costs of taking or avoiding action to reduce emissions.
The review concluded that the UK’s long-term economic health was far better served by weighting effort towards avoiding, rather than adapting to, climate change. The argument that Stern’s review made – that action is far cheaper than inaction – has been a cornerstone of the increase in perception of the costs and benefits of climate policy over the last decade.
Investors, manufacturers and other business leaders consistently sound the alarm that rising resource costs and insecurity of supply are real risks to their companies and the UK and global economy. Meanwhile the environmental destruction and related social upheaval caused by unfettered extraction of resources continues unabated.
As one of the world’s most import-dependent economies, the UK must now take a similarly long-sighted approach for resource use: a ‘Stern for Resources’. This should go beyond specific high risk materials by giving a headline account of consumption, including how much land, water, materials and carbon are used. These data should then be collected annually, giving a dynamic account of national resource consumption and dependence. Doing so would enable policy-makers to develop an effective and evidence-based national resource strategy for resource sufficiency and the protection of the global environment.
Company level reporting of resource use
Friends of the Earth wants to see full reporting by companies on their use of land, water, material and greenhouse gases.
You can’t manage what you don’t measure. Measuring natural resource consumption is an essential first step in reducing resource consumption and in so doing reducing the pressure on people and the planet. The four footprints provide a way of doing
this which allows the full impacts of different resource requirements to be taken into account (as opposed to using aggregate indicators, which can easily be distorted by a good or bad performance on any one aspect).
By having a set of indicators, rather than one overall indicator, a clearer picture of the balance of resource use is given, and trade-offs are made more visible. Measuring the four footprints makes it possible to monitor shifts in environmental pressure such as from fossil-based to bio-based products and energy systems, as illustrated by the impacts of the Renewable Fuels Obligation, which focused exclusively on greenhouse gas emissions, masking the impact on demand for land and the effect on food prices. The four footprints provide a well-founded basis for informing decisions as to product and business model redesign, and policy making and target setting.
Friends of the Earth believes that all large companies should be required to examine the resource footprints of their supply chains. And should be obliged by law to report on their use of land, water, materials and carbon, including use throughout their supply chain.
Friends of the Earth believes that effective reporting should:• Build on the UN Guiding Principles on Business
and Human Rights (UNGPs) and the OECD Guidelines for Multinational Enterprises which are the internationally recognised minimum normative standards, and require companies to provide an analysis of their use of key resources using the four footprints;
• Identify the risks companies pose to society and contribute to reducing them;
• Identify risks from external threats to companies’ supply chains;
• Cover all large companies and groups of companies, including companies that are privately-owned;
• Include verification and enforcement mechanisms to combat non-compliance or disclosure of misleading information;
• Be subject to clear guidance so that companies know what information to include.
The new legislation must also be regularly assessed and adapted to reflect technical progress.
40 Resource use in the supply chain
The Trucost Environmental Model
Trucost’s environmental input-output (EI-O) model calculates environmental impacts through supply chains by combining economic flows and environmental data. Using government census data from the U.S. Bureau of Economic Analysis, it identifies economic interactions between 464 business sectors. The economic data are combined with quantitative data on industrial facilities’ pollutant releases from sources including company data, product life cycle analyses, the US Toxic Release Inventory, UK Environmental Accounts, Japanese Pollution Release and Transfer Register and Australia’s National Pollution Inventory. The model analyses interactions between economic productivity and the environment.
The EI-O model estimates the amount of resources a company uses (the inputs) to produce goods or services (outputs), and the related level of pollutants. Each sector also has an environmental profile per unit of output. The model can distinguish between any level of the supply chain to calculate impacts in the first-tier of suppliers all the way through to raw materials extraction. The economic magnitude of a sector’s input from another drives its environmental impact, and so on through the supply chain, until all economic flows to produce a unit of output at the top of the supply chain have been accounted for. Based on revenue and expenditure in each business segment, the model calculates company environmental impacts upstream in supply chains. The model is adjusted on an annual basis to take into account changes in the environmental impact of a unit of output for each sector.
Text provided by Trucost.
Appendix 1
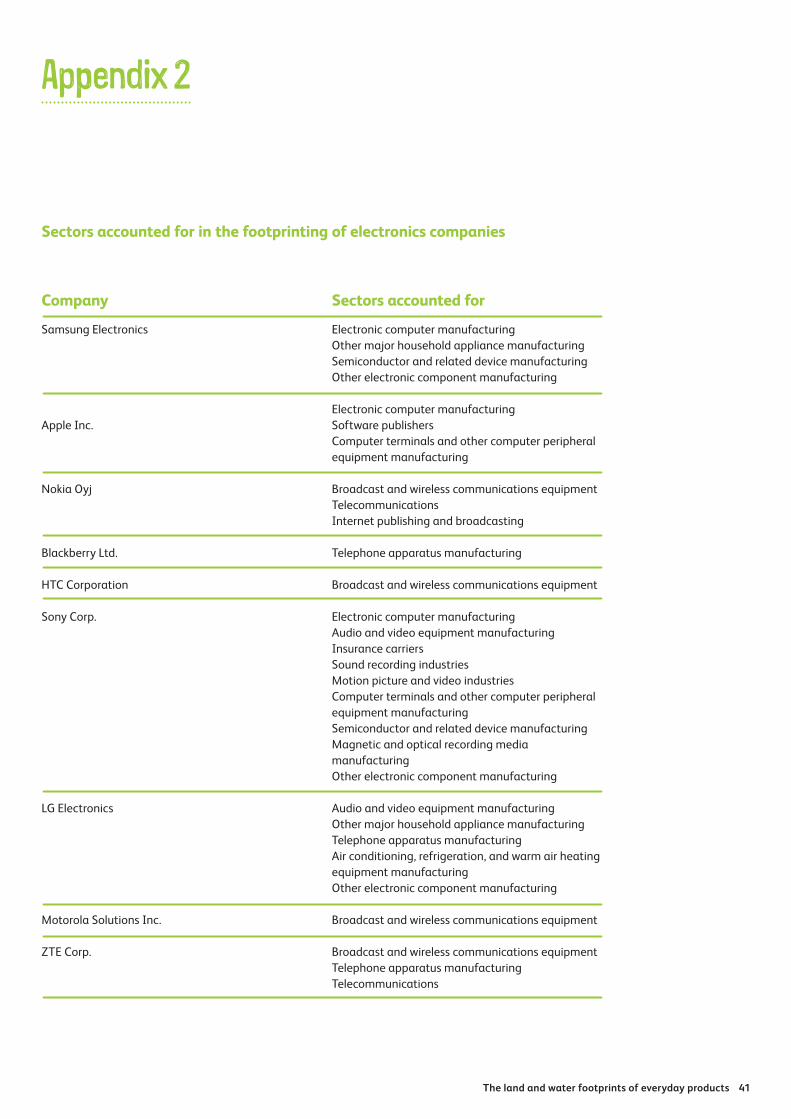
The land and water footprints of everyday products 41
CompanySamsung Electronics
Apple Inc.
Nokia Oyj
Blackberry Ltd.
HTC Corporation
Sony Corp.
LG Electronics
Motorola Solutions Inc.
ZTE Corp.
Sectors accounted forElectronic computer manufacturing Other major household appliance manufacturing Semiconductor and related device manufacturing Other electronic component manufacturing
Electronic computer manufacturing Software publishers Computer terminals and other computer peripheral equipment manufacturing
Broadcast and wireless communications equipment Telecommunications Internet publishing and broadcasting
Telephone apparatus manufacturing
Broadcast and wireless communications equipment
Electronic computer manufacturing Audio and video equipment manufacturing Insurance carriers Sound recording industries Motion picture and video industries Computer terminals and other computer peripheral equipment manufacturing Semiconductor and related device manufacturing Magnetic and optical recording media manufacturing Other electronic component manufacturing
Audio and video equipment manufacturing Other major household appliance manufacturing Telephone apparatus manufacturing Air conditioning, refrigeration, and warm air heating equipment manufacturingOther electronic component manufacturing
Broadcast and wireless communications equipment
Broadcast and wireless communications equipment Telephone apparatus manufacturing Telecommunications
Sectors accounted for in the footprinting of electronics companies
Appendix 2
42 Resource use in the supply chain
1. For more information about the four footprint approach, see: http://seri.at/wp-content/uploads/2010/05/seri_foee_measuring_eu_resource_use_final.pdf
2. The European Resource Efficiency Platform provides guidance to the European Commission, Members States and others on the transition to a more resource-efficient economy. http://ec.europa.eu/environment/resource_efficiency/re_platform/index_en.htm
3. http://ec.europa.eu/environment/resource_efficiency/about/roadmap/index_en.htm
4. http://ec.europa.eu/internal_market/accounting/non-financial_reporting/index_en.htm
5. For more information about Trucost’s EI-O model, see appendix 1.
6. This reflects grey water use where no waste treatment plant is used.
7. http://www.greenpeace.org/international/en/press/releases/APRILs-sustainability-policy-a-license-to-continue-forest-clearance/
8. http://www.mintel.com/press-centre/mintel-corporate/mintels-british-lifestyles-report-reveals-consumer-reaction-to-the-age-of-austerity
9. http://www.mvonederland.nl/system/files/media/research_on_sustainability_in_the_leather_supply_chain_final_report_june_2013.pdf
10. http://www.worstpolluted.org/docs/TopTenThreats2013.pdf
11. http://www.hrw.org/sites/default/files/reports/bangladesh1012webwcover.pdf
12. http://www.dhakatribune.com/bangladesh/2013/nov/07/relocation-hazaribagh-tanneries-end-next-year
13. http://money.aol.co.uk/2013/07/03/the-t-shirt-turns-100-whats-it-worth/
14. Research and Markets, Global Apparel Retail Brochure, see: http://www.researchandmarkets.com/reports/2093804/
15. Mekonnen, M.M. and Hoekstra, A.Y., (2011), The green, blue and grey water footprint of crops and derived crop products,” Value of Water Research Report Series No. 47, UNESCO-IHE, Delft, the Netherlands
16. http://www.indiantextilejournal.com/articles/fadetails.asp?id=2737
17. Mekonnen, M.M. and Hoekstra, A.Y., (2011), The green, blue and grey water footprint of crops and derived crop products,” Value of Water
Research Report Series No. 47, UNESCO-IHE, Delft, the Netherlands
18. http://ejfoundation.org/cotton/cotton-and-water
19. http://www.who.int/mediacentre/factsheets/fs225/en/
20. http://www.fibre2fashion.com/industry-article/textile-industry-articles/impact-of-textiles-and-clothing-industry-on-environment/impact-of-textiles-and-clothing-industry-on-environment3.asp
21. Greenpeace International, Dirty Laundry, 201122. United Nations Conference on Trade and
Development. http://unctad.org/en/docs/suc20112cotton_en.pdf
23. FAO Stat. http://faostat.fao.org/site/567/DesktopDefault.aspx?PageID=567#ancor
24. http://www.idc.com/getdoc.jsp?containerId=prUS24645514
25. Hurst, C. Mar 2010. China’s Rare Earth Elements Industry: What Can the West Learn? Institute for the Analysis of Global Security. Available from: http://fmso.leavenworth.army.mil/documents/rareearth.pdf
26. Friends of the Earth, Mining for Smartphones: the true cost of tin, November 2012. http://www.foe.co.uk/sites/default/files/downloads/tin_mining.pdf
27. http://www.chinalaborwatch.org/news/new-248.html
28. http://www.macworld.com/article/2097723/apples-2014-supplier-report-better-working-conditions-fewer-conflict-minerals.html
29. http://www.nytimes.com/2012/12/07/technology/apple-to-resume-us-manufacturing.html?_r=0
30. http://www.tea.co.uk/tea-faqs31. http://www.tea.co.uk/tea-faqs32. http://www.britishcoffeeassociation.org/about_
coffee/coffee_facts/33. http://www.theguardian.com/
environment/2011/oct/04/green-coffee34. http://www.ico.org/field_processing.
asp?section=About_Coffee35. http://www.ncausa.org/i4a/pages/index.
cfm?pageid=6936. http://www.ico.org/decaffeination.
asp?section=About_Coffee37. http://www.divinechocolate.com/uk/about-us/
research-resources/resources/chocolate-facts38. http://www.sfu.ca/geog351fall03/groups-
webpages/gp8/prod/prod.html
References and notes

The land and water footprints of everyday products 43
39. http://politicsofpoverty.oxfamamerica.org/2014/09/child-laborers-bring-case-food-companies-youre-enabling-enslavement/
40. http://store.mintel.com/prepared-meals-uk-may-2013
41. https://www.keynote.co.uk/media-centre/in-the-news/display/convenience-of-ready-meals-irresistible-for-uk-consumers/?articleId=1106
42. http://www.independent.co.uk/life-style/food-and-drink/news/thai-chicken-better-than-most-british-production-says-rspca-2124580.html
43. http://www.ciwf.org.uk/news/meat_chickens/urgent_action_needed_to_stop_chickens_suffering.aspx
44. http://www.worldpoultry.net/Broilers/Markets--Trade/2013/10/Uncertain-future-for-small-Thai-poultry-farmers-1389189W/
45. http://www.independent.co.uk/life-style/food-and-drink/news/thai-chicken-better-than-most-british-production-says-rspca-2124580.html
46. http://www.ncfan.org/poultry-workers/47. http://www.theguardian.com/law/2012/oct/29/
workers-chickens-allegedly-trafficked-beaten48. See for example Audsley, E., Brander, M.,
Chatterton, J., Murphy-Bokern, D., Webster, C., and Williams, A. (2009). How low can we go? An assessment of greenhouse gas emissions from the UK food system and the scope to reduce them by 2050. FCRN-WWF-
49. UK, p37 comparing greenhouse gas emissions of chicken meat and chickpeas.
50. The Greater London region covers 1,572 square kilometres http://en.wikipedia.org/wiki/London
51. Assuming a male African elephant weight of 6 metric tonnes
52. An Olympic swimming pool is assumed to hold 2,500,000 litres of water and a cricket ground covers 15,000 m2.
53. See for example, Green Choice Alliance, Who is polluting the Taihu Basin? IT Industry Supply Chain Investigative Report – Phase VII, 2013
54. http://www.divinechocolate.com/uk/about-us/research-resources/resources/chocolate-facts
55. http://www.reportlinker.com/ci02218/Toy-and-Game.html
56. http://www.economist.com/node/21538206?zid=291&ah=906e69ad01d2ee51960100b7fa502595
57. http://metro.co.uk/2014/06/27/pictures-hamleys-top-ten-must-have-toys-for-christmas-2014-4777556/
58. http://www.theguardian.com/business/2014/
feb/27/lego-builds-record-profithttp://www.therichest.com/business/companies-business/fun-for-profit-the-worlds-nine-biggest-toy-companies/
59. http://www.toynews-online.biz/opinion/read/opinion-toy-packaging-isn-t-a-waste/040223
60. https://milieudefensie.nl/english/mining/what-is-hiding-behind-your-screen