milling characteristics and distribution of phytic acid, minerals, and some nutrients in oat (avena...
TRANSCRIPT

lable at ScienceDirect
Journal of Cereal Science 60 (2014) 549e554
Contents lists avai
Journal of Cereal Science
journal homepage: www.elsevier .com/locate/ jcs
Milling characteristics and distribution of phytic acid, minerals, andsome nutrients in oat (Avena sativa L.)
Hui Li a, Ju Qiu b, Chao Liu a, Changzhong Ren c, Zaigui Li a, *
a College of Food Science and Nutritional Engineering, Beijing Key Laboratory of Functional Food from Plant Resources, China Agricultural University,Haidian, Beijing 100083, Chinab Institute of Food and Nutrition Development, Ministry of Agriculture, Haidian, Beijing 100081, Chinac Oat Engineering and Technique Research Center of Jilin Province, Baicheng, Jilin 137000, China
a r t i c l e i n f o
Article history:Received 17 February 2014Received in revised form31 July 2014Accepted 20 August 2014Available online 6 September 2014
Keywords:Phytic acidMineralsMilling degreeOats
* Corresponding author. Box 40, China AgriculturaDong Lu, Haidian District, Beijing 100083, China. Tel./
E-mail address: [email protected] (Z. Li).
http://dx.doi.org/10.1016/j.jcs.2014.08.0040733-5210/© 2014 Elsevier Ltd. All rights reserved.
a b s t r a c t
The effect of milling degree in three oat cultivars was determined to illustrate the milling characteristicsas well as the distribution of phytic acid and some nutritional components in oats. According to theresults, to obtain the same milling degree (12%), Baiyan2 (naked oat) required the longest milling (60 s),while Linna (hulled oat) and Bayou1 (naked oat) required shorter milling of 50 s. The milling processcould effectively decrease the level of phytic acid, whose distribution was found to be uneven and highlyconcentrated in the oat bran (27%e53% phytic acid). As for the content of phytic acid in oat, Bayou1showed a much higher value (52.92 ± 10.27%) in oat bran than Baiyan2 (31.38 ± 0.31%) and Linna(27.81 ± 4.62%). Generally, it took 50e60 s to remove oat bran by milling, which resulted in a 19.7%decrease in hardness of cooked oat. Besides, for naked oat Baiyan2, the marked decline of iron and lipidas well as the constant levels of calcium, zinc, protein, starch and b-glucan was also detected during themilling process.
© 2014 Elsevier Ltd. All rights reserved.
1. Introduction
Phytic acid (myoinositolhexa-phosphoric acid), a major phos-phorus storage compound in most seeds and cereal grains, has astrong ability to chelate multivalent metal ions, such as Ca2þ, Zn2þ,Fe2þ, etc., resulting in the unavailable dietary absorption of min-erals (Garc~oAa-Estepa et al., 1999; Lopez et al., 2002; Ockendenet al., 2004; Liu et al., 2005a,b). It is also involved in the forma-tion of complexes with protein, negatively affecting protein solu-bility, enzymatic degradation, and gastric absorption and themalting process (Bilgiçli et al., 2006; Dai et al., 2007). Therefore,phytic acid is usually regarded as an “anti-nutrient” which un-dermines the function of other nutritional components in grain.
Specifically, oat (Avena sativa L.), with rich functional constitu-ents including dietary fiber, b-glucan, minerals and antioxidantshas been reported to benefit the relief of various disorders(Madhujith and Shahidi, 2007; Brindzova et al., 2008) such ascardiovascular disease (Berg et al., 2003), serum cholesterol (Chen
l University, No. 17 Qinghuafax: þ86 10 62737392.
et al., 2006), diabetes (Tapola et al., 2005) and obesity (Zdu�nczyket al., 2006). However, in spite of the substantial health benefitsof oat diet, some bioactivities mentioned above are inevitablyinhibited due to the existence of phytic acid, ranging from 5 g/kg to12 g/kg in different oat cultivars (Peterson, 2001). Therefore, pre-vention of the negative effects of phytic acid on the bioactivities ofminerals in oat is necessary to increase oat nutritional value.
Meanwhile, it is reported that phytic acid is mainly concentratedin the aleurone layer of cereal grains (Liu et al., 2005a,b) and themilling process has proved to be beneficial for the removal of phyticacid in cereal grains, such as rice, wheat, barley, etc. (Slavin et al.,2001; Liang et al., 2008; Wang et al., 2011). Considering that thebiggest nutritional losses also occur at the milling step (Slavin et al.,2001; Wang et al., 2007), it is essential to develop milling methodswhich can remove phytic acid to the maximum but keep the lossesof other nutritional compounds lowest at the same time. Althoughsome studies have demonstrated the effects of milling and cookingon nutrition of oat or rice (Slavin et al., 2001; Lamberts et al., 2007;Wang et al., 2007), the relationship betweenmilling and phytic acidin oat lacks study. This study aims at examining the effect of millingon the loss of phytic acid, the retention of minerals and the textureof cooked oat in different cultivars, hoping to offer some informa-tion for oat rice processing.

Fig. 1. Milling characteristic of three varieties of oat kernels. Results are expressed asthe mean ± SD (n ¼ 3).
H. Li et al. / Journal of Cereal Science 60 (2014) 549e554550
2. Materials and methods
2.1. Materials
Three different cultivars of oat (A. sativa L.) were harvested inChina, in2011. Baiyan2, LinnaandBayou1were cultivated inBaichengCity (Jilin province), Xining City (Qinghai province) and ZhangjiakouCity (Hebei province), respectively. After harvest, the materials werestored at 4 �C and then cleaned and dehulled before milling.
2.2. Dehulling and milling
Oat grains were dehulled with a hulling machine (JLGJ2.5, Zhe-jiang YaojiangMachinery Co., Ltd., Zhejiang, China) to obtain brownoat. Only intact oat kernels were selected and used for subsequentmilling experiment. About 150 (±1) g of brown oatweremilledwithamillingmachine (TM05C, Satake Co. Ltd., Japan) for 0,10, 20, 30, 40,60 and 70 s. Each milling treatment with corresponding durationwas performed in triplicate and themilling degreewasmeasured asthemass loss for differentmilling times. Themilled oat kernelswerethen ground with a grinder (HY-04A, Beijing Huanya MachineryTechnology Co., Ltd., Beijing, China) for 90 s to pass a 60 mesh sieveand dried at 100 �C till constantweight. Dried oat flourwas stored insealed plastic bags at 4 �C for further analysis.
2.3. Determination of phytic acid
The content of phytic acid in oat was determined according tothemethod described by Dai et al. (2007). Phytic acid was extractedfrom oat flour with 100 g/L Na2SO4eHCl (1.2%) solution on an anionexchange resin. Then after reacting with 0.03% ferric chloride so-lution containing 0.3% sulfosalicylic acid, the mixture was analyzedat 500 nm by a spectrophotometer (WFZ UV-2100, Unico, ShanghaiInstrument Company Limited, Shanghai, China).
2.4. Determination of nutrients in oat kernels
Contents of minerals (Ca, Fe and Zn) were detected by atomicabsorption spectrometry after wet digestion, as the methodmentioned by Lopez et al. (2002). Then the amounts of protein,starch, lipid and b-glucanwere detected according to AACCmethod46-11A (2000), the dinitrosalicylic colorimetric method of Ma et al.(2010), AACC 30-20 (2000) and dual enzymatic hydrolysis methodin AACC 32-23 (2000), respectively.
2.5. Determination of hardness of cooked oat
Themilled oat kernels (30 ± 0.1 g) were soaked in 45ml distilledwater for 60 min at room temperature and steamed in a rice cooker(SR-W180, Toshiba Co. Ltd., Japan) for about 25 min. Duringsteaming, the oat meal was mixed by a plastic scoop every 10 minand kept warm for 20 min after heating. Then, the cooked oat wascooled by a cooler for 20minwithmixing every 10min. Hardness ofcooked oat was analyzed by a rice hardness viscometer (RHS1A,Satake Co. Ltd., Japan) and was expressed as the value of pressure(kgf) produced by the compression of cooked oat.
2.6. Statistical analysis
Data were analyzed by one-factor analysis of variance (ANOVA)using SPSS version 17.0 (SPSS, Inc., Chicago, USA). Comparisons ofmeans were made by the Duncan test. P value of 0.05 or less wasconsidered significant. Data were expressed as numerical meansand standard deviations (Mean ± SD). Each sample was analyzed intriplicate.
3. Results and discussion
3.1. Milling characteristics of three cultivars of oat
Given the process of milling induces a loss of weight because ofbran removal and breakage of kernel, the milling degree, an indexwidely used to illuminate the milling characteristics of grain(Perdon et al., 2001; Lamberts et al., 2007; Wang et al., 2011), isdefined as the percentage of mass loss for brown oat (Wadsworth,1994). In the present study, the variations of milling degree withdifferent milling duration are investigated. As shown in Fig. 1,before the milling degree increases to 6%, same milling time causesnearly the same mass loss for all the three oat cultivars, indicatingthat the hardness and composition of fiber in the outer layer ofthese three oats are similar. However, in the subsequent millingprocess, the trends begin changing. The increase of milling degreefor Baiyan2 (elliptical grain) is slower than that for Linna (ellipticalgrain), while Bayou1 (long and slender grain) surpasses both thetwo cultivars showing the fastest increase. To be more exact, ittakes 60 s to remove oat bran (with 12%milling degree) for Baiyan2,while only 50 s for Linna and Bayou1. After 70 s of milling, themilling degree for Baiyan2 (13.92 ± 0.78%) is the lowest, followedby Linna (18.89 ± 0.54%) and Bayou1 (21.56 ± 0.17%). The findingsuggests that the hardness of Baiyan2 is larger than Linna andBayou1 due to their different distribution of nutrients. Besides, thevariation of the relationship between milling time and millingdegree among different cultivars can also be demonstrated throughtheir different quadratic equations plotted by the milling degree (y,%) vs. milling time (x, s) (Perdon et al., 2001; Singh-Gujral et al.,2002). According to the analyzed data, each of the three cultivars,Bayou1 (y ¼ 0.0027x2 þ 0.1107x þ 0.2746, R2 ¼ 0.9982), Linna(y ¼ 0.0016x2 þ 0.1502x þ 0.3288, R2 ¼ 0.9960), and Baiyan2(y ¼ 0.0002x2 þ 0.1759x þ 0.3162, R2 ¼ 0.9929), show close cor-relation (R2 > 0.99) between mass loss and the duration of milling,with their own different parameters. This may be due to differencesin kernel shape, hardness, and thickness of the aleurone layer forthe three cultivars, which is also detected in some studies on rice(Liang et al., 2008; Wang et al., 2011).
Generally, from Fig. 1, it is clearly revealed that the milling de-gree of oat increases with prolonging of milling time, but the cor-relation is nonlinear, which indicates that the hardness from thesurface of the kernel to the core is not homogenous. This may berelated to the uneven distribution of dietary fiber, starch and pro-tein in oat kernels (Doehlert and McMullen, 2000; Girardet andWebster, 2011). Specifically, at the initial milling stage, the millingdegree (mass loss) increases about 2% per 10 s and then the lossrates become more substantial from 30 s of milling, especially forthat of Bayou1 which reaches up to 7% per 10 s after 60 s milling. Itsuggests that the outer layers of oat kernels are harder than the

H. Li et al. / Journal of Cereal Science 60 (2014) 549e554 551
inside, which is different from rice. Furthermore, considering that ittakes 60 se70 s to achieve 15% of milling degree for oat while itneeds as much as 100e300 s for rice (Liang et al., 2008; Wang et al.,2011), it can be speculated that more hard constituents exist in thebran layer of rice than in that of oat. As for the polynomial equa-tions of these two cereals, based on the previous studies (Perdonet al., 2001; Lamberts et al., 2007; Liu et al., 2005a,b; Wang et al.,2011), negative parameters in equations of rice are opposite tothe positive parameters of oat in this study, which indicates that thehardness of the rice bran layer increases gradually from outer toinner, while the trend is opposite for oat.
Fig. 2. Distribution of phytic acid in different oat kernels. (a) Baiyan2; (b) Linna; (c)Bayou1. Results are expressed as the mean ± SD (n ¼ 3).
3.2. Distribution of phytic acid in three cultivars of oat
Phytic acid, as an anti-nutrient, is able to bind with somenutritional compounds in grain and alters their solubility, di-gestibility and absorption (Bilgiçli et al., 2006; Dai et al., 2007). Interms of the total quantity of phytic acid, as shown in Table 1, itscontent of Baiyan2 (1.04 ± 0.01 g/100 g) is about 1.5-fold higherthan those of Linna (0.63 ± 0.03 g/100 g) and Bayou1 (0.68 ± 0.06 g/100 g). This finding is in agreement with the results of Peterson(2001) who reported the different phytic acid levels (0.5e1.2 g/100 g) in different oat cultivars from Finland and USA, but relativelyhigher than the concentration in oat from Spain (0.4e0.7 g/100 g)(Garc~oAa-Estepa et al., 1999). The content of phytic acid in othercereals has also been reported, for instance, around 0.4e0.7 g/100 gand 0.7e1.1 g/100 g phytic acids were found in indica rice (Oryzasativa L.) and Chinese rice (Liu et al., 2005a,b; Wu et al., 2007; Lianget al., 2008; Wang et al., 2011), respectively. Besides, there are0.9e2.2 g/100 g phytic acids in wheat, about 1.0 g/100 g in corn,millet and sorghum as well as 0.4e0.7 g/100 g in rye and barley(Garc~oAa-Estepa et al., 1999; Wu et al., 2010). Comparatively,Baiyan2 shows the same level of phytic acid as corn, millet andsorghum, while Linna and Bayou1 show lower levels. Since phyticacid in oat is not beneficial to the absorption of other nutritionalcompounds, such as calcium or protein, it is meaningful to illustratethe distribution of phytic acid in oat so as to properly remove phyticacid in the process of milling.
In our subsequent experiment, the distribution of phytic acid inthree oat cultivars was investigated (Fig. 2). The removal of phyticacid is enhanced with prolonging of milling time. The loss rate ofphytic acid in Baiyan2 increases significantly at the initial millingstage till 30 s and then levels off from 30 s to 60 s, after that, the lossrate increases rapidly again (Fig. 2a). Similar trends are found inLinna and Bayou1. Loss rates of phytic acid increases obviously atthe initial stage of milling till 40 s for Linna and 20 s for Bayou1,which is also followed by a plateau (40e60 s for Linna and 20e40 sfor Bayou1), and a further growth (Fig. 2b and c).
A regression analysis is performed to find the relationship be-tween the loss of phytic acid and milling degree in different oatcultivars and the quadratic equations are shown in Table 1. Togetherwith Fig. 2, the results reveal that the loss rates of phytic acid arequite different in the three oat cultivars. The removal of phytic acid
Table 1Regression equation for the relationship between the loss of phytic acid and millingdegree.
Cultivar Regression equationa R2 Content of phytic acidbefore milling (g/kg)
Baiyan2 y ¼ �0.0063x2 þ 0.3948x � 0.1892 0.9830 10.41 ± 0.10Linna y ¼ �0.0036x2 þ 0.2157x � 0.1790 0.9782 6.29 ± 0.35Bayou1 y ¼ �0.0046x2 þ 0.3219x � 0.0317 0.9743 6.78 ± 0.57
Results are expressed as the mean ± SD (n ¼ 3).a y ¼ loss of phytic acid (%); x ¼ milling degree.
from three cultivars of oat achieve around 20% when the millingdegree is about 6%, which means that the 6% of outer layers in oatkernels contains 20% of phytic acid, thus resulting in the initiallyrapid loss of phytic acid. After the removal of oat bran when themilling degree reaches 12%, the loss of phytic acid in three oatcultivars increases to 27%e53%, among which Bayou1 is the highest(52.92 ± 10.27%), followed by Baiyan2 (31.38 ± 0.31%), and Linna(27.81 ± 4.62%). The data suggests that the removal of oat bran inthe milling process can benefit the decrease of phytic acid, whichfurther promotes the digestibility and absorption of nutrients inoat.
In addition, the different loss rates of phytic acid in variousmilling stages indicate uneven distribution of phytic acid in brownoat. Since the loss of phytic acid reaches up to 39%e69% (i.e. only31%e61% of phytic acid is left in oat kernels) after milling for 70 s,the level of phytic acid reduces from outer to inner within oatkernels. Similarly, some other studies also showed that phytic acidwas highly concentrated in the outer layer (0% < degree of milling<15%) of rice kernels (Wang et al., 2011), in bran of buckwheat(3.5e3.8 g/100 g) (Steadman et al., 2001) and in the aleurone layerof barley grain (Dai et al., 2007).
3.3. Distribution of minerals in Baiyan2
Given phytic acid in brown oat is reduced by 27%e53% after theremoval of oat bran when the milling degree reaches 12%, thedistributions of minerals in the outer layer of oat kernels, includingoat bran (degree of milling is within the interval of 0e12%) andendosperm (degree of milling exceeds 12%), are detected for
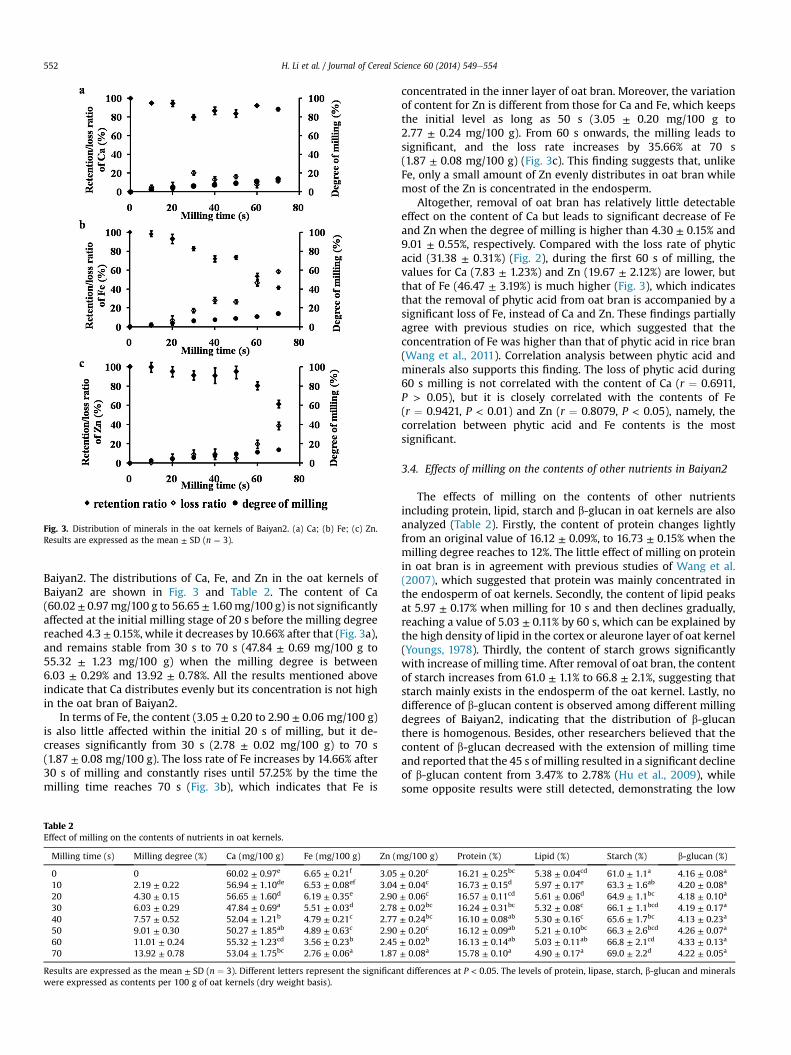
Fig. 3. Distribution of minerals in the oat kernels of Baiyan2. (a) Ca; (b) Fe; (c) Zn.Results are expressed as the mean ± SD (n ¼ 3).
H. Li et al. / Journal of Cereal Science 60 (2014) 549e554552
Baiyan2. The distributions of Ca, Fe, and Zn in the oat kernels ofBaiyan2 are shown in Fig. 3 and Table 2. The content of Ca(60.02 ± 0.97mg/100 g to 56.65 ± 1.60mg/100 g) is not significantlyaffected at the initial milling stage of 20 s before the milling degreereached 4.3 ± 0.15%, while it decreases by 10.66% after that (Fig. 3a),and remains stable from 30 s to 70 s (47.84 ± 0.69 mg/100 g to55.32 ± 1.23 mg/100 g) when the milling degree is between6.03 ± 0.29% and 13.92 ± 0.78%. All the results mentioned aboveindicate that Ca distributes evenly but its concentration is not highin the oat bran of Baiyan2.
In terms of Fe, the content (3.05 ± 0.20 to 2.90 ± 0.06 mg/100 g)is also little affected within the initial 20 s of milling, but it de-creases significantly from 30 s (2.78 ± 0.02 mg/100 g) to 70 s(1.87 ± 0.08 mg/100 g). The loss rate of Fe increases by 14.66% after30 s of milling and constantly rises until 57.25% by the time themilling time reaches 70 s (Fig. 3b), which indicates that Fe is
Table 2Effect of milling on the contents of nutrients in oat kernels.
Milling time (s) Milling degree (%) Ca (mg/100 g) Fe (mg/100 g) Zn (m
0 0 60.02 ± 0.97e 6.65 ± 0.21f 3.0510 2.19 ± 0.22 56.94 ± 1.10de 6.53 ± 0.08ef 3.0420 4.30 ± 0.15 56.65 ± 1.60d 6.19 ± 0.35e 2.9030 6.03 ± 0.29 47.84 ± 0.69a 5.51 ± 0.03d 2.7840 7.57 ± 0.52 52.04 ± 1.21b 4.79 ± 0.21c 2.7750 9.01 ± 0.30 50.27 ± 1.85ab 4.89 ± 0.63c 2.9060 11.01 ± 0.24 55.32 ± 1.23cd 3.56 ± 0.23b 2.4570 13.92 ± 0.78 53.04 ± 1.75bc 2.76 ± 0.06a 1.87
Results are expressed as the mean ± SD (n ¼ 3). Different letters represent the significanwere expressed as contents per 100 g of oat kernels (dry weight basis).
concentrated in the inner layer of oat bran. Moreover, the variationof content for Zn is different from those for Ca and Fe, which keepsthe initial level as long as 50 s (3.05 ± 0.20 mg/100 g to2.77 ± 0.24 mg/100 g). From 60 s onwards, the milling leads tosignificant, and the loss rate increases by 35.66% at 70 s(1.87 ± 0.08 mg/100 g) (Fig. 3c). This finding suggests that, unlikeFe, only a small amount of Zn evenly distributes in oat bran whilemost of the Zn is concentrated in the endosperm.
Altogether, removal of oat bran has relatively little detectableeffect on the content of Ca but leads to significant decrease of Feand Zn when the degree of milling is higher than 4.30 ± 0.15% and9.01 ± 0.55%, respectively. Compared with the loss rate of phyticacid (31.38 ± 0.31%) (Fig. 2), during the first 60 s of milling, thevalues for Ca (7.83 ± 1.23%) and Zn (19.67 ± 2.12%) are lower, butthat of Fe (46.47 ± 3.19%) is much higher (Fig. 3), which indicatesthat the removal of phytic acid from oat bran is accompanied by asignificant loss of Fe, instead of Ca and Zn. These findings partiallyagree with previous studies on rice, which suggested that theconcentration of Fe was higher than that of phytic acid in rice bran(Wang et al., 2011). Correlation analysis between phytic acid andminerals also supports this finding. The loss of phytic acid during60 s milling is not correlated with the content of Ca (r ¼ 0.6911,P > 0.05), but it is closely correlated with the contents of Fe(r ¼ 0.9421, P < 0.01) and Zn (r ¼ 0.8079, P < 0.05), namely, thecorrelation between phytic acid and Fe contents is the mostsignificant.
3.4. Effects of milling on the contents of other nutrients in Baiyan2
The effects of milling on the contents of other nutrientsincluding protein, lipid, starch and b-glucan in oat kernels are alsoanalyzed (Table 2). Firstly, the content of protein changes lightlyfrom an original value of 16.12 ± 0.09%, to 16.73 ± 0.15% when themilling degree reaches to 12%. The little effect of milling on proteinin oat bran is in agreement with previous studies of Wang et al.(2007), which suggested that protein was mainly concentrated inthe endosperm of oat kernels. Secondly, the content of lipid peaksat 5.97 ± 0.17% when milling for 10 s and then declines gradually,reaching a value of 5.03 ± 0.11% by 60 s, which can be explained bythe high density of lipid in the cortex or aleurone layer of oat kernel(Youngs, 1978). Thirdly, the content of starch grows significantlywith increase of milling time. After removal of oat bran, the contentof starch increases from 61.0 ± 1.1% to 66.8 ± 2.1%, suggesting thatstarch mainly exists in the endosperm of the oat kernel. Lastly, nodifference of b-glucan content is observed among different millingdegrees of Baiyan2, indicating that the distribution of b-glucanthere is homogenous. Besides, other researchers believed that thecontent of b-glucan decreased with the extension of milling timeand reported that the 45 s of milling resulted in a significant declineof b-glucan content from 3.47% to 2.78% (Hu et al., 2009), whilesome opposite results were still detected, demonstrating the low
g/100 g) Protein (%) Lipid (%) Starch (%) b-glucan (%)
± 0.20c 16.21 ± 0.25bc 5.38 ± 0.04cd 61.0 ± 1.1a 4.16 ± 0.08a
± 0.04c 16.73 ± 0.15d 5.97 ± 0.17e 63.3 ± 1.6ab 4.20 ± 0.08a
± 0.06c 16.57 ± 0.11cd 5.61 ± 0.06d 64.9 ± 1.1bc 4.18 ± 0.10a
± 0.02bc 16.24 ± 0.31bc 5.32 ± 0.08c 66.1 ± 1.1bcd 4.19 ± 0.17a
± 0.24bc 16.10 ± 0.08ab 5.30 ± 0.16c 65.6 ± 1.7bc 4.13 ± 0.23a
± 0.20c 16.12 ± 0.09ab 5.21 ± 0.10bc 66.3 ± 2.6bcd 4.26 ± 0.07a
± 0.02b 16.13 ± 0.14ab 5.03 ± 0.11ab 66.8 ± 2.1cd 4.33 ± 0.13a
± 0.08a 15.78 ± 0.10a 4.90 ± 0.17a 69.0 ± 2.2d 4.22 ± 0.05a
t differences at P < 0.05. The levels of protein, lipase, starch, b-glucan and minerals

Fig. 4. Effect of milling on the hardness of the cooked oat kernels of Baiyan2. Resultsare expressed as the mean ± SD (n ¼ 3). Different letters represented the significantdifference at P < 0.05.
H. Li et al. / Journal of Cereal Science 60 (2014) 549e554 553
concentration of b-glucan in oat bran (Doehlert and Moore, 1997).In these reports, the distribution of oat b-glucan was differentprimarily because of the different cultivars of oat. Overall, in nakedoat kernel of Baiyan2, protein, b-glucan and starch distribute higherin endosperm, while lipid mainly exists in oat bran.
3.5. Effects of milling on the hardness of cooked oat
Analysis of milling characteristics shows that the hardness of oatgradually decreases from outside to the core (Fig. 1). This propertyis much more apparent for Baiyan2 since its milling degree (massloss) increases by approximately 2% per 10 s at the initial millingstage until 30 s and then reaches up to 7% per 10 s after 60 s ofmilling (Fig. 1). The data suggests that the removal of oat bran maybe a goodway to improve the taste of cooked oat. Consequently, thehardness of cooked Baiyan2 with different milling times is inves-tigated to illustrate the effect of milling on the taste properties ofcooked oat. As shown in Fig. 4, the hardness of cooked Baiyan2decreases as the milling time increases. By the time of 10 s whenthe degree of milling is 2.2 ± 0.2%, the hardness of cooked oat hassignificantly fallen to 5.83 ± 0.23 kgf (P < 0.05) from the originalvalue of 6.61 ± 0.15 kgf. Then, the hardness decreases gradually to5.31 ± 0.04 kgf after the oat bran is removed (60 s of milling), being19.7% lower than the value of kernels without milling. The resultsindicate that milling of oat kernels can reduce the hardness ofcooked oat, thus improving its taste property.
4. Conclusion
According to the present study of three oat cultivars, Baiyan2required the longest milling time (60 s) to remove oat bran, whileLinna and Bayou1 required shorter milling timewith 50 s. As for themain “anti-nutrient” compositiondphytic acid, the contents in allthe three oat cultivars decreased with prolonging of milling timeand distributed unevenly in brown oat with a higher concentrationin oat bran. The levels of phytic acid in oat bran of three cultivarsranged from 27% to 53%, among which Bayou1 was the highest(52.92 ± 10.27%), followed by Baiyan2 (31.38 ± 0.31%) and Linna(27.81 ± 4.62%). After 70 s of milling, only 30%e60% of phytic acidwas left in oat kernels, confirming that the content of phytic acidreduced fromouter to inner layer of the oat kernel. In terms of othernutritional components, the contents of Ca, Zn, protein, starch andb-glucan were not obviously affected during the removal of oatbran, while Fe and lipid were reduced significantly. Additionally,the removal of oat bran reduced the hardness of cooked oat by19.7%. In conclusion, the bran of oat accounted for around 12% oftotal weight of the oat kernel, taking 50e60 s to be removed. Thelevel of phtyic acid could be reduced by 27%e53% after the removalof the oat bran, accompanied by significant decreases of Fe and
lipid. Optimum milling procedures could remove a high content ofphytic acid from oat while maintaining the nutritional value andimproving the texture of cooked oat significantly, which offersmeaningful information for relevant oat processing.
Acknowledgments
This research was funded by the Chinese Agricultural ResearchSystem (CARS-08-D-3) and Special Fund for Agro-scientificResearch in the Public Interest (201403063-3).
References
Berg, A., K€onig, D., Deibert, P., Grathwohl, D., Baumstark, M.W., Franz, I.W., 2003.Effect of an oat bran enriched diet on the atherogenic lipid profile in patientswith an increased coronary heart disease risk. Ann. Nutr. Metab. 47, 306e311.
Bilgiçli, N., Elgun, A., Turker, S., 2006. Effects of various phytase sources on phyticacid content mineral extractability and protein digestibility of tarhana. FoodChem. 98, 329e337.
Brindzova, L., �Certik, M., Rapta, P., Zalibera, M., Mikulajova, A., Takacsova, M., 2008.Antioxidant activity, b-glucan and lipid contents of oat varieties. Czech J. FoodSci. 26, 163e173.
Chen, J., He, J., Wildman, R.P., Reynolds, K., Streiffer, W., 2006. A randomizedcontrolled trial of dietaryfiber intake on serum lipids. Eur. J. Clin. Nutr. 60, 62e68.
Dai, F., Wang, J.M., Zhang, S.H., Xu, Z.Z., Zhang, G.P., 2007. Genotypic and environ-mental variation in phytic acid content and its relation to protein content andmalt quality in barley. Food Chem. 105, 606e611.
Doehlert, D.C., McMullen, M.S., 2000. Genotypic and environmental effects on oatmilling characteristics and groat hardness. Cereal Chem. 77, 148e154.
Doehlert, D.C., Moore, W.R., 1997. Composition of oat bran and flour prepared bythree different mechanisms of dry milling. Cereal Chem. 74, 403e406.
Garc~oAa-Estepa, R.M., Guerra-HernaAndez, E., Garc~oAa-Villanova, B., 1999. Phyticacid content in milled cereal products and breads. Food Res. Int. 32, 217e221.
Girardet, N., Webster, F.H., 2011. Oat milling: specifications, storage, and processing.In: Webster, F.H., Peter, J. (Eds.), OATS: Chemistry and Technology. AACC In-ternational, Inc., New York, pp. 301e319.
Hu, X.Z., Wei, Y.M., Ren, C.Z., Zhao, J., 2009. Relationship between kernel size andshape and lipase activity of naked oat before and after peeling treatment. J. Sci.Food Agric. 89, 1424e1427.
Lamberts, L., De-Bie, E., Vandeputte, G.E., Veraverbeke, W.S., Derycke, V., De-Man, W., Delcour, J.A., 2007. Effect of milling on colour and nutritional prop-erties of rice. Food Chem. 100, 1496e1503.
Lopez, H.W., Leenhardt, F., Coudray, C., Remesy, C., 2002. Minerals and phytic acidinteractions: is it a real problem for human nutrition? Int. J. Food Sci. Technol.37, 727e739.
Liang, J., Li, Z., Tsuji, K., Nakano, K., Nout, M.J.R., Hamer, R.J., 2008. Milling charac-teristics and distribution of phytic acid and zinc in long-, medium- and short-grain rice. J. Cereal Sci. 48, 83e91.
Liu, Z., Cheng, F., Zhang, G., 2005a. Grain phytic acid content in japonica rice asaffected by cultivar and environment and its relation to protein content. FoodChem. 89, 49e52.
Liu, Z.H., Cheng, F.M., Cheng, W.D., Zhang, G.P., 2005b. Positional variations in phyticacid and protein within a panicle of japonica rice. J. Cereal Sci. 41, 297e303.
Ma, J., Wang, J., Zhang, L., 2010. Determination of the content of total starch in feedby colorimetric method with 3,5-dinitrosalicylic acid. China Feed 14, 38e40.
Madhujith, T., Shahidi, F., 2007. Antioxidative and antiproliferative properties ofselected barley (Hordeumvulgare L.) cultivars and their potential for inhibitionof low-density lipoprotein (LDL) cholesterol oxidation. J. Agric. Food Chem. 55,5018e5024.
Ockenden, I., Dorsch, J.A., Reid, M.M., Lin, L., Grant, L.K., Raboy, V., Lott, J.N.A., 2004.Characterization of the storage of phosphorus, inositol phosphate and cations ingrain tissues of four barley (Hordeumvulgare L.) low phytic acid genotypes. PlantSci. 167, 1131e1142.
Perdon, A.A., Siebenmorgen, T.J., Mauromoustakos, A., Griffin, V.K., Johnson, E.R.,2001. Degree of milling effect on rice pasting properties. Cereal Chem. 78,205e209.
Peterson, D.M., 2001. Oat antioxidants. J. Cereal Sci. 33, 115e129.Singh-Gujral, H., Singh, J., Singh Sidhu, J., Singh, N., 2002. Effect of milling variables
on the degree of milling of unparboiled and parboiledrice. Int. J. Food Sci.Technol. 5, 193e204.
Slavin, J.L., Jacobs, D., Marquart, L., 2001. Grain processing and nutrition. Crit. Rev.Biotechnol. 21, 49e66.
Steadman, K.J., Burgoon, M.S., Lewis, B.A., Edwardson, S.E., Obendorf, R.L., 2001.Minerals, phytic acid, tannin and rutin in buckwheat seed milling fractions.J. Sci. Food Agric. 81, 1094e1100.
Tapola, N., Karvonen, H., Niskanen, L., Mikola, M., Sarkkinen, E., 2005. Glycemicresponses of oat bran products in type 2 diabetic patients. Nutr. Metab. Car-diovasc. Dis. 15, 255e261.
Wadsworth, J.I., 1994. Rice: Science and Technology. Marcel Dekker, Inc., New York.Wang, R., Koutinas, A.A., Campbell, G.M., 2007. Dry processing of oats-application of
dry milling. J. Food Eng. 82, 559e567.

H. Li et al. / Journal of Cereal Science 60 (2014) 549e554554
Wang, K.M., Wu, J.G., Li, G., Zhang, D.P., Yang, Z.W., Shi, C.H., 2011. Distribution ofphytic acid and mineral elements in three indica rice (Oryza sativa L.) cultivars.J. Cereal Sci. 54, 116e121.
Wu, P., Zhao, T., Tian, J., 2010. Phytic acid contents of wheat flours from differentmill streams. Agric. Sci. China 9, 1684e1688.
Wu, W., Cheng, F., Liu, Z., Wei, K., 2007. Difference of phytic acid content and itsrelation to four protein composition contents in grains of twenty-nine
japonica rice varieties from Jiangsu and Zhejiang provinces, China. Rice Sci.14, 311e314.
Youngs, V.L., 1978. Oat lipids. Cereal Chem. 55, 591e597.Zdu�nczyk, Z., Flis, M., Zieli�nski, H., Wr�sblewska, M., Antoszkiewicz, Z., Ju�skiewicz, J.,
2006. In vitro antioxidant activities of barley, huskedoat, naked oat, triticale,and buckwheat wastes and their influence on the growth and biomarkers ofantioxidant status in rats. J. Agric. Food Chem. 54, 4168e4175.