migration in ukraine facts & figures · pdf fileseptember 2011 migration for the benefit...
TRANSCRIPT
SEPTEMBER 2011
MIGRATION FOR THE BENEFIT OF ALL
International Organization for Migration (IOM)Mission in Ukraine
MIGRATION IN UKRAINEFACTS & FIGURES
General Information
IOM
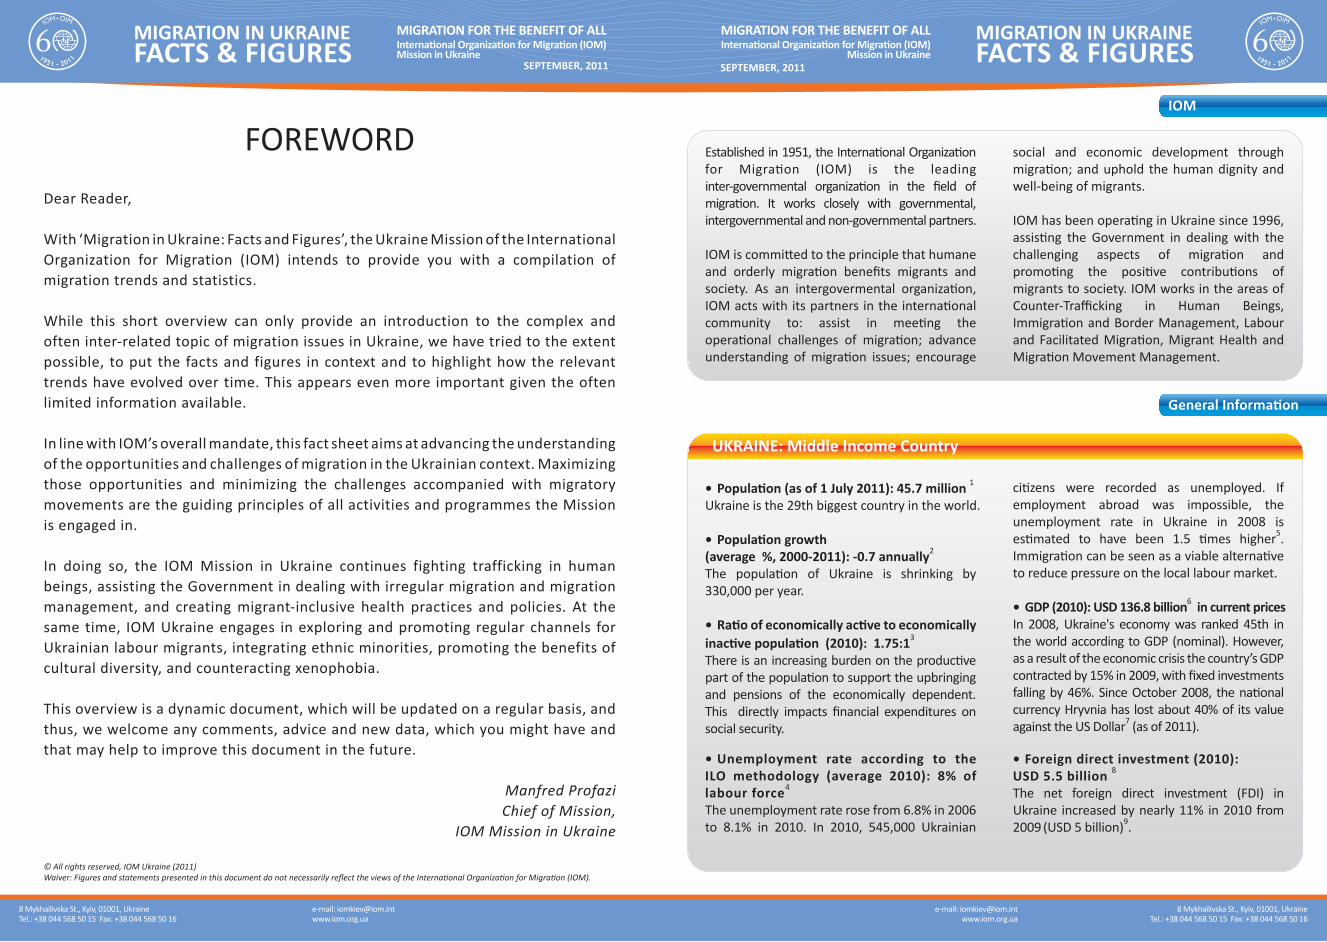
UKRAINE: Middle Income Country
• Population (as of 1 July 2011): 45.7 million 1 Ukraine is the 29th biggest country in the world.
• Population growth (average %, 2000-2011): -0.7 annually2
The population of Ukraine is shrinking by 330,000 per year.
• Ratio of economically active to economically inactive population (2010): 1.75:13 There is an increasing burden on the productive part of the population to support the upbringing and pensions of the economically dependent. This directly impacts financial expenditures on social security.
• Unemployment rate according to the ILO methodology (average 2010): 8% of labour force4
The unemployment rate rose from 6.8% in 2006 to 8.1% in 2010. In 2010, 545,000 Ukrainian
citizens were recorded as unemployed. If employment abroad was impossible, the unemployment rate in Ukraine in 2008 is estimated to have been 1.5 times higher5. Immigration can be seen as a viable alternative to reduce pressure on the local labour market.
• GDP (2010): USD 136.8 billion6 in current pricesIn 2008, Ukraine's economy was ranked 45th in the world according to GDP (nominal). However, as a result of the economic crisis the country’s GDP contracted by 15% in 2009, with fixed investments falling by 46%. Since October 2008, the national currency Hryvnia has lost about 40% of its value against the US Dollar7 (as of 2011).
• Foreign direct investment (2010):USD 5.5 billion 8
The net foreign direct investment (FDI) in Ukraine increased by nearly 11% in 2010 from 2009 (USD 5 billion)9.
Established in 1951, the International Organization for Migration (IOM) is the leading inter-governmental organization in the field of migration. It works closely with governmental, intergovernmental and non-governmental partners.
IOM is committed to the principle that humane and orderly migration benefits migrants and society. As an intergovermental organization, IOM acts with its partners in the international community to: assist in meeting the operational challenges of migration; advance understanding of migration issues; encourage
social and economic development through migration; and uphold the human dignity and well-being of migrants.
IOM has been operating in Ukraine since 1996, assisting the Government in dealing with the challenging aspects of migration and promoting the positive contributions of migrants to society. IOM works in the areas of Counter-Trafficking in Human Beings, Immigration and Border Management, Labour and Facilitated Migration, Migrant Health and Migration Movement Management.
8 Mykhailivska St., Kyiv, 01001, UkraineTel.: +38 044 568 50 15 Fax: +38 044 568 50 16
8 Mykhailivska St., Kyiv, 01001, UkraineTel.: +38 044 568 50 15 Fax: +38 044 568 50 16
e-mail: [email protected]
e-mail: [email protected]
FOREWORDDear Reader,
With ‘Migration in Ukraine: Facts and Figures’, the Ukraine Mission of the International Organization for Migration (IOM) intends to provide you with a compilation of migration trends and statistics.
While this short overview can only provide an introduction to the complex and often inter-related topic of migration issues in Ukraine, we have tried to the extent possible, to put the facts and figures in context and to highlight how the relevant trends have evolved over time. This appears even more important given the often limited information available.
In line with IOM’s overall mandate, this fact sheet aims at advancing the understanding of the opportunities and challenges of migration in the Ukrainian context. Maximizing those opportunities and minimizing the challenges accompanied with migratory movements are the guiding principles of all activities and programmes the Mission is engaged in.
In doing so, the IOM Mission in Ukraine continues fighting trafficking in human beings, assisting the Government in dealing with irregular migration and migration management, and creating migrant-inclusive health practices and policies. At the same time, IOM Ukraine engages in exploring and promoting regular channels for Ukrainian labour migrants, integrating ethnic minorities, promoting the benefits of cultural diversity, and counteracting xenophobia.
This overview is a dynamic document, which will be updated on a regular basis, and thus, we welcome any comments, advice and new data, which you might have and that may help to improve this document in the future.
Manfred ProfaziChief of Mission,
IOM Mission in Ukraine
© All rights reserved, IOM Ukraine (2011)Waiver: Figures and statements presented in this document do not necessarily reflect the views of the International Organization for Migration (IOM).
SEPTEMBER, 2011 SEPTEMBER, 2011
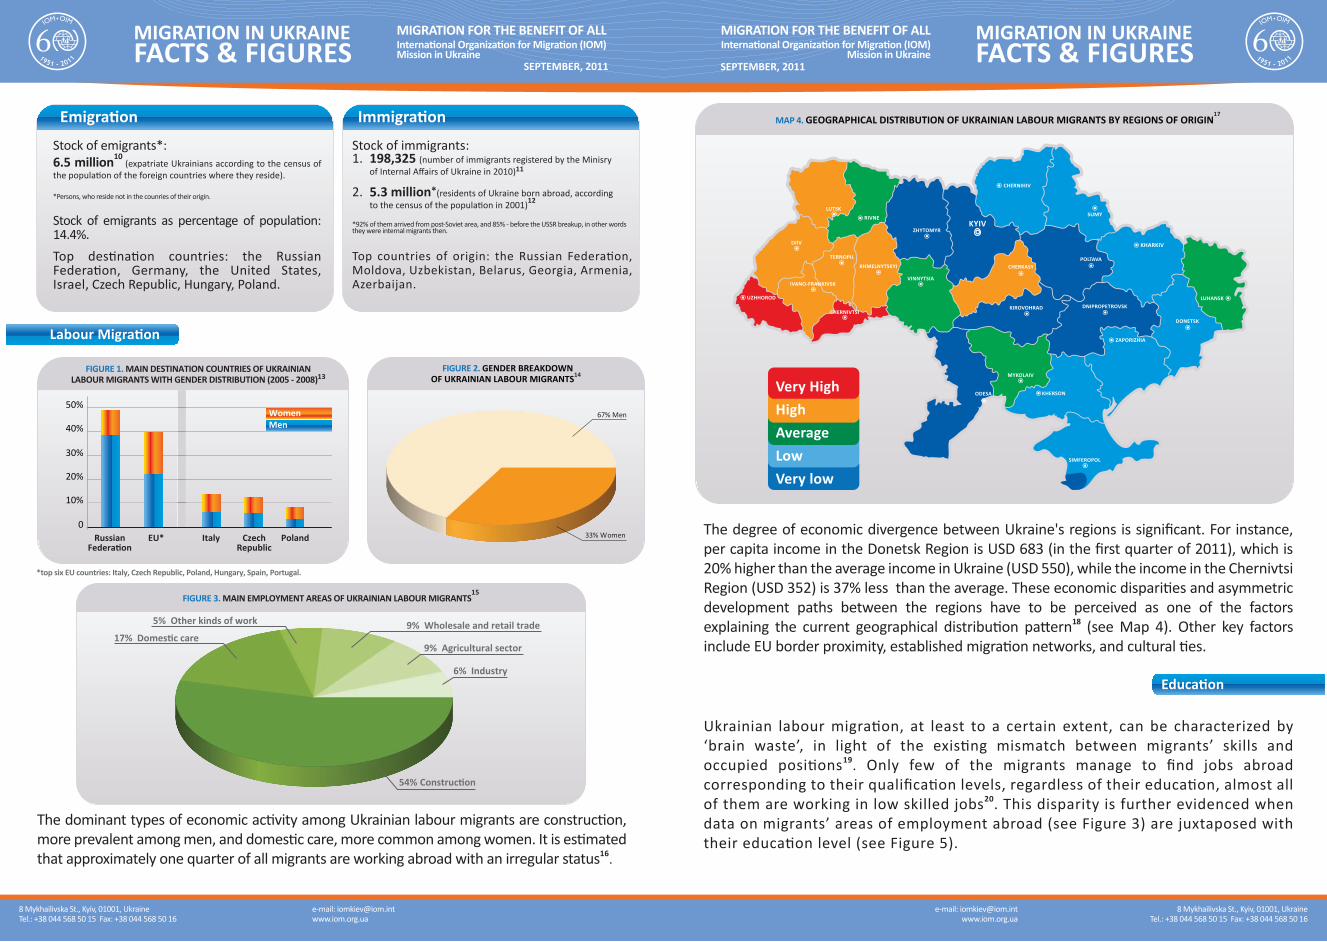
MAP 4. GEOGRAPHICAL DISTRIBUTION OF UKRAINIAN LABOUR MIGRANTS BY REGIONS OF ORIGIN17
Very low
AverageHigh
Low
Very High
Education
The degree of economic divergence between Ukraine's regions is significant. For instance, per capita income in the Donetsk Region is USD 683 (in the first quarter of 2011), which is 20% higher than the average income in Ukraine (USD 550), while the income in the Chernivtsi Region (USD 352) is 37% less than the average. These economic disparities and asymmetric development paths between the regions have to be perceived as one of the factors explaining the current geographical distribution pattern18 (see Map 4). Other key factors include EU border proximity, established migration networks, and cultural ties.
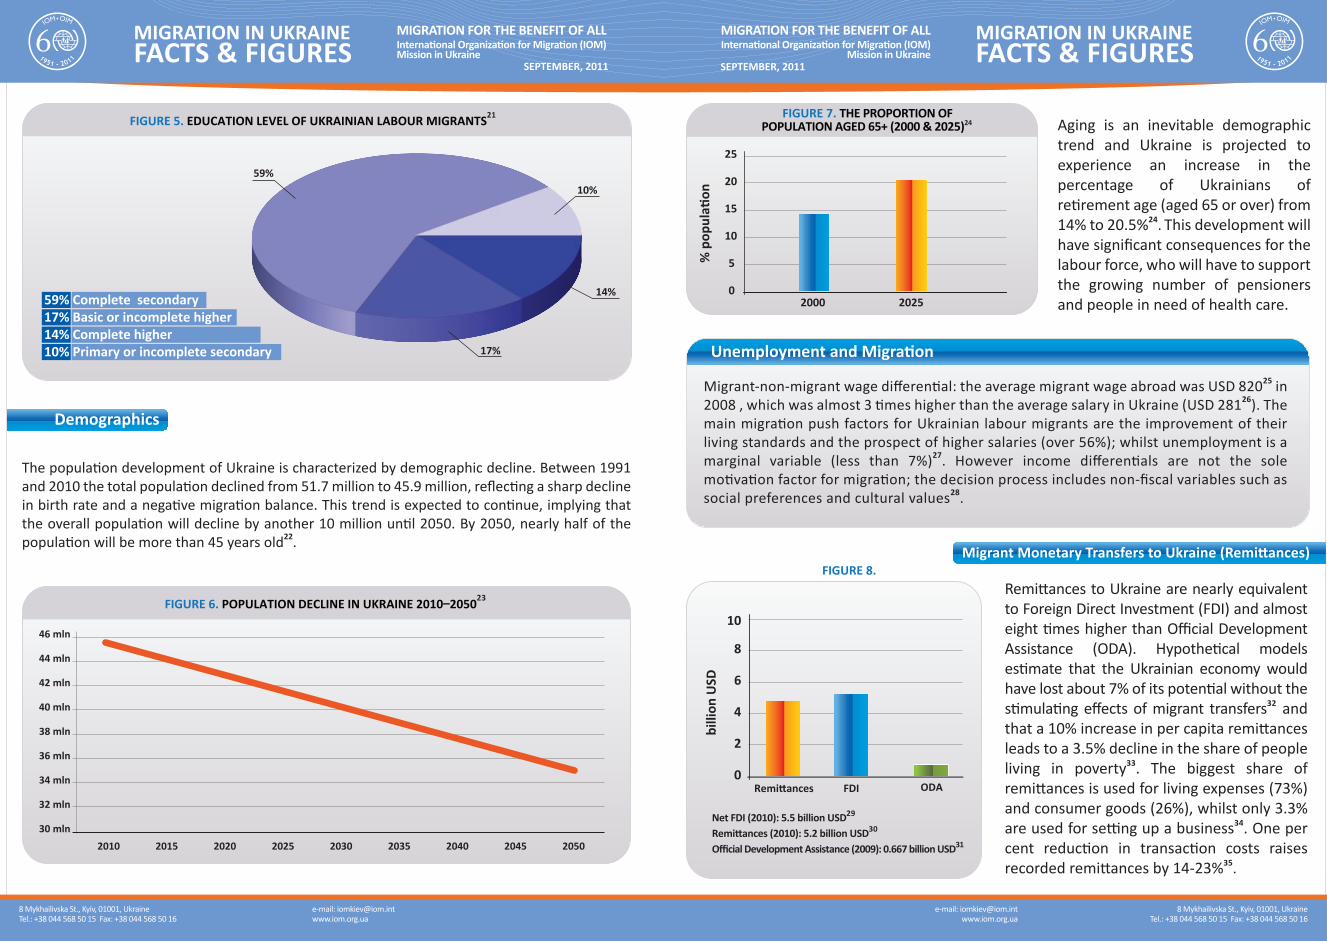
Ukrainian labour migration, at least to a certain extent, can be characterized by ‘brain waste’, in light of the existing mismatch between migrants’ skills and occupied positions19. Only few of the migrants manage to find jobs abroad corresponding to their qualification levels, regardless of their education, almost all of them are working in low skilled jobs20. This disparity is further evidenced when data on migrants’ areas of employment abroad (see Figure 3) are juxtaposed with their education level (see Figure 5).
Labour Migration
FIGURE 2. GENDER BREAKDOWNOF UKRAINIAN LABOUR MIGRANTS14
33% Women
67% Men
FIGURE 1. MAIN DESTINATION COUNTRIES OF UKRAINIANLABOUR MIGRANTS WITH GENDER DISTRIBUTION (2005 - 2008)13
*top six EU countries: Italy, Czech Republic, Poland, Hungary, Spain, Portugal.
RussianFederation
Italy CzechRepublic
PolandEU*0
10%
20%
30%
40%
50%WomenMen
The dominant types of economic activity among Ukrainian labour migrants are construction, more prevalent among men, and domestic care, more common among women. It is estimated that approximately one quarter of all migrants are working abroad with an irregular status16.
Emigration Immigration
Stock of emigrants*:6.5 million10
(expatriate Ukrainians according to the census of the population of the foreign countries where they reside).
*Persons, who reside not in the counries of their origin.
Stock of emigrants as percentage of population: 14.4%.Top destination countries: the Russian Federation, Germany, the United States, Israel, Czech Republic, Hungary, Poland.
Stock of immigrants:1. 198,325 (number of immigrants registered by the Minisry of Internal Affairs of Ukraine in 2010)11
2. 5.3 million*(residents of Ukraine born abroad, according to the census of the population in 2001)12
*92% of them arrived from post-Soviet area, and 85% - before the USSR breakup, in other words they were internal migrants then.
Top countries of origin: the Russian Federation, Moldova, Uzbekistan, Belarus, Georgia, Armenia, Azerbaijan.
FIGURE 3. MAIN EMPLOYMENT AREAS OF UKRAINIAN LABOUR MIGRANTS15
54% Construction
6% Industry
9% Agricultural sector
9% Wholesale and retail trade5% Other kinds of work
17% Domestic care
8 Mykhailivska St., Kyiv, 01001, UkraineTel.: +38 044 568 50 15 Fax: +38 044 568 50 16
8 Mykhailivska St., Kyiv, 01001, UkraineTel.: +38 044 568 50 15 Fax: +38 044 568 50 16
e-mail: [email protected]
e-mail: [email protected]
SEPTEMBER, 2011 SEPTEMBER, 2011
Demographics
FIGURE 5. EDUCATION LEVEL OF UKRAINIAN LABOUR MIGRANTS21
17%
59%10%
14%59% Complete secondary17% Basic or incomplete higher14% Complete higher10% Primary or incomplete secondary
The population development of Ukraine is characterized by demographic decline. Between 1991 and 2010 the total population declined from 51.7 million to 45.9 million, reflecting a sharp decline in birth rate and a negative migration balance. This trend is expected to continue, implying that the overall population will decline by another 10 million until 2050. By 2050, nearly half of the population will be more than 45 years old22.
FIGURE 6. POPULATION DECLINE IN UKRAINE 2010–205023
2010 2015 2020 2025 2030 2035 2040 2045 205030 mln
32 mln
34 mln
36 mln
38 mln
40 mln
42 mln
44 mln
46 mln
Unemployment and Migration
Migrant-non-migrant wage differential: the average migrant wage abroad was USD 82025 in 2008 , which was almost 3 times higher than the average salary in Ukraine (USD 28126). The main migration push factors for Ukrainian labour migrants are the improvement of their living standards and the prospect of higher salaries (over 56%); whilst unemployment is a marginal variable (less than 7%)27. However income differentials are not the sole motivation factor for migration; the decision process includes non-fiscal variables such as social preferences and cultural values28.
Remittances to Ukraine are nearly equivalent to Foreign Direct Investment (FDI) and almost eight times higher than Official Development Assistance (ODA). Hypothetical models estimate that the Ukrainian economy would have lost about 7% of its potential without the stimulating effects of migrant transfers32 and that a 10% increase in per capita remittances leads to a 3.5% decline in the share of people living in poverty33. The biggest share of remittances is used for living expenses (73%) and consumer goods (26%), whilst only 3.3% are used for setting up a business34. One per cent reduction in transaction costs raises recorded remittances by 14-23%35.
FIGURE 7. THE PROPORTION OFPOPULATION AGED 65+ (2000 & 2025)24
% p
opul
ation
20000
10
5
15
25
20
2025
Aging is an inevitable demographic trend and Ukraine is projected to experience an increase in the percentage of Ukrainians of retirement age (aged 65 or over) from 14% to 20.5%24. This development will have significant consequences for the labour force, who will have to support the growing number of pensioners and people in need of health care.
Migrant Monetary Transfers to Ukraine (Remittances)FIGURE 8.
FDIRemittances ODA0
4
2
6
10
8
billi
on U
SD
Net FDI (2010): 5.5 billion USD29
Remittances (2010): 5.2 billion USD30
Official Development Assistance (2009): 0.667 billion USD31
8 Mykhailivska St., Kyiv, 01001, UkraineTel.: +38 044 568 50 15 Fax: +38 044 568 50 16
8 Mykhailivska St., Kyiv, 01001, UkraineTel.: +38 044 568 50 15 Fax: +38 044 568 50 16
e-mail: [email protected]
e-mail: [email protected]
SEPTEMBER, 2011 SEPTEMBER, 2011
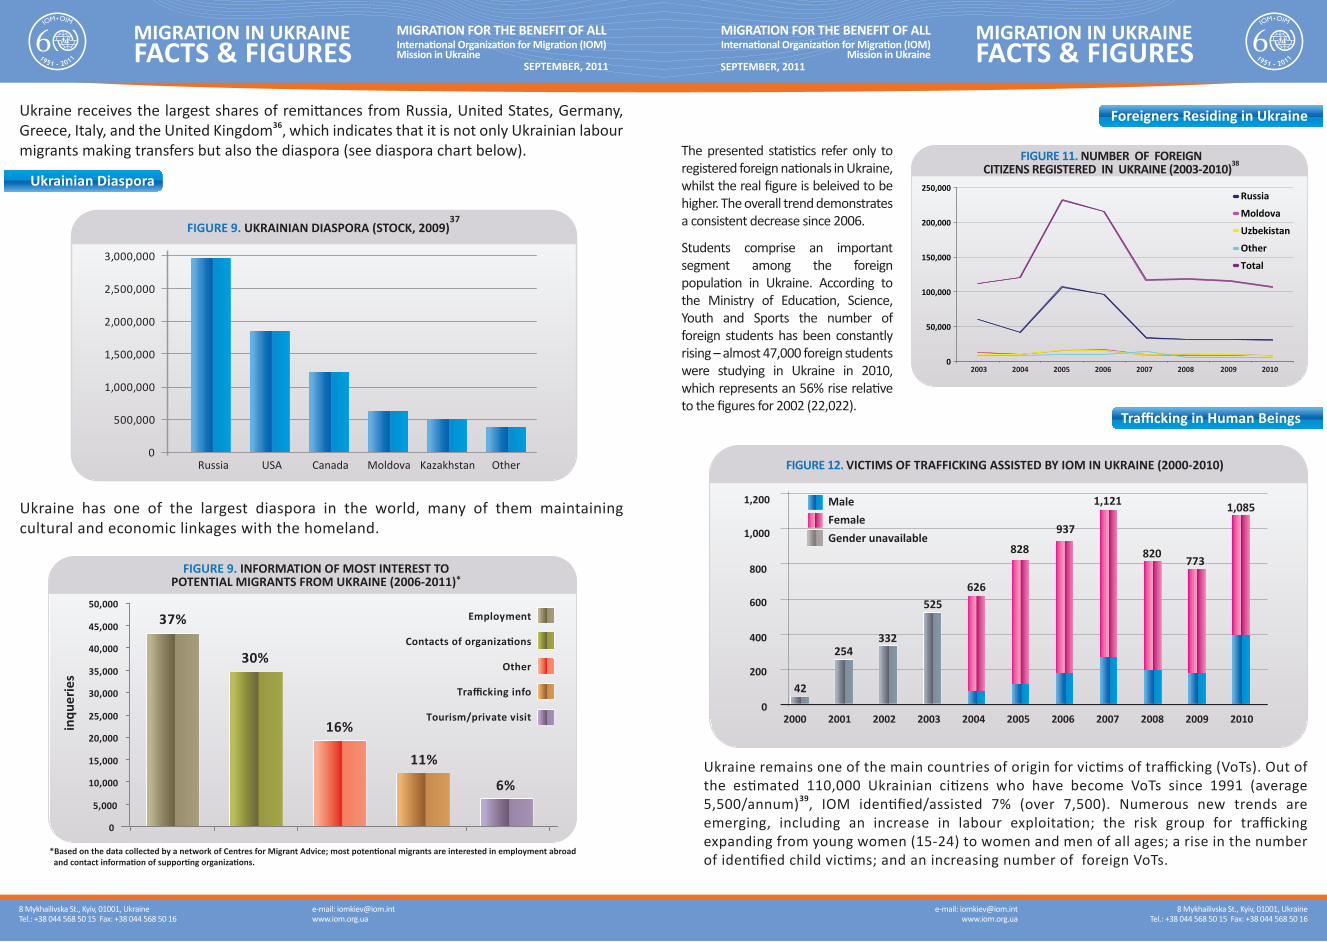
FIGURE 9. UKRAINIAN DIASPORA (STOCK, 2009)37
0
500,000
Russia USA Canada Moldova Kazakhstan
1,000,000
1,500,000
2,000,000
2,500,000
3,000,000
Other
Ukrainian Diaspora
Ukraine has one of the largest diaspora in the world, many of them maintaining cultural and economic linkages with the homeland.
Ukraine receives the largest shares of remittances from Russia, United States, Germany, Greece, Italy, and the United Kingdom36, which indicates that it is not only Ukrainian labour migrants making transfers but also the diaspora (see diaspora chart below).
FIGURE 9. INFORMATION OF MOST INTEREST TOPOTENTIAL MIGRANTS FROM UKRAINE (2006-2011)*
*Based on the data collected by a network of Centres for Migrant Advice; most potentional migrants are interested in employment abroad and contact information of supporting organizations.
0
5,000
10,000
15,000
20,000
25,000
30,000
35,000
40,000
45,000
50,000
37%
30%
11%
6%
16%
Employment
Contacts of organizations
Trafficking info
Other
Tourism/private visit
inqu
erie
s
254332
525626
MaleFemaleGender unavailable
828 820 773
937
1,121 1,085
42
FIGURE 12. VICTIMS OF TRAFFICKING ASSISTED BY IOM IN UKRAINE (2000-2010)
1,200
1,000
800
600
400
200
2000 2001 2002 2003 2004 2005 2006 2007 2008 2009 20100
Trafficking in Human Beings
Foreigners Residing in Ukraine
The presented statistics refer only to registered foreign nationals in Ukraine, whilst the real figure is beleived to be higher. The overall trend demonstrates a consistent decrease since 2006.
Students comprise an important segment among the foreign population in Ukraine. According to the Ministry of Education, Science, Youth and Sports the number of foreign students has been constantly rising – almost 47,000 foreign students were studying in Ukraine in 2010, which represents an 56% rise relative to the figures for 2002 (22,022).
Ukraine remains one of the main countries of origin for victims of trafficking (VoTs). Out of the estimated 110,000 Ukrainian citizens who have become VoTs since 1991 (average 5,500/annum)39, IOM identified/assisted 7% (over 7,500). Numerous new trends are emerging, including an increase in labour exploitation; the risk group for trafficking expanding from young women (15-24) to women and men of all ages; a rise in the number of identified child victims; and an increasing number of foreign VoTs.
FIGURE 11. NUMBER OF FOREIGNCITIZENS REGISTERED IN UKRAINE (2003-2010)38
0
50,000
100,000
150,000
200,000
250,000Russia
Moldova
Uzbekistan
Other
Total
2003 2004 2005 2006 2007 2008 2009 2010
8 Mykhailivska St., Kyiv, 01001, UkraineTel.: +38 044 568 50 15 Fax: +38 044 568 50 16
8 Mykhailivska St., Kyiv, 01001, UkraineTel.: +38 044 568 50 15 Fax: +38 044 568 50 16
e-mail: [email protected]
e-mail: [email protected]
SEPTEMBER, 2011 SEPTEMBER, 2011
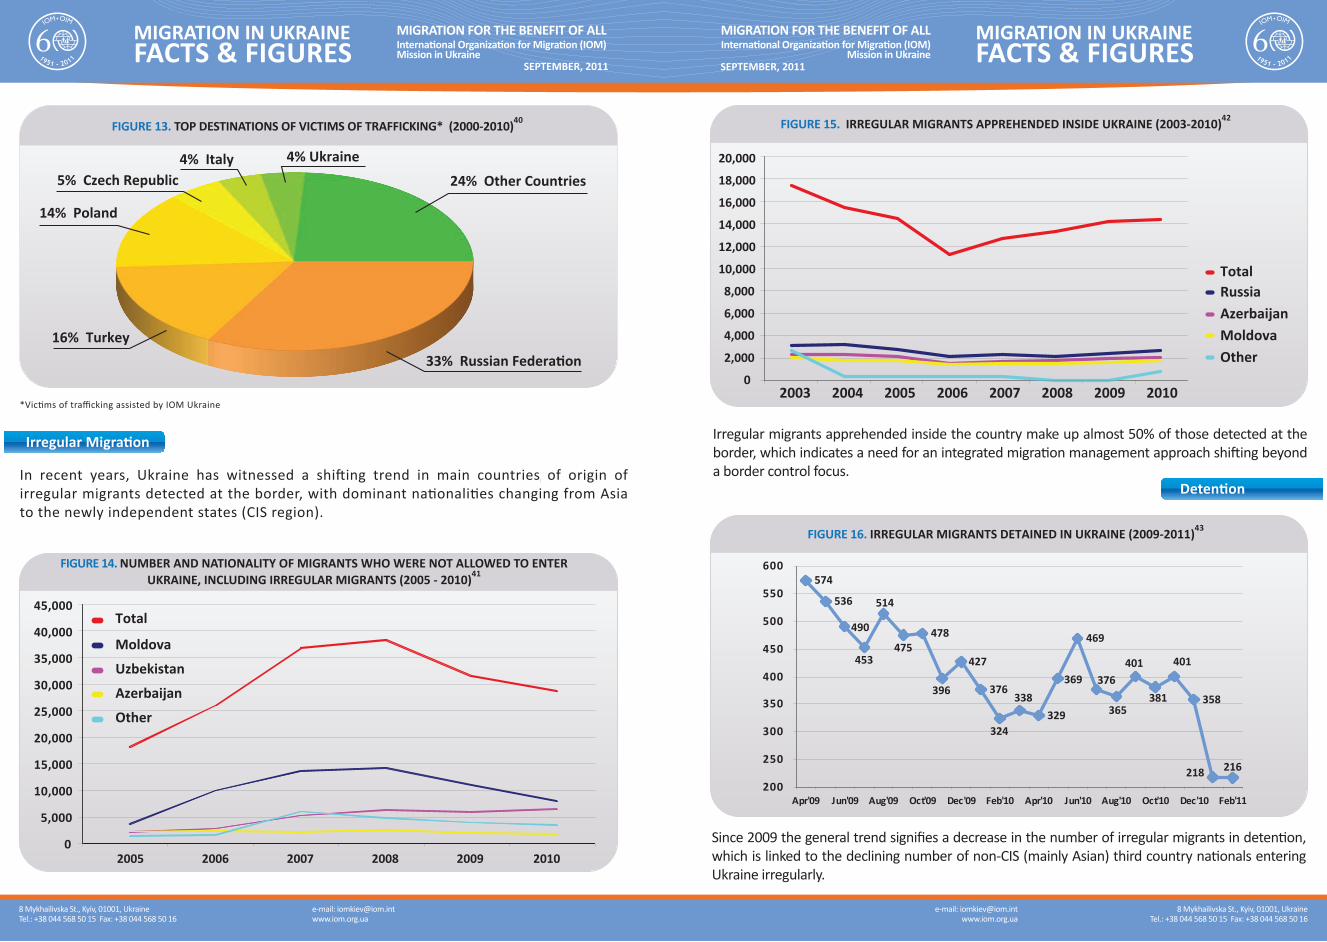
Irregular Migration
In recent years, Ukraine has witnessed a shifting trend in main countries of origin of irregular migrants detected at the border, with dominant nationalities changing from Asia to the newly independent states (CIS region).
*Victims of trafficking assisted by IOM Ukraine
Irregular migrants apprehended inside the country make up almost 50% of those detected at the border, which indicates a need for an integrated migration management approach shifting beyond a border control focus.
FIGURE 13. TOP DESTINATIONS OF VICTIMS OF TRAFFICKING* (2000-2010)40
24% Other Countries
33% Russian Federation16% Turkey
14% Poland
5% Czech Republic4% Italy 4% Ukraine
Detention
Since 2009 the general trend signifies a decrease in the number of irregular migrants in detention, which is linked to the declining number of non-CIS (mainly Asian) third country nationals entering Ukraine irregularly.
FIGURE 16. IRREGULAR MIGRANTS DETAINED IN UKRAINE (2009-2011)43
574
536
490
514
478
396
427
376
329
369
469
365358
453475
324
338376
401
381
401
218 216
200
250
300
350
400
450
500
550
600
Apr'09 Jun'09 Aug'09 Oct'09 Dec'09 Feb'10 Apr'10 Jun'10 Aug'10 Oct'10 Dec'10 Feb'11
FIGURE 15. IRREGULAR MIGRANTS APPREHENDED INSIDE UKRAINE (2003-2010)42
0
2,000
4,000
6,000
8,000
10,000
12,000
14,000
16,000
18,000
20,000
2003 2004 2005 2006 2007 2008 2009 2010
RussiaAzerbaijanMoldovaOther
Total
FIGURE 14. NUMBER AND NATIONALITY OF MIGRANTS WHO WERE NOT ALLOWED TO ENTERUKRAINE, INCLUDING IRREGULAR MIGRANTS (2005 - 2010)41
0
5,000
10,000
15,000
20,000
25,000
30,000
35,000
40,000
45,000
2005 2006 2007 2008 2009 2010
Azerbaijan
Moldova
Uzbekistan
Other
Total
8 Mykhailivska St., Kyiv, 01001, UkraineTel.: +38 044 568 50 15 Fax: +38 044 568 50 16
8 Mykhailivska St., Kyiv, 01001, UkraineTel.: +38 044 568 50 15 Fax: +38 044 568 50 16
e-mail: [email protected]
e-mail: [email protected]
SEPTEMBER, 2011 SEPTEMBER, 2011
References
1. State Statistics Committee of Ukraine (SSC), 2011 2. SSC, 20113. SSC, 20114. SSC, 20115. Ukrainian Centre for Social Reforms (UCSR), SSC, “Ukrainian External Labour Migration”, 20096. SSC, Express Issue No 77, dd. 31 March 20117. World Bank, 20108. SSC, 2011 9. SSC, 2011 10. World Bank Factbook (WBF), 2011; O. Malynovska, National Institute of Strategic Studies, 201111. Ministry of Internal Affairs of Ukraine (MOI), 201012. UNPD, 2009; O. Malynovska, National Institute of Strategic Studies, 201113. UCSR, SSC, “Ukrainian External Labour Migration”, 200914. UCSR, SSC, “Ukrainian External Labour Migration”, 200915. UCSR, SSC, “Ukrainian External Labour Migration”, 2009 (includes regular and irregular migrants)16. UCSR, SSC, “Ukrainian External Labour Migration”, 200917. UCSR, SSC, “Ukrainian External Labour Migration”, 200918. M. Hoffman & D. Reichel, “Ukrainian Migration: An analysis of migration movements to, through and from Ukraine”, 201119. O. Malynovska, “International migration in contemporary Ukraine: Trends and policy”, 200420. European Training Centre (ETF), 2009
21. UCSR, SSC, “Ukrainian External Labour Migration”, 200922. UNDESA, 200923. M. Hoffman & D. Reichel, “Ukrainian Migration: An analysis of migration movements to, through and from Ukraine”, 201124. World Bank, 200725. UCSR, SSC, “Ukrainian External Labour Migration”, 200926. SSC, 201127. ETF, 2009 28. A. Manssoor, IBRD/World Bank, “Migration and Remittances: Eastern Europe and the Former Soviet Union”, 2007 29. SSC, 201130. WBF, 2011 31. Organization for Economic Co-operation and Development (OECD), 201132. Centre for Social and Economic Research (CASE), 200833. World Bank, 201034. ETF, 200935. C. Freund (World Bank), N.Spatafora (IMF), 200836. National Bank of Ukraine, 201037. Ministry of Foreign Affairs of Ukraine, 201038. MOI, 201039. IOM, 201140. IOM, 201141. State Border Guard Service of Ukraine (SBGS), 201142. MOI, 201143. MOI and SBGS , 2009-2011; data collected from four main migrant holding facilities.
We are interested in your opinion — please provide your comments to this Facts & Figures brochure ([email protected]).