midwest regional carbon sequestration partnership library/events/2016/fy16 cs rd/thur... · midwest...
TRANSCRIPT

8/22/2016
1
Midwest Regional Carbon Sequestration PartnershipDOE/NETL Cooperative Agreement # DE-FC26-0NT42589
Neeraj Gupta, Battelle ([email protected])
Mastering the Subsurface Through Technology Innovation and Collaboration: Carbon Storage and Oil and Natural Gas Technologies Review Meeting
August 16-18, 2016
Outline
• Project Overview
• Technical Status− Injection Test
− Modeling
− Monitoring
− Regional Assessment
− Outreach
• Accomplishments
• Synergy Opportunities
• Project Summary
2
This presentation will provide a technical summary
8/22/2016
2
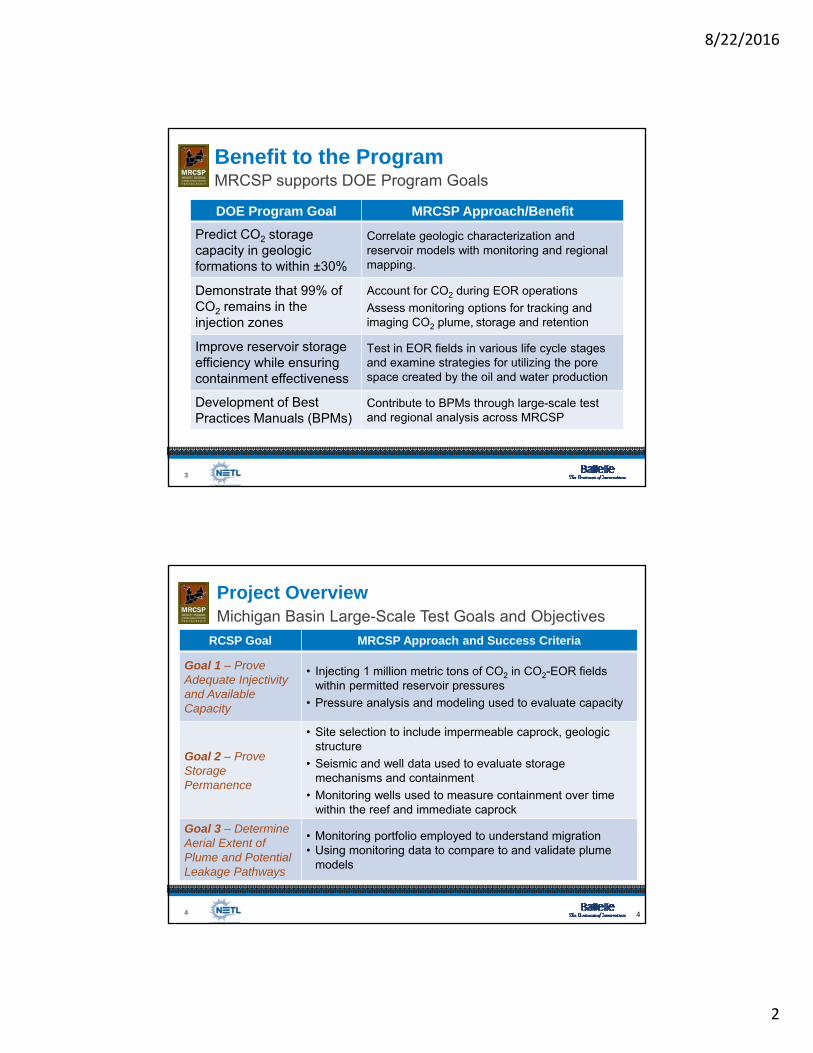
Benefit to the Program
3
MRCSP supports DOE Program Goals
DOE Program Goal MRCSP Approach/Benefit
Predict CO2 storage capacity in geologic formations to within ±30%
Correlate geologic characterization and reservoir models with monitoring and regional mapping.
Demonstrate that 99% ofCO2 remains in the injection zones
Account for CO2 during EOR operations
Assess monitoring options for tracking and imaging CO2 plume, storage and retention
Improve reservoir storage efficiency while ensuring containment effectiveness
Test in EOR fields in various life cycle stages and examine strategies for utilizing the pore space created by the oil and water production
Development of Best Practices Manuals (BPMs)
Contribute to BPMs through large-scale test and regional analysis across MRCSP
RCSP Goal MRCSP Approach and Success Criteria
Goal 1 – Prove Adequate Injectivity and Available Capacity
• Injecting 1 million metric tons of CO2 in CO2-EOR fields within permitted reservoir pressures
• Pressure analysis and modeling used to evaluate capacity
Goal 2 – Prove Storage Permanence
• Site selection to include impermeable caprock, geologic structure
• Seismic and well data used to evaluate storage mechanisms and containment
• Monitoring wells used to measure containment over time within the reef and immediate caprock
Goal 3 – Determine Aerial Extent of Plume and Potential Leakage Pathways
• Monitoring portfolio employed to understand migration • Using monitoring data to compare to and validate plume
models
Project Overview
4
Michigan Basin Large-Scale Test Goals and Objectives
4
8/22/2016
3
55
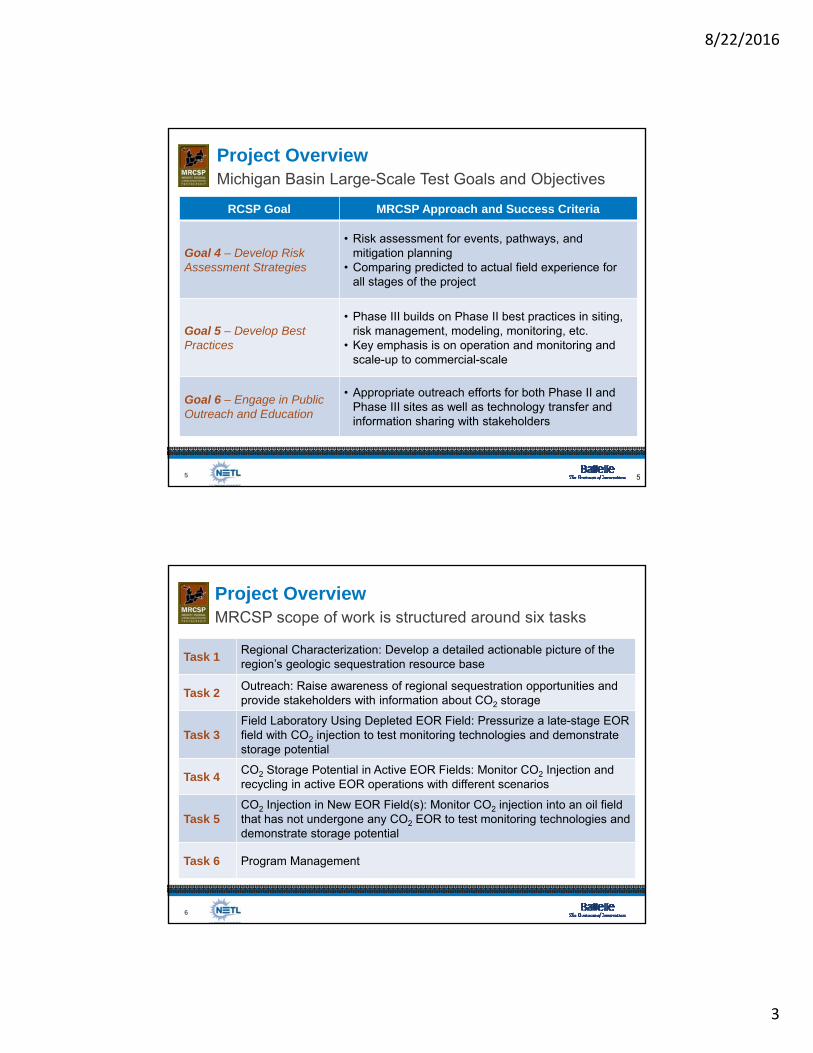
RCSP Goal MRCSP Approach and Success Criteria
Goal 4 – Develop Risk Assessment Strategies
• Risk assessment for events, pathways, and mitigation planning
• Comparing predicted to actual field experience for all stages of the project
Goal 5 – Develop Best Practices
• Phase III builds on Phase II best practices in siting, risk management, modeling, monitoring, etc.
• Key emphasis is on operation and monitoring and scale-up to commercial-scale
Goal 6 – Engage in Public Outreach and Education
• Appropriate outreach efforts for both Phase II and Phase III sites as well as technology transfer and information sharing with stakeholders
Project OverviewMichigan Basin Large-Scale Test Goals and Objectives
Project Overview
6
MRCSP scope of work is structured around six tasks
Task 1Regional Characterization: Develop a detailed actionable picture of the region’s geologic sequestration resource base
Task 2Outreach: Raise awareness of regional sequestration opportunities and provide stakeholders with information about CO2 storage
Task 3Field Laboratory Using Depleted EOR Field: Pressurize a late-stage EOR field with CO2 injection to test monitoring technologies and demonstrate storage potential
Task 4CO2 Storage Potential in Active EOR Fields: Monitor CO2 Injection and recycling in active EOR operations with different scenarios
Task 5CO2 Injection in New EOR Field(s): Monitor CO2 injection into an oil field that has not undergone any CO2 EOR to test monitoring technologies and demonstrate storage potential
Task 6 Program Management
8/22/2016
4
Technical Status
1. Injection Test
2. Modeling
3. Monitoring
4. Regional Characterization
5. Outreach
7
Technical updates grouped into five categories
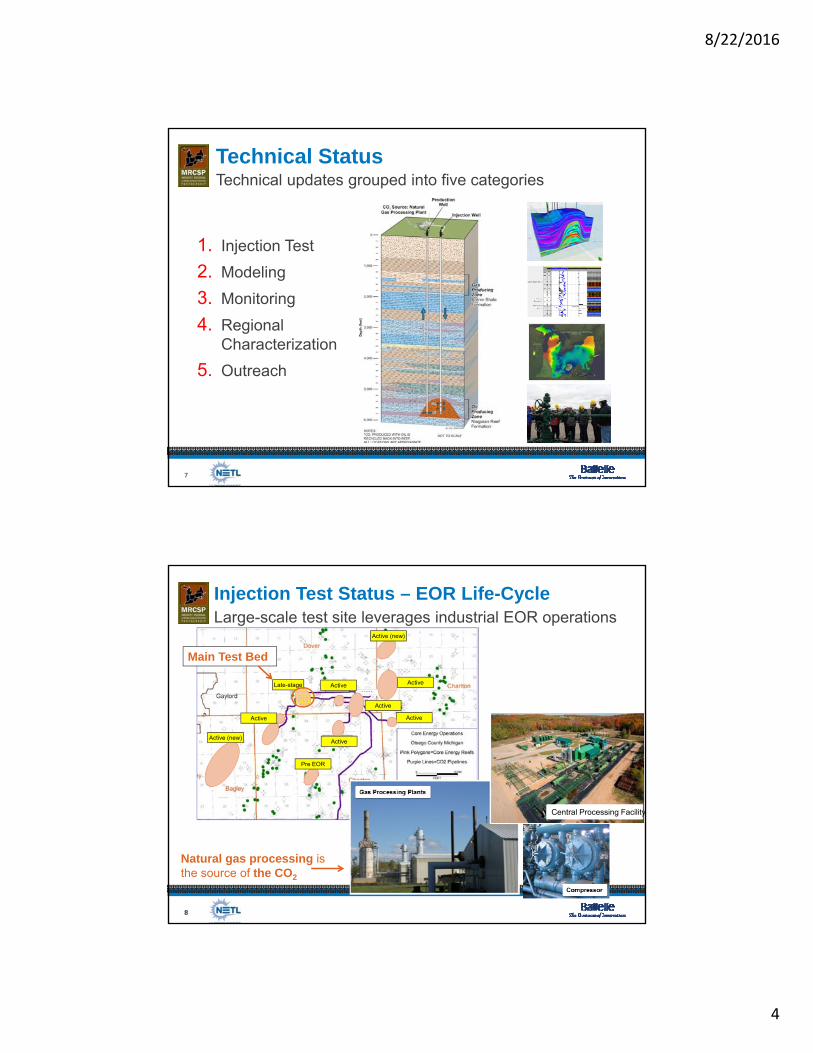
Injection Test Status – EOR Life-Cycle
8
Large-scale test site leverages industrial EOR operations
8
Natural gas processing is the source of the CO2
Central Processing Facility
Late-stage
Active
Main Test Bed
Active
Pre EOR
Active
Active (new)
Active (new)
Active
Active
Active
8/22/2016
5
Variations in reef characteristics
• # of compartments, compartmentalization
• Lithology – dolomite vs limestone, Anhydrite
• Availability of core, seismic, well log data
• Presence of salt plugging
9
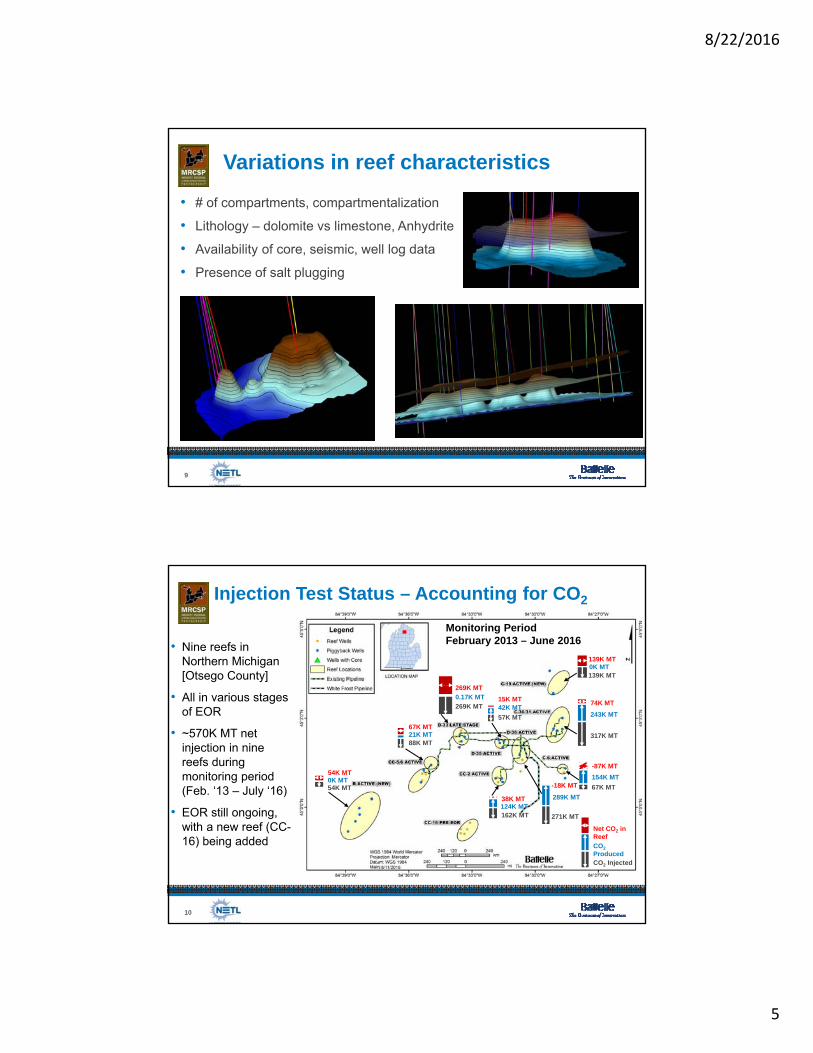
Injection Test Status – Accounting for CO2
10
269K MT
0.17K MT
269K MT15K MT42K MT
57K MT
-18K MT
289K MT
271K MT
139K MT
139K MT0K MT
74K MT
243K MT
317K MT
38K MT124K MT162K MT
67K MT21K MT88K MT
Net CO2 in Reef
CO2
ProducedCO2 Injected
-87K MT
154K MT
67K MT
• Nine reefs in Northern Michigan [Otsego County]
• All in various stages of EOR
• ~570K MT net injection in nine reefs during monitoring period (Feb. ‘13 – July ‘16)
• EOR still ongoing, with a new reef (CC-16) being added
Monitoring PeriodFebruary 2013 – June 2016
54K MT0K MT54K MT
8/22/2016
6
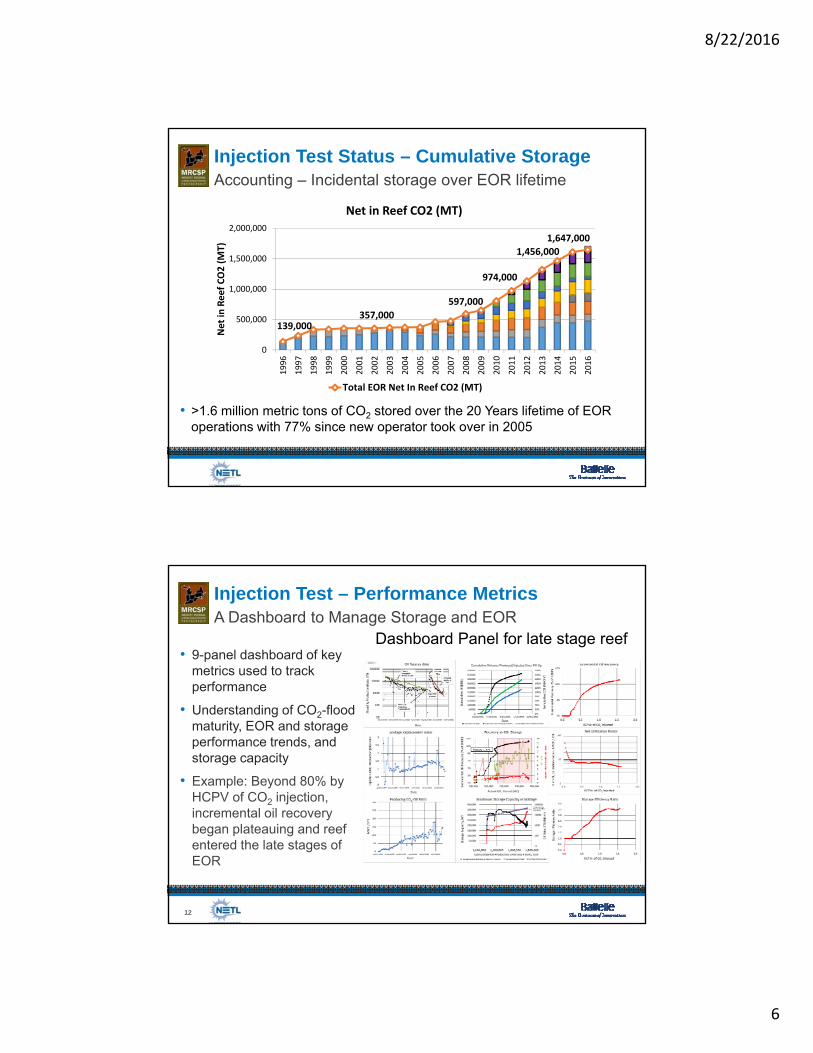
Injection Test Status – Cumulative StorageAccounting – Incidental storage over EOR lifetime
139,000357,000
597,000
974,000
1,456,000
1,647,000
0
500,000
1,000,000
1,500,000
2,000,000
1996
1997
1998
1999
2000
2001
2002
2003
2004
2005
2006
2007
2008
2009
2010
2011
2012
2013
2014
2015
2016
Net in
Reef CO2 (MT)
Net in Reef CO2 (MT)
Total EOR Net In Reef CO2 (MT)
• >1.6 million metric tons of CO2 stored over the 20 Years lifetime of EOR operations with 77% since new operator took over in 2005
Injection Test – Performance Metrics
12
A Dashboard to Manage Storage and EOR
• 9-panel dashboard of key metrics used to track performance
• Understanding of CO2-flood maturity, EOR and storage performance trends, and storage capacity
• Example: Beyond 80% by HCPV of CO2 injection, incremental oil recovery began plateauing and reef entered the late stages of EOR
Dashboard Panel for late stage reef
8/22/2016
7
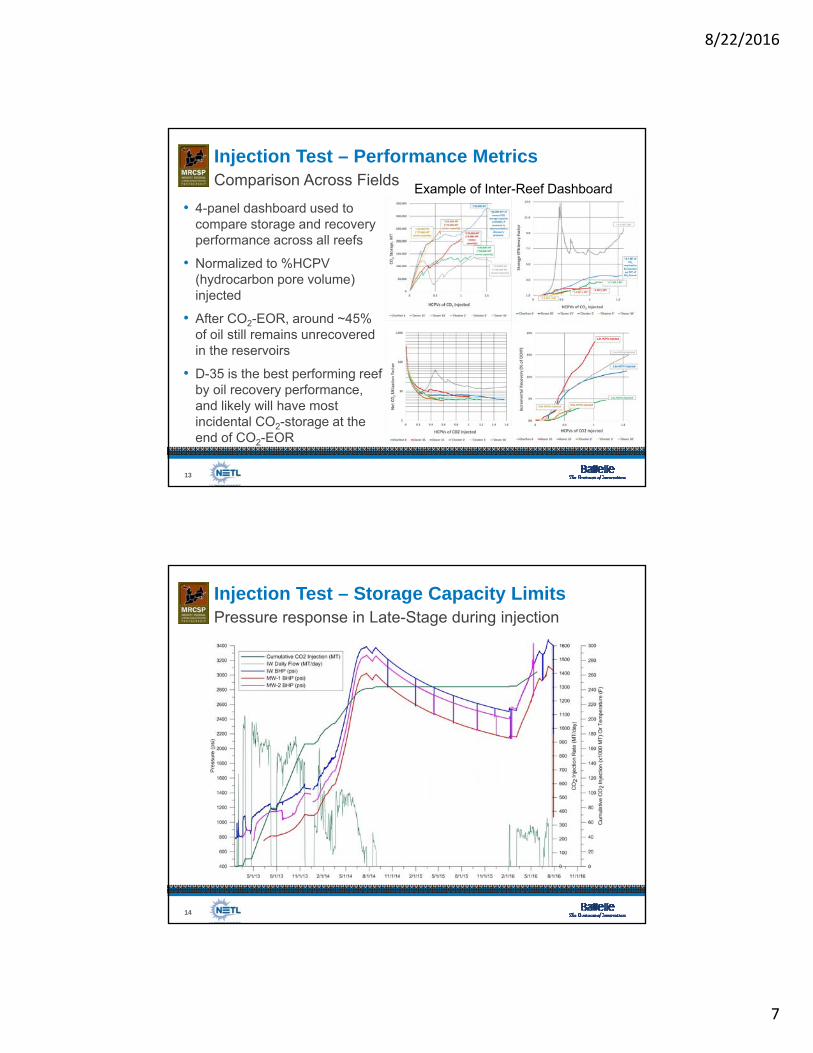
Injection Test – Performance Metrics
13
Comparison Across Fields
• 4-panel dashboard used to compare storage and recovery performance across all reefs
• Normalized to %HCPV (hydrocarbon pore volume) injected
• After CO2-EOR, around ~45% of oil still remains unrecovered in the reservoirs
• D-35 is the best performing reef by oil recovery performance, and likely will have most incidental CO2-storage at the end of CO2-EOR
Example of Inter-Reef Dashboard
Injection Test – Storage Capacity Limits
14
Pressure response in Late-Stage during injection
8/22/2016
8
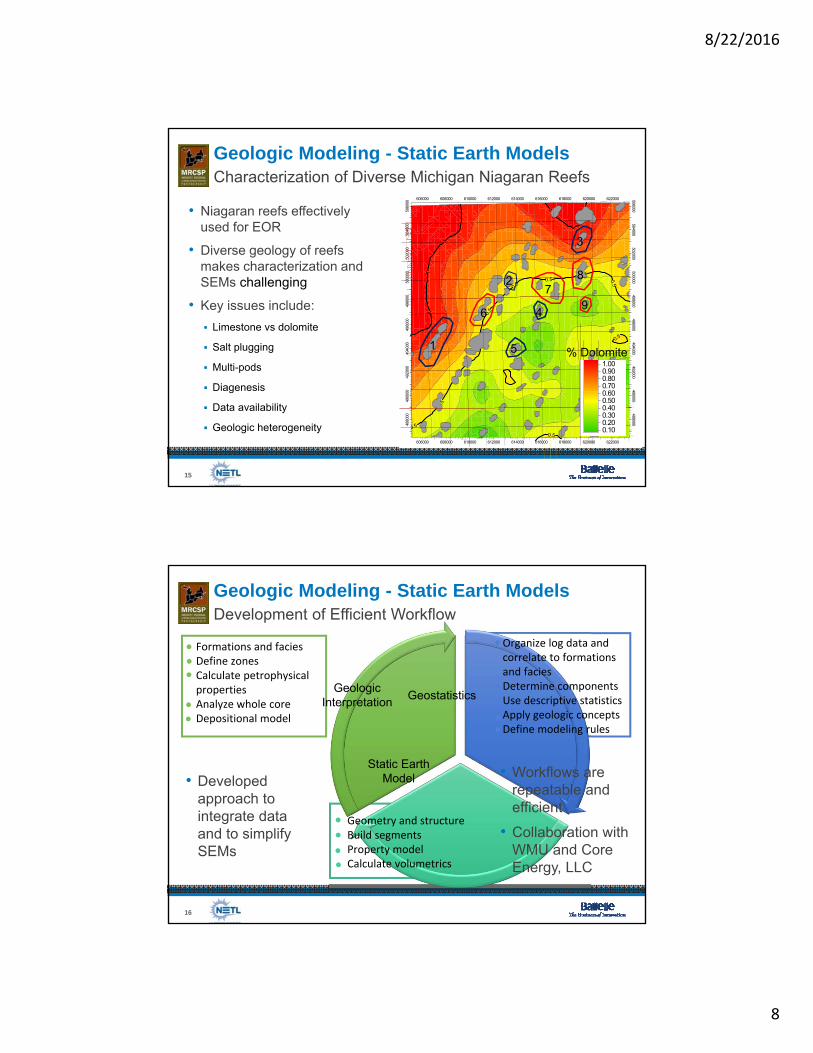
Geologic Modeling - Static Earth Models
15
Characterization of Diverse Michigan Niagaran Reefs
• Niagaran reefs effectively used for EOR
• Diverse geology of reefs makes characterization and SEMs challenging
• Key issues include:
Limestone vs dolomite
Salt plugging
Multi-pods
Diagenesis
Data availability
Geologic heterogeneity0.5
0.5
0.5
0.5
0.5
0.5
0.50.5
0.5
0.5
0.5
1
1
1
1
1
606000 608000 610000 612000 614000 616000 618000 620000 622000
606000 608000 610000 612000 614000 616000 618000 620000 622000
4880
0049
0000
4920
0049
4000
4960
0049
8000
5000
0050
2000
5040
0050
6000
488000490000
492000494000
496000498000
500000502000
504000506000
0.100.200.300.400.500.600.700.800.901.00
% Dolomite1
2
3
4
5
6
78
9
Geologic Modeling - Static Earth Models
16
Development of Efficient Workflow
• Developed approach to integrate data and to simplify SEMs
Formations and faciesDefine zonesCalculate petrophysicalpropertiesAnalyze whole core Depositional model
Organize log data and correlate to formations and faciesDetermine componentsUse descriptive statisticsApply geologic conceptsDefine modeling rules
Geometry and structureBuild segmentsProperty modelCalculate volumetrics
Geologic Interpretation
Geostatistics
Static Earth Model • Workflows are
repeatable and efficient
• Collaboration with WMU and Core Energy, LLC
8/22/2016
9
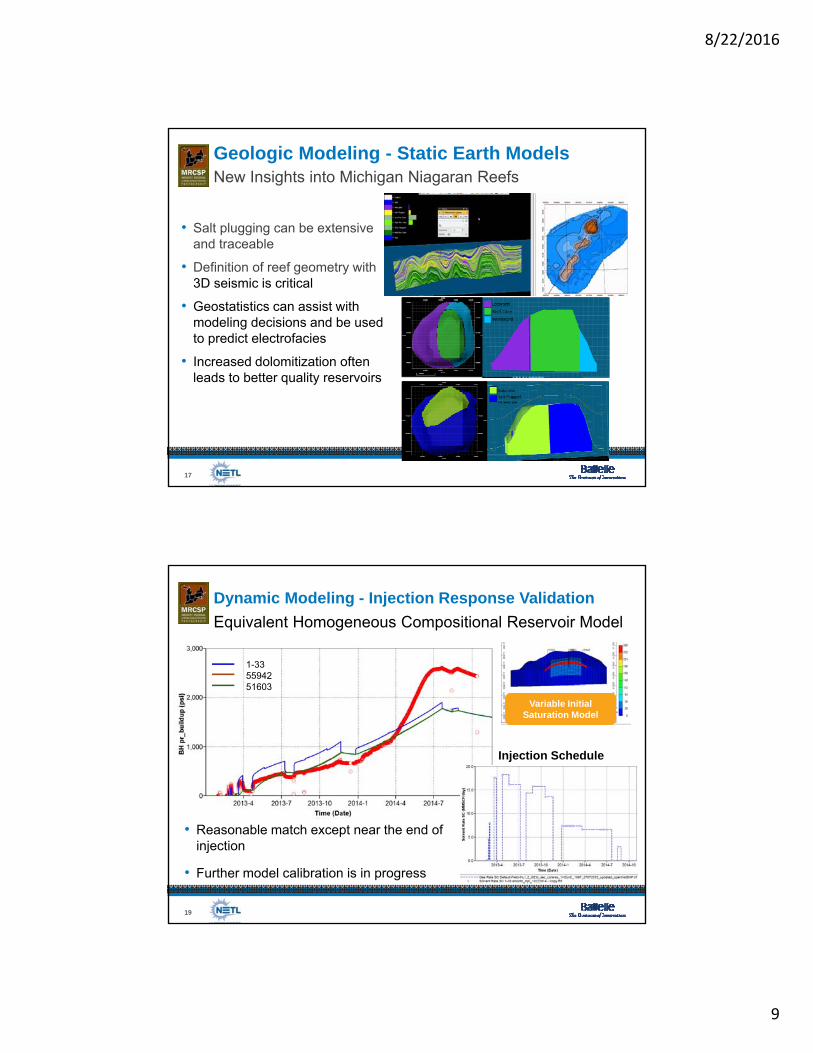
Geologic Modeling - Static Earth Models
17
New Insights into Michigan Niagaran Reefs
• Salt plugging can be extensive and traceable
• Definition of reef geometry with 3D seismic is critical
• Geostatistics can assist with modeling decisions and be used to predict electrofacies
• Increased dolomitization often leads to better quality reservoirs
Dynamic Modeling - Injection Response Validation
1-335594251603
Injection Schedule
19
Variable Initial Saturation Model
Variable Initial Saturation Model
Equivalent Homogeneous Compositional Reservoir Model
• Reasonable match except near the end of injection
• Further model calibration is in progress
8/22/2016
10
20
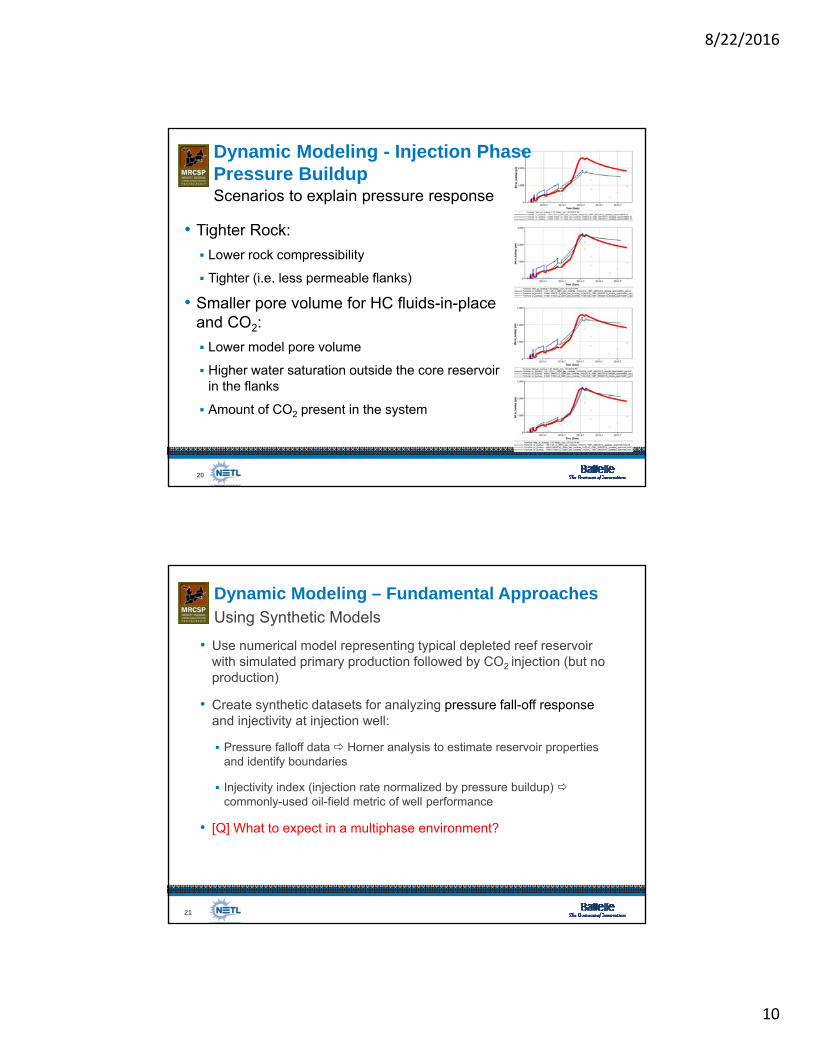
• Tighter Rock:
Lower rock compressibility
Tighter (i.e. less permeable flanks)
• Smaller pore volume for HC fluids-in-place and CO2:
Lower model pore volume
Higher water saturation outside the core reservoir in the flanks
Amount of CO2 present in the system
Dynamic Modeling - Injection Phase Pressure BuildupScenarios to explain pressure response
Dynamic Modeling – Fundamental Approaches
21
Using Synthetic Models
• Use numerical model representing typical depleted reef reservoir with simulated primary production followed by CO2 injection (but no production)
• Create synthetic datasets for analyzing pressure fall-off response and injectivity at injection well:
Pressure falloff data Horner analysis to estimate reservoir properties and identify boundaries
Injectivity index (injection rate normalized by pressure buildup) commonly-used oil-field metric of well performance
• [Q] What to expect in a multiphase environment?
8/22/2016
11
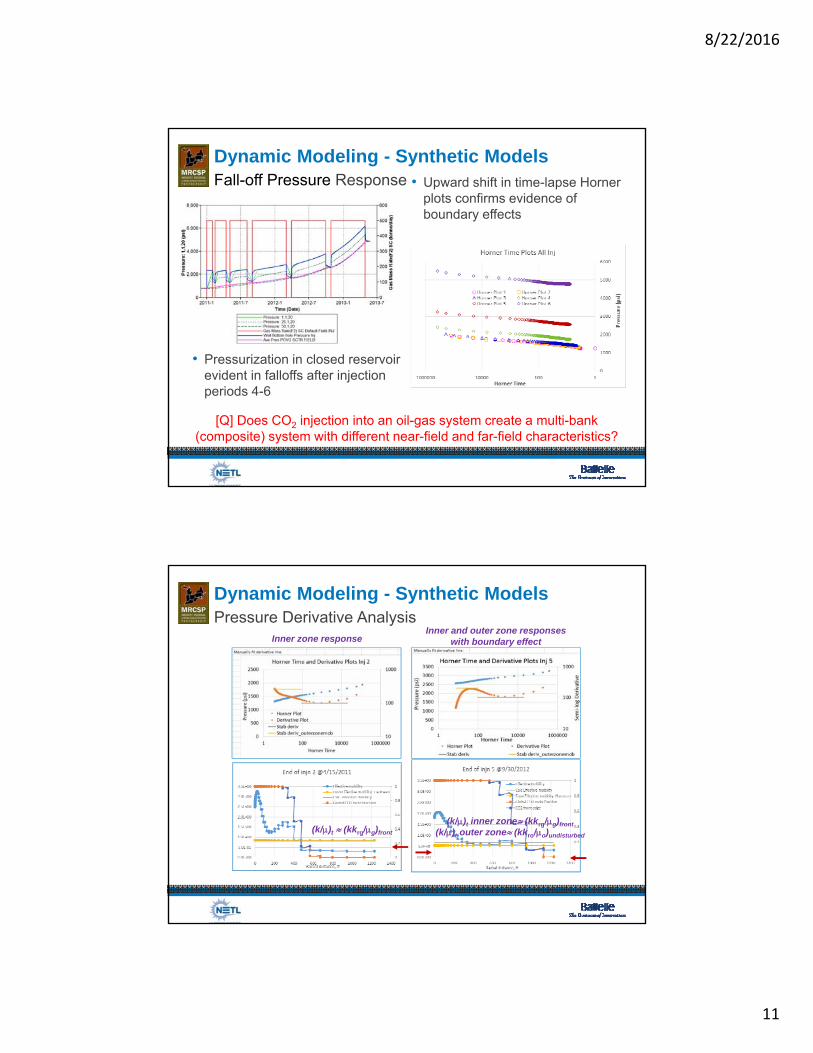
Dynamic Modeling - Synthetic ModelsFall-off Pressure Response
[Q] Does CO2 injection into an oil-gas system create a multi-bank (composite) system with different near-field and far-field characteristics?
• Pressurization in closed reservoir evident in falloffs after injection periods 4-6
• Upward shift in time-lapse Horner plots confirms evidence of boundary effects
Dynamic Modeling - Synthetic ModelsPressure Derivative Analysis
Inner zone responseInner and outer zone responses
with boundary effect
(k/)t (kkrg/g)front
(k/)t inner zone (kkrg/g)front
(k/)t outer zone (kkro/o)undisturbed
8/22/2016
12
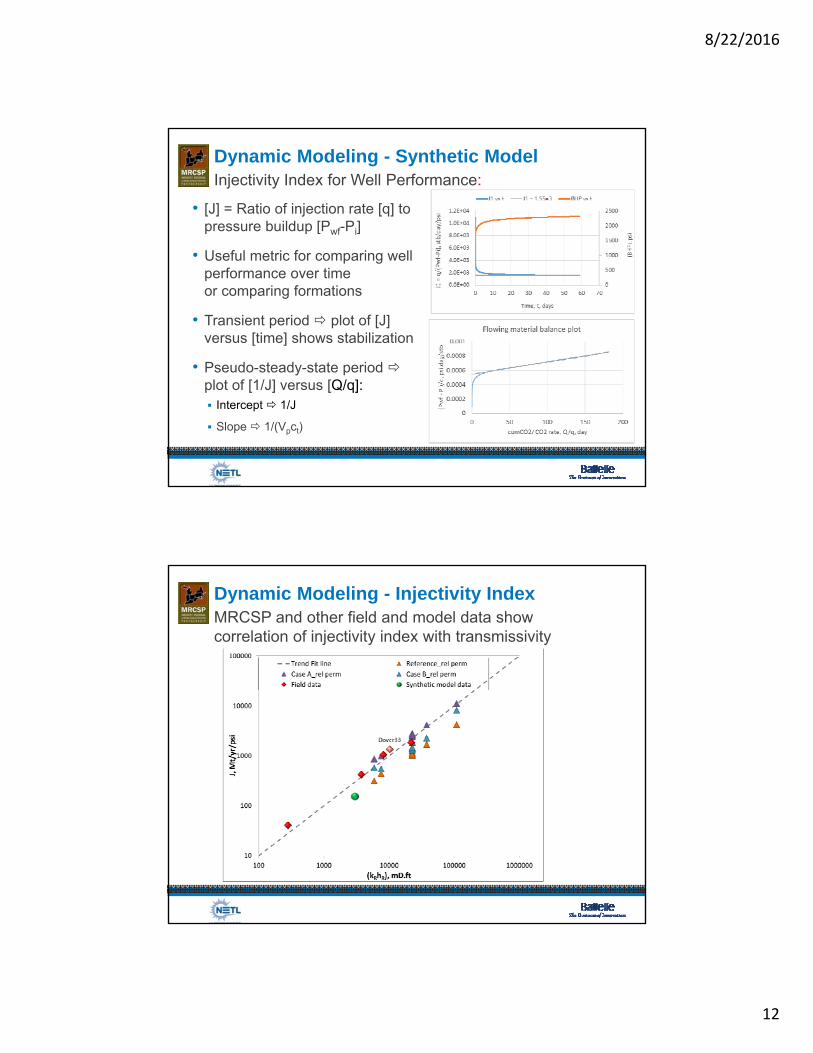
Dynamic Modeling - Synthetic ModelInjectivity Index for Well Performance:
• [J] = Ratio of injection rate [q] to pressure buildup [Pwf-Pi]
• Useful metric for comparing well performance over timeor comparing formations
• Transient period plot of [J] versus [time] shows stabilization
• Pseudo-steady-state period plot of [1/J] versus [Q/q]: Intercept 1/J
Slope 1/(Vpct)
Dynamic Modeling - Injectivity IndexMRCSP and other field and model data show correlation of injectivity index with transmissivity
8/22/2016
13
Modeling Status: Synthetic modelingKey Points
• Inner zone total mobility (permeability divided by viscosity) related to gas-phase mobility in the vicinity of CO2 front
• Outer zone total mobility related to oil-phase mobility in the undisturbed reservoir
• Cannot determine absolute permeability from mobility, due to unknown multiphase viscosity
• Injectivity index behavior during transient and boundary dominated periods different
• Empirical correlation found between injectivity and permeability-thickness product (helpful for screening analysis and quick-look estimation of absolute permeability)
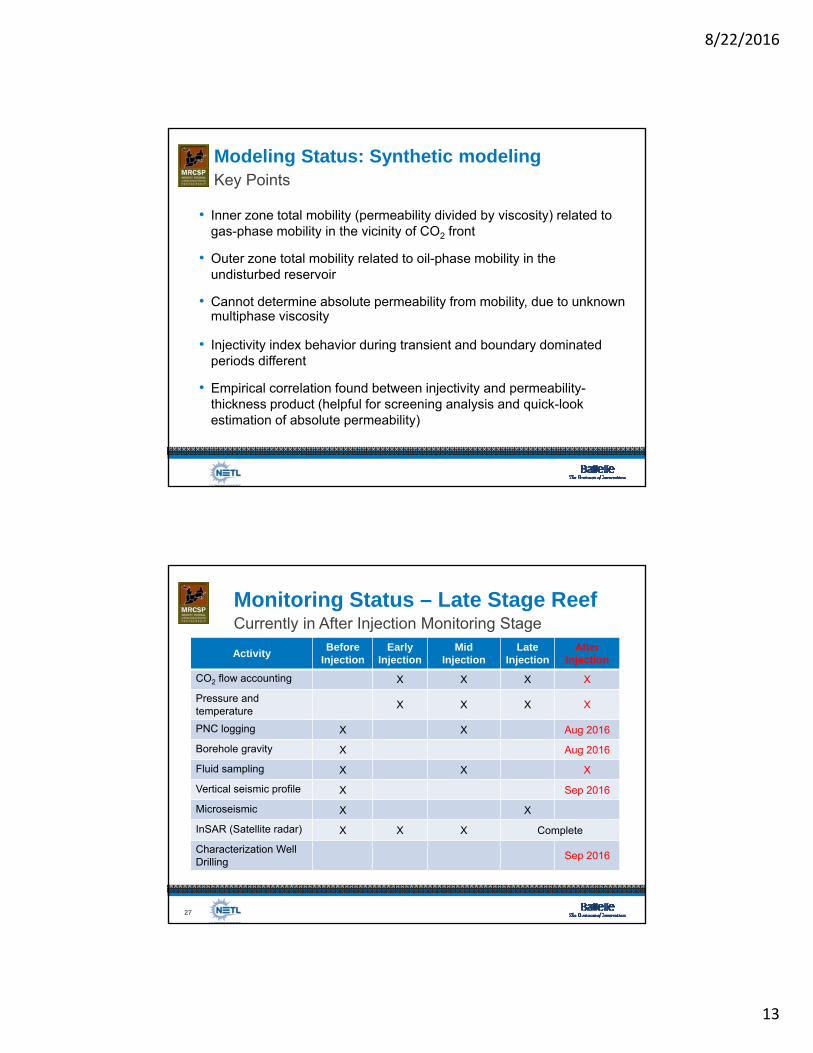
Monitoring Status – Late Stage Reef
27
Currently in After Injection Monitoring Stage
ActivityBefore
InjectionEarly
InjectionMid
InjectionLate
InjectionAfter
Injection
CO2 flow accounting X X X X
Pressure and temperature
X X X X
PNC logging X X Aug 2016
Borehole gravity X Aug 2016
Fluid sampling X X X
Vertical seismic profile X Sep 2016
Microseismic X X
InSAR (Satellite radar) X X X Complete
Characterization WellDrilling
Sep 2016
8/22/2016
14
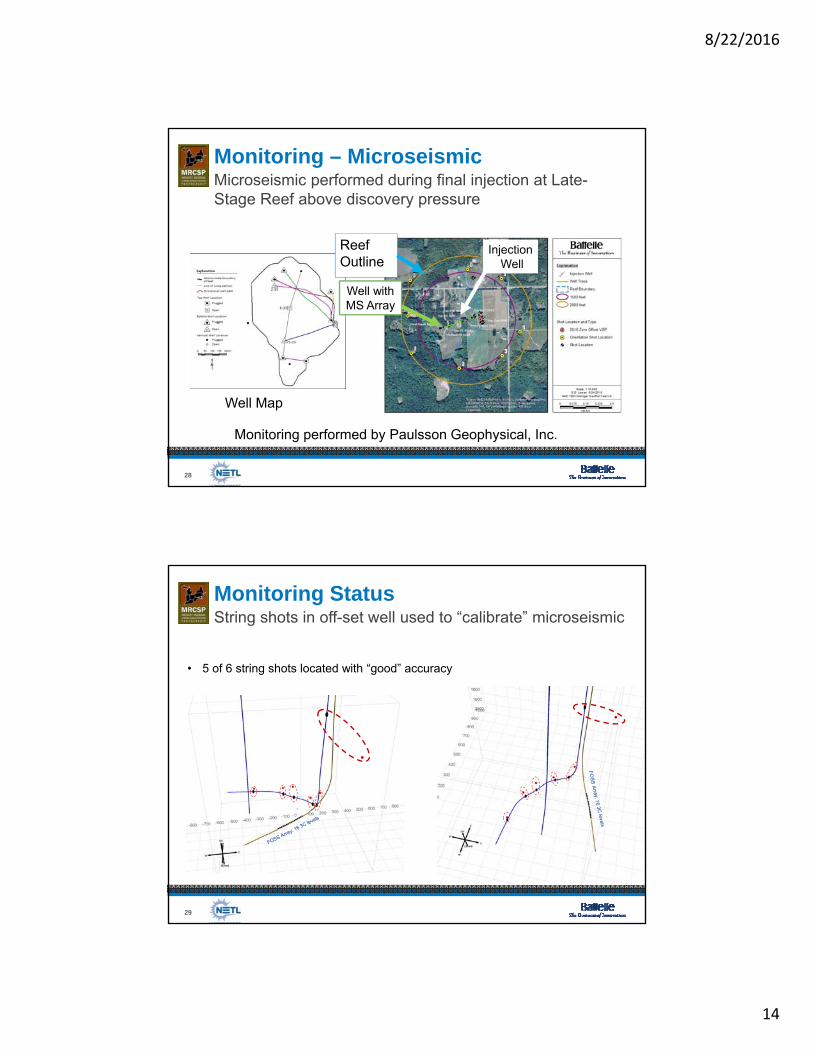
28
Microseismic performed during final injection at Late-Stage Reef above discovery pressure
Monitoring – Microseismic
Reef Outline
Well with MS Array
InjectionWell
Well Map
Monitoring performed by Paulsson Geophysical, Inc.
29
String shots in off-set well used to “calibrate” microseismic Monitoring Status
• 5 of 6 string shots located with “good” accuracy
8/22/2016
15
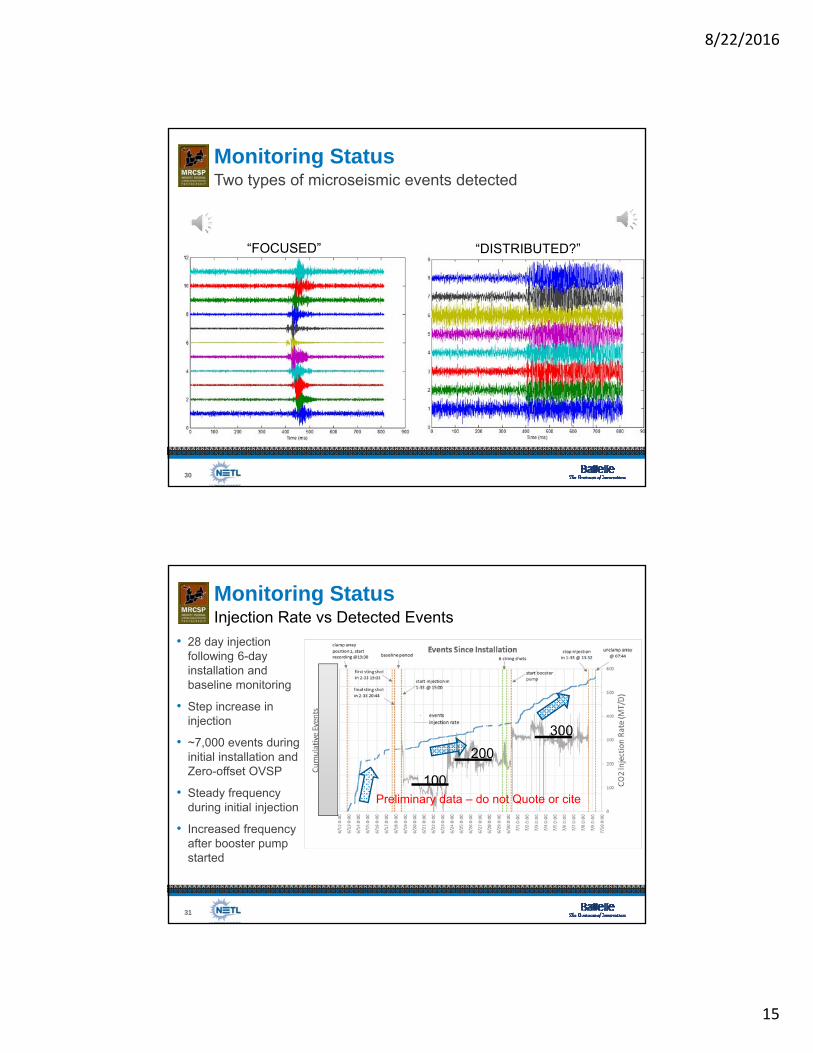
30
Two types of microseismic events detectedMonitoring Status
“FOCUSED” “DISTRIBUTED?”
31
Injection Rate vs Detected EventsMonitoring Status
• 28 day injection following 6-day installation and baseline monitoring
• Step increase in injection
• ~7,000 events during initial installation and Zero-offset OVSP
• Steady frequency during initial injection
• Increased frequency after booster pump started
100
200
300
Preliminary data – do not Quote or cite
8/22/2016
16
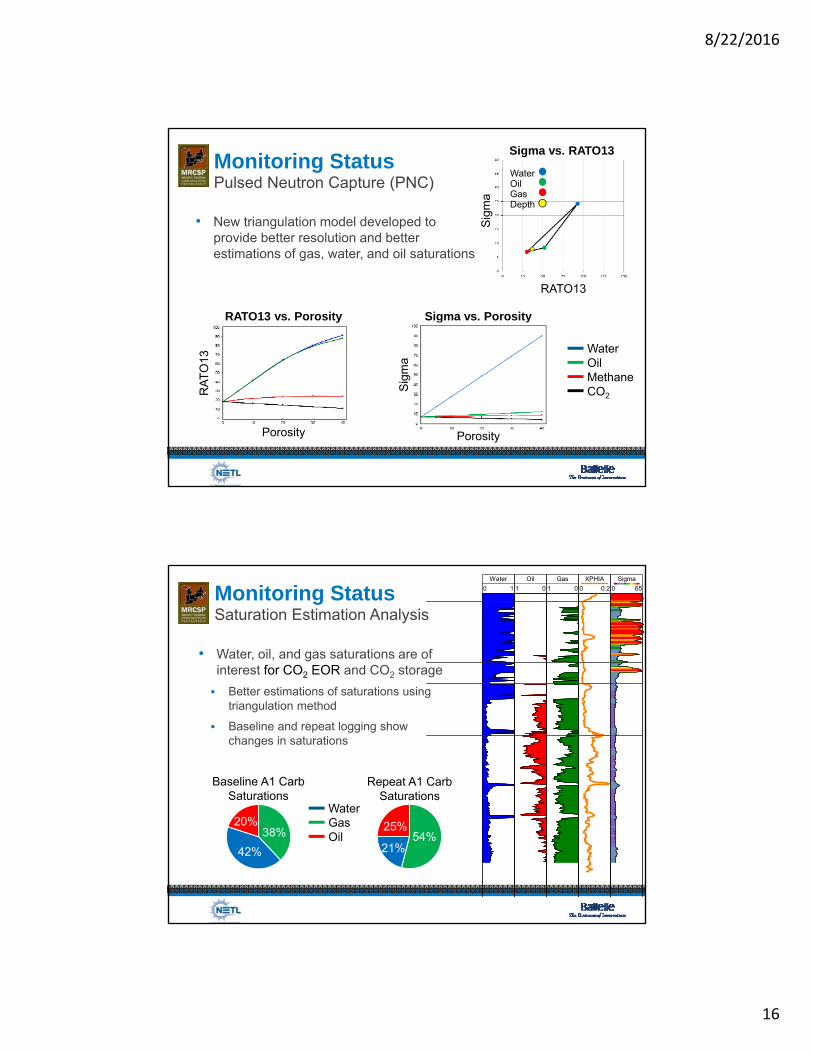
Pulsed Neutron Capture (PNC)Monitoring Status
• New triangulation model developed to provide better resolution and better estimations of gas, water, and oil saturations
WaterOilGasDepth
Sig
ma
RATO13
Sigma vs. RATO13
Porosity
Sig
ma
Sigma vs. Porosity
RA
TO
13
Porosity
RATO13 vs. Porosity
WaterOilMethaneCO2
Saturation Estimation AnalysisMonitoring Status 0 1
Water
1 0
Oil
1 0
Gas
0 0.2
XPHIA
0 65
Sigma
• Water, oil, and gas saturations are of interest for CO2 EOR and CO2 storage
Better estimations of saturations using triangulation method
Baseline and repeat logging show changes in saturations
38%20%
42%
25%
21%54%
WaterGasOil
Repeat A1 Carb Saturations
Baseline A1 Carb Saturations
8/22/2016
17
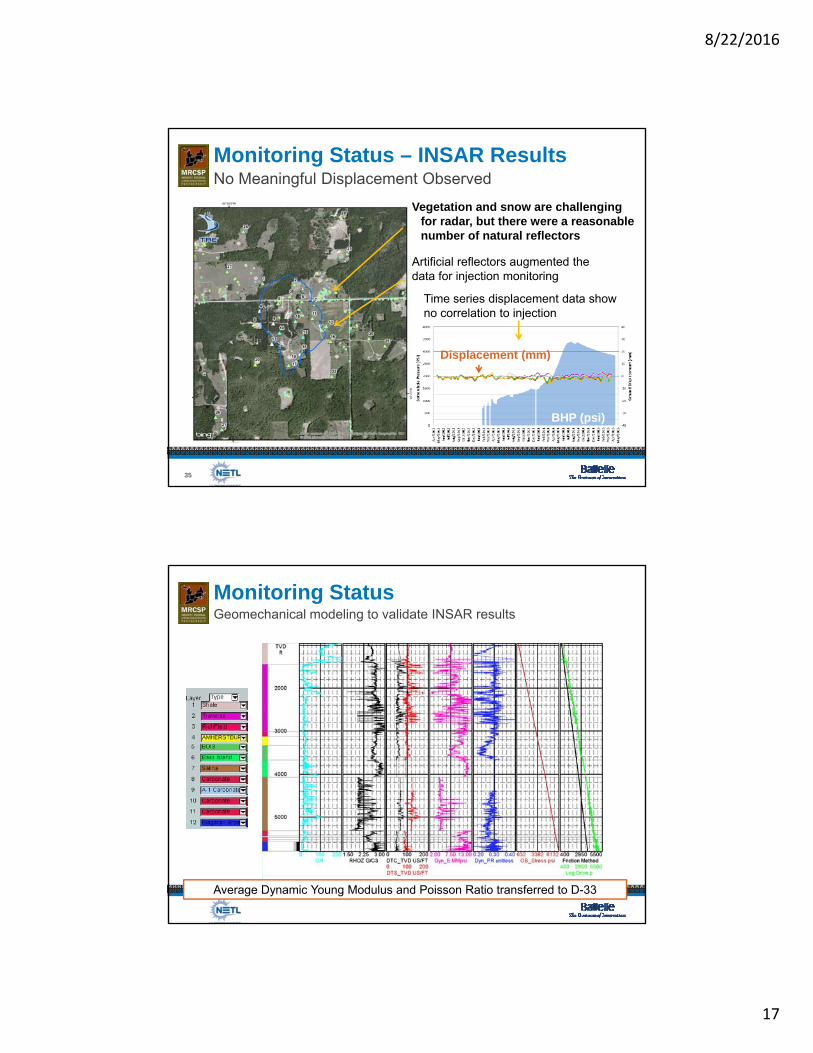
35
Vegetation and snow are challenging for radar, but there were a reasonable number of natural reflectors
Artificial reflectors augmented the data for injection monitoring
BHP (psi)
Displacement (mm)
Time series displacement data show no correlation to injection
No Meaningful Displacement Observed Monitoring Status – INSAR Results
Geomechanical modeling to validate INSAR results
Monitoring Status
Average Dynamic Young Modulus and Poisson Ratio transferred to D-33
8/22/2016
18
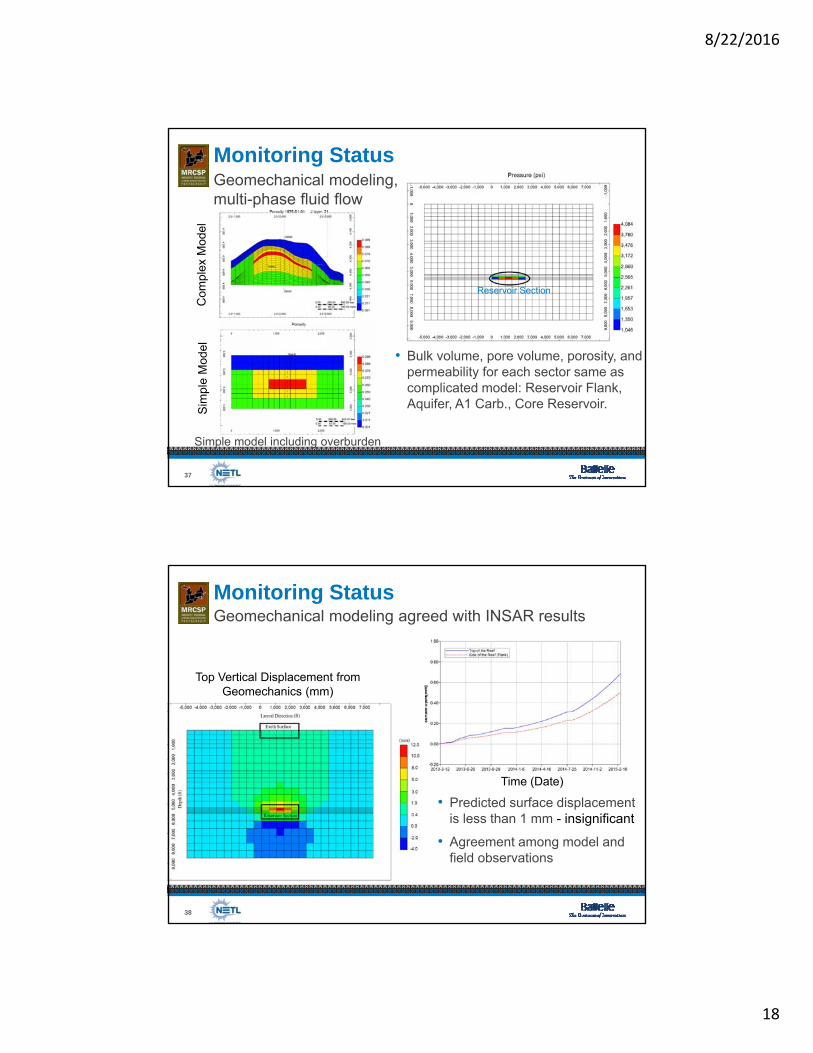
37
Monitoring StatusGeomechanical modeling, multi-phase fluid flow
Com
plex
Mod
elS
impl
e M
odel
Reservoir Section
Simple model including overburden
• Bulk volume, pore volume, porosity, and permeability for each sector same as complicated model: Reservoir Flank, Aquifer, A1 Carb., Core Reservoir.
38
Geomechanical modeling agreed with INSAR resultsMonitoring Status
• Predicted surface displacement is less than 1 mm - insignificant
• Agreement among model and field observations
Top Vertical Displacement from Geomechanics (mm)
Time (Date)
8/22/2016
19
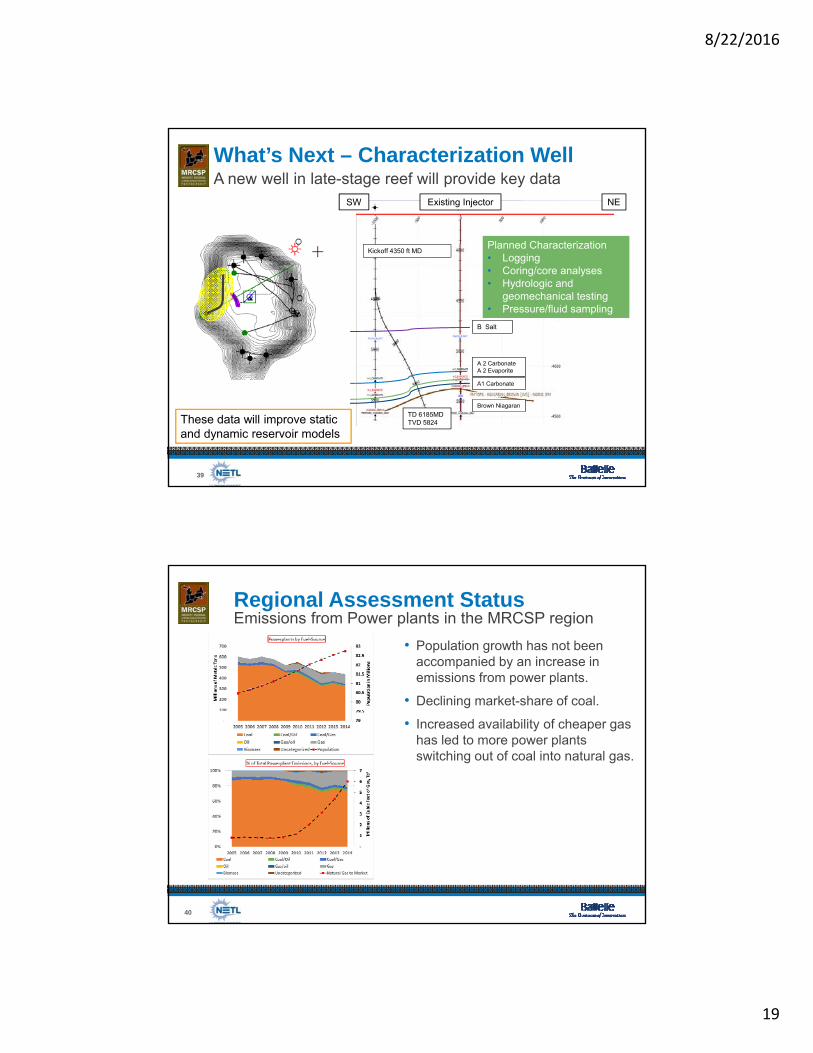
39
NESW
Kickoff 4350 ft MDPlanned Characterization• Logging• Coring/core analyses• Hydrologic and
geomechanical testing• Pressure/fluid sampling
Existing Injector
B Salt
A 2 CarbonateA 2 Evaporite
A1 Carbonate
Brown Niagaran
TD 6185MD TVD 5824 These data will improve static
and dynamic reservoir models
A new well in late-stage reef will provide key dataWhat’s Next – Characterization Well
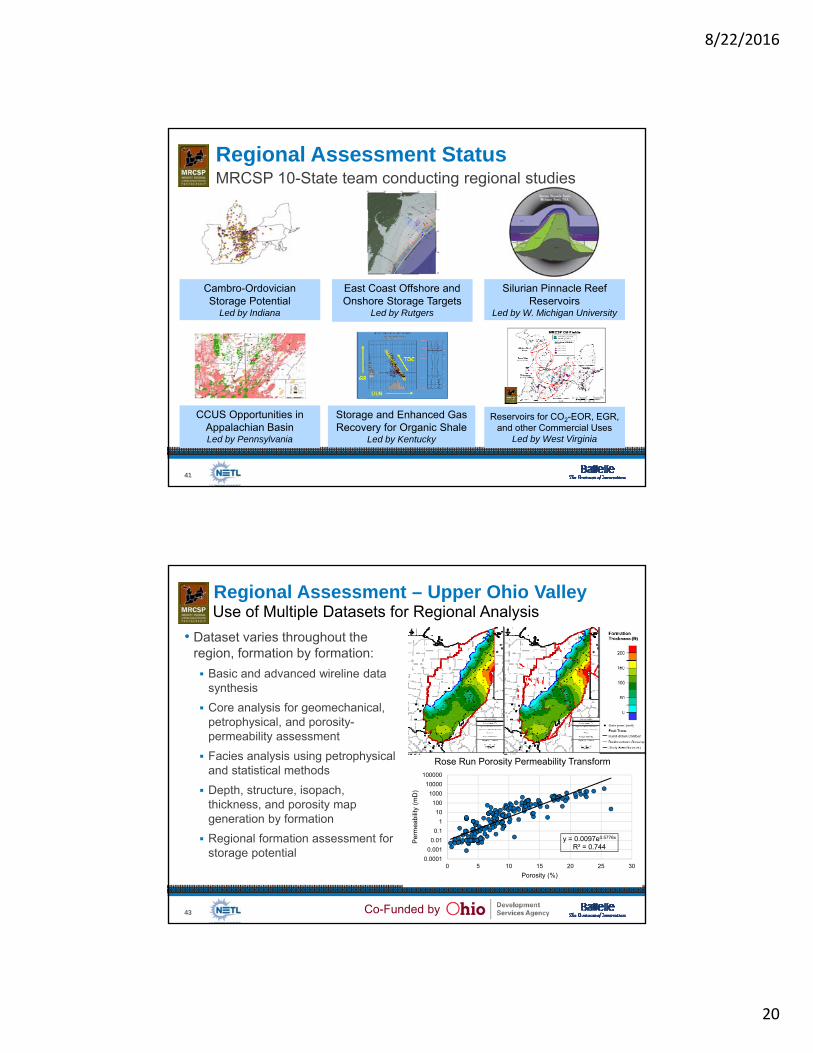
Regional Assessment Status
40
• Population growth has not been accompanied by an increase in emissions from power plants.
• Declining market-share of coal.
• Increased availability of cheaper gas has led to more power plants switching out of coal into natural gas.
Emissions from Power plants in the MRCSP region
8/22/2016
20
41
MRCSP 10-State team conducting regional studiesRegional Assessment Status
Cambro-Ordovician Storage Potential
Led by Indiana
East Coast Offshore and Onshore Storage Targets
Led by Rutgers
Silurian Pinnacle Reef Reservoirs
Led by W. Michigan University
CCUS Opportunities in Appalachian BasinLed by Pennsylvania
Storage and Enhanced Gas Recovery for Organic Shale
Led by Kentucky
Reservoirs for CO2-EOR, EGR, and other Commercial Uses
Led by West Virginia
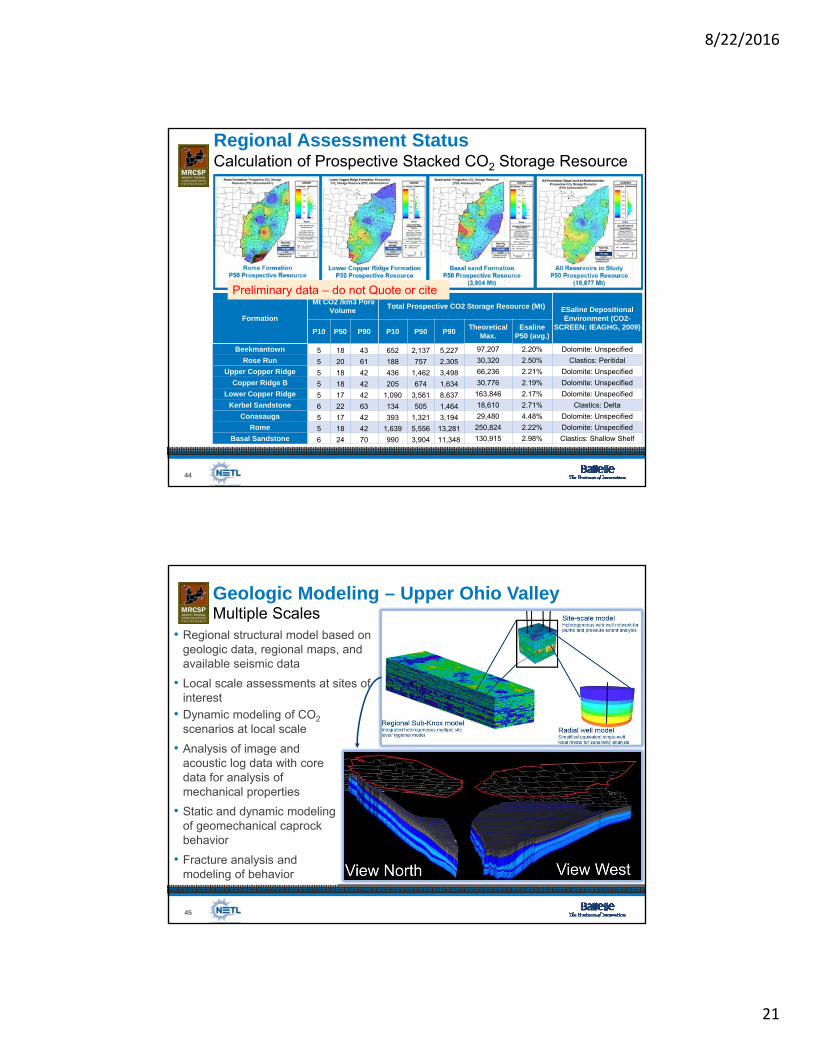
Use of Multiple Datasets for Regional Analysis
43 Co-Funded by
y = 0.0097e0.5776x
R² = 0.744
0.0001
0.001
0.01
0.1
1
10
100
1000
10000
100000
0 5 10 15 20 25 30
Per
mea
bilit
y (m
D)
Porosity (%)
Rose Run Porosity Permeability Transform
• Dataset varies throughout the region, formation by formation:
Basic and advanced wireline data synthesis
Core analysis for geomechanical, petrophysical, and porosity-permeability assessment
Facies analysis using petrophysicaland statistical methods
Depth, structure, isopach, thickness, and porosity map generation by formation
Regional formation assessment for storage potential
Regional Assessment – Upper Ohio Valley
8/22/2016
21
44
Formation
Mt CO2 /km3 Pore Volume
Total Prospective CO2 Storage Resource (Mt) ESaline Depositional Environment (CO2-
SCREEN; IEAGHG, 2009)P10 P50 P90 P10 P50 P90
Theoretical Max.
Esaline P50 (avg.)
Beekmantown 5 18 43 652 2,137 5,227 97,207 2.20% Dolomite: Unspecified
Rose Run 5 20 61 188 757 2,305 30,320 2.50% Clastics: Peritidal
Upper Copper Ridge 5 18 42 436 1,462 3,498 66,236 2.21% Dolomite: Unspecified
Copper Ridge B 5 18 42 205 674 1,634 30,776 2.19% Dolomite: Unspecified
Lower Copper Ridge 5 17 42 1,090 3,561 8,637 163,846 2.17% Dolomite: Unspecified
Kerbel Sandstone 6 22 63 134 505 1,464 18,610 2.71% Clastics: Delta
Conasauga 5 17 42 393 1,321 3,194 29,480 4.48% Dolomite: Unspecified
Rome 5 18 42 1,639 5,556 13,281 250,824 2.22% Dolomite: Unspecified
Basal Sandstone 6 24 70 990 3,904 11,348 130,915 2.98% Clastics: Shallow Shelf
Calculation of Prospective Stacked CO2 Storage ResourceRegional Assessment Status
Preliminary data – do not Quote or cite
45
Geologic Modeling – Upper Ohio ValleyMultiple Scales
• Regional structural model based on geologic data, regional maps, and available seismic data
• Local scale assessments at sites of interest
• Dynamic modeling of CO2
scenarios at local scale
• Analysis of image and acoustic log data with core data for analysis of mechanical properties
• Static and dynamic modeling of geomechanical caprockbehavior
• Fracture analysis and modeling of behavior
8/22/2016
22
Outreach Status
• Convening/participating in the Outreach Working Group
• Communicating results to a broad audience via site visits, fact sheets, conference and meetings, and the website
• Topical highlights:
CO2 accounting in closed reservoirs
Performance Measures
Numerical Modeling
Monitoring-Modeling Loop
Regional Storage Opportunities
• MRCSP website moving to a mobile friendly platform (transitioning in August)
46
Technology transfer is a growing focus
www.mrcsp.org
Accomplishments
47
MRCSP positioned for developing its storage potential
• ~575,000 metric tons injected across all reefs (ongoing)
• Completed injection at main test bed
Performed microseismic monitoring in final injection stage
Post-injection PNC, microgravity, and VSP underway
• Developed performance metrics to assess storage capacity
• Advancements in static and numeric modeling processes
• Collaborative team for regional assessments across ten states
• Technology transfer is focus of outreach
8/22/2016
23
Synergy Opportunities
• Knowledge share with Plains CO2 Partnership on closed reservoirs modeling and monitoring
• Knowledge share with other RCSPs on monitoring technologies and depleted oilfield modeling
• Testing NRAP models and CO2Screen tools
• Collaboration with international projects on modeling and CO2
EOR to Storage transitions
• IEAGHG monitoring/Modeling Network
• Input to DOE Best Practices Manuals
48
Research is complementary to the RCSP projects
Project Summary
• MRCSP Large-Scale Test ~60% completed with diverse EOR field setting and variety of monitoring options
• Multiple monitoring options are being tested
• Both monitoring and modeling are essential for understanding performance – imperative to be able to do much with limited data
• Regional characterization helping identify new storage zones and estimate storage resources – setting stage for commercial scale CCUS
• Results will contribute to developing standards and best practices, NRAP tools, CO2 capacity estimate tools
49
Key Findings and Lessons Learned
8/22/2016
24
Project Summary
• Completing post-injection monitoring and data analysis for late-stage field
• Drilling a new characterization well in late-stage field post-injection, applying results to validate/improve models
• Implementing metering improvements for MVA
• Applying methodologies and lessons to new EOR reefs
• Extending findings to the entire Michigan reef trend
• Expanded technical outreach
50
Future Plans
Acknowledgements
Battelle’s MRCSP Current Contributors – Mark Kelley, Srikanta Mishra, Matt Place, Lydia Cumming, Sanjay Mawalkar, Charlotte Sullivan, Priya Ravi Ganesh, Autumn Haagsma, Samin Raziperchikolaee, Amber Conner, Glen Larsen, Caitlin McNeil, Joel Main, Jacob Markiewicz, Isis Fukai, Ashwin Pasumarti, Jackie Gerst, Rod Osborne, and several others
DOE/NETL – Agreement # DE-FC26-0NT42589, Andrea McNemar (PM)
Core Energy, LLC – Bob Mannes, Rick Pardini, Allen Modroo, Bob Tipsword, and others
Ohio Development Services Agency’s Ohio Coal Development Office
MRCSP’s technical partners, sponsors, and host sites
The MRCSP Region’s State Geology Surveys and Universities
51
8/22/2016
25
Contributions From Partners Have Helped Make MRCSP Successful
52
Questions?
53
Please visit www.mrcsp.org

8/22/2016
26
Midwest Regional Carbon Sequestration Partnership
54
BACK UP SLIDES
Organization Chart
55
Charlotte SullivanAlain Bonneville
CharacterizationMonitoring Support
Prime ContractorNeeraj Gupta, PI/PM
M. Kelley, Characterization/MonitoringL. Cumming, Outreach & Regional Geology
A. Haagsma and A. Conner, GeologyS. Mishra and P. Ravi Ganesh, ModelingC. McNeil, PM support and coordinationM. Place, J. Markiewicz, J. Holly, Fieldwork
DOE/NETLAndrea McNemar
MRCSP Program Manager
Robert Mannes Rick Pardini
Large‐Scale Test Host
Kris Carter, PA Geo SurveyJohn Rupp, IN Geo Survey
Regional Characterization Task Coordinators
Sarah Wade
Outreach Working Group Coordinator
David Cole
Geochemical Monitoring
8/22/2016
27
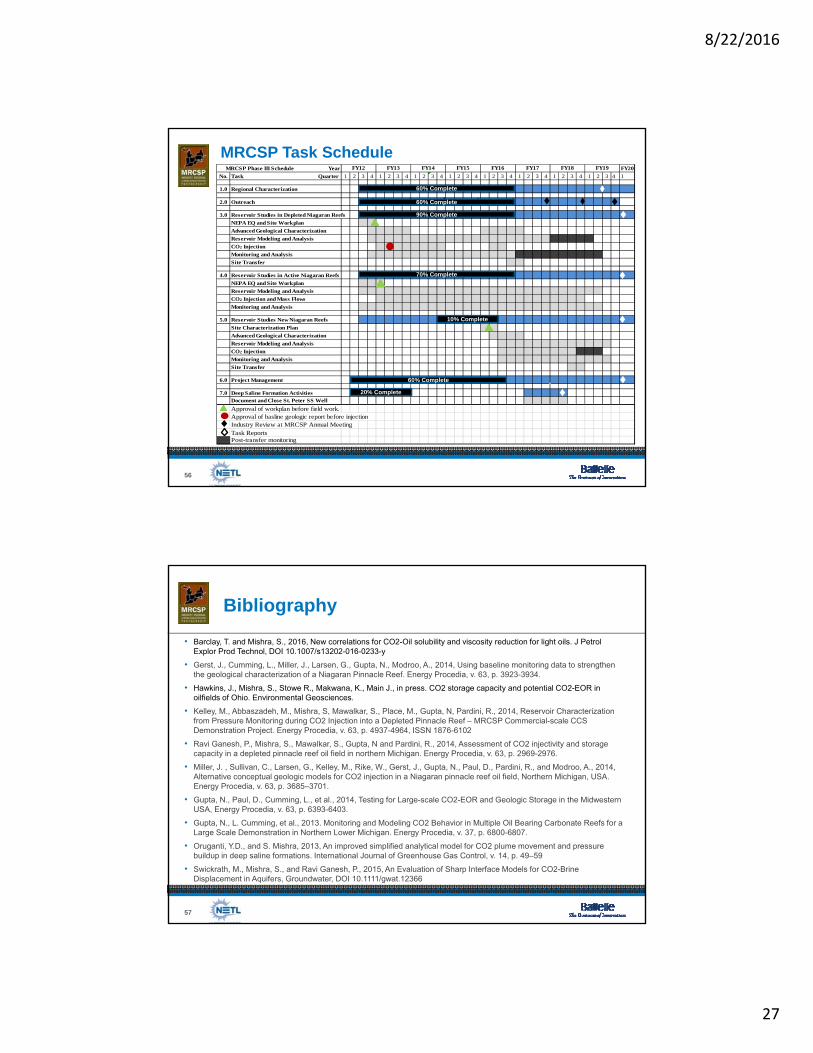
MRCSP Task Schedule
56
MRCSP Phase III Schedule Year FY20
No. Task Quarter 1 2 3 4 1 2 3 4 1 2 3 4 1 2 3 4 1 2 3 4 1 2 3 4 1 2 3 4 1 2 3 4 1
1.0 Regional Characterization
2.0 Outreach
3.0 Reservoir Studies in Depleted Niagaran Reefs
NEPA EQ and Site Workplan
Advanced Geological Characterization
Reservoir Modeling and Analysis
CO2 Injection
Monitoring and Analysis
Site Transfer
4.0 Reservoir Studies in Active Niagaran Reefs
NEPA EQ and Site Workplan
Reservoir Modeling and Analysis
CO2 Injection and Mass Flows
Monitoring and Analysis
5.0 Reservoir Studies New Niagaran Reefs
Site Characterization Plan
Advanced Geological Characterization
Reservoir Modeling and Analysis
CO2 Injection
Monitoring and Analysis
Site Transfer
6.0 Project Management
7.0 Deep Saline Formation Activities
Document and Close St. Peter SS Well
Approval of workplan before field work.Approval of basline geologic report before injectionIndustry Review at MRCSP Annual Meeting Task ReportsPost-transfer monitoring
FY12 FY13 FY14 FY15 FY16 FY17 FY18 FY19
60% Complete
60% Complete
60% Complete
20% Complete
10% Complete
70% Complete
90% Complete
Bibliography
• Barclay, T. and Mishra, S., 2016, New correlations for CO2-Oil solubility and viscosity reduction for light oils. J Petrol Explor Prod Technol, DOI 10.1007/s13202-016-0233-y
• Gerst, J., Cumming, L., Miller, J., Larsen, G., Gupta, N., Modroo, A., 2014, Using baseline monitoring data to strengthen the geological characterization of a Niagaran Pinnacle Reef. Energy Procedia, v. 63, p. 3923-3934.
• Hawkins, J., Mishra, S., Stowe R., Makwana, K., Main J., in press. CO2 storage capacity and potential CO2-EOR in oilfields of Ohio. Environmental Geosciences.
• Kelley, M., Abbaszadeh, M., Mishra, S, Mawalkar, S., Place, M., Gupta, N, Pardini, R., 2014, Reservoir Characterization from Pressure Monitoring during CO2 Injection into a Depleted Pinnacle Reef – MRCSP Commercial-scale CCS Demonstration Project. Energy Procedia, v. 63, p. 4937-4964, ISSN 1876-6102
• Ravi Ganesh, P., Mishra, S., Mawalkar, S., Gupta, N and Pardini, R., 2014, Assessment of CO2 injectivity and storage capacity in a depleted pinnacle reef oil field in northern Michigan. Energy Procedia, v. 63, p. 2969-2976.
• Miller, J. , Sullivan, C., Larsen, G., Kelley, M., Rike, W., Gerst, J., Gupta, N., Paul, D., Pardini, R., and Modroo, A., 2014, Alternative conceptual geologic models for CO2 injection in a Niagaran pinnacle reef oil field, Northern Michigan, USA. Energy Procedia, v. 63, p. 3685–3701.
• Gupta, N., Paul, D., Cumming, L., et al., 2014, Testing for Large-scale CO2-EOR and Geologic Storage in the Midwestern USA, Energy Procedia, v. 63, p. 6393-6403.
• Gupta, N., L. Cumming, et al., 2013. Monitoring and Modeling CO2 Behavior in Multiple Oil Bearing Carbonate Reefs for a Large Scale Demonstration in Northern Lower Michigan. Energy Procedia, v. 37, p. 6800-6807.
• Oruganti, Y.D., and S. Mishra, 2013, An improved simplified analytical model for CO2 plume movement and pressure buildup in deep saline formations. International Journal of Greenhouse Gas Control, v. 14, p. 49–59
• Swickrath, M., Mishra, S., and Ravi Ganesh, P., 2015, An Evaluation of Sharp Interface Models for CO2-Brine Displacement in Aquifers, Groundwater, DOI 10.1111/gwat.12366
57