microwave remote sensing of jupiter's atmosphere from an orbiting spacecraft
TRANSCRIPT
s
ant andemperatureermine thee from the
Icarus 173 (2005) 447–453www.elsevier.com/locate/icaru
Microwave remote sensing of Jupiter’s atmospherefrom an orbiting spacecraft
M.A. Janssena,∗, M.D. Hofstadtera, S. Gulkisa, A.P. Ingersollb, M. Allison c, S.J. Boltona,S.M. Levina, L.W. Kampa
a Jet Propulsion Laboratory/Caltech, 4800 Oak Grove Drive, Pasadena, CA 91109, USAb 150-21, California Institute of Technology, 1200 E. California Blvd., Pasadena, CA 91125, USA
c NASA Goddard Institute for Space Studies, 2880 Broadway, New York, NY 10025, USA
Received 17 December 2003; revised 6 August 2004
Available online 13 October 2004
Abstract
Microwave remote sounding from a spacecraft flying by or in orbit around Jupiter offers new possibilities for retrieving importpresently poorly understood properties of its atmosphere. In particular, we show that precise measurements of relative brightness tas a function of off-nadir emission angles, combined with absolute brightness temperature measurements, can allow us to detglobal abundances of water and ammonia and study the dynamics and deep circulations of the atmosphere in the altitude rangammonia cloud region to depths greater than 30 bars in a manner which would not be achievable with ground-based telescopes. 2004 Elsevier Inc. All rights reserved.
Keywords: Jupiter, atmosphere; Abundances, interior; Radio observations; Radiative transfer
gh-eryin-
ctedhereson)diffi-theopti-diont-tess intion
s ofp at-
rican-y in-ronon atrva-adeheForde
belts,
1. Introduction
Ground-based work to date, based mainly on hiresolution radio-wavelength observations made at the VLarge Array, has established a thermal spectrum for thetegrated disk emission of Jupiter that shows the expelong-wavelength thermal signature of the deep atmosp(e.g.,Berge and Gulkis, 1976; de Pater et al., 2001; Gibet al., 2004). However, as shown byde Pater et al. (2004,the integrated disk brightness temperature spectrum iscult to interpret in terms of its deep composition, even ifmeasurement uncertainties were as low as one mightmistically expect to achieve with a large ground-based ratelescope (2–5%). Causes of this difficulty include accouing for the non-thermal synchrotron radiation that dominathe planet’s emission at long wavelengths, uncertaintieatmospheric structure, cloud properties, and the absorp
* Corresponding author. Fax: +1-818-354-8895.E-mail address: [email protected](M.A. Janssen).
0019-1035/$ – see front matter 2004 Elsevier Inc. All rights reserved.doi:10.1016/j.icarus.2004.08.012
coefficients of water and ammonia under the conditionhigh temperature and pressure encountered in the deemosphere.
2. Observation from an orbiting platform
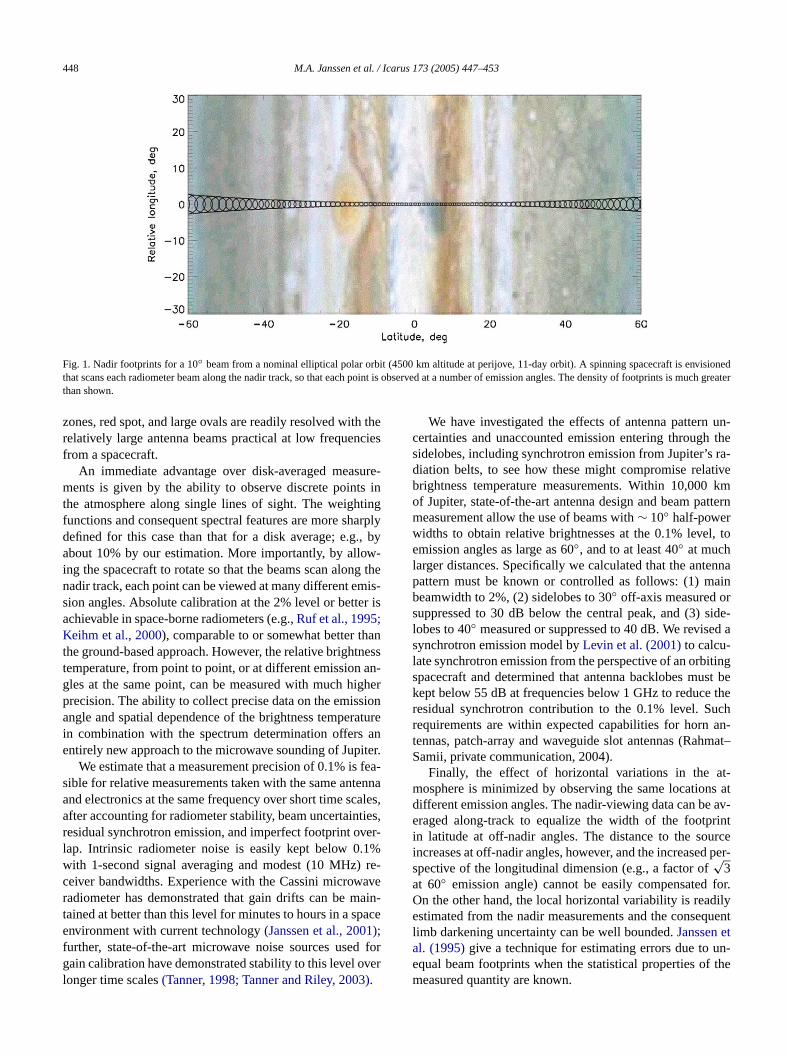
Observation of Jupiter’s long-wavelength atmospheemission from an orbiting spacecraft offers many advtages over Earth-based observations. A spacecraft can flside the radiation belts, effectively avoiding the synchrotemission that obscures the atmospheric thermal emissilonger wavelengths. An orbiting spacecraft allows obsetions with global coverage and high spatial resolution, mdifficult from the VLA because of Jupiter’s rotation and tneed to perform rotational synthesis to image the planet.example,Fig. 1shows the nadir-viewing footprints affordeby an elliptical polar orbit with a perijove of 4500 km at thequator and a 20RJ apojove (∼ 11-day period). This figuredemonstrates that major dynamical features such as the
448 M.A. Janssen et al. / Icarus 173 (2005) 447–453
isionedmuch gr
Fig. 1. Nadir footprints for a 10◦ beam from a nominal elliptical polar orbit (4500 km altitude at perijove, 11-day orbit). A spinning spacecraft is envthat scans each radiometer beam along the nadir track, so that each point is observed at a number of emission angles. The density of footprints iseaterthan shown.
h thecies
ure-in
tingarpl
., byw-g this-
r is
annesan-gheionaturaniter.fea-ennaales
ties,ver-1%re-
aveain-ace)
forver
)
un-the
ra-tivekm
ttern
l, to
nnaainride-
ed a
tingst bethe
uchan-mat–
t-s atav-
rintrceper-
for.ily
quenttun-the
zones, red spot, and large ovals are readily resolved witrelatively large antenna beams practical at low frequenfrom a spacecraft.
An immediate advantage over disk-averaged measments is given by the ability to observe discrete pointsthe atmosphere along single lines of sight. The weighfunctions and consequent spectral features are more shdefined for this case than that for a disk average; e.gabout 10% by our estimation. More importantly, by alloing the spacecraft to rotate so that the beams scan alonnadir track, each point can be viewed at many different emsion angles. Absolute calibration at the 2% level or betteachievable in space-borne radiometers (e.g.,Ruf et al., 1995;Keihm et al., 2000), comparable to or somewhat better ththe ground-based approach. However, the relative brighttemperature, from point to point, or at different emissiongles at the same point, can be measured with much hiprecision. The ability to collect precise data on the emissangle and spatial dependence of the brightness temperin combination with the spectrum determination offersentirely new approach to the microwave sounding of Jup
We estimate that a measurement precision of 0.1% issible for relative measurements taken with the same antand electronics at the same frequency over short time scafter accounting for radiometer stability, beam uncertainresidual synchrotron emission, and imperfect footprint olap. Intrinsic radiometer noise is easily kept below 0.with 1-second signal averaging and modest (10 MHz)ceiver bandwidths. Experience with the Cassini microwradiometer has demonstrated that gain drifts can be mtained at better than this level for minutes to hours in a spenvironment with current technology(Janssen et al., 2001;further, state-of-the-art microwave noise sources usedgain calibration have demonstrated stability to this level olonger time scales(Tanner, 1998; Tanner and Riley, 2003.
y
e
s
r
e
,
We have investigated the effects of antenna patterncertainties and unaccounted emission entering throughsidelobes, including synchrotron emission from Jupiter’sdiation belts, to see how these might compromise relabrightness temperature measurements. Within 10,000of Jupiter, state-of-the-art antenna design and beam pameasurement allow the use of beams with∼ 10◦ half-powerwidths to obtain relative brightnesses at the 0.1% leveemission angles as large as 60◦, and to at least 40◦ at muchlarger distances. Specifically we calculated that the antepattern must be known or controlled as follows: (1) mbeamwidth to 2%, (2) sidelobes to 30◦ off-axis measured osuppressed to 30 dB below the central peak, and (3) slobes to 40◦ measured or suppressed to 40 dB. We revissynchrotron emission model byLevin et al. (2001)to calcu-late synchrotron emission from the perspective of an orbispacecraft and determined that antenna backlobes mukept below 55 dB at frequencies below 1 GHz to reduceresidual synchrotron contribution to the 0.1% level. Srequirements are within expected capabilities for horntennas, patch-array and waveguide slot antennas (RahSamii, private communication, 2004).
Finally, the effect of horizontal variations in the amosphere is minimized by observing the same locationdifferent emission angles. The nadir-viewing data can beeraged along-track to equalize the width of the footpin latitude at off-nadir angles. The distance to the souincreases at off-nadir angles, however, and the increasedspective of the longitudinal dimension (e.g., a factor of
√3
at 60◦ emission angle) cannot be easily compensatedOn the other hand, the local horizontal variability is readestimated from the nadir measurements and the conselimb darkening uncertainty can be well bounded.Janssen eal. (1995)give a technique for estimating errors due toequal beam footprints when the statistical properties ofmeasured quantity are known.
Microwave remote sensing of Jupiter’s atmosphere from orbit 449
r’sd in
ativeables in-e
anentes
ad
lar
ea isiontem-the
ar-as-
r
uen-r’s
rodeloniat cal-ldwa-rther.
3. Modeling Jupiter’s atmospheric emission
Our radiative transfer program for computing Jupiteatmospheric emission is based on the one describeHofstadter, 1992; and in Hofstadter and Butler, 2003. Itassumes a convective atmosphere with constant relhumidity (an adjustable parameter) for each condensspecies above its cloud base. Microwave opacity sourceclude H2O, NH3, H2, and a liquid water cloud, while thmodel atmosphere also contains He and CH4. Scattering isneglected. The temperature profile at pressures less thbar is taken from the Voyager radio occultation experim(Lindal, 1992), with an extrapolation to higher pressuralong a pseudo-adiabat. The lapse rate is appropriatelyjusted for condensable species. The He to H2 ratio is 0.157and the CH4 molar mixing ratio is 1.8 × 10⁻³ relative tototal abundance (consistent withAtreya et al., 1999, butnote that they quote abundances relative to H2). The mix-ing ratios for NH3 and H2O are adjustable; three times soabundances are defined to be 5.79× 10⁻⁴ and 4.41× 10⁻³,respectively(Anders and Grevesse, 1989). No loss of NH3
1
-
into the water or a possible NH4SH cloud is considered. Thabsorption coefficient and lineshape profile for ammonifrom Spilker, 1993. For water vapor we use an expressbased on laboratory data over a range of pressure andperature applicable to Jupiter down to approximately30-bar pressure (500 K temperature) level(Ho et al., 1966;Goodman, 1969). The base of the model atmosphere isbitrarily placed at 1000 bar, with isothermal conditionssumed below this.
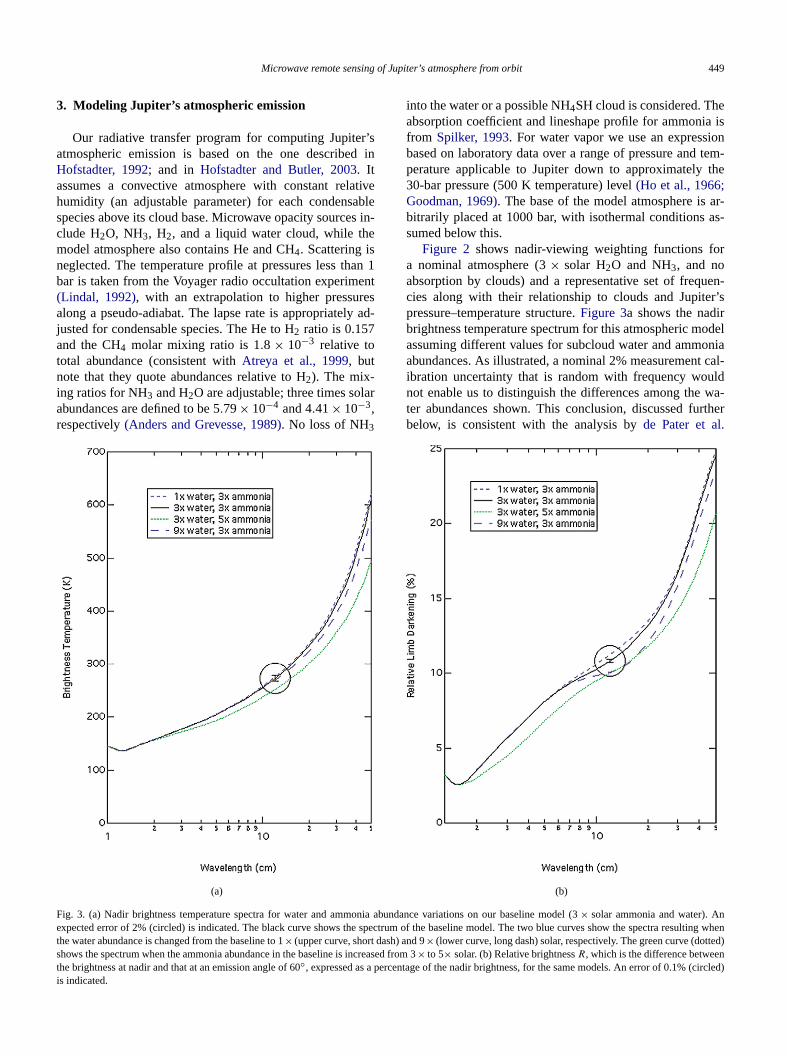
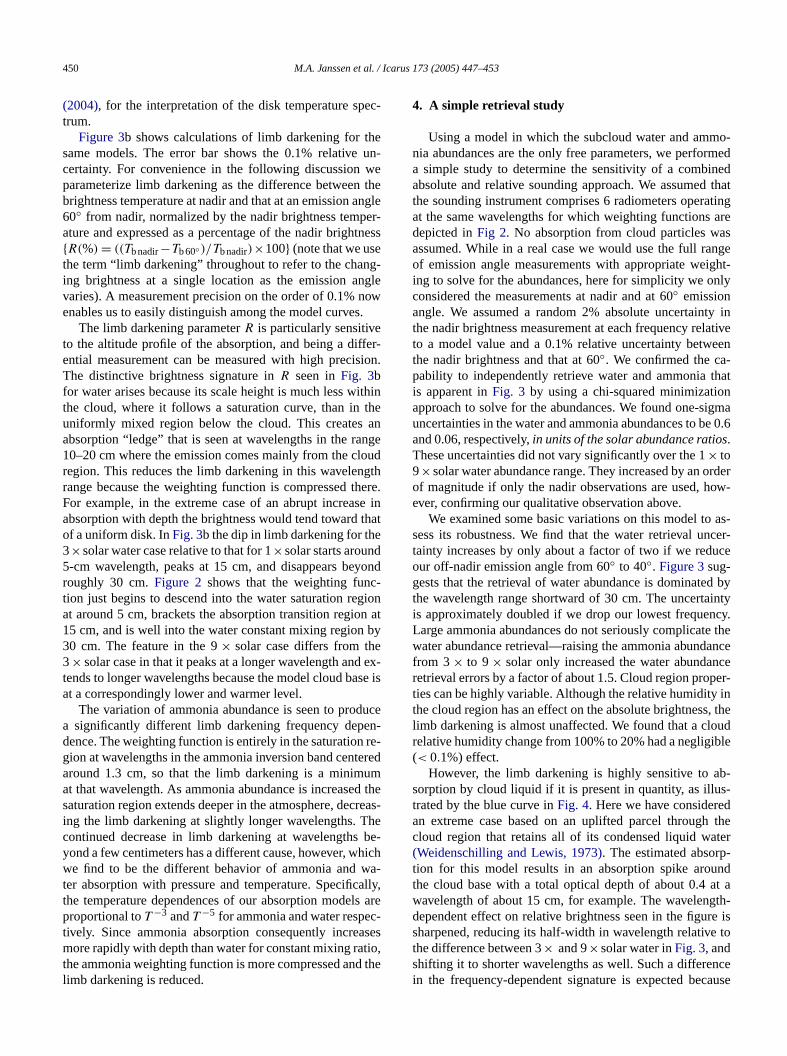
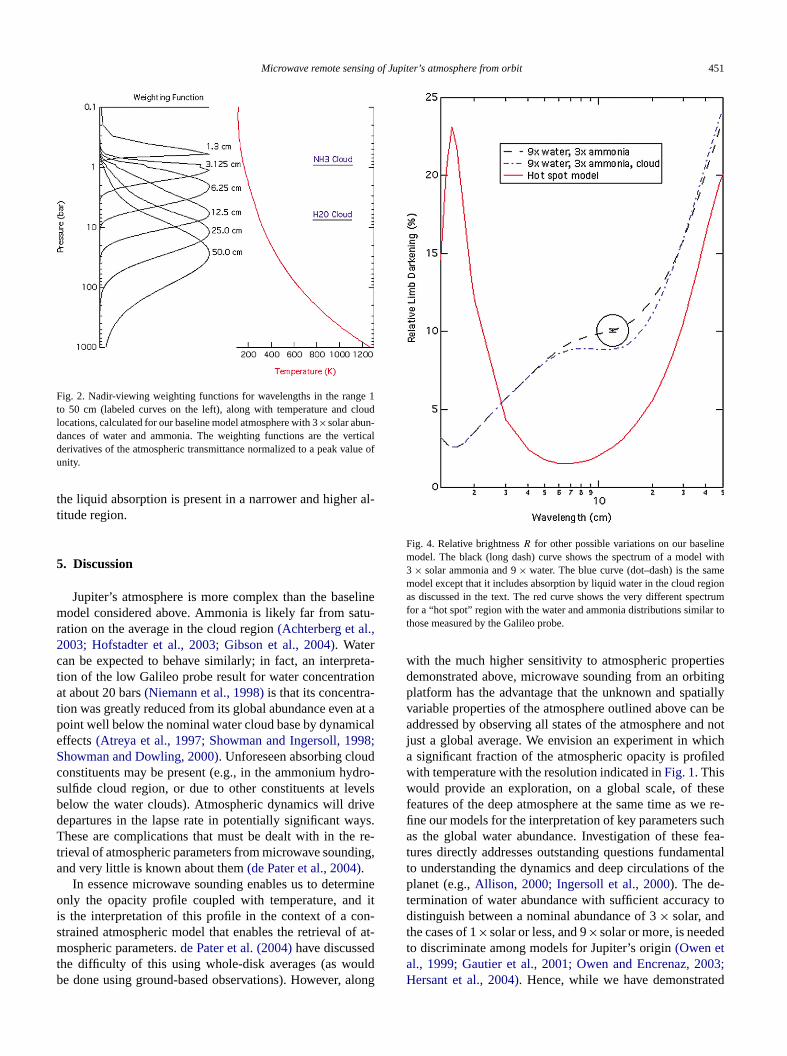
Figure 2 shows nadir-viewing weighting functions foa nominal atmosphere (3× solar H2O and NH3, and noabsorption by clouds) and a representative set of freqcies along with their relationship to clouds and Jupitepressure–temperature structure.Figure 3a shows the nadibrightness temperature spectrum for this atmospheric massuming different values for subcloud water and ammabundances. As illustrated, a nominal 2% measuremenibration uncertainty that is random with frequency wounot enable us to distinguish the differences among theter abundances shown. This conclusion, discussed fubelow, is consistent with the analysis byde Pater et al
nulting whtted)n(circled)
(a) (b)
Fig. 3. (a) Nadir brightness temperature spectra for water and ammonia abundance variations on our baseline model (3× solar ammonia and water). Aexpected error of 2% (circled) is indicated. The black curve shows the spectrum of the baseline model. The two blue curves show the spectra resenthe water abundance is changed from the baseline to 1× (upper curve, short dash) and 9× (lower curve, long dash) solar, respectively. The green curve (doshows the spectrum when the ammonia abundance in the baseline is increased from 3× to 5× solar. (b) Relative brightnessR, which is the difference betweethe brightness at nadir and that at an emission angle of 60◦, expressed as a percentage of the nadir brightness, for the same models. An error of 0.1%is indicated.
450 M.A. Janssen et al. / Icarus 173 (2005) 447–453
ec-
heun-
wethe
angler-tnes
g-nglenows.
fer-sion
ithintheanngeoudgthheree inthatedyond-
gionn atby
eex-se i
ucen-re-
eredumd threahebe-hicha-
ally,ls arc-ses
tio,the
o-rmedned
thatatingaresnge
ight-nly
ty inlativeeen-thatnigmae 0.6
orderow-
as-cer-ce
d byintycy.e theancenceer-in, theud
ible
b-s-dthe
ter-nd
at agth-re is
to
nceause
(2004), for the interpretation of the disk temperature sptrum.
Figure 3b shows calculations of limb darkening for tsame models. The error bar shows the 0.1% relativecertainty. For convenience in the following discussionparameterize limb darkening as the difference betweenbrightness temperature at nadir and that at an emission60◦ from nadir, normalized by the nadir brightness tempature and expressed as a percentage of the nadir brigh{R(%) = ((Tbnadir−Tb60◦)/Tbnadir)×100} (note that we usethe term “limb darkening” throughout to refer to the chaning brightness at a single location as the emission avaries). A measurement precision on the order of 0.1%enables us to easily distinguish among the model curve
The limb darkening parameterR is particularly sensitiveto the altitude profile of the absorption, and being a difential measurement can be measured with high preciThe distinctive brightness signature inR seen inFig. 3bfor water arises because its scale height is much less wthe cloud, where it follows a saturation curve, than inuniformly mixed region below the cloud. This createsabsorption “ledge” that is seen at wavelengths in the ra10–20 cm where the emission comes mainly from the clregion. This reduces the limb darkening in this wavelenrange because the weighting function is compressed tFor example, in the extreme case of an abrupt increasabsorption with depth the brightness would tend towardof a uniform disk. InFig. 3b the dip in limb darkening for th3×solar water case relative to that for 1×solar starts aroun5-cm wavelength, peaks at 15 cm, and disappears beroughly 30 cm.Figure 2 shows that the weighting function just begins to descend into the water saturation reat around 5 cm, brackets the absorption transition regio15 cm, and is well into the water constant mixing region30 cm. The feature in the 9× solar case differs from th3× solar case in that it peaks at a longer wavelength andtends to longer wavelengths because the model cloud baat a correspondingly lower and warmer level.
The variation of ammonia abundance is seen to proda significantly different limb darkening frequency depedence. The weighting function is entirely in the saturationgion at wavelengths in the ammonia inversion band centaround 1.3 cm, so that the limb darkening is a minimat that wavelength. As ammonia abundance is increasesaturation region extends deeper in the atmosphere, decing the limb darkening at slightly longer wavelengths. Tcontinued decrease in limb darkening at wavelengthsyond a few centimeters has a different cause, however, wwe find to be the different behavior of ammonia and wter absorption with pressure and temperature. Specificthe temperature dependences of our absorption modeproportional toT −3 andT −5 for ammonia and water respetively. Since ammonia absorption consequently increamore rapidly with depth than water for constant mixing rathe ammonia weighting function is more compressed andlimb darkening is reduced.
e
s
.
.
s
es-
e
4. A simple retrieval study
Using a model in which the subcloud water and ammnia abundances are the only free parameters, we perfoa simple study to determine the sensitivity of a combiabsolute and relative sounding approach. We assumedthe sounding instrument comprises 6 radiometers operat the same wavelengths for which weighting functionsdepicted inFig 2. No absorption from cloud particles waassumed. While in a real case we would use the full raof emission angle measurements with appropriate weing to solve for the abundances, here for simplicity we oconsidered the measurements at nadir and at 60◦ emissionangle. We assumed a random 2% absolute uncertainthe nadir brightness measurement at each frequency reto a model value and a 0.1% relative uncertainty betwthe nadir brightness and that at 60◦. We confirmed the capability to independently retrieve water and ammoniais apparent inFig. 3 by using a chi-squared minimizatioapproach to solve for the abundances. We found one-suncertainties in the water and ammonia abundances to band 0.06, respectively,in units of the solar abundance ratios.These uncertainties did not vary significantly over the 1× to9×solar water abundance range. They increased by anof magnitude if only the nadir observations are used, hever, confirming our qualitative observation above.
We examined some basic variations on this model tosess its robustness. We find that the water retrieval untainty increases by only about a factor of two if we reduour off-nadir emission angle from 60◦ to 40◦. Figure 3sug-gests that the retrieval of water abundance is dominatethe wavelength range shortward of 30 cm. The uncertais approximately doubled if we drop our lowest frequenLarge ammonia abundances do not seriously complicatwater abundance retrieval—raising the ammonia abundfrom 3× to 9× solar only increased the water abundaretrieval errors by a factor of about 1.5. Cloud region propties can be highly variable. Although the relative humiditythe cloud region has an effect on the absolute brightnesslimb darkening is almost unaffected. We found that a clorelative humidity change from 100% to 20% had a neglig(< 0.1%) effect.
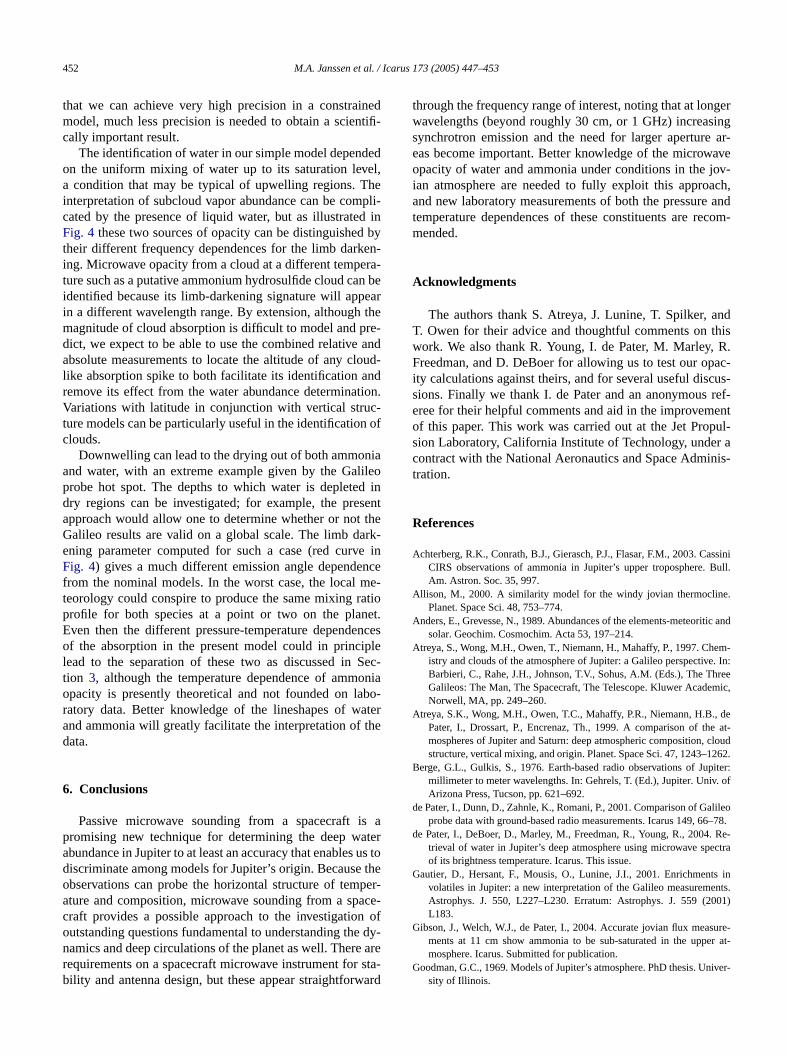
However, the limb darkening is highly sensitive to asorption by cloud liquid if it is present in quantity, as illutrated by the blue curve inFig. 4. Here we have considerean extreme case based on an uplifted parcel throughcloud region that retains all of its condensed liquid wa(Weidenschilling and Lewis, 1973). The estimated absorption for this model results in an absorption spike arouthe cloud base with a total optical depth of about 0.4wavelength of about 15 cm, for example. The wavelendependent effect on relative brightness seen in the figusharpened, reducing its half-width in wavelength relativethe difference between 3× and 9×solar water inFig. 3, andshifting it to shorter wavelengths as well. Such a differein the frequency-dependent signature is expected bec
Microwave remote sensing of Jupiter’s atmosphere from orbit 451
e 1loud
rticalue of
r al-
linetu-,
eta-ion-at a
ical98;ddro-els
iveys.re-
ing,
mineit
n-f at-duldlong
newithmeion
ctrumr to
tiestingiallyn bed notich
led
esee re-uchfea-entalf the
to
d
03;ed
Fig. 2. Nadir-viewing weighting functions for wavelengths in the rangto 50 cm (labeled curves on the left), along with temperature and clocations, calculated for our baseline model atmosphere with 3×solar abun-dances of water and ammonia. The weighting functions are the vederivatives of the atmospheric transmittance normalized to a peak valunity.
the liquid absorption is present in a narrower and highetitude region.
5. Discussion
Jupiter’s atmosphere is more complex than the basemodel considered above. Ammonia is likely far from saration on the average in the cloud region(Achterberg et al.2003; Hofstadter et al., 2003; Gibson et al., 2004). Watercan be expected to behave similarly; in fact, an interprtion of the low Galileo probe result for water concentratat about 20 bars(Niemann et al., 1998)is that its concentration was greatly reduced from its global abundance evenpoint well below the nominal water cloud base by dynameffects(Atreya et al., 1997; Showman and Ingersoll, 19Showman and Dowling, 2000). Unforeseen absorbing clouconstituents may be present (e.g., in the ammonium hysulfide cloud region, or due to other constituents at levbelow the water clouds). Atmospheric dynamics will drdepartures in the lapse rate in potentially significant waThese are complications that must be dealt with in thetrieval of atmospheric parameters from microwave soundand very little is known about them(de Pater et al., 2004).
In essence microwave sounding enables us to deteronly the opacity profile coupled with temperature, andis the interpretation of this profile in the context of a costrained atmospheric model that enables the retrieval omospheric parameters.de Pater et al. (2004)have discussethe difficulty of this using whole-disk averages (as wobe done using ground-based observations). However, a
Fig. 4. Relative brightnessR for other possible variations on our baselimodel. The black (long dash) curve shows the spectrum of a model3 × solar ammonia and 9× water. The blue curve (dot–dash) is the samodel except that it includes absorption by liquid water in the cloud regas discussed in the text. The red curve shows the very different spefor a “hot spot” region with the water and ammonia distributions similathose measured by the Galileo probe.
with the much higher sensitivity to atmospheric properdemonstrated above, microwave sounding from an orbiplatform has the advantage that the unknown and spatvariable properties of the atmosphere outlined above caaddressed by observing all states of the atmosphere anjust a global average. We envision an experiment in wha significant fraction of the atmospheric opacity is profiwith temperature with the resolution indicated inFig. 1. Thiswould provide an exploration, on a global scale, of thfeatures of the deep atmosphere at the same time as wfine our models for the interpretation of key parameters sas the global water abundance. Investigation of thesetures directly addresses outstanding questions fundamto understanding the dynamics and deep circulations oplanet (e.g.,Allison, 2000; Ingersoll et al., 2000). The de-termination of water abundance with sufficient accuracydistinguish between a nominal abundance of 3× solar, andthe cases of 1×solar or less, and 9×solar or more, is needeto discriminate among models for Jupiter’s origin(Owen etal., 1999; Gautier et al., 2001; Owen and Encrenaz, 20Hersant et al., 2004). Hence, while we have demonstrat
452 M.A. Janssen et al. / Icarus 173 (2005) 447–453
nedntifi-
edel,hepli-
d inby
en-ra-n beearthere-andoud-ndtion.c-
of
niaileod insenttherk-e innce
me-atioet.nce
pleSeconiabo-aterhe
s aaterus ttheper-ace-
ofdyare
sta-ard
geringar-
aveov-ach,
andcom-
ndhisR.ac-
cus-ref-ent
pul-r anis-
ssiniBull.
e.
ic and
em-. In:
hreemic,
dee at-cloud262.piter:. of
lileo–78.Re-
ectra
ts innts.01)
sure-er at-
iver-
that we can achieve very high precision in a constraimodel, much less precision is needed to obtain a sciecally important result.
The identification of water in our simple model dependon the uniform mixing of water up to its saturation leva condition that may be typical of upwelling regions. Tinterpretation of subcloud vapor abundance can be comcated by the presence of liquid water, but as illustrateFig. 4 these two sources of opacity can be distinguishedtheir different frequency dependences for the limb darking. Microwave opacity from a cloud at a different tempeture such as a putative ammonium hydrosulfide cloud caidentified because its limb-darkening signature will appin a different wavelength range. By extension, althoughmagnitude of cloud absorption is difficult to model and pdict, we expect to be able to use the combined relativeabsolute measurements to locate the altitude of any cllike absorption spike to both facilitate its identification aremove its effect from the water abundance determinaVariations with latitude in conjunction with vertical struture models can be particularly useful in the identificationclouds.
Downwelling can lead to the drying out of both ammoand water, with an extreme example given by the Galprobe hot spot. The depths to which water is depletedry regions can be investigated; for example, the preapproach would allow one to determine whether or notGalileo results are valid on a global scale. The limb daening parameter computed for such a case (red curvFig. 4) gives a much different emission angle dependefrom the nominal models. In the worst case, the localteorology could conspire to produce the same mixing rprofile for both species at a point or two on the planEven then the different pressure-temperature dependeof the absorption in the present model could in princilead to the separation of these two as discussed intion 3, although the temperature dependence of ammopacity is presently theoretical and not founded on laratory data. Better knowledge of the lineshapes of wand ammonia will greatly facilitate the interpretation of tdata.
6. Conclusions
Passive microwave sounding from a spacecraft ipromising new technique for determining the deep wabundance in Jupiter to at least an accuracy that enablesdiscriminate among models for Jupiter’s origin. Becauseobservations can probe the horizontal structure of temature and composition, microwave sounding from a spcraft provides a possible approach to the investigationoutstanding questions fundamental to understanding thenamics and deep circulations of the planet as well. Thererequirements on a spacecraft microwave instrument forbility and antenna design, but these appear straightforw
s
-
o
-
through the frequency range of interest, noting that at lonwavelengths (beyond roughly 30 cm, or 1 GHz) increassynchrotron emission and the need for larger apertureeas become important. Better knowledge of the microwopacity of water and ammonia under conditions in the jian atmosphere are needed to fully exploit this approand new laboratory measurements of both the pressuretemperature dependences of these constituents are remended.
Acknowledgments
The authors thank S. Atreya, J. Lunine, T. Spilker, aT. Owen for their advice and thoughtful comments on twork. We also thank R. Young, I. de Pater, M. Marley,Freedman, and D. DeBoer for allowing us to test our opity calculations against theirs, and for several useful dissions. Finally we thank I. de Pater and an anonymouseree for their helpful comments and aid in the improvemof this paper. This work was carried out at the Jet Prosion Laboratory, California Institute of Technology, undecontract with the National Aeronautics and Space Admitration.
References
Achterberg, R.K., Conrath, B.J., Gierasch, P.J., Flasar, F.M., 2003. CaCIRS observations of ammonia in Jupiter’s upper troposphere.Am. Astron. Soc. 35, 997.
Allison, M., 2000. A similarity model for the windy jovian thermoclinPlanet. Space Sci. 48, 753–774.
Anders, E., Grevesse, N., 1989. Abundances of the elements-meteoritsolar. Geochim. Cosmochim. Acta 53, 197–214.
Atreya, S., Wong, M.H., Owen, T., Niemann, H., Mahaffy, P., 1997. Chistry and clouds of the atmosphere of Jupiter: a Galileo perspectiveBarbieri, C., Rahe, J.H., Johnson, T.V., Sohus, A.M. (Eds.), The TGalileos: The Man, The Spacecraft, The Telescope. Kluwer AcadeNorwell, MA, pp. 249–260.
Atreya, S.K., Wong, M.H., Owen, T.C., Mahaffy, P.R., Niemann, H.B.,Pater, I., Drossart, P., Encrenaz, Th., 1999. A comparison of thmospheres of Jupiter and Saturn: deep atmospheric composition,structure, vertical mixing, and origin. Planet. Space Sci. 47, 1243–1
Berge, G.L., Gulkis, S., 1976. Earth-based radio observations of Jumillimeter to meter wavelengths. In: Gehrels, T. (Ed.), Jupiter. UnivArizona Press, Tucson, pp. 621–692.
de Pater, I., Dunn, D., Zahnle, K., Romani, P., 2001. Comparison of Gaprobe data with ground-based radio measurements. Icarus 149, 66
de Pater, I., DeBoer, D., Marley, M., Freedman, R., Young, R., 2004.trieval of water in Jupiter’s deep atmosphere using microwave spof its brightness temperature. Icarus. This issue.
Gautier, D., Hersant, F., Mousis, O., Lunine, J.I., 2001. Enrichmenvolatiles in Jupiter: a new interpretation of the Galileo measuremeAstrophys. J. 550, L227–L230. Erratum: Astrophys. J. 559 (20L183.
Gibson, J., Welch, W.J., de Pater, I., 2004. Accurate jovian flux meaments at 11 cm show ammonia to be sub-saturated in the uppmosphere. Icarus. Submitted for publication.
Goodman, G.C., 1969. Models of Jupiter’s atmosphere. PhD thesis. Unsity of Illinois.
Microwave remote sensing of Jupiter’s atmosphere from orbit 453
the.f mi-phys.
sis.
p at-
idityull.
lileothe
.ave
ature
AR/ion.diohaft,
e-mote
rne,es.
ccul-
an,a-ianGeo-
tios in
ar-iant
aveture
er’s
data
ver-hys.
me-
ility
tures
Hersant, F., Gautier, D., Lunine, J.I., 2004. Enrichment in volatiles ingiant planets of the Solar System. Planet. Space Sci. 52, 623–641
Ho, W., Kaufman, I.A., Thaddeus, P., 1966. Laboratory measurement ocrowave absorption in models of the atmosphere of Venus. J. GeoRes. 71, 5091–5108.
Hofstadter, M.D. 1992. Microwave observations of Uranus. PhD theCalifornia Institute of Technology.
Hofstadter, M.D., Butler, B.J., 2003. Seasonal change in the deemosphere of Uranus. Icarus 165, 168–180.
Hofstadter, M.D., Readhead, T., Gulkis, S., Reeves, R., 2003. Humabove the jovian NH3 clouds from radio measurements near 1 cm. BAm. Astron. Soc. 35, 1014.
Ingersoll, A.P., Gierasch, P.J., Banfield, D., Vasavada, A.R., the GaImaging Team, 2000. Moist convection as an energy source forlarge-scale motions in Jupiter’s atmosphere. Nature 403, 630–632
Janssen, M.A., Ruf, C.S., Keihm, S.J., 1995. TOPEX/Poseidon microwradiometer. II. Antenna pattern correction and brightness temperalgorithm. IEEE Trans. Geosci. Remote Sensing 33, 138–146.
Janssen, M.A., Bolton, S.J., 19 colleagues, 2001. Cassini RADradiometer and VLA observations of Jupiter’s synchrotron emissIn: Rucker, H.O., Kaiser, M.L., LeBlanc, Y. (Eds.), Planetary RaEmissions V. Verlag der Osterreichischen Akadamie der WissensVienna, pp. 229–236.
Keihm, S.J., Zlotnicki, V., Ruf, C.S., 2000. TOPEX microwave radiomter performance evaluation, 1992–1998. IEEE Trans. Geosci. ReSensing 38, 1379–1386.
Levin, S.M., Bolton, S.J., Bhattacharya, B., Gulkis, S., Klein, M.J., ThoR.M., 2001. Modeling Jupiter’s synchrotron emission. Geophys. RLett. 28 (5), 903–906.
Lindal, G.F., 1992. The atmosphere of Neptune: an analysis of radio otation data acquired with Voyager 2. Astron. J. 103, 967–982.
Niemann, H.B., Atreya, S.K., Carignan, G.R., Donahue, T.M., HabermJ.A., Harpold, D.N., Hartle, R.E., Hunten, D.M., Kasprzak, W.T., Mhaffy, P.R., Owen, T.C., Way, S.H., 1998. The composition of the jovatmosphere as determined by the Galileo mass spectrometer. J.phys. Res. 103 (E10), 22831–22845.
Owen, T.C., Encrenaz, T., 2003. Element abundances and isotope rathe giant planets. Space Sci. Rev. 106, 121–138.
Owen, T.C., Mahaffy, P., Niemann, H.B., Atreya, S.K., Donahue, T.M., BNun, A., de Pater, I., 1999. A new constraint on the formation of gplanets. Nature 402, 269–270.
Ruf, C.S., Keihm, S.J., Janssen, M.A., 1995. TOPEX/Poseidon microwradiometer (TMR): I. Instrument description and antenna temperacalibration. IEEE Trans. Geosci. Remote Sensing 33, 125–137.
Showman, A.P., Dowling, T.E., 2000. Nonlinear simulations of Jupit5-µm hot spots. Science 289, 1737–1740.
Showman, A.P., Ingersoll, A.P., 1998. Interpretation of Galileo probeand implications for Jupiter’s dry downdrafts. Icarus 132, 205–220.
Spilker, T.R., 1993. New laboratory measurements on ammonia’s insion spectrum, with implications for planetary atmospheres. J. GeopRes. 98, 5539–5548.
Tanner, A.B., 1998. Development of a high-stability water vapor radioter. Radio Sci. 33 (2), 449–462.
Tanner, A.B., Riley, A.L., 2003. Design and performance of a high-stabwater vapor radiometer. Radio Sci. 38 (3), 1–12.
Weidenschilling, S.J., Lewis, J.S., 1973. Atmospheric and cloud strucof the jovian planets. Icarus 20, 465–476.