microwave assisted production of silver nanoparticles ... · microwave assisted production of...
TRANSCRIPT
Accepted Manuscript
Microwave assisted production of silver nanoparticles using green tea extracts
Münevver Sökmen, Suliman Yousuf Alomar, Cansu Albay, Gönül Serdar
PII: S0925-8388(17)32459-3
DOI: 10.1016/j.jallcom.2017.07.094
Reference: JALCOM 42510
To appear in: Journal of Alloys and Compounds
Received Date: 6 April 2017
Revised Date: 4 June 2017
Accepted Date: 8 July 2017
Please cite this article as: Mü. Sökmen, S.Y. Alomar, C. Albay, Göü. Serdar, Microwave assistedproduction of silver nanoparticles using green tea extracts, Journal of Alloys and Compounds (2017),doi: 10.1016/j.jallcom.2017.07.094.
This is a PDF file of an unedited manuscript that has been accepted for publication. As a service toour customers we are providing this early version of the manuscript. The manuscript will undergocopyediting, typesetting, and review of the resulting proof before it is published in its final form. Pleasenote that during the production process errors may be discovered which could affect the content, and alllegal disclaimers that apply to the journal pertain.
MA
NU
SC
RIP
T
AC
CE
PTE
D
ACCEPTED MANUSCRIPT
MA
NU
SC
RIP
T
AC
CE
PTE
D
ACCEPTED MANUSCRIPT
1
Microwave assisted production of silver nanoparticles
using green tea extracts
Münevver Sökmen*a,b
, Suliman Yousuf Alomara, Cansu Albay
c, Gönül Serdar
d
a King Saud University, College of Science, Riyad 11451, Saudi Arabia
b Konya Food and Agriculture University, Faculty of Engineering and Architecture,
Department of Bioengineering, 42080 Konya, Turkey
c Karadeniz Technical University, Faculty of Science, Department of Chemistry, 61080
Trabzon, Turkey
d Karadeniz Technical University, Faculty of Pharmacy, 61080 Trabzon, Turkey
*Authors to whom correspondence should be addressed
Telephone: +90 332 2235488 (M. Sökmen)
Fax: +90 332 2235490
e-mail: [email protected]
MA
NU
SC
RIP
T
AC
CE
PTE
D
ACCEPTED MANUSCRIPT
2
Abstract
This study was designed to produce metallic silver nanoparticles (AgNPs) using green
tea extract and microwave power. Two approaches were employed for AgNP production.
Firstly, crude aqueous tea extract was filtrated and directly used in microwave assisted
AgNP production system. Secondly, catechins were selectively extracted from crude
extract and 2% (w/v) aqueous solutions of catechin extract has become available in the
same process. A certain volume of extract (0.5 ml or 5 mL) was added to AgNO3 solution
(1-6 mM) and exposed to microwave radiation for 1, 5, 15 and 30 minutes in the presence
and absence of capping agent polyethylene glycol (PEG). Plasmon resonance (SPR)
absorption spectra were measured, thereby optimum conditions were determined. AgNPs
were succesfully produced by both extracts only with 0.5 mL extract volume. Large
volume of extract (5 mL) produced larger particles in all cases. Catechin extract was
superior when compared with crude extract as the former produced high concentration of
AgNPs at average 15 ± 6 nm particle size.
Keywords: Silver nanoparticle, green synthesis, tea extract, catechins
MA
NU
SC
RIP
T
AC
CE
PTE
D
ACCEPTED MANUSCRIPT
3
1. Introduction
Nobel metals have unique properties such as their resistance to harsh conditions.
Silver has been used by various purposes for ages including antimicrobial protection, in
particular. Traditionally Ag-based antiseptic formulations have been used in the control of
bacterial growth in health care such as dentistry, burn healing and disinfection of medical
equipment.
Obviously, nanotechnology has widened the horizon of medical applications for many
metals including silver. It is well-known phenomenon that noble metals exhibit unique
properties when they are produced at nanoscale. The major methods used in silver
nanoparticles (AgNPs) synthesis are the physical and chemical methods that they have
been recently reviewed [1,2]. On the other hand, green chemistry involves the production
of materials using eco-friendly reagents. Recently, different methods have been introduced
to produce AgNPs by means of biomaterials. In this sense, three major sources, e.g.
bacteria, fungi, and plants have become ideal tools for synthesizing AgNPs. Biosynthesis
of silver nanoparticles is a bottom-up approach that mostly involves reduction/oxidation
reactions. Microorganisms have a unique metabolism, enabling metal ions to reduce, and
leading to produce metal nanoparticles. They contain various reductase enzymes that serve
as nanomachines for the production of nano structures. Synthesis of AgNPs by intra- and
extracellular mechanism of bacteria, fungi and yeasts has been recently reviewed by Singh
et al. [2].
Plant derived chemicals and, more precisely, plant extracts have been employed for
ecofriendly, simple, rapid, stable and cost-effective production of AgNPs. Particularly
water-mediated extraction of plant materials have been of great importance and value in
terms of production strategy. The whole plant itself or its leaves, roots, flowers or fruits
have selectively been used in the green synthesis of AgNPs and a number of reviews have
become available in the current literature [2-7]. Plant extracts are reported to be able to
reduce silver ions, faster than fungi or bacteria. Besides, plant-based AgNPs are more
stable when compared to those produced by aforesaid organisms [6] and polyphenols as
well as phenolic acids present in the extract provide extra protection on AgNPs due to
surface interaction between nanoparticle and phenolics.
Extensive literature search showed that some researchers have already used tea
extracts for production of nanoparticles. Tea infusion obtained from fresh green tea or
MA
NU
SC
RIP
T
AC
CE
PTE
D
ACCEPTED MANUSCRIPT
4
processed black tea was used for the production of silver, gold, palladium [6,8-11] iron
[12,13], copper oxide [14] and alumina [15]. Green tea extract can be used as reducing and
stabilizing agent for the biosynthesis of AgNPs in an aqueous solution in ambient
conditions. AgNPs are easily aggregated to form larger colloids and usually require
capping agents to keep the nanoparticles at nanoscale. This protective effect have already
been reported elsewhere [16]. Polyhydroxy groups of catechins reduce silver ions to form
metalic silver, which ultimately leads to the formation of AgNPs. They reported the
formation of a bilayer of phenolics (ca. 6 nm thickness structure) around silver
nanoparticles. Phenolic compounds, epigallocatechin gallate (EGCG) in particular, form
this layer and establish high protection of the particles against aggregation. Therefore,
green chemistry can be a good strategy for production of phenolics-rich extracts as well as
employing them for AgNP production. In this respect, tea extracts, especially green tea,
can be considered as one of the best resources since its polyphenol contents are high.
Begum et al. [8] used black tea infusion for reduction of AgNO3 to obtain metallic
AgNP. Similarly, Loo et al. [9] employed the pu-erh tea leaves (artificially fermented with
microorganisms 6-12 months), being extracted in water at 60°C for 10 minutes. After
filtration crude extract became available for production of AgNP. Nadagouda et al. [10]
employed 1 g of tea powders (Red label from Tata, India Ltd. 99%), boiling them in 50 mL
of water, followed by filtration with a Teflon filter, and resulting tea infusion (10 mL) was
added to 2 mL of 0.1 M AgNO3 solution. AgNPs were reported to be in size ranging from
20 to 60 nm with crystallized in face centered cubic symmetry. Completion of the reaction
was monitored and reported as 120 minutes.
Tea leaf extract was proposed as a simple, environmentally friendly and cost-effective
method concernig the synthesis of AgNPs [6]. The effects of the tea extract dosage,
reaction time and reaction temperature were investigated. AgNPs were synthesized by
using silver nitrate and tea extract in a 2 hours reaction at room temperature. As aforesaid,
FTIR spectral analysis results indicated that the tea extract acted as the reducing and
capping agents on the surface of AgNPs. Furthermore time-dependent release of silver ions
was found to be significantly lower than that of other capping agents, such as poly vinyl
alcohol (PVA). In another study, the infusion was prepared by boiling fresh tea leaves in
water for 5 minutes, followed by filtration and the filtrates (5 mL) were added to 45 mL of
1x10⁻³ M AgNO3 solution in dark. The reaction time for total reduction and the AgNP
formation process were reported as 4 hours.
MA
NU
SC
RIP
T
AC
CE
PTE
D
ACCEPTED MANUSCRIPT
5
In general, both the size and the shape of nanoparticles are variable depending on
production method followed. In the synthesis of silver nanoparticles by green chemistry,
three major effects should always be taken into consideration concerning the reduction of
the corresponding metal ion salt solutions: i) choice of solvent ii) the reducing agent
employed, and iii) the protective capping agent (or coating agent) used. Should all these
parameters are controlled still another parameters are important for mass production such
as production cost and time required. Therefore, environmental friendly extraction and
production methods are necessary.
Microwave assisted extraction (MAE) is a versatile technique that offers lower
extraction period and less energy consumption. Moreover, microwave produces high
temperature regions that ease the disruption of the cell wall if the extracted sample is plant
material. As a result of this effect, active compounds are rapidly and easily extracted into
the solvent. Water can be used in MAE under controlled temperatures. Effective extraction
conditions for tea samples have been reported in our previous work, where citric acid
solution in water was the extracting solvent in MAE, providing catechin rich extract with
the highest phenolic specifically catechins [17].
The aim of this study was to produce the AgNPs by using green tea extracts which
were processed in MAE. Two different strategies were designed. In the first, tea leaves
were directly extracted into citric acid containing water to obtain crude tea extract using
microwave power. This procedure produced the tea leachate containing other water soluble
components. In the second, we isolated catechins using simple liquid-liquid extraction.
Catechins were separated and used in the production of AgNPs by using above mentioned
microwave system. Microwave power is a good tool for the fast reduction of silver ions to
silver nanoparticles at various conditions such as reaction period and presence of capping
agent polyethylene glycol (PEG). Finally, the possible production of AgNP was also
investigated by allowing higher AgNO3 concentrations (keeping the all variables the same)
and employing the same procedure as it provides convenient information about the
reduction capacity of the extract.
2. Experimental methods
2.1. Preparation of tea extract
Green tea samples was supplied by Sürçay San. Co. Ltd. (Sürmene, Trabzon) and all
chemicals used was in analytical grade. Leaves on the uppermost branches were collected
MA
NU
SC
RIP
T
AC
CE
PTE
D
ACCEPTED MANUSCRIPT
6
and placed in sealed plastic bags and then immediately transferred to the laboratory. Tea
leaves were dried in a shade at room temperature. The dried leaves (10 g) and 100 mL
distilled water containing citric acid (0.1 M) was placed in a flask which was then exposed
to microwave irradiation (Milestone, Start S Microwave, USA, 90 W) for 4 min and left
cooling. The filtrate was collected and used for AgNP production (defined as tea extract).
The same procedure was repeated with another portion of green tea leaves. In this case
filtrate was further extracted to separate catechins. Aqueous crude extract was shaken
vigorously with chloroform first to remove the impurities and caffeine present in tea
infusion. Afterwards, the aqueous phase was extracted with ethyl acetate (three times)
using 50 mL ethyl acetate in each extraction to separate catechins. The ethyl acetate phases
were collected and combined. The filtrate was concentrated by a rotary evaporator under
reduced pressure at 55 ± 2 οC. The solid catechine mixture was re-suspended in 10 mL
water and lyophilized. The catechine mixture was dissolved in water (2% w/v) and
directly used for AgNP production (defined as catechin extract).
2.2. Production of AgNP
In a typical experiment, 0.5 mL or 5 mL portions of extract solution was added to
aqueous AgNO3 solution (1 mM-6 mM) and the mixture was exposed to microwave in an
oven at 90 W for 1-30 minutes. Nanoparticle production was carried out in the presence
and absence of stabilizing agent polyethylene glycol (PEG-200, 1%). Each method was
carried out as triplicates.
First of all, the color change was noted by visual observation in flask containing the
tea extract and AgNO3 solution. It was changed from colorless to light yellow/brown after
microwave treatment. This color change is a typical indication of the formation of colloidal
AgNP in the solution.
2.3.AgNP characterization
After production of AgNPs, the colloid solution was periodically monitored by UV-
Vis spectroscopy measurements for surface plasmon resonance (SPR) of AgNPs. Samples
were scanned between 300-800 nm (Shimadzu, Japan) for determination of characteristic
plasmon resonance peak at around 440-458 nm [18]. Particle size distribution is related to
the intensity and width of this peak. The blue shift is an indication of a reduction in the
mean diameter of the AgNPs. The blue shifts and the sharp narrow shaped band are both
the evidence of spherical and homogeneous distribution of silver nanoparticles.
MA
NU
SC
RIP
T
AC
CE
PTE
D
ACCEPTED MANUSCRIPT
7
Apart from UV-vis measurement, sophisticated microscopic techniques were also
introduced to characterize the AgNPs. Atomic force microscopic (AFM) analysis was
carried out with ezAFM instrument, working at dynamic mode (512x512 pixel, 0.9 VRMS
vibration period and 1.8 VRMS free vibration period) equipped with a ezAFM 3.29
software. 3D topography and size histogram were both determined. Additionally,
transmission electron microscop (TEM) images were obtained (JEOL TEM-2010). XRD
analysis was carried out after centrifuging. The crystallinity and phases of the Ag
nanoparticles were characterized by X-ray diffractometer (XRD-6000, Shimadzu, Japan)
with Cukα radiation (λ = 1.5412 Å) in the range of 10°–80° with 2°/min scanning rate.
Finally, Fourier-Transform Infrared (FTIR, Perkin Elmer, Spectrum BX) spectroscopy was
used for characterization of AgNPs in the range 4000–280 cm-1.�
3. Results and discussion
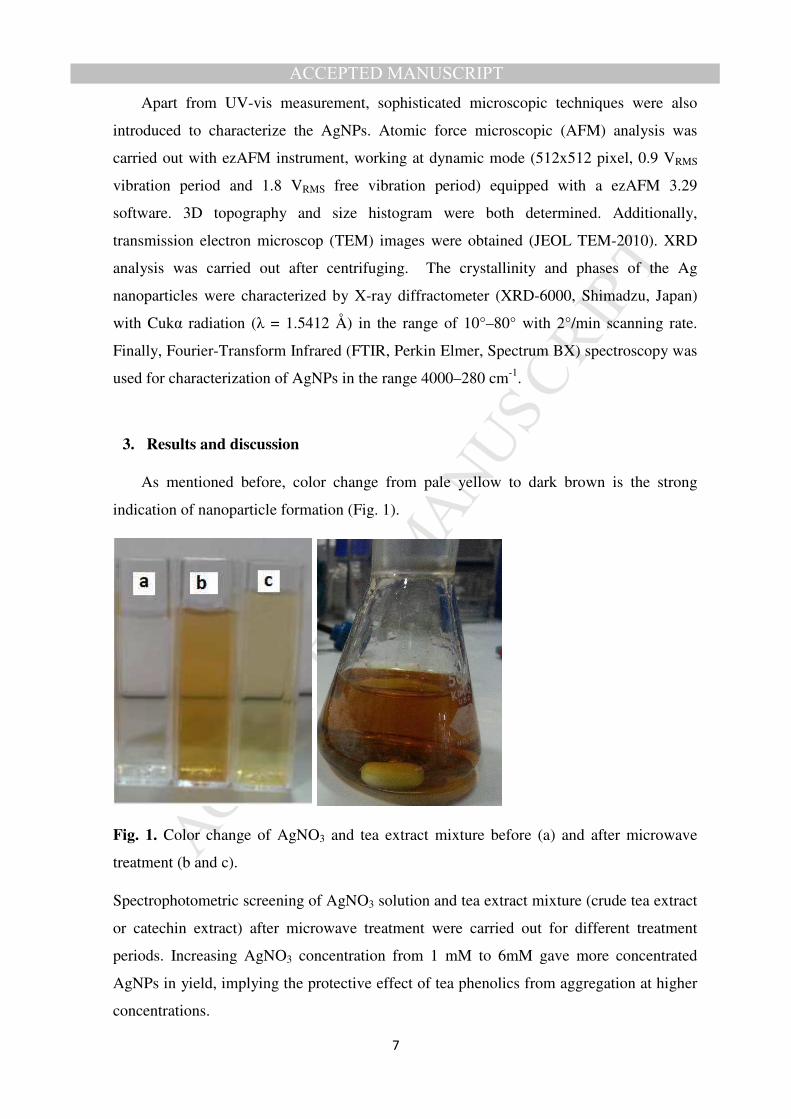
As mentioned before, color change from pale yellow to dark brown is the strong
indication of nanoparticle formation (Fig. 1).
Fig. 1. Color change of AgNO3 and tea extract mixture before (a) and after microwave
treatment (b and c).
Spectrophotometric screening of AgNO3 solution and tea extract mixture (crude tea extract
or catechin extract) after microwave treatment were carried out for different treatment
periods. Increasing AgNO3 concentration from 1 mM to 6mM gave more concentrated
AgNPs in yield, implying the protective effect of tea phenolics from aggregation at higher
concentrations.
MA
NU
SC
RIP
T
AC
CE
PTE
D
ACCEPTED MANUSCRIPT
8
3.1. AgNP production using crude tea extract
Crude tea extract contains water-soluble phenolics present in green tea leaves.
Especially catechins are the main phenolics, enabling silver ions to reduce and thereby
produce silver nanoparticles. Phenolic profiles and catechin contents of studied samples
were already reported previously [17]. Obtaining crude extract is simple and other
compounds present in the extract may provide extra protection of nanoparticles from
aggregation. Crude tea extracts successfully produced AgNPs in the presence and absence
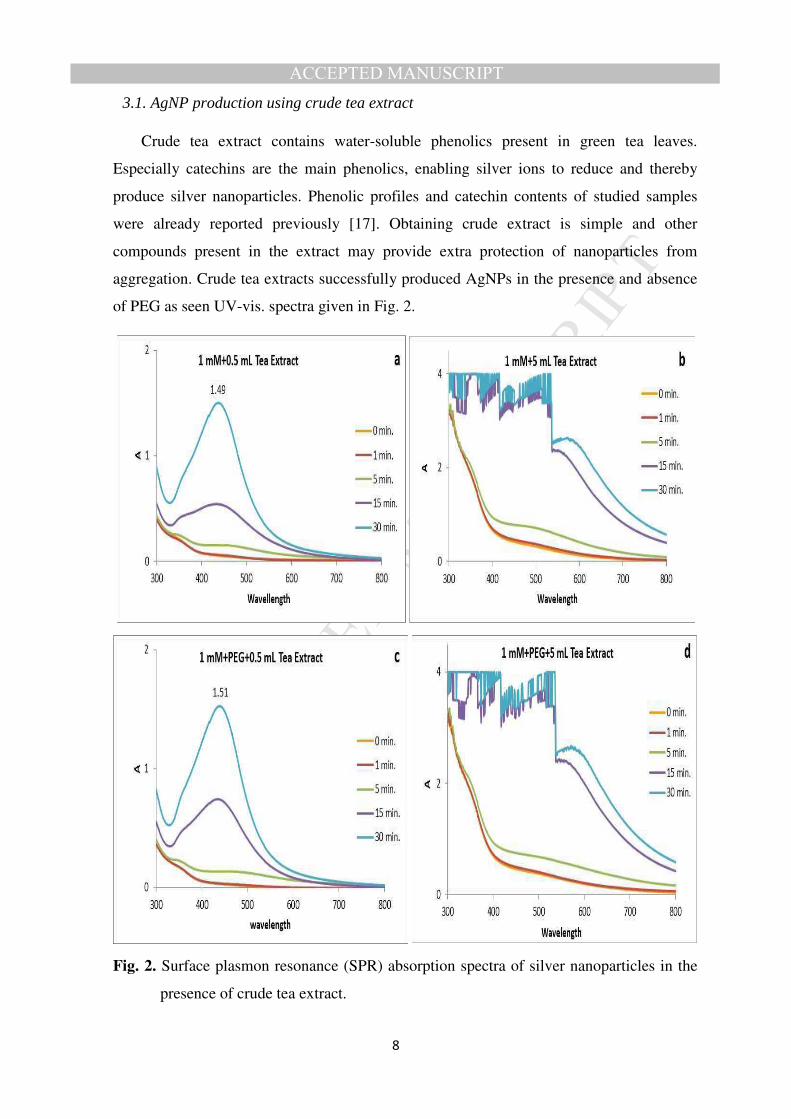
of PEG as seen UV-vis. spectra given in Fig. 2.
Fig. 2. Surface plasmon resonance (SPR) absorption spectra of silver nanoparticles in the
presence of crude tea extract.
MA
NU
SC
RIP
T
AC
CE
PTE
D
ACCEPTED MANUSCRIPT
9
The colors of the solutions changed from pale yellow to yellowish brown or to deep
brown depend on the volume of tea extract and duration (exposure period). Silver
nanoparticle formation (as the color change) is due to excitation of surface plasmon
vibration of silver nanoparticles. Apparently, AgNPs were succesfully produced with 0.5
mL crude tea extract (Fig. 2a and 2c) as specific resonance band observed around 400-480
nm after 15 minutes exposure. The band reached to maximum height after 30 minutes
microwave treatment at 90 W power. Adding the stabilizing agent PEG during production
promoted the AgNP production for shorter exposure period (15 minutes). Possibly PEG
stabilized nanoparticles and prevented the aglomeration since a narrow and stronger peak
was observed after 15 and 30 minutes microwave exposure (Fig. 2c). Higher extract
volume (5 mL) certainly increased the number of nanoparticles. Surface plasmon
resonance (SPR) absorption band was extremely strong and wide for 15 and 30 minutes.
However, the particle size was large as a result of strong agglomeration. It could be seen
from the color of the reaction mixture. The colloidal solution was brownish and cloudy
after exposure period. Spectra given in Fig. 2b and 2d show large resonans band rather
than a peak.
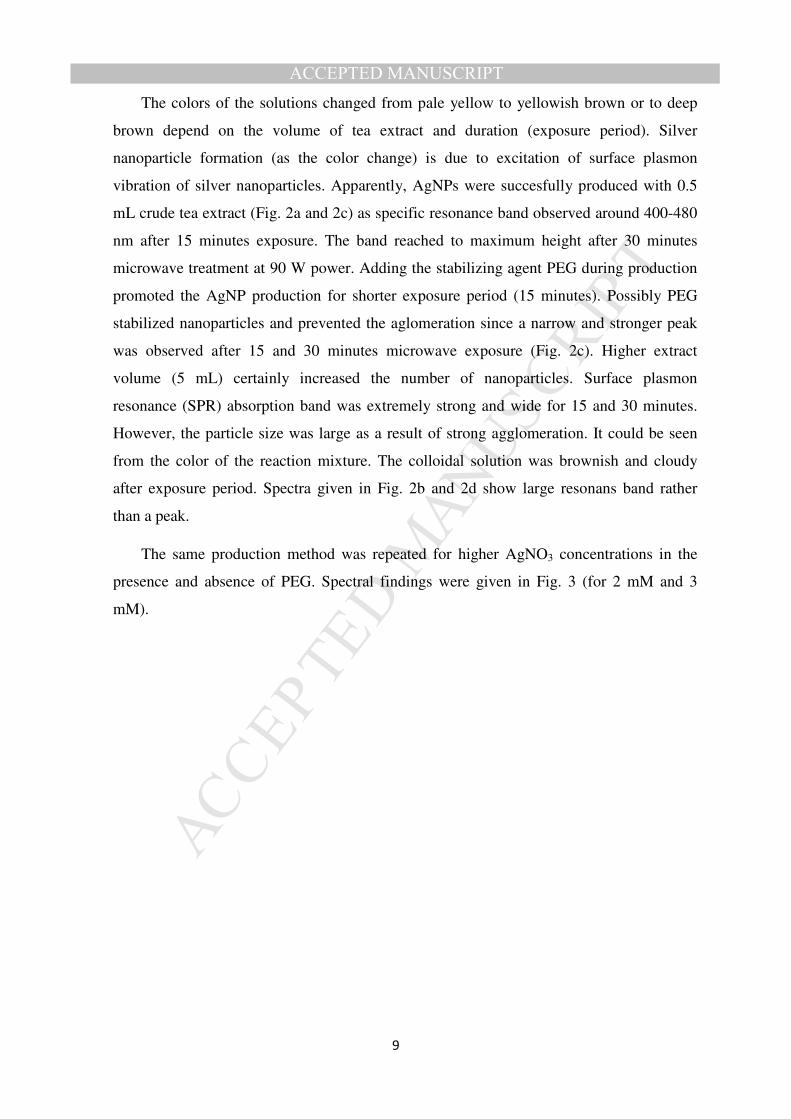
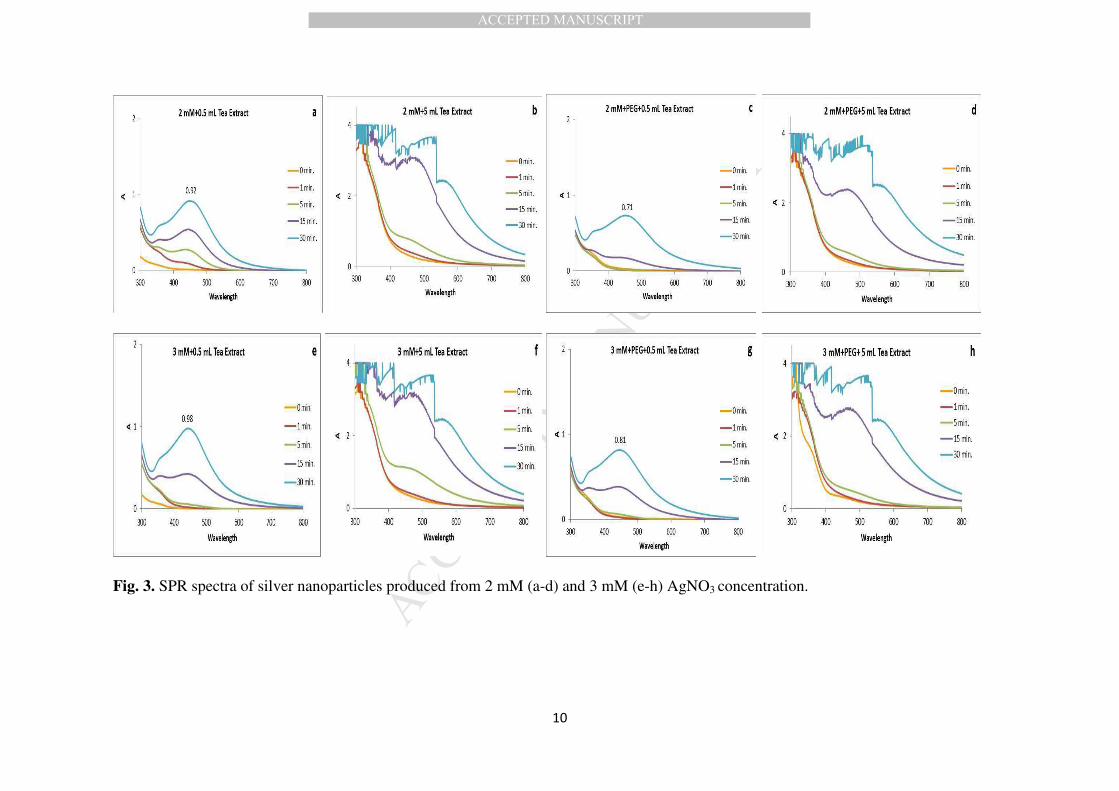
The same production method was repeated for higher AgNO3 concentrations in the
presence and absence of PEG. Spectral findings were given in Fig. 3 (for 2 mM and 3
mM).
MA
NU
SC
RIP
T
AC
CE
PTE
D
ACCEPTED MANUSCRIPT
10
Fig. 3. SPR spectra of silver nanoparticles produced from 2 mM (a-d) and 3 mM (e-h) AgNO3 concentration.
MA
NU
SC
RIP
T
AC
CE
PTE
D
ACCEPTED MANUSCRIPT
11
As seen from Fig. 3a, 0.5 mL extract produced AgNPs in the presence or absence of
PEG. Though the signal was lower than that of 1 mM, AgNPs were obtained even after 5
minutes treatment without capping agent. The wider resonance band indicated the
formation of larger nanoparticles. Presence of PEG (Fig. 3c) partly inhibited nanoparticle
formation. The same tendency was observed for 3 mM initial AgNO3 concentration (Fig.
3e-h). However, 5 mL extract volume seemed to be more promising due to a significant
blue shift. Therefore, it was considered a sign that we could go for higher AgNO3
concentrations. Initial AgNO3 concentration was dubled and other parameters were kept
same. Spectral findings are given in Fig. 4.
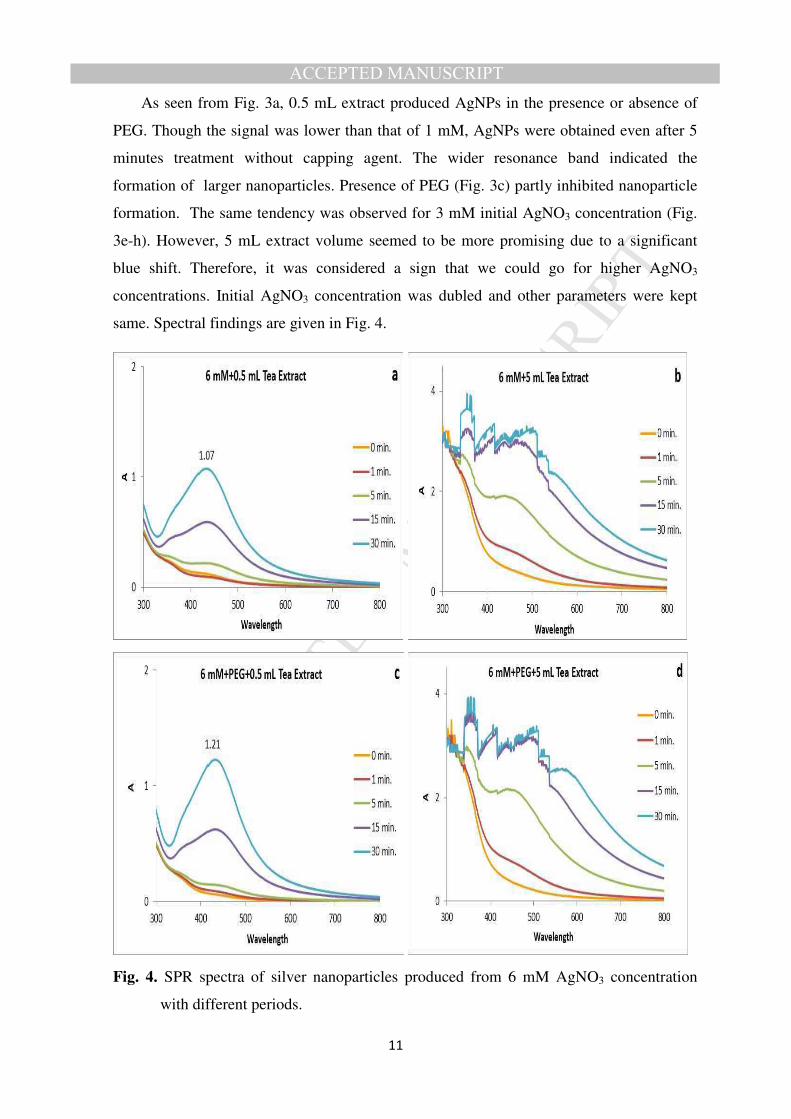
Fig. 4. SPR spectra of silver nanoparticles produced from 6 mM AgNO3 concentration
with different periods.
MA
NU
SC
RIP
T
AC
CE
PTE
D
ACCEPTED MANUSCRIPT
12
Higher AgNO3 concentration increased AgNP production in the presence and absence of
PEG (Fig. 4a and 4c). SPR signal increased in both case and AgNP production remained
constant over this concentration for 0.5 mL extract volume. The reductive power of the
bioactive components must have limitations. On the other hand, 5 mL tea extract appear to
produce AgNPs even after 5 minute microwave treatment (Fig. 4b and 4d). Additionally, a
significant band peak shif to 500 nm region was observed.
3.2. AgNP production using catechin extract
Catechin extract contains only a group of tea phenolics such as catechin (C),
(−)epicatechin (EC), (−)epigallocatechin (EGC), (−)epigallocatechin gallate (EGCG) and
tannens. Quantitative analysis of this extract was determined by HPLC analyses and were
reported elsevere [17]. Hussain and Khan [16] reported earlier that polyhydroxy groups of
catechins eased the reduction of silver ions to metalic silver nanoparticles. Therefore, we
employed purified catechin extract as an extension of our study, following the same
production system. An aqueous catechin extract (2% w/v) was employed and this
concentration was specifically chosen since tea extracts usually contained the same level
catechines. AgNP production was carried out for 1 mM and 6 mM AgNO3 concentrations.
Spectral data are given in Fig. 5 and 6, respectively.
MA
NU
SC
RIP
T
AC
CE
PTE
D
ACCEPTED MANUSCRIPT
13
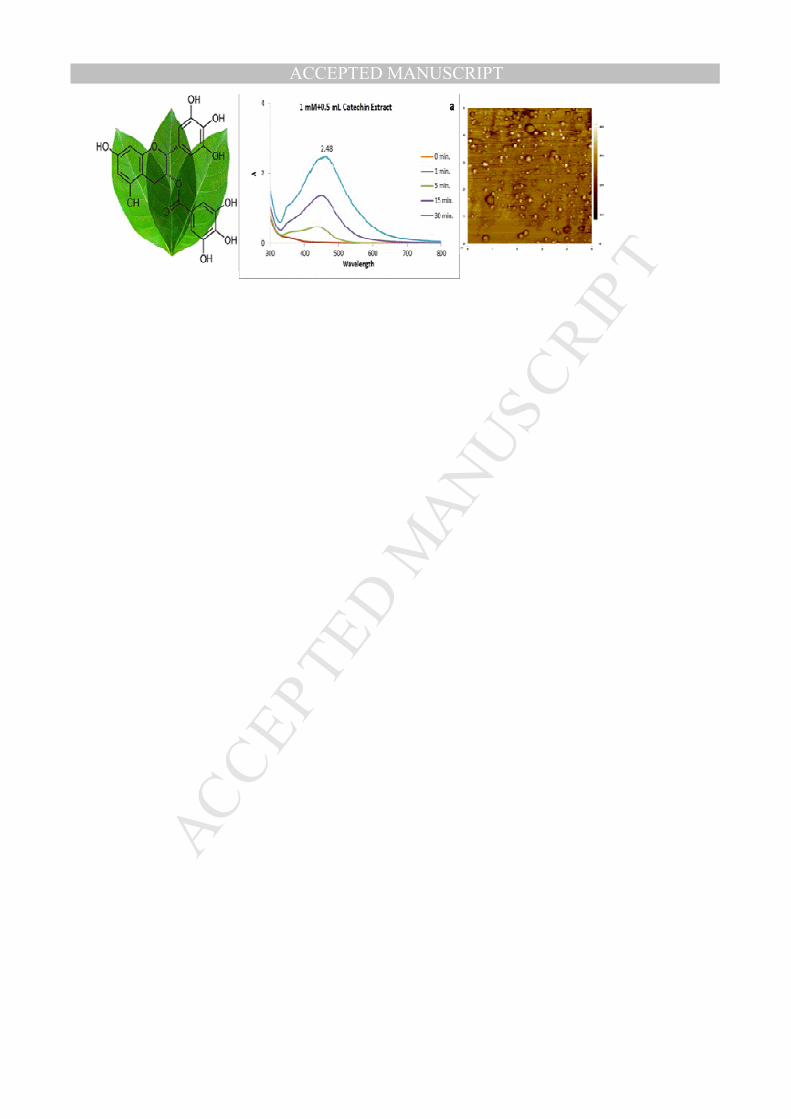
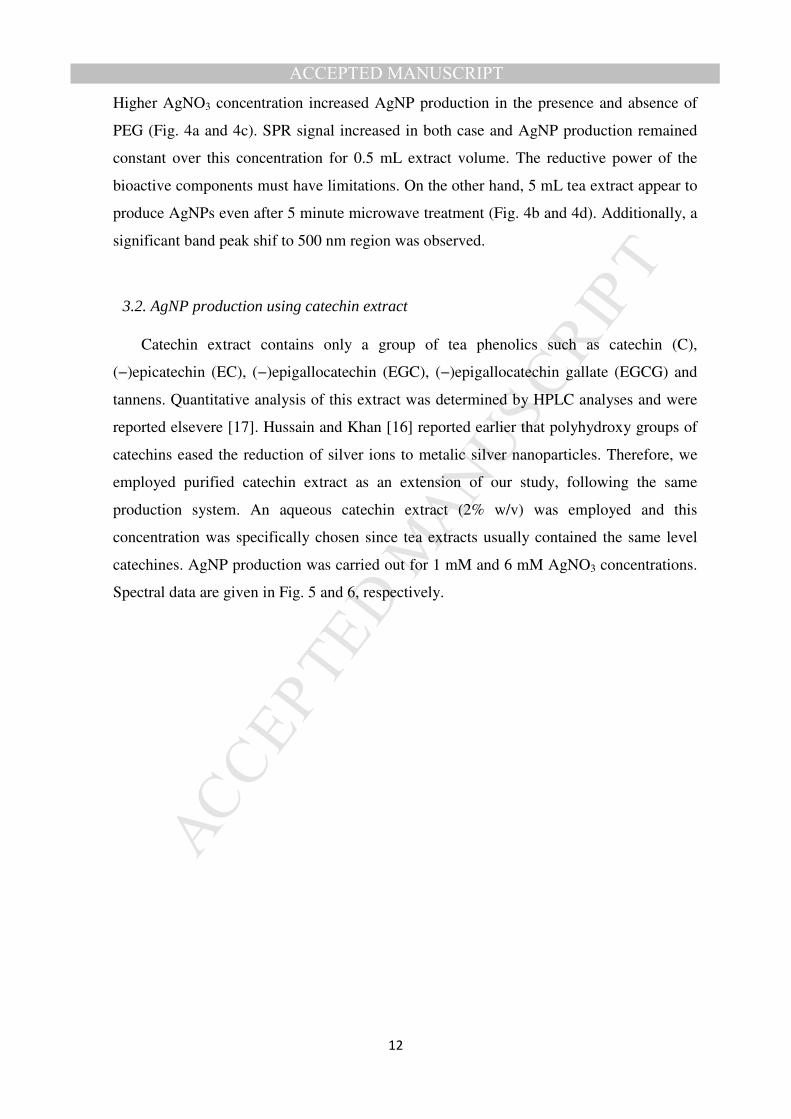
Fig. 5. SPR spectra of silver nanoparticles obtained from 1 mM AgNO3 and catechin
extract.
MA
NU
SC
RIP
T
AC
CE
PTE
D
ACCEPTED MANUSCRIPT
14
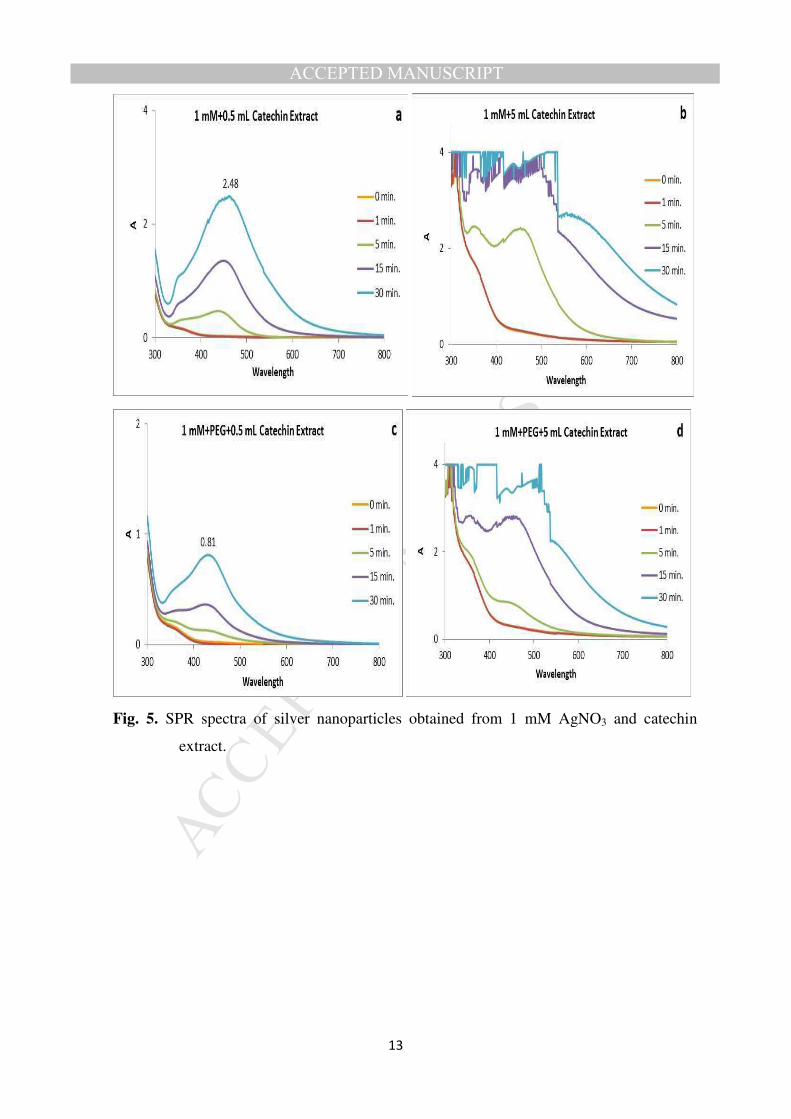
Fig. 6. SPR spectra of silver nanoparticles obtained from 6 mM AgNO3 and catechin
extract.
AgNP production was greatly increased upon the use of aqueous catechin extract,
enabling to reduce silver ions to silver nanoparticles at the highest yield with short
microwave exposure (Fig. 5a). Most of the nanoparticle resonance absorbance were
between 400-500 nm range. The same procedure gave lesser AgNPs yield in the presence
of PEG (Fig. 5c). Catechin extract (5 mL) produced more uniform AgNPs for 5 minutes
exposure without PEG and for 15 minutes with PEG (Fig. 5b and 5d). Two clear shoulders
MA
NU
SC
RIP
T
AC
CE
PTE
D
ACCEPTED MANUSCRIPT
15
were visible around 350-400 nm and 420-500 nm range. Moreover, size distrubition must
be narrow since no resonance band was observed over 600 nm. This finding is quite
promising for the involment of catechin extract rather than crude green tea extract to obtain
small size AgNPs at high concentration.
Finally, we tested the possibile promoting effects of catechin extract for higher AgNO3
concentration (6 mM). Nanoparticle production was slightly higher in 0.5 ml extract
volume (Fig. 6a and 6c). Spectra given in Fig. 6b and 6d were both good evidences that 2%
aqueous catechin solution was capable of producing high amount of AgNPs in a certain
size distrubition and lower agregation. However, high volume catechin extract still
produced the same amount of AgNPs. This is probably due to reductive ability of 2%
catechin solution is not strong enough for higher reduction of silver ions to silver
nanoparticles.This approach needs further investigation. Produced colloidal solutions were
kept in fridge and monitored for a couple of months. They were completely stable and all
solutions gave the same spectra.
3.3. Structural analysis
AFM analysis of AgNPs produced with crude tea extract (0.5 mL, no PEG, 30 minutes
microwave exposure) was obtained. Topographical image and histogram of the same
sample was shown in Fig. 7.
MA
NU
SC
RIP
T
AC
CE
PTE
D
ACCEPTED MANUSCRIPT
16
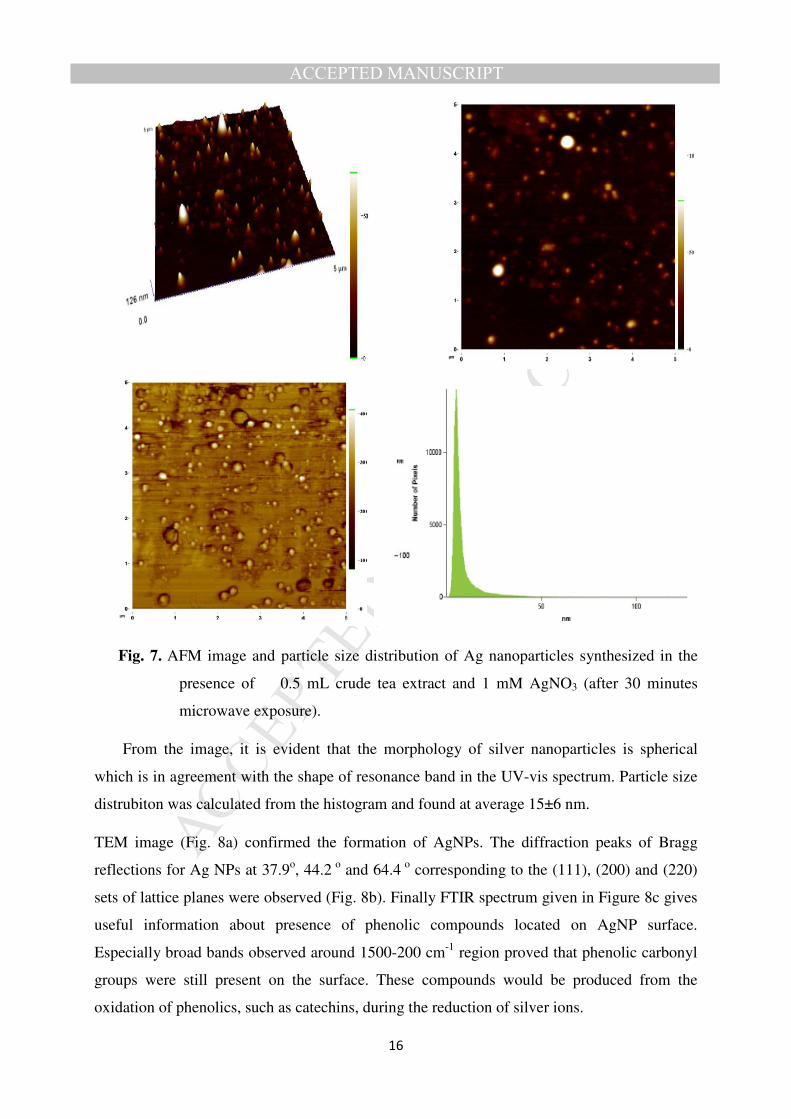
Fig. 7. AFM image and particle size distribution of Ag nanoparticles synthesized in the
presence of 0.5 mL crude tea extract and 1 mM AgNO3 (after 30 minutes
microwave exposure).
From the image, it is evident that the morphology of silver nanoparticles is spherical
which is in agreement with the shape of resonance band in the UV-vis spectrum. Particle size
distrubiton was calculated from the histogram and found at average 15±6 nm.
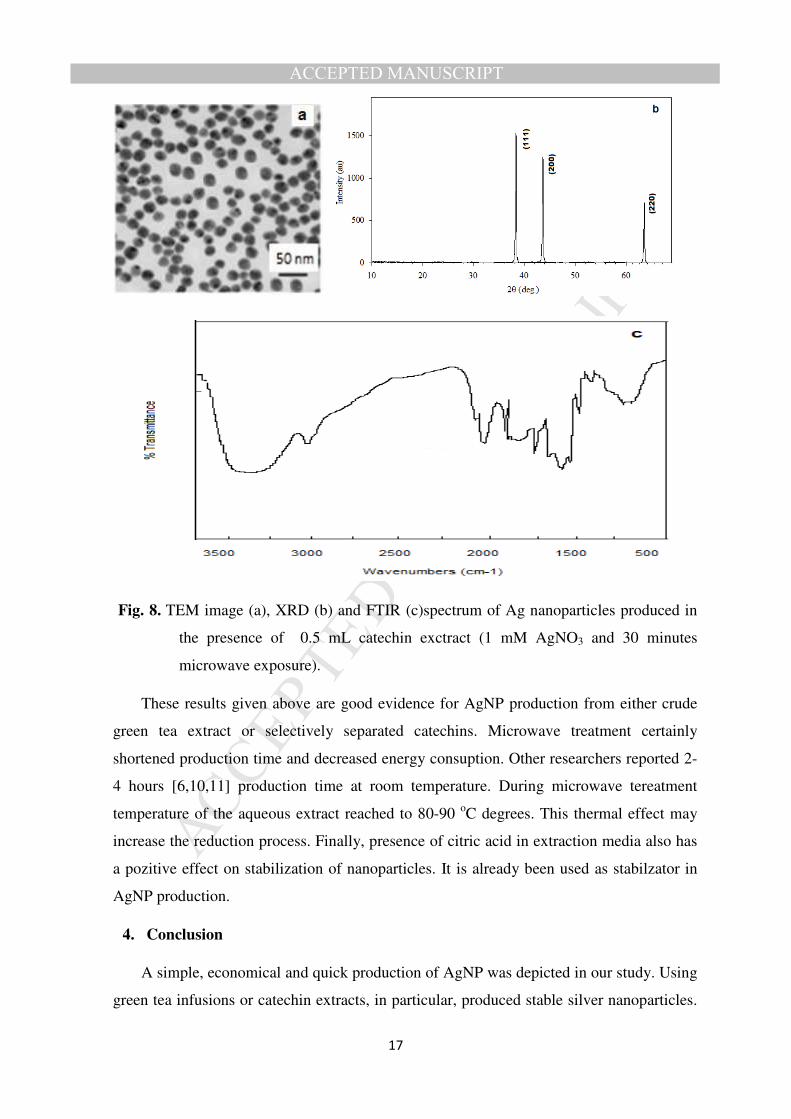
TEM image (Fig. 8a) confirmed the formation of AgNPs. The diffraction peaks of Bragg
reflections for Ag NPs at 37.9o, 44.2 o and 64.4 o corresponding to the (111), (200) and (220)
sets of lattice planes were observed (Fig. 8b). Finally FTIR spectrum given in Figure 8c gives
useful information about presence of phenolic compounds located on AgNP surface.
Especially broad bands observed around 1500-200 cm-1 region proved that phenolic carbonyl
groups were still present on the surface. These compounds would be produced from the
oxidation of phenolics, such as catechins, during the reduction of silver ions.
MA
NU
SC
RIP
T
AC
CE
PTE
D
ACCEPTED MANUSCRIPT
17
Fig. 8. TEM image (a), XRD (b) and FTIR (c)spectrum of Ag nanoparticles produced in
the presence of 0.5 mL catechin exctract (1 mM AgNO3 and 30 minutes
microwave exposure).
These results given above are good evidence for AgNP production from either crude
green tea extract or selectively separated catechins. Microwave treatment certainly
shortened production time and decreased energy consuption. Other researchers reported 2-
4 hours [6,10,11] production time at room temperature. During microwave tereatment
temperature of the aqueous extract reached to 80-90 oC degrees. This thermal effect may
increase the reduction process. Finally, presence of citric acid in extraction media also has
a pozitive effect on stabilization of nanoparticles. It is already been used as stabilzator in
AgNP production.
4. Conclusion
A simple, economical and quick production of AgNP was depicted in our study. Using
green tea infusions or catechin extracts, in particular, produced stable silver nanoparticles.
MA
NU
SC
RIP
T
AC
CE
PTE
D
ACCEPTED MANUSCRIPT
18
Agregation was inhibited by the extract and therefore no capping agent is required.
Microwave treatment facilitates the nanoparticle production and biomolecules present in
tea extract are able to reduce silver ions to silver nanoparticles. Catechins are possible
reductive power of the extract and using purified mixture of catechins have great capacity.
Acknowledgments
The authors have received research grants from King Saud University Distinguest Scientist
Fellowship Program (DSFP, Riyad, Saudi Arabia). The authors declare that they have no
conflict of interest.
References
[1] P. Prema, S. Lakshmi Priya, G. Rameshkumar, Bio-based and chemical mediated
fabrication of silver nanoparticles and evaluation of their potential antimicrobial
activity-a comparative view, Int. J. Nanoparticle 5 (2012) 338-357.
[2] P. Singh, Y.J. Kim, D. Zhang, D.C. Yang, Biological synthesis of nanoparticles from
plants and microorganisms, Trends Biotechnol. 34 (2016) 588-599.
[3] A.K. Mittal, Y.C. Uttam, C. Banerjee, Synthesis of metallic nanoparticles using plant
extracts. Biotechnol. Adv. 31 (2013) 346-356.
[4] V.V. Makarov, A.J. Love, O.V. Sinitsyna, S.S. Makarova, I.V. Yaminsky, M.E.
Taliansky, N.O. Kalinina, Green nanotechnologies: Synthesis of metal nanoparticles
using plants, Acta Naturae 6 (2014) 35-44.
[5] P. Rauwel, S. Küünal, S. Ferdov, E. Rauwel, A Review on the green synthesis of silver
nanoparticles and their morphologies studied via TEM, Adv. Mater. Sci. Eng. (2015)
doi:10.1155/2015/682749
[6] Q. Sun, X. Caia, J. Li, M. Zheng, Z. Chen, C-P. Yu, Green synthesis of silver
nanoparticles using tea leaf extract and evaluation of their stability and antibacterial
activity, Colloids Surfaces A: Physicochem. Eng. Aspects 444 (2014) 226-231.
[7] S. Prabhu, E.K. Poulose, Silver nanoparticles: Synthesis, mechanism of antimicrobial
action, characterization, medical applications, and toxicity effects, Inter. Nano Let. 2
(2012) 32.
MA
NU
SC
RIP
T
AC
CE
PTE
D
ACCEPTED MANUSCRIPT
19
[8] N.A. Begum, S. Mondal, S. Basu, R.A. Laskar, D. Mandal, Biogenic synthesis of Au
and Ag nanoparticles using aqueous solutions of black tea leaf extracts, Colloids
Surfaces B: Biointerfaces 71 (2009) 113-118.
[9] Y.Y. Loo, B.W. Chieng, M. Nishibuchi, S. Radu, Synthesis of silver nanoparticles by
using tea leaf extract from Camellia Sinensis, Int. J. Nanomed. 7 (2012) 4263-4267.
[10] M.N. Nadagouda, R.S. Varma, Green synthesis of silver and palladium nanoparticles
at room temperature using coffee and tea extract, Green Chem. 10 (2008) 859-862.
[11] J-L. Jia, H-H. Xu, D-Q. Li, W-H. Ye, W-J. Liu, Biosynthesis of silver and gold
nanoparticles using Huangdan (Camellia sinensis) leaf extract. Synt. React. Inorg.
Metal-Organic Nano-Metal Chem. 45 (2015) 941-946.
[12] L. Huang, X. Weng, Z. Chen, M. Megharaj, R. Naidu, Green synthesis of iron
nanoparticles by various tea extracts: Comparative study of the reactivity,
Spectrochimica Acta Part A: Mol. Biomol. Spect. 130 (2014) 295-301.
[13] X. Weng, L. Huang, Z. Chena, M. Megharaj, R. Naidu, Synthesis of iron-based
nanoparticles by green tea extract and their degradation of malachite. Industrial Crops
and Products 51 (2013) 342-347.
[14] P. Sutradhar, M. Saha, D. Maiti, Microwave synthesis of copper oxide nanoparticles
using tea leaf and coffee powder extracts and its antibacterial activity, J. Nanostruct.
Chem. 4 (2014) 86, DOI 10.1007/s40097-014-0086-1
[15] P. Sutradhar, N. Debnath, M. Saha, Microwave-assisted rapid synthesis of alumina
nanoparticles using tea, coffee and triphala extracts, Adv. Manuf. 1 (2013) 357-361.
[16] S. Hussain, Z. Khan, Epigallocatechin-3-gallate-capped Ag nanoparticles: Preparation
and characterization, Bioprocess Biosyst. Eng. 37 (2014) 1221-1231.
[17] G. Serdar, E. Demir, S. Bayrak, M. Sökmen, New approaches for effective microwave
assisted extraction of caffeine and catechins from green tea, Inter. J. Second. Metabol.
3 (2016) 3-13.
[18] M.M.H. Khalil, E.H. Ismail, K.Z. El-Baghdady, D. Mohamed, Green synthesis of
silver nanoparticles using olive leaf extract and its antibacterial activity, Arabian J.
Chem. 7 (2014) 1131-1139.
MA
NU
SC
RIP
T
AC
CE
PTE
D
ACCEPTED MANUSCRIPT
Highlights
• Silver nanoparticles (AgNPs) were produced using green tea extracts. • Microwave power produced AgNPs after 1-30 minutes treatment. • Catechin extract was more successful for nanoparticle production. • Plasmon resonance spectrum (PRS) was used for AgNP production. • AgNPs were characterized with AFM, TEM, XRED and FTIR.