micropollutants in the aquatic environment: the swiss strategy
TRANSCRIPT
Micropollutants in the aquatic environment:The Swiss strategy
Adriano Joss, Hansruedi Siegrist (eawag),
Michael Schärer, Christian Abegglen (Bafu, VSA)
Hilversum, 21 November 2013
Overview
The Swiss strategy
The Technologies• Powdered activated carbon• Ozone
Costs and Energy
slide 2
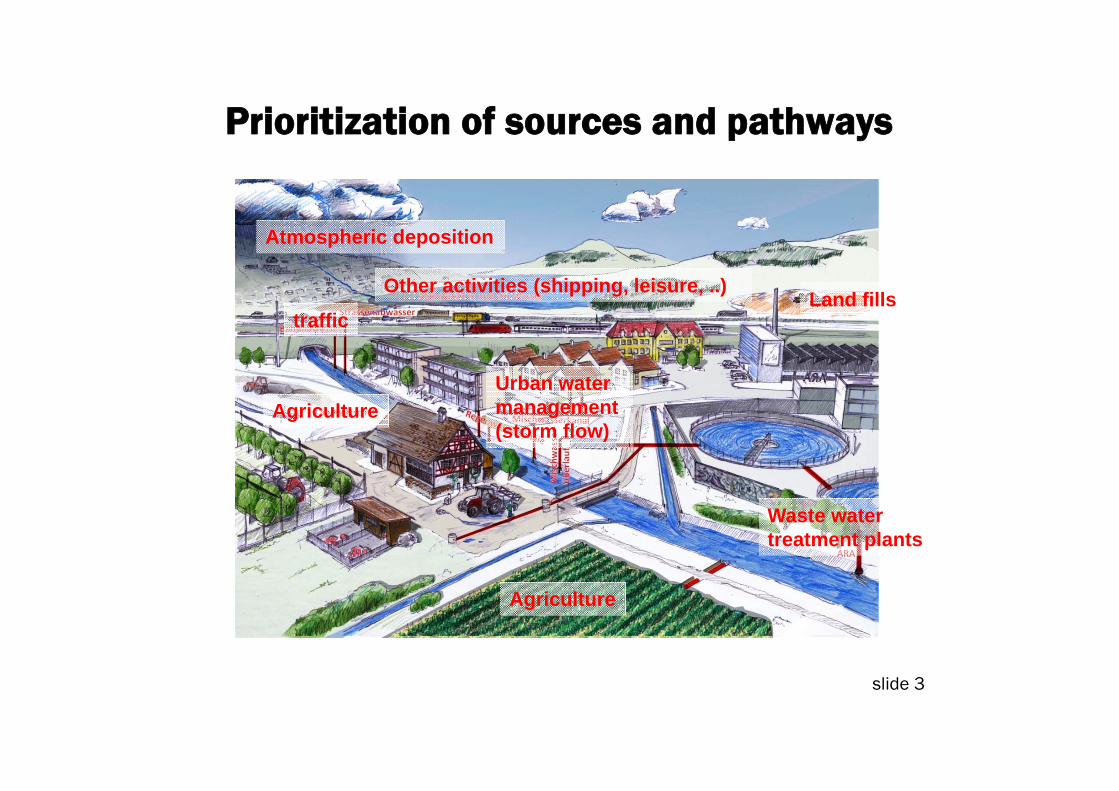
Prioritization of sources and pathways
Agriculture
traffic
Atmospheric deposition
Waste water treatment plants
Urban water management (storm flow)
Land fillsOther activities (shipping, leisure, ..)
Agriculture
slide 3
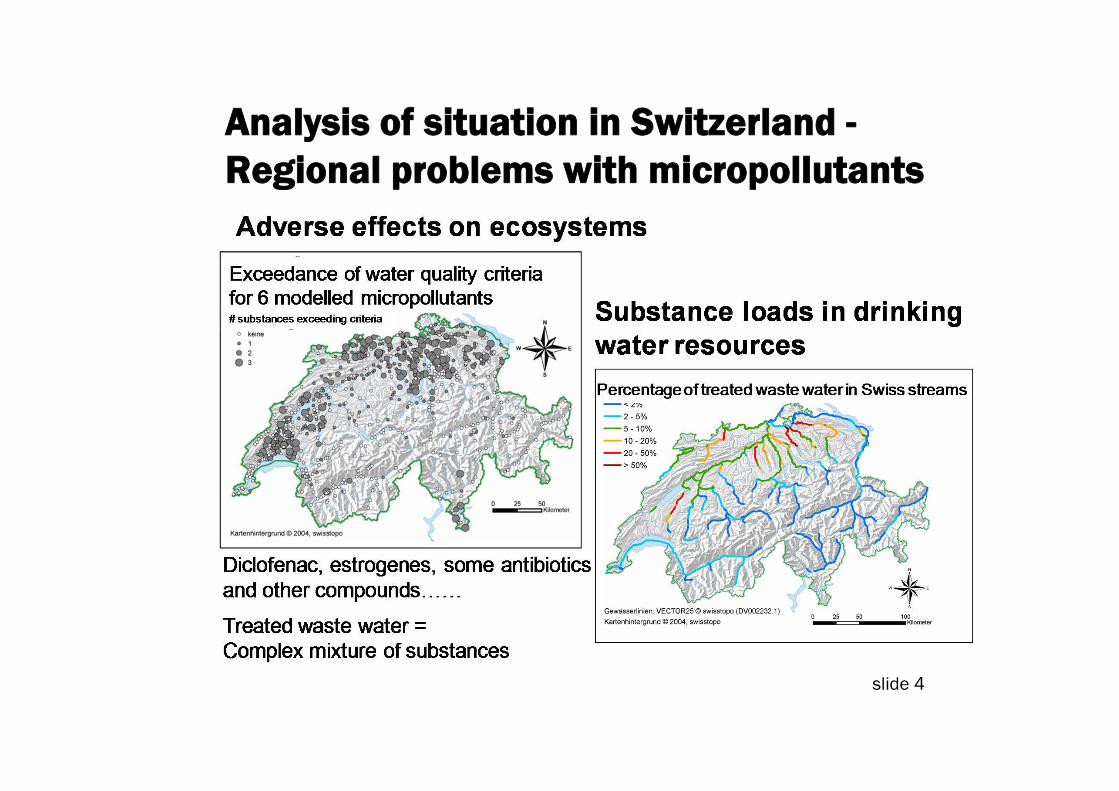
Analysis of situation in Switzerland -Regional problems with micropollutants
slide 4
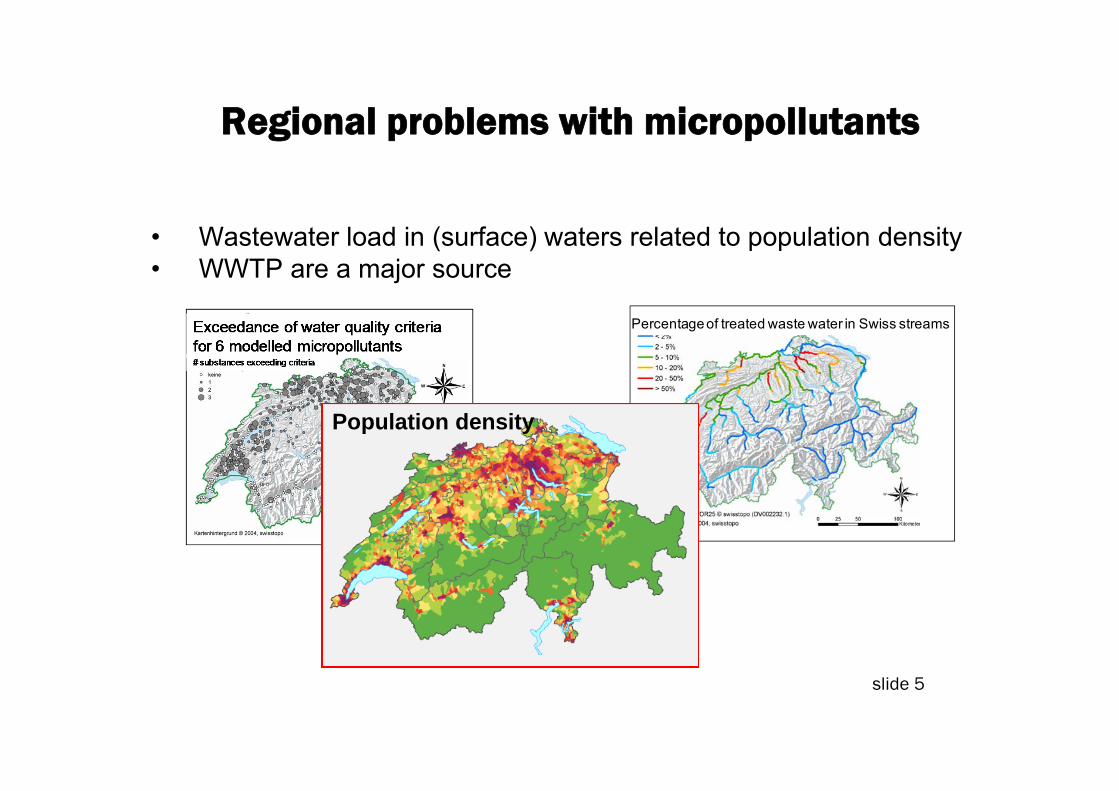
Regional problems with micropollutants
• Wastewater load in (surface) waters related to population density• WWTP are a major source
Anteil gereinigtes Abwasser in grossen und mittleren FliessgewässernPercentageof treated waste water in Swiss streams
Population density
slide 5

Development of an assessment concept
see Götz et al. 2010, Kase et al. (2011)
see http://www.bafu.admin.ch
slide 6
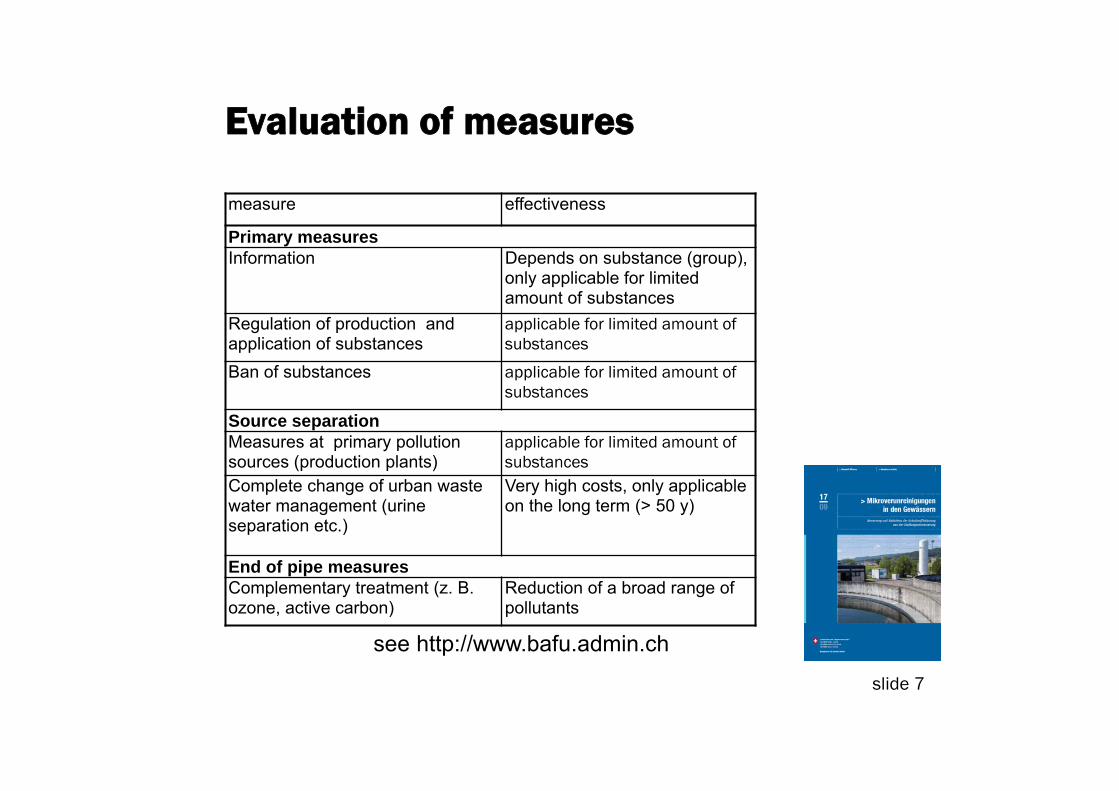
Evaluation of measures
see http://www.bafu.admin.ch
measure effectiveness
Primary measuresInformation Depends on substance (group),
only applicable for limited amount of substances
Regulation of production and application of substances
applicable for limited amount of substances
Ban of substances applicable for limited amount of substances
Source separationMeasures at primary pollution sources (production plants)
applicable for limited amount of substances
Complete change of urban waste water management (urine separation etc.)
Very high costs, only applicable on the long term (> 50 y)
End of pipe measuresComplementary treatment (z. B. ozone, active carbon)
Reduction of a broad range ofpollutants
slide 7
Source control measures have highest priority:- Registration and regulation of products- Green chemistry- Behavior of consumers – information of public- Use and disposal of substances
But:- “long-term options”- Thousands of substances can hardly be regulated- Replacement of some substances is very difficult (pharmaceuticals) or impossible (natural estrogens).
Possible measures
slide 8
Adaptation of water protection ordinanceResults of consultation 2009-2010
1. Problem and need for measures supported
Over 80 % of the statements support a goal-oriented extension of municipal WWTPs
2. Need for adaptation:
• Financing: Need for a nationwide funding based on the polluter-pays-principle
• More experience with technical processes necessary
• National coordination of planning
Several interventions in federal assemblyfor example discussion in the Committees for the Environment, Spatial Planning and Energy CESPE of the council of states
slide 9
parliamentary interventionof the Committee for the Environment, Spatial Planning and Energy (CESPE ) of the council of states
Development of financing solution in agreement with the “polluter pays principle”
Establishment of legal requirements for financing and implementation of measures
Accepted by federal council and council of states
Accepted by national council on March 15 2011
slide 10
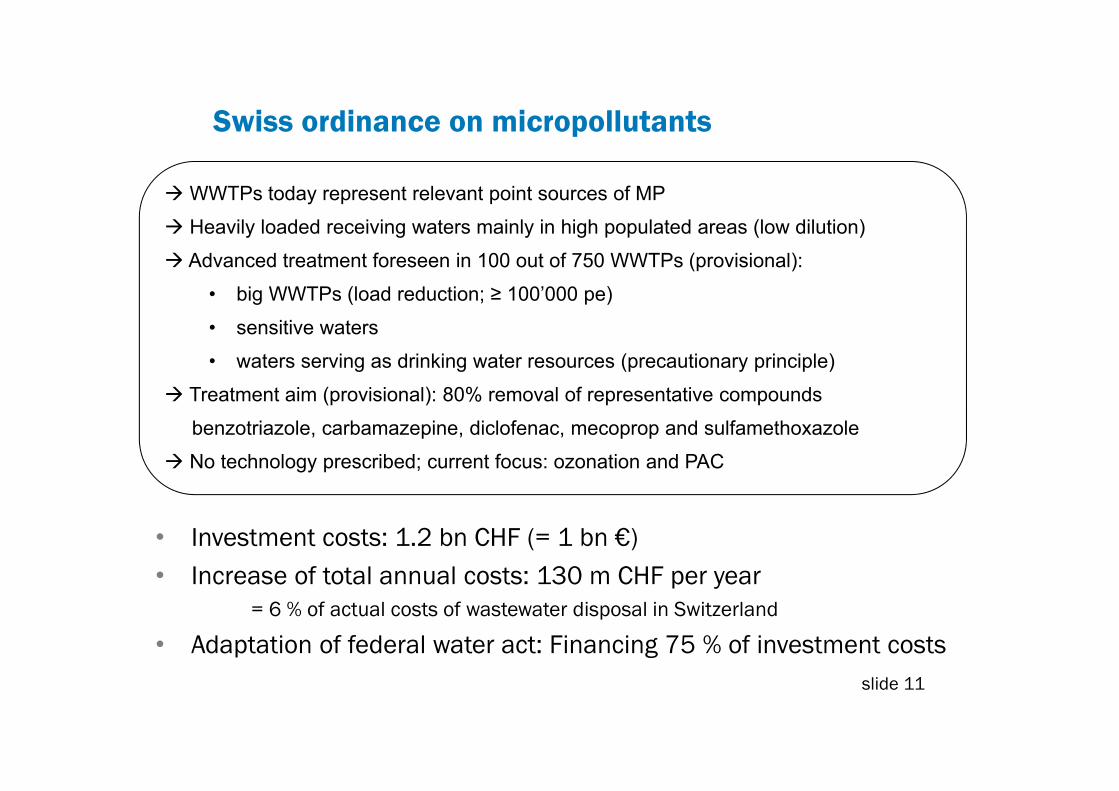
WWTPs today represent relevant point sources of MP
Heavily loaded receiving waters mainly in high populated areas (low dilution)
Advanced treatment foreseen in 100 out of 750 WWTPs (provisional):
• big WWTPs (load reduction; ≥ 100’000 pe)
• sensitive waters
• waters serving as drinking water resources (precautionary principle)
Treatment aim (provisional): 80% removal of representative compounds
benzotriazole, carbamazepine, diclofenac, mecoprop and sulfamethoxazole
No technology prescribed; current focus: ozonation and PAC
Swiss ordinance on micropollutants
• Investment costs: 1.2 bn CHF (= 1 bn €)• Increase of total annual costs: 130 m CHF per year
= 6 % of actual costs of wastewater disposal in Switzerland
• Adaptation of federal water act: Financing 75 % of investment costsslide 11
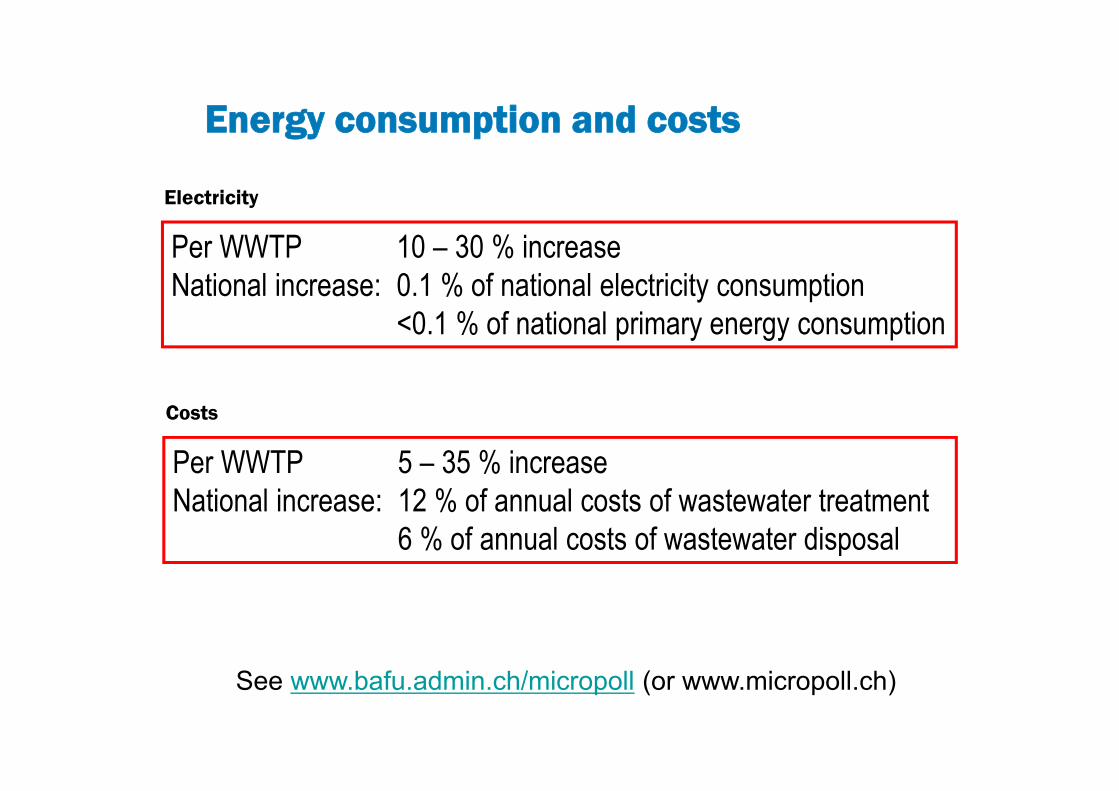
Energy consumption and costs
Electricity
Per WWTP 10 – 30 % increase National increase: 0.1 % of national electricity consumption
<0.1 % of national primary energy consumption
Costs
Per WWTP 5 – 35 % increase National increase: 12 % of annual costs of wastewater treatment
6 % of annual costs of wastewater disposal
See www.bafu.admin.ch/micropoll (or www.micropoll.ch)
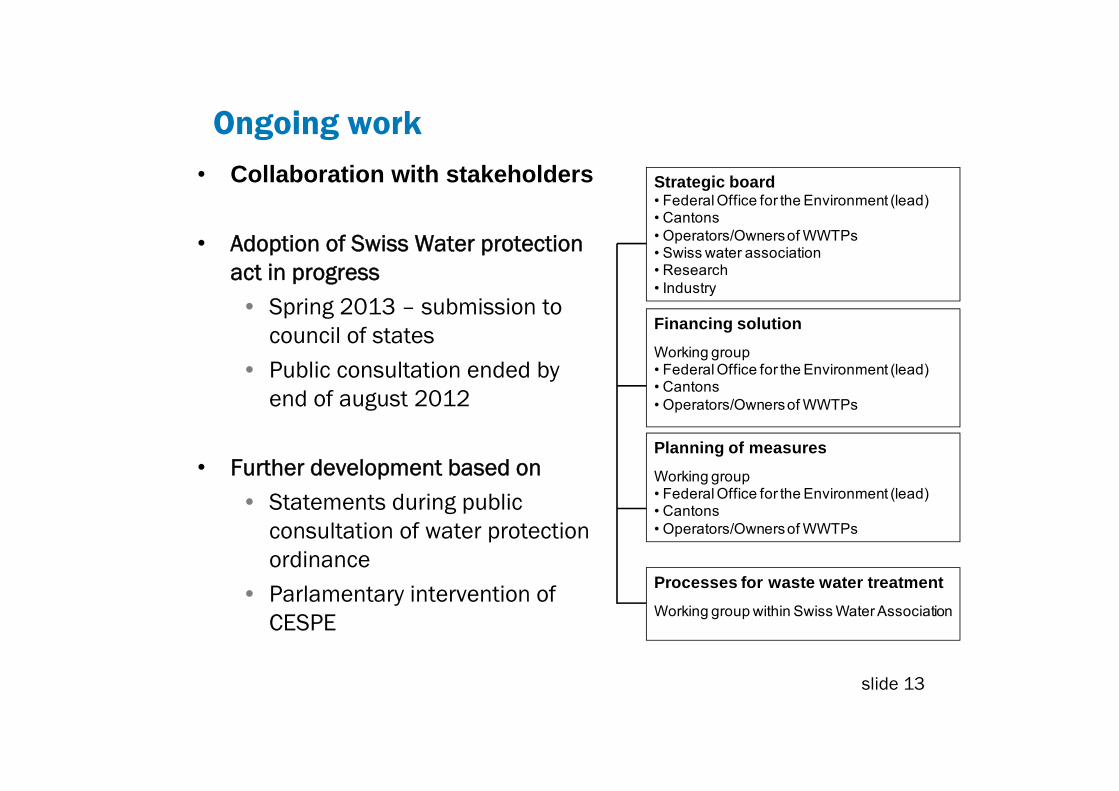
Ongoing work• Collaboration with stakeholders
• Adoption of Swiss Water protection act in progress• Spring 2013 – submission to
council of states• Public consultation ended by
end of august 2012
• Further development based on• Statements during public
consultation of water protection ordinance
• Parlamentary intervention of CESPE
Financing solutionWorking group• Federal Office for the Environment (lead)• Cantons• Operators/Owners of WWTPs
Strategic board• Federal Office for the Environment (lead)• Cantons• Operators/Owners of WWTPs• Swiss water association• Research• Industry
Planning of measuresWorking group• Federal Office for the Environment (lead)• Cantons• Operators/Owners of WWTPs
Processes for waste water treatmentWorking group within Swiss Water Association
slide 13
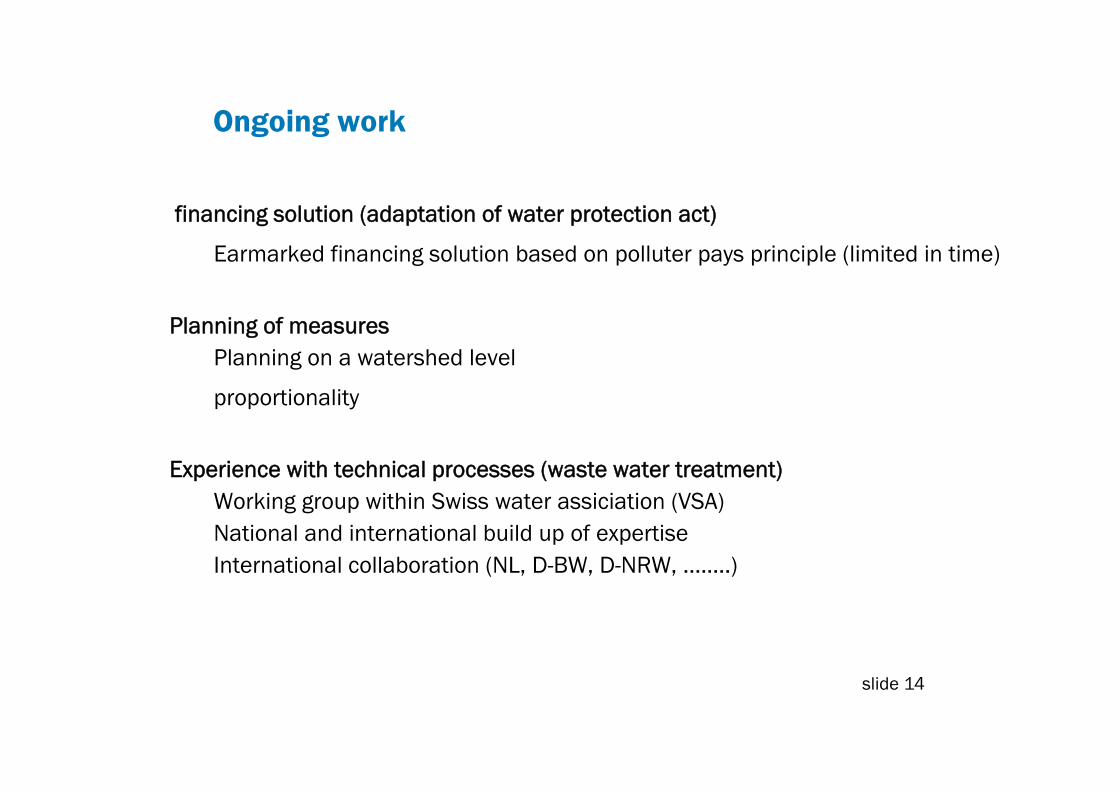
Ongoing work
financing solution (adaptation of water protection act)
Earmarked financing solution based on polluter pays principle (limited in time)
Planning of measuresPlanning on a watershed level
proportionality
Experience with technical processes (waste water treatment)Working group within Swiss water assiciation (VSA)National and international build up of expertise International collaboration (NL, D-BW, D-NRW, ……..)
slide 14
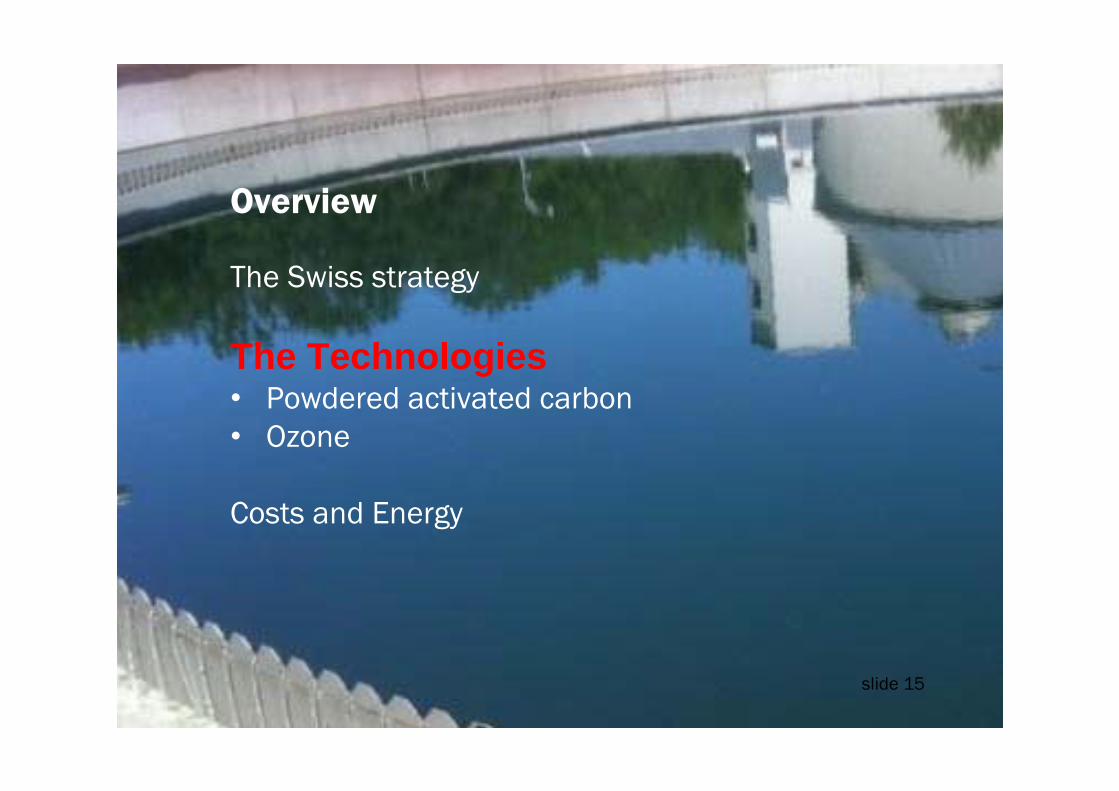
Overview
The Swiss strategy
The Technologies• Powdered activated carbon• Ozone
Costs and Energy
slide 15

Requirements for advanced treatment
Broadband removal: effective on a broad mixture of organic compounds
Transformation products: the formation of toxic or stable transformation products to be avoided
Applicability: Integration into existing infrastructure and operation by current personnel must be feasible
Cost/benefit: Material, energy, personnel, costs must be justifiable and competitive
slide 16
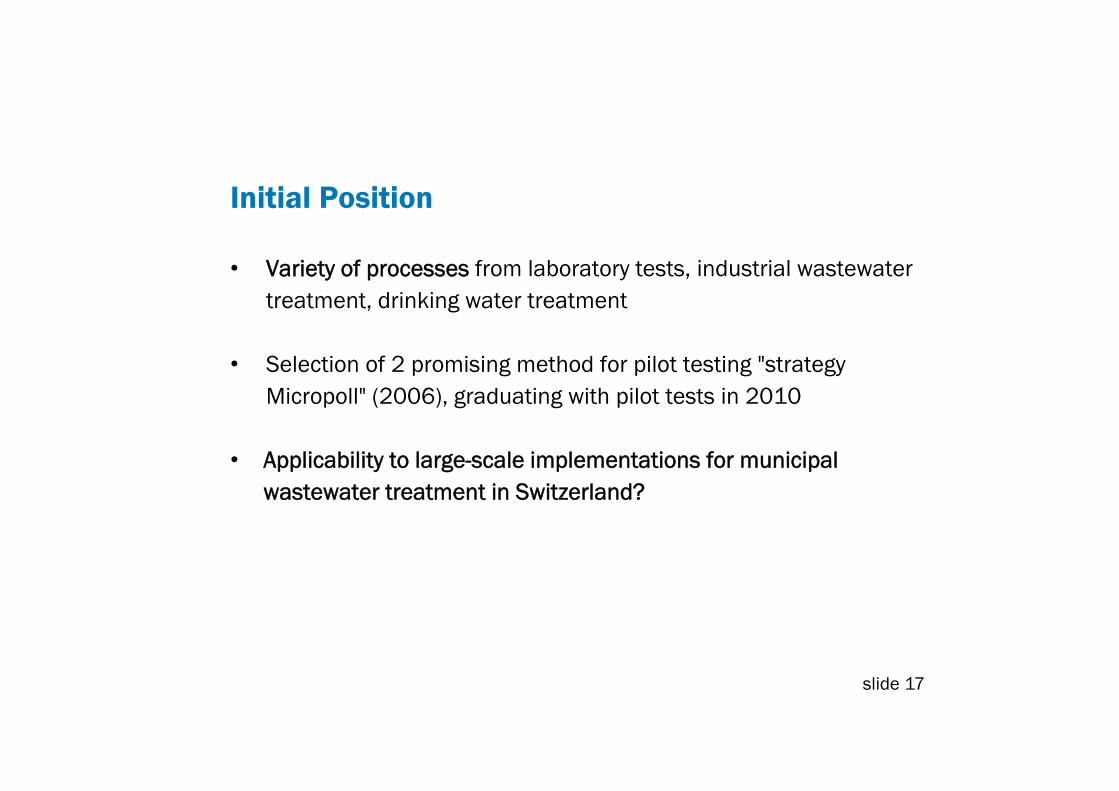
Initial Position
• Variety of processes from laboratory tests, industrial wastewater treatment, drinking water treatment
• Selection of 2 promising method for pilot testing "strategy Micropoll" (2006), graduating with pilot tests in 2010
• Applicability to large-scale implementations for municipal wastewater treatment in Switzerland?
slide 17
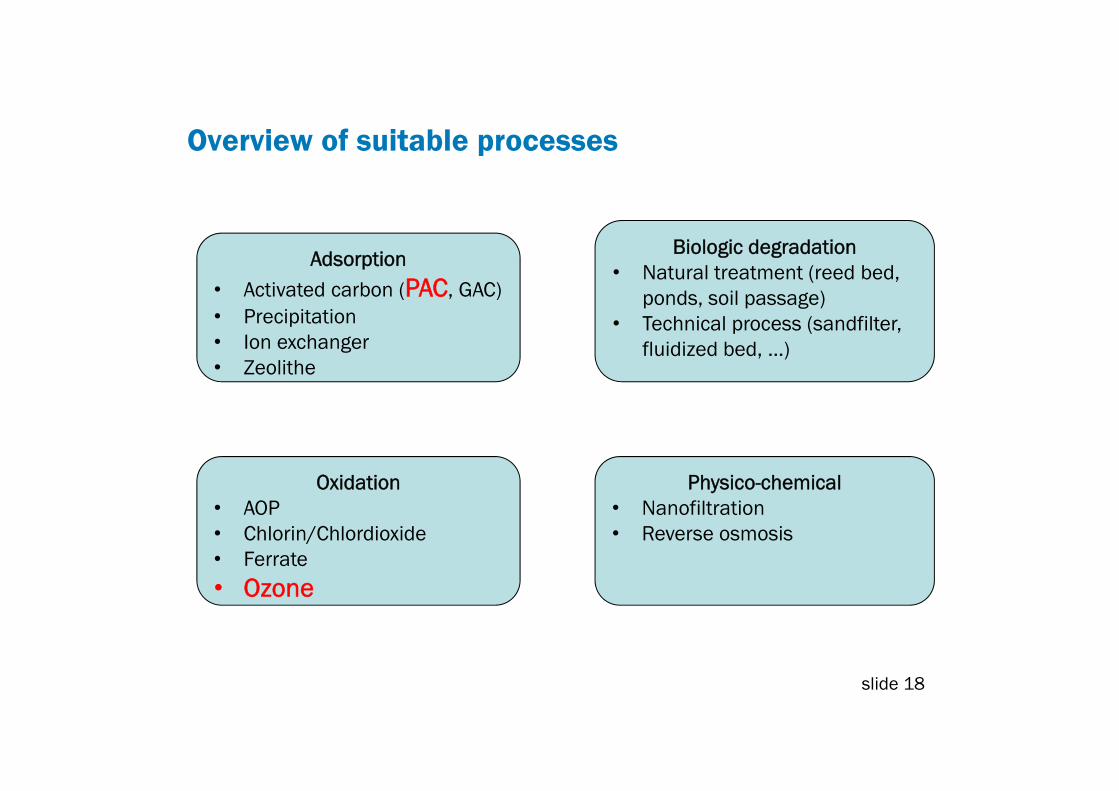
Overview of suitable processes
Adsorption• Activated carbon (PAC, GAC) • Precipitation• Ion exchanger• Zeolithe
Biologic degradation• Natural treatment (reed bed,
ponds, soil passage) • Technical process (sandfilter,
fluidized bed, …)
Oxidation• AOP • Chlorin/Chlordioxide • Ferrate • Ozone
Physico-chemical• Nanofiltration• Reverse osmosis
slide 18
Overview
The Swiss strategy
The Technologies• Powdered activated carbon• Ozone
Costs and Energy
slide 19
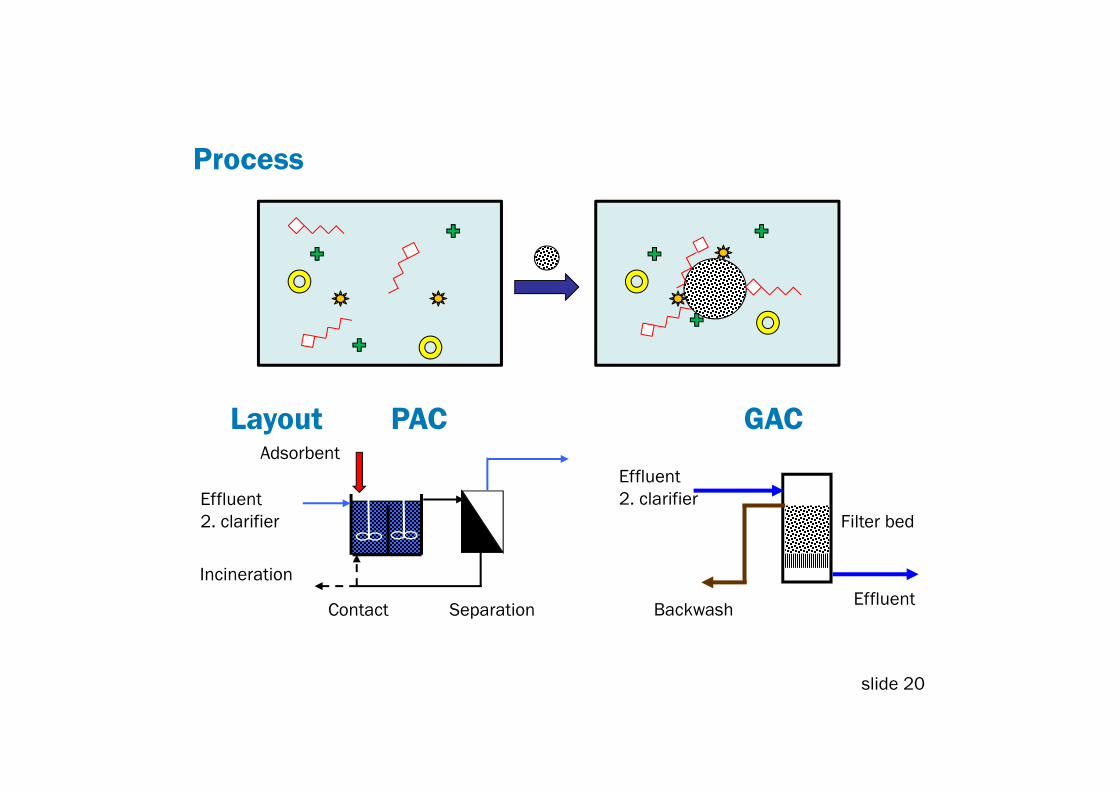
Process
Layout
Backwash Effluent
Filter bed
Contact Separation
Incineration
Adsorbent
Effluent2. clarifier
Effluent2. clarifier
PAC GAC
slide 20
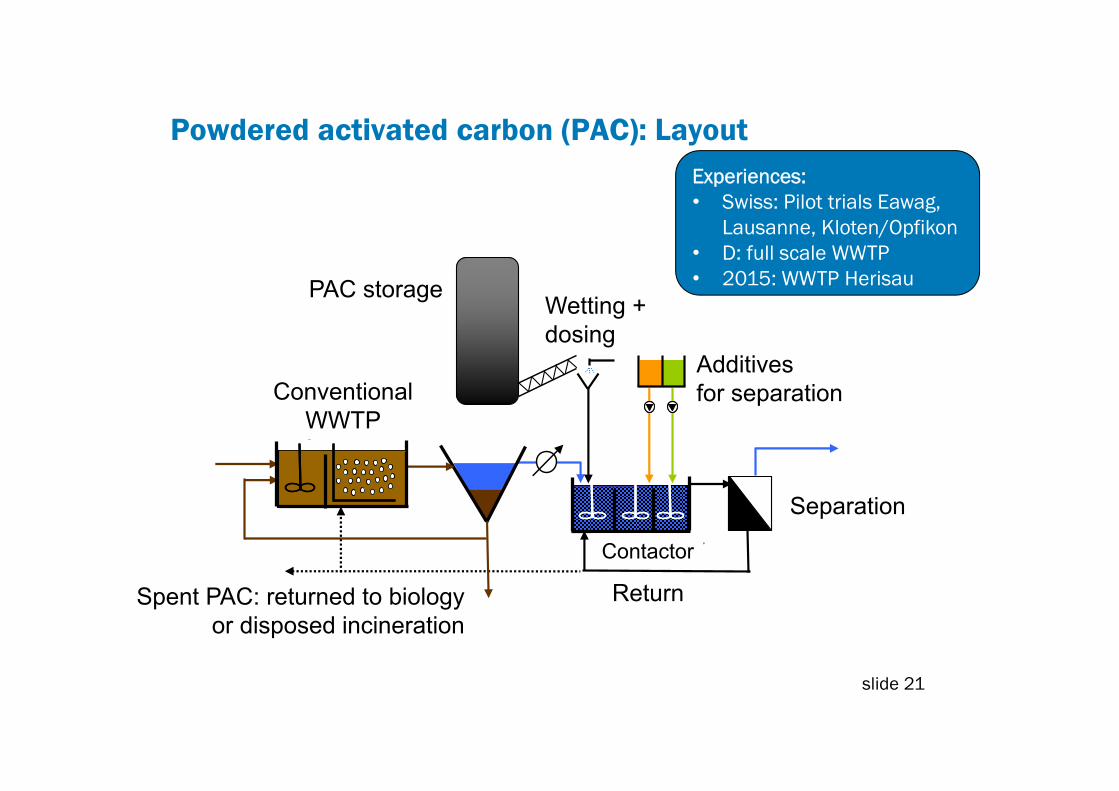
Powdered activated carbon (PAC): Layout
Biologische Stufe
PAK-Abtrennung
Kontaktreaktor
RezirkulationÜberschuss: Rezirkulationoder Entsorgung
PAK-LagerungBenetzung und Dosierung
Fäll- und Hilfs-Mittel-Dosierung
PAC storageWetting + dosing
ConventionalWWTP
Spent PAC: returned to biologyor disposed incineration
Return
Separation
Additivesfor separation
Contactor
Experiences:• Swiss: Pilot trials Eawag,
Lausanne, Kloten/Opfikon • D: full scale WWTP• 2015: WWTP Herisau
slide 21
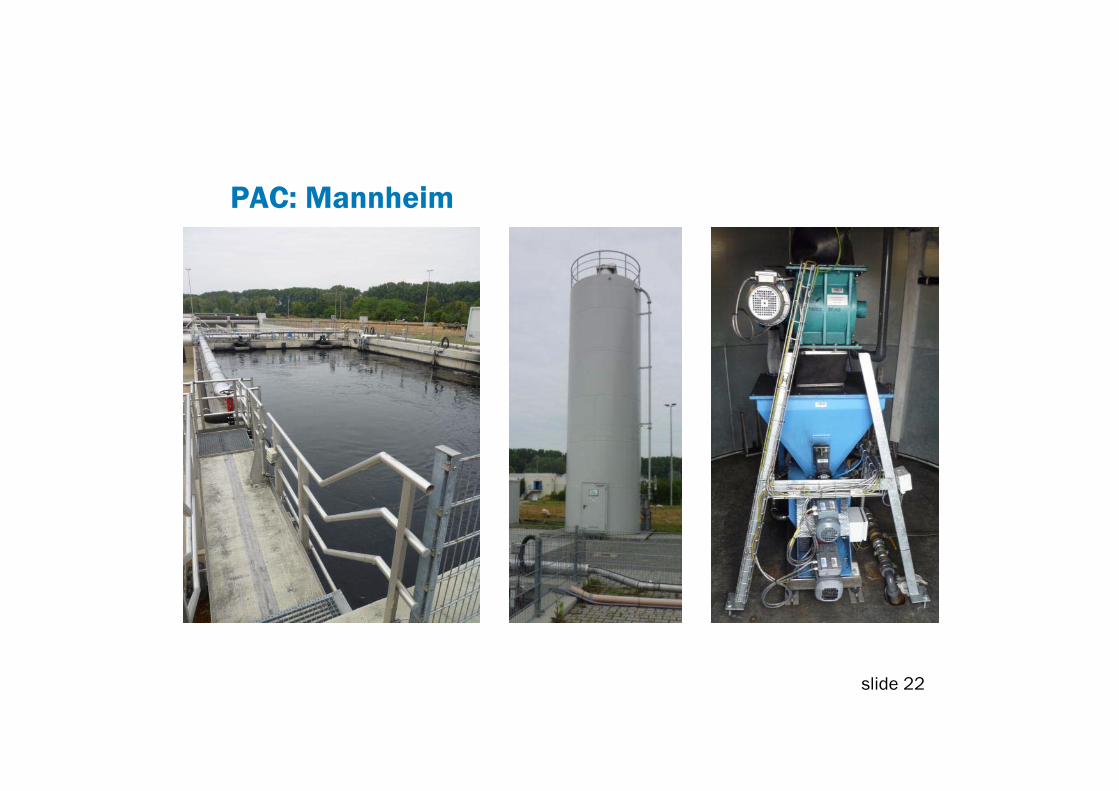
PAC: Mannheim
slide 22
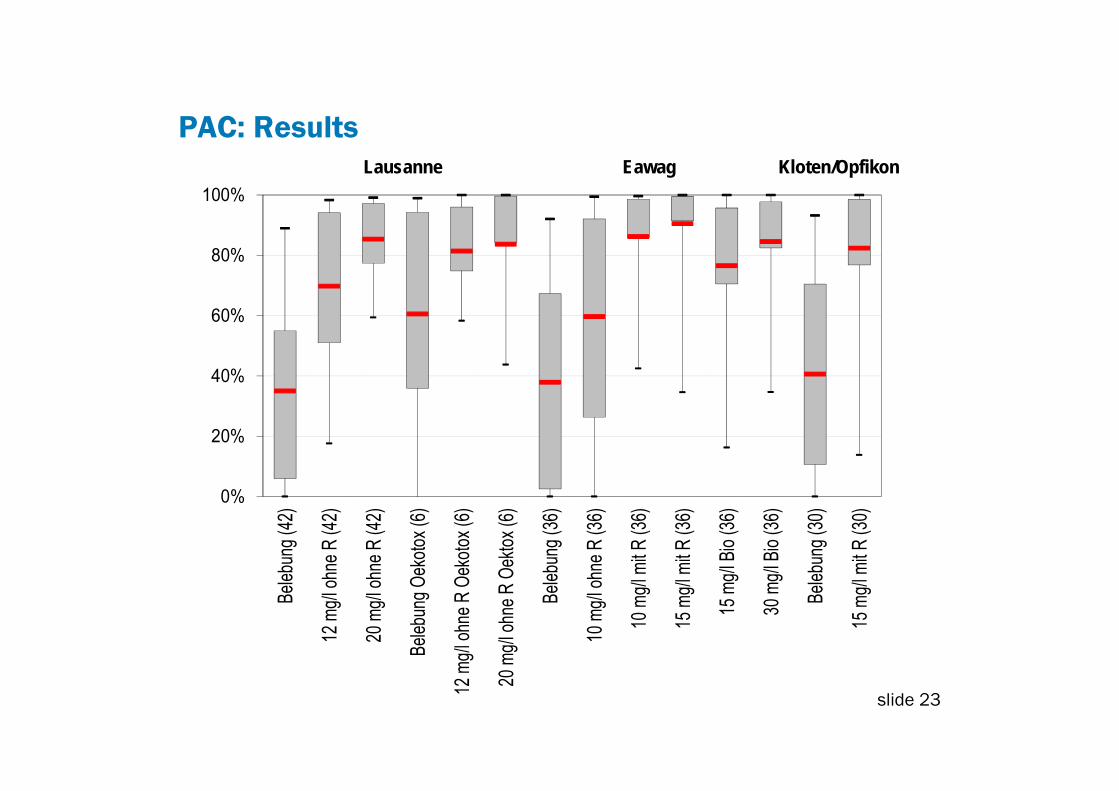
PAC: Results
ARA-Mikroverunreinigungen, 2.-4.11.2011 Seite 23
0%
20%
40%
60%
80%
100%
Beleb
ung (
42)
12 m
g/l oh
ne R
(42)
20 m
g/l oh
ne R
(42)
Beleb
ung O
ekoto
x (6)
12 m
g/l oh
ne R
Oek
otox (
6)
20 m
g/l oh
ne R
Oek
tox (6
)
Beleb
ung (
36)
10 m
g/l oh
ne R
(36)
10 m
g/l m
it R (3
6)
15 m
g/l m
it R (3
6)
15 m
g/l Bi
o (36
)
30 m
g/l Bi
o (36
)
Beleb
ung (
30)
15 m
g/l m
it R (3
0)
Lausanne Eawag Kloten/Opfikon
slide 23
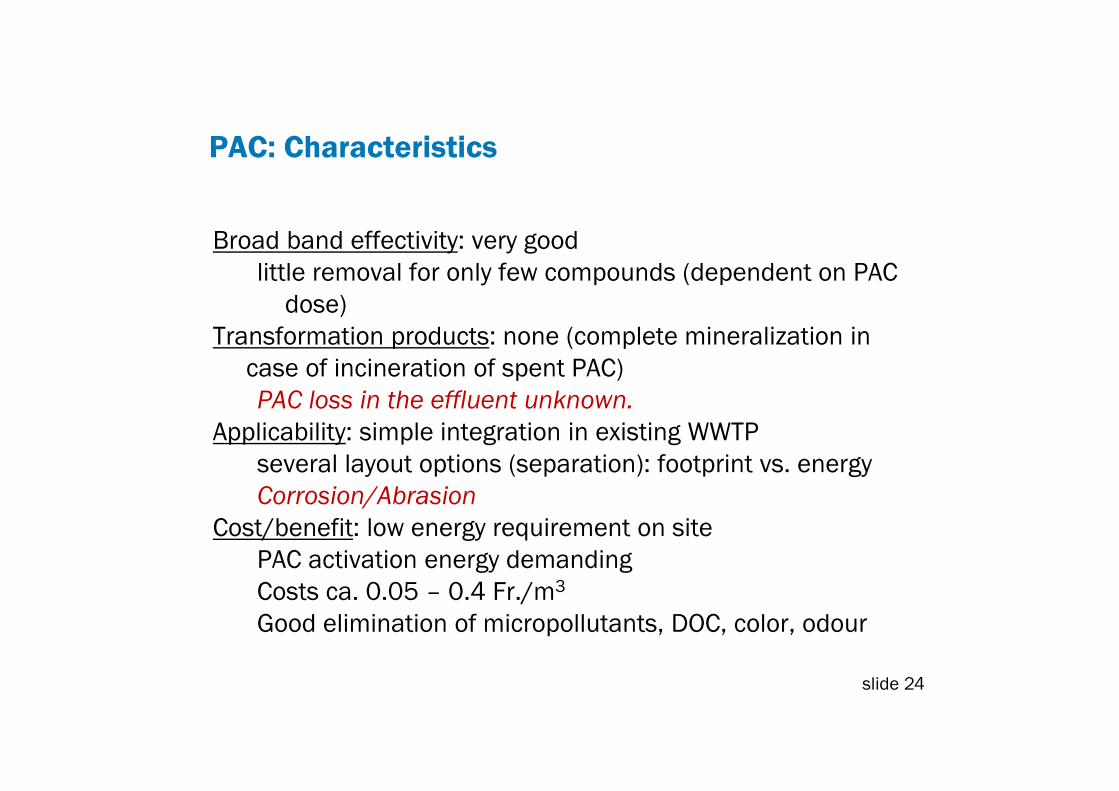
PAC: Characteristics
Broad band effectivity: very goodlittle removal for only few compounds (dependent on PAC
dose)Transformation products: none (complete mineralization in
case of incineration of spent PAC) PAC loss in the effluent unknown.
Applicability: simple integration in existing WWTPseveral layout options (separation): footprint vs. energyCorrosion/Abrasion
Cost/benefit: low energy requirement on site PAC activation energy demandingCosts ca. 0.05 – 0.4 Fr./m3
Good elimination of micropollutants, DOC, color, odour
slide 24
Overview
The Swiss strategy
The Technologies• Powdered activated carbon• Ozone
Costs and Energy
slide 25
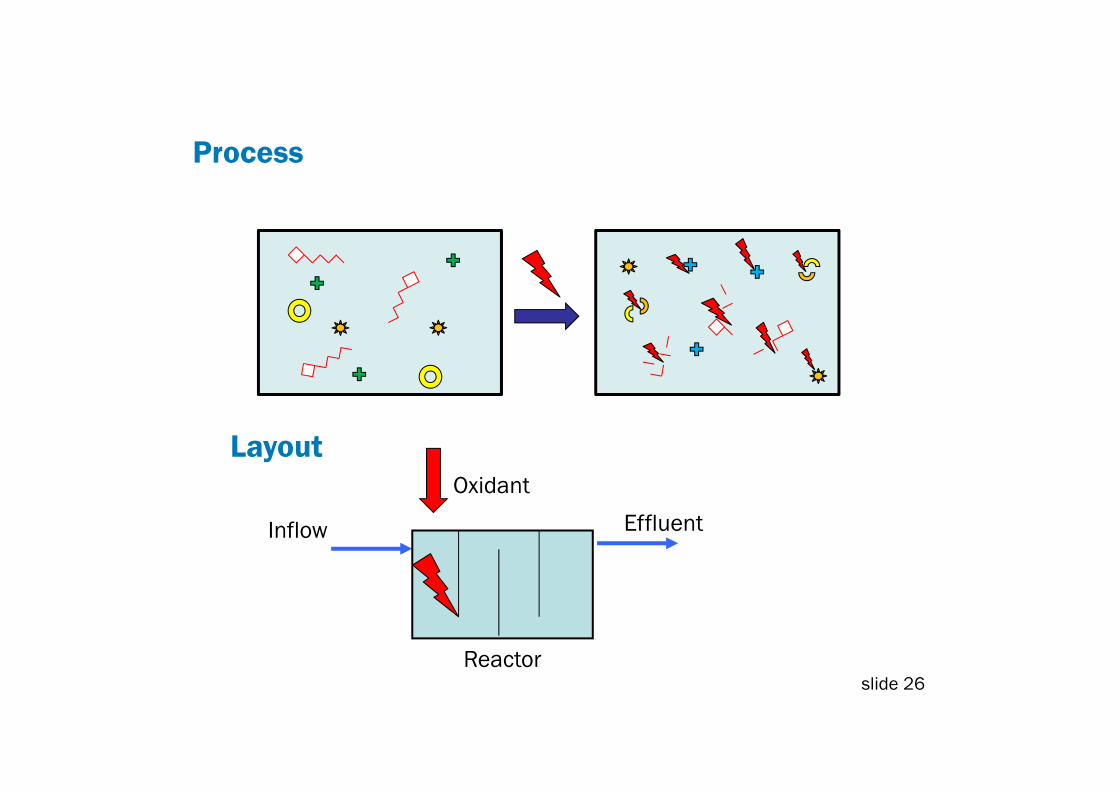
Process
Layout
Inflow Effluent
Oxidant
Reactorslide 26
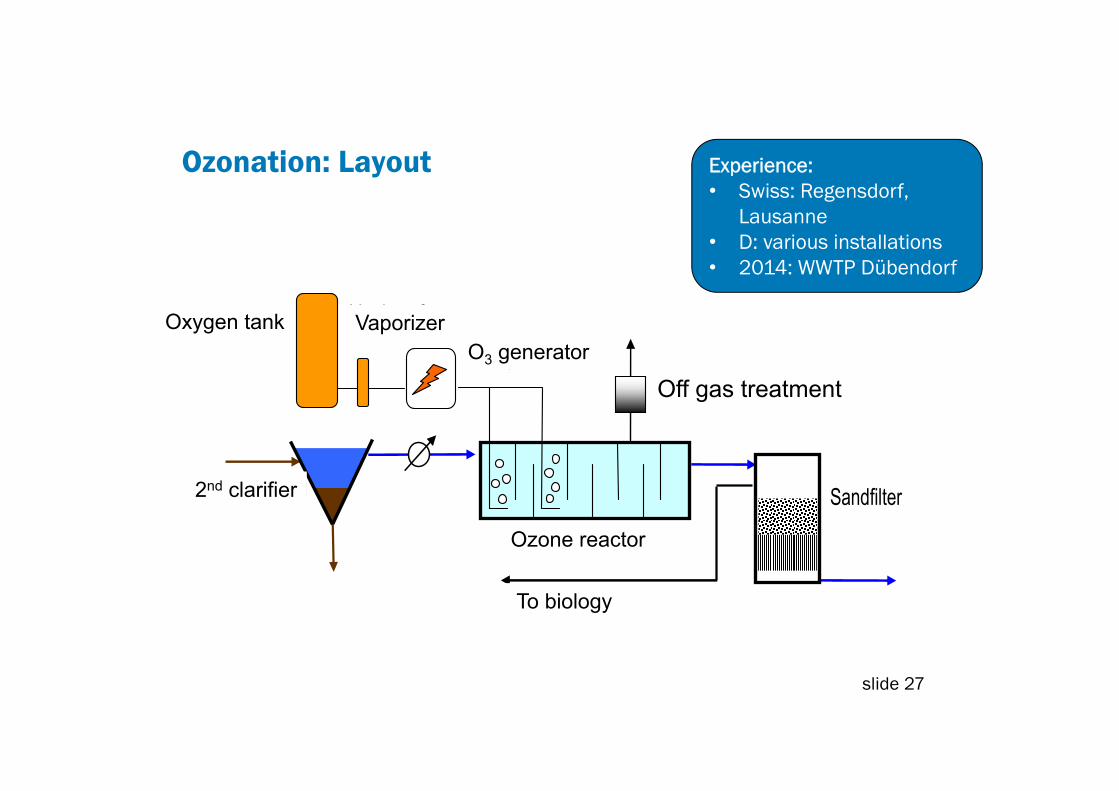
Ozonation: Layout Experience:• Swiss: Regensdorf,
Lausanne• D: various installations• 2014: WWTP Dübendorf
In biologische Stufe
OzongeneratorAbgasbehandlung
OzonungsreaktorSandfilter
Sauerstofftank Verdampfer
Nachklärung
Off gas treatmentO3 generator
Vaporizer Oxygen tank
2nd clarifier
Ozone reactor
To biology
slide 27
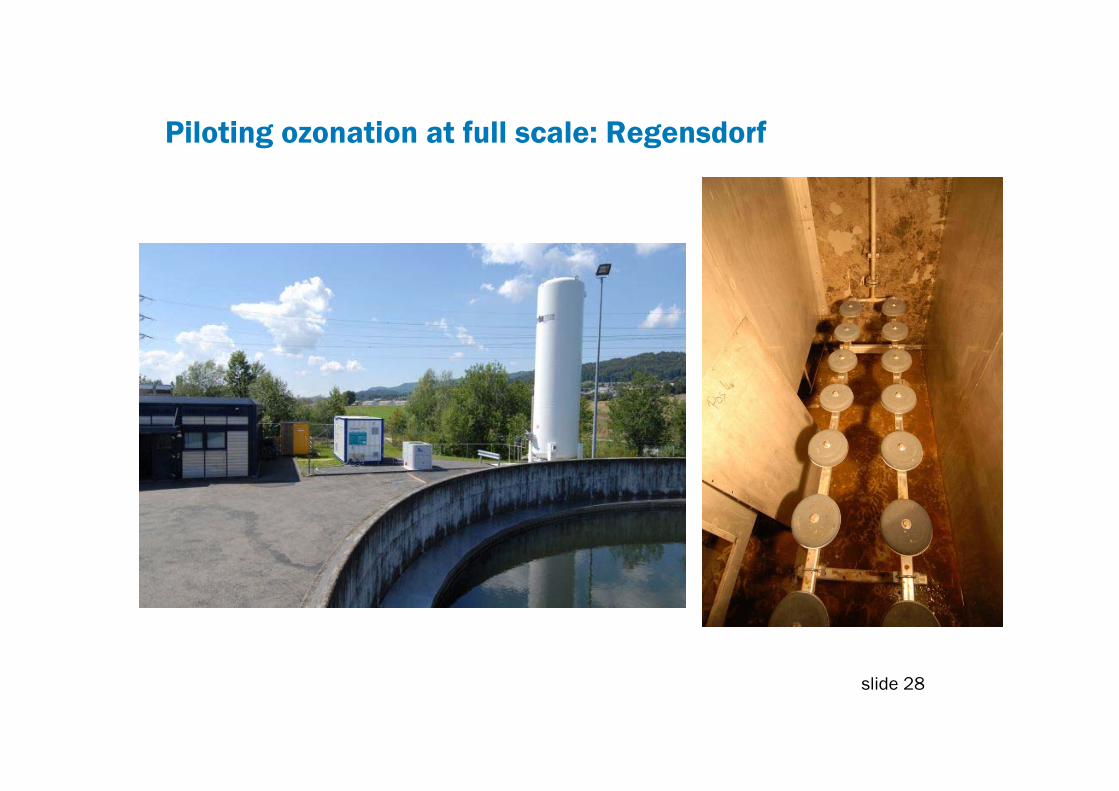
Piloting ozonation at full scale: Regensdorf
slide 28
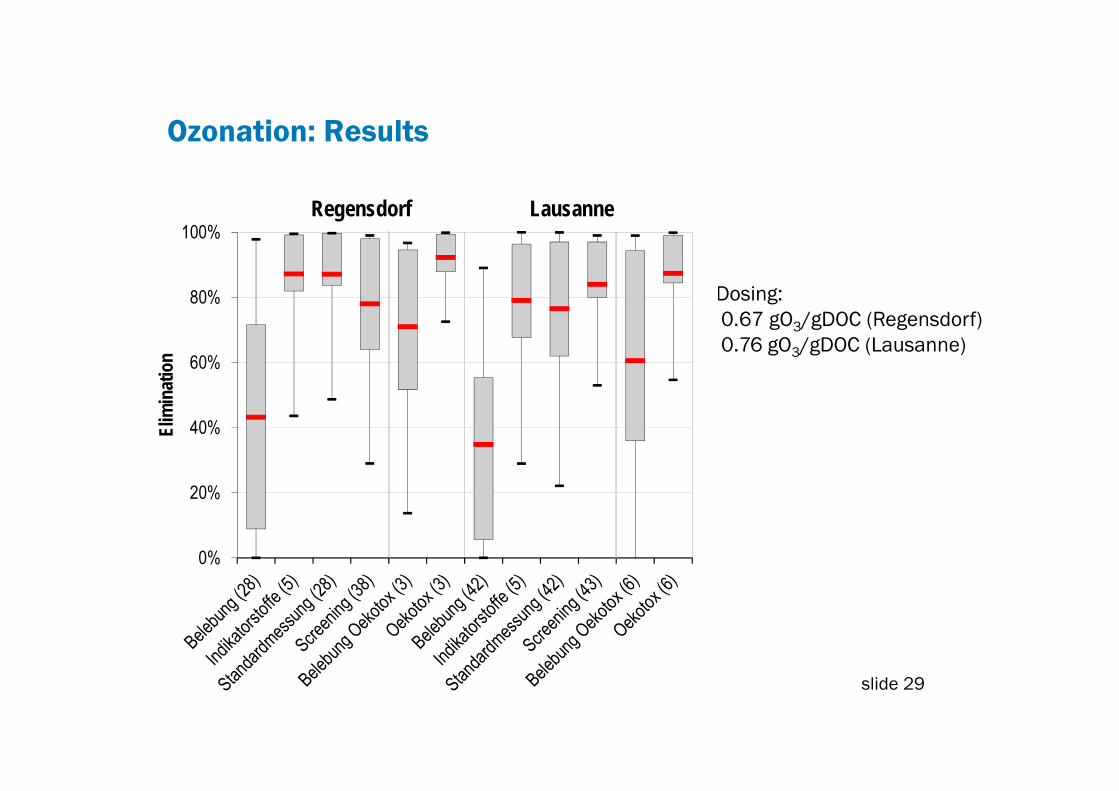
Ozonation: Results
Dosing:0.67 gO3/gDOC (Regensdorf) 0.76 gO3/gDOC (Lausanne)
0%
20%
40%
60%
80%
100%
Elim
inat
ion
Regensdorf Lausanne
slide 29
Ozonation: Characteristics
Broadband removal: very goodLimited elimination for few compounds (dependent on ozone dose)
Transformation products: mostly unknown oxidation productsClear decrease of most toxic effects, no increaseFormation of bromate, nitrosamines (dependent on WW composition)
Applicability: goodknown safety regulationsMaintenance by specialists
Cost/benefit: increased energy consumption on site (+ 10 – 30%)Costs ca. 0.05 – 0.2 Fr./m3
Good elimination of micropollutants, color, odour, pathogens
slide 30
Overview
The Swiss strategy
The Technologies• Powdered activated carbon• Ozone
Costs and Energy
slide 31
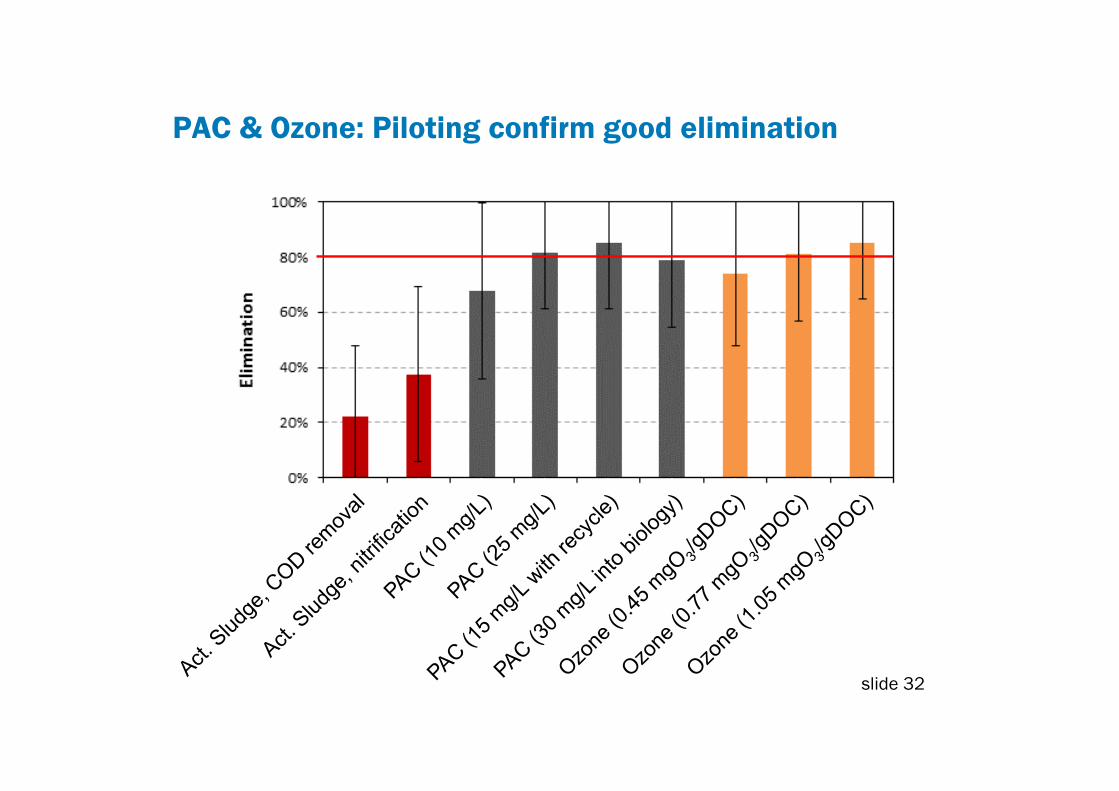
PAC & Ozone: Piloting confirm good elimination
slide 32

Water quality: ecotoxicology
In-vitro biotests:clear toxicity reduction
In-vivo biotest: toxicityreduction or no increase

Energy consumption (local)Ozonation and PAC
Today Ozone (5 mg/L) PAC (12 mg/L)WWTP
Flow kWh/m3 0.36 0.06 0.02PE kWh/PE/y 38 8 2
Primary energyFlow kWh/m3 1 0.27 0.37PE kWh/PE/y 105 33 50
Total energy consumption in Switzerland: Wastewater treatment 480 GWh/a 0.8%Total electric power 57’670 GWh/a 100%
slide 34
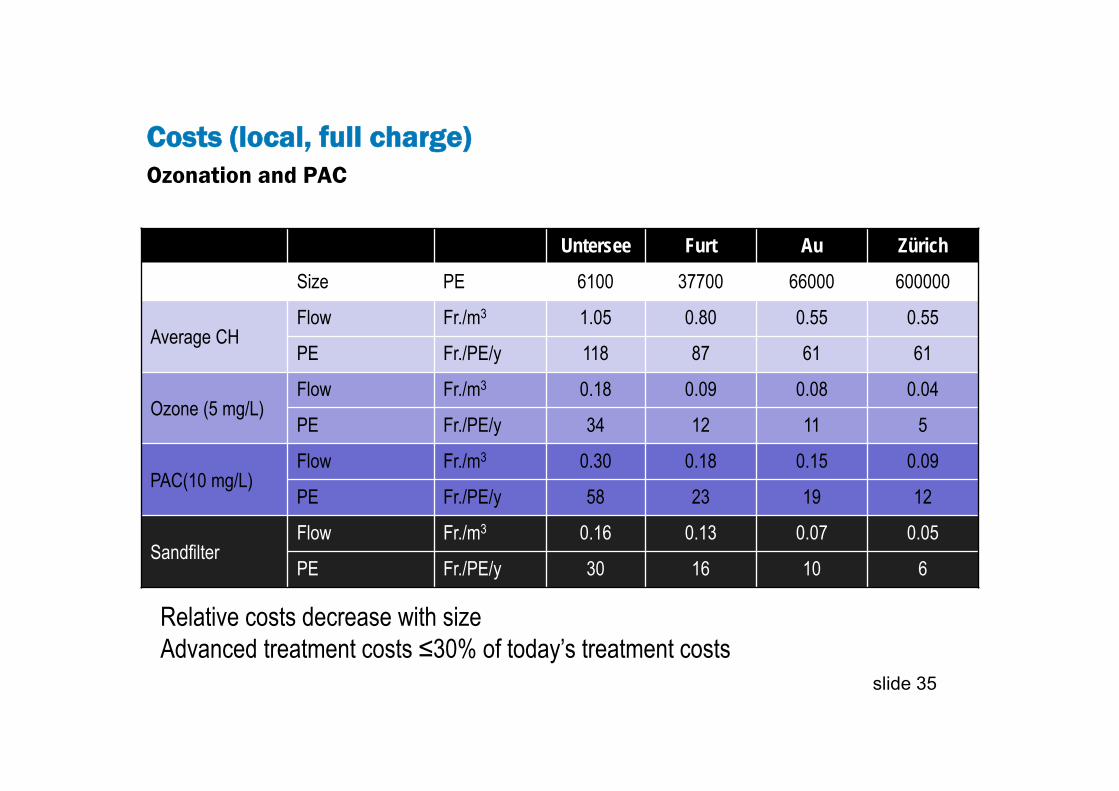
Costs (local, full charge)Ozonation and PAC
Untersee Furt Au Zürich
Size PE 6100 37700 66000 600000
Average CHFlow Fr./m3 1.05 0.80 0.55 0.55
PE Fr./PE/y 118 87 61 61
Ozone (5 mg/L)Flow Fr./m3 0.18 0.09 0.08 0.04
PE Fr./PE/y 34 12 11 5
PAC(10 mg/L)Flow Fr./m3 0.30 0.18 0.15 0.09
PE Fr./PE/y 58 23 19 12
SandfilterFlow Fr./m3 0.16 0.13 0.07 0.05
PE Fr./PE/y 30 16 10 6
slide 35
Relative costs decrease with sizeAdvanced treatment costs ≤30% of today’s treatment costs

Conclusion
• Reducing the micropollutant load discharged to our surface waters makes sense and is feasible
• Centralized municipal wastewater treatment is a relevant point source
• Different technological options
• Feasible and competitive today are adsorption on PAC and ozonation
• Knowledge transfer and gathering full scale experience is important for allowing efficient solutions
slide 36
Thank you