microgrid scheduling for reliable, cost-effective, and environmentally friendly energy management
TRANSCRIPT

Microgrid Scheduling for Reliable, Cost-Effective, andEnvironmentally Friendly Energy ManagementJeremy Jie Ming Kwok,†,‡ Nan Yu,†,‡ Iftekhar A. Karimi,† and Dong-Yup Lee*,†,§
†Department of Chemical and Biomolecular Engineering, National University of Singapore, 4 Engineering Drive 4, Singapore 117576,Singapore§Bioprocessing Technology Institute, Agency for Science, Technology and Research (A*STAR), 20 Biopolis Way, #06-01, Centros,Singapore 138668, Singapore
ABSTRACT: There has been a growing interest in microgrids because of various advantages such as environmental benefitsthrough its integration with renewables, possible cost-efficient replacement of the electricity infrastructure in isolated areas, andimprovement of reliability and resilience using multiple energy sources. However, the microgrid faces various challenges inoperational management because it deals with a multitude of energy sources mainly comprising renewables (municipal solidwaste incineration and solar and wind energy), fuels (natural gas, hydrogen, and biofuel), and batteries. In this work, wedeveloped a mixed-integer linear programming model for cost-efficient and environmentally friendly scheduling in the microgridoperation. The model provides optimal schedules with minimal cost or reduced environmental impacts, e.g., global warmingpotential, while satisfying the balance of electricity supply and demand. Notably, an additional set of diversity constraints isincorporated within the model to ensure reasonable allocation of electricity generation from each source, thereby allowing us tomaintain grid reliability. To demonstrate the applicability and utility of the model, a case study of a hypothetical microgid systemin Singapore Island is presented. A comparison result with the national grid system clearly proves the cost efficiency andenvironmental friendliness of the microgrid. We also investigated the effects of uncertainty in local demands and seasonalweather conditions on the microgrid scheduling, suggesting capacity planning to manage the dependency on national grid andrenewable sources.
1. INTRODUCTIONIn recent decades, the booming population and ubiquity ofelectrical devices have led to a surge in growing energy demand.Coupled with the world’s increasing environmental conscious-ness, now it is urgently needed to make power generation moreefficient and less polluting. However, the current national gridinfrastructure poses certain limitations, such as long-distancetransmission losses1 and power generation mainly by non-renewable energy sources. Hence, alternative solutions shouldbe pursued. In this regard, the microgrid, which is a localizedgeneration, distribution, and regulation of the electricity cluster,has recently been recognized as one of the promising solutionsto the future energy challenges.2 A microgrid networkcomprises small power-generating sources, loads consumingelectricity, batteries for electricity storage, a controller, and acoupling point connected to the national grid.3 The size of thesystem boundary of a microgrid can range from a building to acommunity. Thus, it can be easily employed in isolated areassuch as islands. More importantly, the ability to integrate small-scale renewable resources and other sources into the networkmakes it an environmentally friendly and flexible alternative tothe national grid.4 Therefore, the microgrid is able to reduce itscarbon footprint and reliance on fossil fuels.5 In addition,because the microgrid system can be operated independentlyfrom the national grid, it is resilient to power disruption causedby a spike in demand for electricity in the national grid.1
Despite the aforementioned advantages, the microgrid stillfaces several issues that hinder its practical and industrialimplementation. The planning and design of the microgrid
system is a complicated process requiring heuristics andexperiences.1 However, the development of microgrid systemsis still in its infancy, so it is too early to obtain relevant designrules of thumb. Another drawback is its higher constructioncost compared to the national grid, especially when aninfrastructure for the national grid is already present. Becauseit is too costly to set up microgrids for research purposes,feasibility studies were conducted by microgrid modeling.1
Nevertheless, the accuracy of such models is still questionabledue to the lack of realistic data. Last but not least, the criticaland practical challenge is management of the microgrid systemby the proper allocation of a number of energy sources toensure its operational feasibility, reliability, and cost efficiency.The last issue can be addressed by scheduling optimization assuccessfully applied to various manufacturing processes.6
There have been, however, only a handful of works in thescheduling of microgrids. Morais et al.7 developed a mixed-integer linear programming (MILP) model for a renewablemicrogrid while minimizing the total marginal cost. Ren et al.8
handled conflicting objectives of cost and environmentalfriendliness within multiobjective optimization framework.Ren and Gao9 considered various sources for long-termmicrogrid planning while minimizing cost where carbon
Special Issue: L. T. Fan Festschrift
Received: March 15, 2012Revised: May 24, 2012Accepted: May 31, 2012Published: May 31, 2012
Article
pubs.acs.org/IECR
© 2012 American Chemical Society 142 dx.doi.org/10.1021/ie3006897 | Ind. Eng. Chem. Res. 2013, 52, 142−151
emissions are taxed. A discrete-time-interval MILP model wasalso formulated by Zamarripa et al.10 for energy planning of themicrogrid. Recently, Mohammadi et al.11 employed a geneticalgorithm to obtain the optimal electricity production of variouspower sources. The major problem of the previous works isthat they did not consider the flexibility and reliability of themicrogrid, which can be described by proper allocation ofmultiple sources for operation purposes. Interestingly,Costello12 pointed out that a variety of sources can be widenedto prevent overreliance on a few sources. Without such sourcediversification, scheduling results may simply show a majorcontribution to the electricity demand by the cheapest energysource; there will be a huge risk of microgrid power disruptionif the energy source shuts down as a result of some unforeseencircumstances, thus compromising the reliability of themicrogrid system. On the other hand, utilizing more energysources gives rise to cost increases accordingly. Therefore, atradeoff must be examined for improving energy sourcediversity. Although Naraharisetti et al.13 recently introduced alinear diversity constraint that makes each source produceelectricity close to the ideal of the equal fraction of its capacity,they recognized that the model failed to obtain feasible solutionat a higher level of source diversity.Thus, in the current work, we develop a cost-effective and
environmentally friendly scheduling model of the microgrid,considering a set of novel linear diversity constraints on thebasis of reasonable minimal electricity production from eachsource. The environmental impact of the microgrid can bequantified by evaluating different types of emissions fromconstruction, operation, and decommissioning of the energysources and subsequently converting them into a standardizedmeasurement, e.g., global warming potential (GWP). A casestudy based on a hypothetical microgrid system in Singapore isconducted to evaluate the applicability of the model. Theresulting optimal schedules with minimized cost or GWP
indicate the significance of cost and environmental efficiency ofthe microgrid.
2. MATHEMATICAL MODEL OF MICROGRIDSCHEDULING
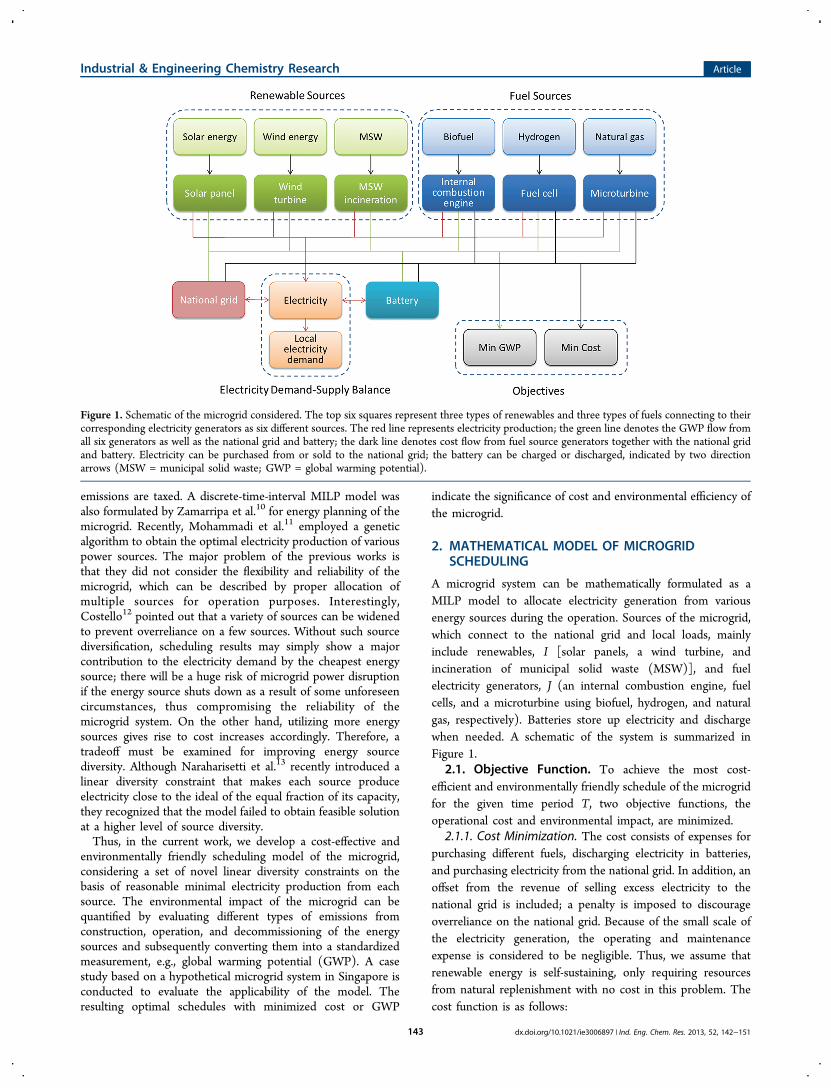
A microgrid system can be mathematically formulated as aMILP model to allocate electricity generation from variousenergy sources during the operation. Sources of the microgrid,which connect to the national grid and local loads, mainlyinclude renewables, I [solar panels, a wind turbine, andincineration of municipal solid waste (MSW)], and fuelelectricity generators, J (an internal combustion engine, fuelcells, and a microturbine using biofuel, hydrogen, and naturalgas, respectively). Batteries store up electricity and dischargewhen needed. A schematic of the system is summarized inFigure 1.
2.1. Objective Function. To achieve the most cost-efficient and environmentally friendly schedule of the microgridfor the given time period T, two objective functions, theoperational cost and environmental impact, are minimized.
2.1.1. Cost Minimization. The cost consists of expenses forpurchasing different fuels, discharging electricity in batteries,and purchasing electricity from the national grid. In addition, anoffset from the revenue of selling excess electricity to thenational grid is included; a penalty is imposed to discourageoverreliance on the national grid. Because of the small scale ofthe electricity generation, the operating and maintenanceexpense is considered to be negligible. Thus, we assume thatrenewable energy is self-sustaining, only requiring resourcesfrom natural replenishment with no cost in this problem. Thecost function is as follows:
Figure 1. Schematic of the microgrid considered. The top six squares represent three types of renewables and three types of fuels connecting to theircorresponding electricity generators as six different sources. The red line represents electricity production; the green line denotes the GWP flow fromall six generators as well as the national grid and battery; the dark line denotes cost flow from fuel source generators together with the national gridand battery. Electricity can be purchased from or sold to the national grid; the battery can be charged or discharged, indicated by two directionarrows (MSW = municipal solid waste; GWP = global warming potential).
Industrial & Engineering Chemistry Research Article
dx.doi.org/10.1021/ie3006897 | Ind. Eng. Chem. Res. 2013, 52, 142−151143
∑ ∑
∑ ∑
= · + ·
+ + · − ·∈ ∈
∈ ∈
cost Fuelp tfuel Bdisp bdischarge
Np Pena ebuyn Nprofit eton
min ( )
( )
i Ii i
t Tt
t Tt
t Tt
(1)
where Fuelpi, Bdisp, Np, Pena, and Nprof it denote the unit pricefor fuel i, price for discharging the battery, price and penalty forpurchasing electricity from the national grid, and profit fromselling excess electricity, respectively; tfueli, bdischarget, ebuynt,and etont denote the total fuel utilized in the corresponding fuelelectricity generator i, the electricity produced from dischargingthe battery, the electricity purchased from the national grid, andthe electricity sold to the national grid at time t, separately.2.1.2. Environmental Impact Minimization. For a compre-
hensive environmental analysis, GWP is used as a standardbenchmark to quantify various greenhouse gas emissions fromthe combustion of fuel for the entire lifespan andmanufacturing to decommissioning of the electricity generationsources.14 The GWP of different emissions are converted to theequivalent carbon dioxide emissions per kilowatt hour, and thevalues can be obtained from the Intergovernmental Panel onClimate Change (IPCC) model (100 years’ time horizon).15
The environmental impact function can be described bycomputing the total GWP from all electricity-generatingsources as follows:
∑ ∑
∑
= ·
+ · + ·
+ ·
∈ ∈
∈
env RenewGWP erenew
FuelGWP efuel BGWP bdischarge
NGWP ebuyn
min ( ( )
)
t T j Jj j t
i Ii i t t
t
,
,
(2)
where RenewGWPj, FuelGWPi, BGWP, and NGWP denote theGWP imposed per unit of electricity from renewable source j,fuel source i, battery, and national grid, respectively; erenewj,t,and efueli,t denote electricity directly used from renewablesource j and electricity generated from fuel i at time t,separately.2.2. Constraints. The model constraints can be derived
from the following:
(1) The local demand needs to be satisfied.(2) The total environmental impact should not violate
government regulations.(3) Reliability should be maintained through source diversity.(4) Electricity production from each fuel source should have
a reasonable distribution and be limited by thegenerators’ capacity as well as fuel availability.
(5) The battery must maintain a certain level of electricitystorage. Its electricity production should have a realisticcontribution to the local demand.
(6) Renewables can be utilized or stored to the battery whenthey are available.
(7) Purchasing and selling electricity to the national grid isnot allowed to happen simultaneously.
2.2.1. Electricity Supply and Demand. The supply ofelectricity in the microgrid must meet the local demand, whileexcess electricity can be either charged to the battery or sold tothe national grid. Thus, the balance of electricity supply anddemand can be expressed as follows:
∑ ∑+ + + =
+ + ∈
∈ ∈efuel erenew bdischarge ebuyn Deman
d eton etobattery t T
i Ii t
j Jj t t t
t t t
, ,
(3)
where Demandt is the local demand that should be met at time tand etobatteryt is the excess electricity that is stored in thebattery at time t.
2.2.2. Environmental Regulations. GWP cannot exceed itsdangerous level as stipulated by government regulations.
∑ ∑· + ·
+ · + · ≤ ∈
∈ ∈RenewGWP erenew FuelGWP efuel
BGWP bdischarge NGWP ebuyn DL t T
( ) ( )j J
j j ti I
i i t
t t
, ,
(4)
where DL denotes the dangerous level.When the other possibilities of disposal of MSW are
considered, this creates an offset from the emissions generatedby incineration of MSW such that it has a negative GWP.16 As aconservative estimate, the incineration of MSW is taken to havezero GWP.
2.2.3. Source Diversity. As epitomized by the popularproverb “do not put all your eggs in one basket”, diversity insources of electricity reduces volatility in price fluctuations andfuel shortages, creates a greener environment, decreases the riskin changes in regulations, and increases flexibility in handlingunforeseen events. Consequently, it provides enhanced stabilityand reliability in electricity production of the microgrid.12
Moreover, it improves security in electricity productionespecially against cases of unknown outcomes or unknownprobability distribution.17 To ensure such source diversityduring the operation, we introduce a diversity factor m in eq 5,indicating that at least m electricity-generating sources areoperated at time t.
∑ ∑≤ + + +
∈
∈ ∈m yrenew yfuel ybdischarge yebuyn
t T
j Jj t
i Ii t t t, ,
(5)
where yrenewj,t = 1 when renewable source j is used at time tand yfueli,t = 1 when fuel i is used at time t and otherwise 0.ybdischarget = 1 when batteries are discharged at time t, andyebuynt = 1 when the national grid is used at time t andotherwise 0.It should be noted that the factor m can be determined based
on the user’s or policy maker’s needs on diversity. In this work,eight different energy sources are integrated into this microgridsystem, including three types of renewables, three types of fuelelectricity generators, batteries, and the national grid. However,solar and wind energy are not available throughout the timehorizon, thus rendering it infeasible to constrain these sourcesto operate all of the time. Hence, m can range from 1 (nodiversity) to 6 (all sources excluding wind and solar). The effectof m on balancing microgrid reliability and cost/GWP will befurther elaborated in the results of a case study.
2.2.4. Fuels. The internal combustion engine, fuel cell, andmicroturbines are driven by biofuel, hydrogen, and natural gas,respectively, to generate electricity. The throughput andefficiency have an exponential relationship that may result innonlinearity of the model, rendering it cumbersome to obtainthe optimal results. Thus, the nonlinear relationships areapproximated to be piecewise linear.13 Each piece is defined asa numbered element r of set R, representing different ranges for
Industrial & Engineering Chemistry Research Article
dx.doi.org/10.1021/ie3006897 | Ind. Eng. Chem. Res. 2013, 52, 142−151144
throughputs. The electricity produced from fuel is calculated byeq 6.
∑= · ∈ ∈∈
efuel fuel Eff i I t T( ) ,i tr R
i r t i r, , , ,(6)
where fueli,r,t denotes the quantity of utilized fuel i in the rthpiece at time t and Ef f i,r denotes the electricity throughputefficiency of fuel i in the rth piece range.The piecewise linear range is selected and constrained
through eqs 7 and 8.
· · ≤ ≤ · ·
∈ > ∈ ∈
−Thruput Cap yz fuel Thruput Cap yz
r R r i I t T, 1, ,
r i i r t i r t r i i r t1 , , , , , ,
(7)
· · ≤ ≤ · ·
∈ = ∈ ∈
LB Cap yz fuel Thruput Cap yz
r R r i I t T, 1, ,i i r t i r t r i i r t, , , , , ,
(8)
where Capi denotes the fuel capacity of a type i electricitygenerator and Thruputr denotes the utilized fuel proportion ofits capacity in the rth piecewise range. LB is the minimum ratioof fuel that should be used to make the generator operate; yzi,r,t= 1 when the quantity of utilized fuel i is in the rth range andotherwise 0.The logic that at most one piecewise range can be chosen is
satisfied by eq 9.
∑= ∈ ∈∈
yfuel yz i I t T,i tr R
i r t, , ,(9)
The minimum amount of electricity supplied from each fuelsource should be split equally among the number of sourcesdetermined by the diversity factor m. As shown in eq 10, whenthe microgrid system is working regularly, that is, at least msources are under operation, each fuel source should be able tomeet at least one part of the evenly distributed electricitydemand. This constraint avoids unreasonable electricitydistribution when only a little fuel resource is being utilized.
· ≤ ≤ · ∈ ∈Demand
myfuel efuel F yfuel i I t T,t
i t i t i t, , ,
(10)
where F is a big number.Besides the fact that the electricity produced from fuel should
be bounded, the total required fuel for the whole time horizonshould be constrained by its supply availability in eqs 11 and 12.
≤ ∈tfuel Available i Ii i (11)
∑ ∑= ∈∈ ∈
tfuel fuel i Iir R t T
i r t, ,(12)
where Availablei is the available supply of fuel i.2.2.5. Renewables. Wind, solar, and MSW energies are the
renewables in the system; the expected renewable energy canbe either stored to the battery or used to satisfy the demand oflocal loads as in eq 13.
+ = ∈ ∈erenew saverenew Predrenew j J t T,j t j t j t, , ,
(13)
where Predrenewj,t denotes the estimated electricity generatedfrom renewable source j and saverenewj,t denotes the electricitydirectly saved from renewable j to batteries. It should be notedthat the action of saving electricity directly from Predrenewj,t isprior to saving electricity from excess electricity. Because
erenewj,t is a part of the contribution to satisfy the local demandin eq 3, it is possible that part of erenewj,t turns out to be excesselectricity; this part of the electricity can be saved to batteries aswell. However, this part of the stored electricity is not includedin saverenewj,t but in etobatteryt. The excess electricity can besold to the national grid, depending on its price efficiency.In eq 14, the logic constraint is used such that the binary
variable yrenewj,t equals 1 when Predrenewj,t is available, whereasit equals 0 when Predrenewj,t is not available.
= >
= = ∈∈
yrenew Predrenew
yrenew Predrenew j Jt T
1, when 0
0, when 0 ,
j t j t
j t j t
, ,
, ,
(14)
2.2.6. Batteries. The concept of reasonable minimalelectricity production from each source is applied to thebatteries. The lower bound is set because batteries are regardedas an electricity source equal to others in the system. Becausethe capacity of the batteries is much smaller than the one of fuelelectricity generation by different orders of magnitude, thelower bound of battery discharge is set as N (0 < N < 1) timesthat in fuel sources from eq 10. Therefore, the general lowerand upper bounds of battery discharge are controlled by thebinary variable ybdischarget in eq 15.
· · ≤ ≤ ·
∈
NDemand
mybdischarge bdischarge B ybdischarge
t T
tt t t
(15)
where B denotes the battery capacity and N denotes the factorused to reduce the lower bound of battery discharge.The discharged electricity at time t cannot be greater than
the stored electricity in the batteries at time t − 1, and thebattery storage is initialized with half of its capacity, as shown ineqs 16 and 17.
≤ ∈ >−bdischarge ebatterystore t T t, 1t t 1 (16)
≤ ∈ =bdischarge B t T t12
, 1t (17)
where ebatterystoret denotes the amount of battery storage attime t. ebatterystoret can be determined from eqs 18 and 19.
= + ·
− ∈ >−ebatterystore ebatterystore Effbatt bcharge
bdischarge t T t, 1t t t
t
1
(18)
= + · −
∈ =
ebatterystore B Effbatt bcharge bdischarge
t T t
12
, 1
t t t
(19)
where bcharget denotes the electricity charged to batteries attime t and Ef fbatt denotes the round-trip efficiency. Thebatteries should have at least W MJ of energy stored in it tohandle unforeseen circumstances, while not exceeding itscapacity at that time (eq 20).
≤ ≤ ∈W ebatterystore B t Tt (20)
bcharget can be determined from eq 21, which shows thatbatteries can be charged from excess electricity and renewableenergy storage.
Industrial & Engineering Chemistry Research Article
dx.doi.org/10.1021/ie3006897 | Ind. Eng. Chem. Res. 2013, 52, 142−151145
∑= + ∈∈
bcharge saverenew etobattery t Ttj J
j t t,(21)
where etobatteryt denotes the excess electricity that is saved intothe batteries. The amount of electricity used to charge thebatteries cannot exceed the capacity, as in eq 22.
≤ · ∈bcharge B ybcharge t Tt t (22)
where ybcharget = 1 when the batteries are charging andotherwise 0. Because the battery units are considered as onesingle battery cluster, charging and discharging of the batteriescannot occur simultaneously, as shown in eq 23.
+ ≤ ∈ybch e ybdisch e t Targ arg 1t t (23)
2.2.7. National Grid.When the electricity-generating sourcesare unable to fulfill the local demand, additional electricity hasto be purchased from the national grid. Moreover, surpluselectricity can be sold to the national grid for profit. Equations24 and 25 define the bounds of ebuynt and etont,
· ≤ ≤ · ∈L yebuyn ebuyn F yebuyn t Tt t t (24)
· ≤ ≤ · ∈L yeton eton F yeton t Tt t t (25)
where L is a small number and yetont = 1 when excess electricityis sold to the national grid and otherwise 0.Equation 26 specifies the logic that purchase and sell is not
permitted to happen simultaneously.
+ ≤ ∈yebuyn yeton t T1t t (26)
3. CASE STUDY: SCHEDULING OF A MICROGRID ONSINGAPORE ISLAND
As a case study, the current microgrid scheduling model wasapplied to a hypothetical microgrid system on Singapore Island.The application of the microgrid may decrease the reliance onJurong Island’s power supply, initiating a more cost-efficientand sustainable manner for electricity production. Incinerationof MSW is common in Singapore, and the incineration plantoperates 24 h/day. It is assumed that MSW is distributed evenlythroughout the day. In Singapore, 78.7% of electricity wasgenerated from natural gas in the year 2010.18 Because naturalgas has the lowest GWP and cost among the fuel options
available, we only consider a natural-gas-powered national gridfor a fair comparison with the microgrid.The model is formulated as a MILP problem that can be
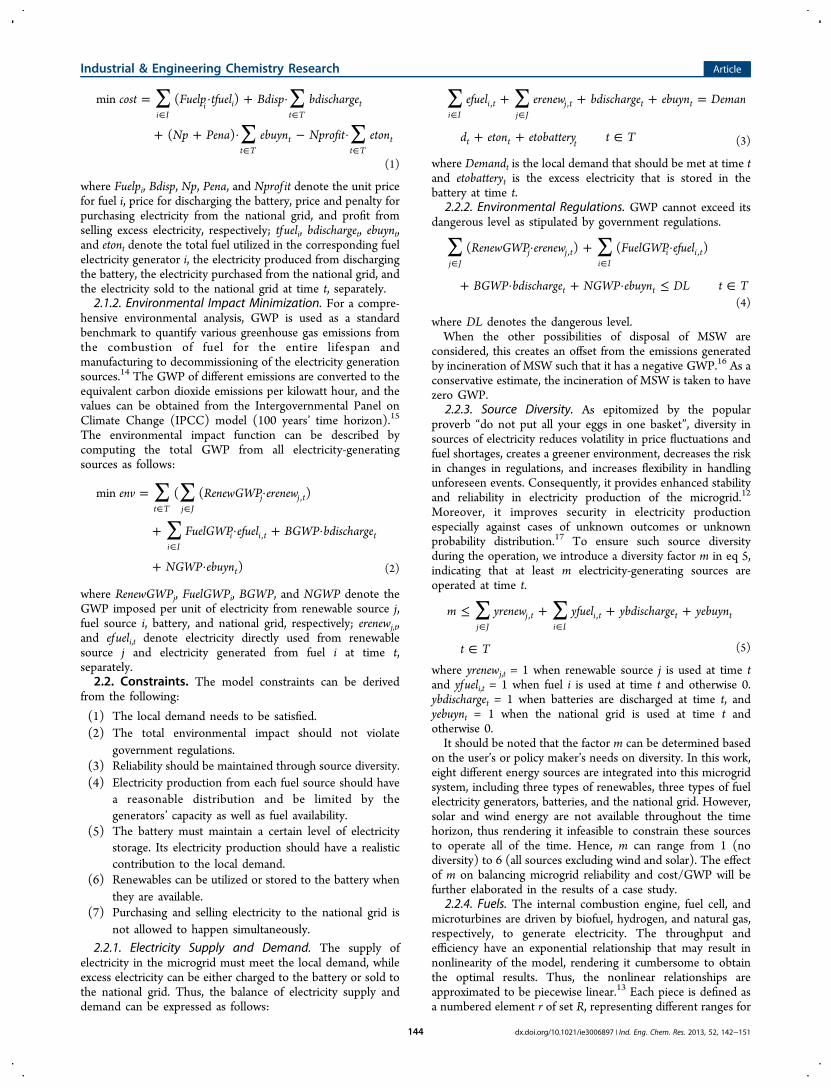
solved using CPLEX in the GAMS environment.19 Theinvestigated time horizon T is assumed to be 24 h of a day.For the realistic application of this model, smaller time intervals(seconds or minutes) should be used for real-time control,while larger time intervals (hours, days, or months) should beapplied for long-term planning. The estimated electricitydemand and solar and wind energy are cited from the workproposed by Naraharisetti et al.13 (Figure 2). Other parametersare stated in Table 1.
3.1. Selection of the Diversity Factor. The diversityconstraints are controlled by a parameter m. Thus, increasing mleads to greater diversity in sources that provide electricity to
Figure 2. Hypothesized data of the electricity demand and energy obtained from solar, wind, and incineration of MSW.
Table 1. Model Parameters Used
parameter value reference
Fuelpi i = 1, 0.2; i = 2, 0.336; i = 3, 0.275 $/kg 13Bdisp 0.018 $/MJNp 0.275 $/MJ 13Pena 0.4 $/MJNprof it 0.01 $/MJFuelGWPi i = 1, 1920; i = 2, 552; i = 3, 474 24−26RewGWPj i = 1, 217; i = 2, 32; i = 3, 0 26−28BGWP 48 13NGWP 474 13DL 19315000 29B 3000 MJW 5000 MJCapl i = 1, 1200; i = 2, 5000; i = 3, 1200 kg/h 13LB 0.3N 0.1Availablet i = 1, 28800; i = 2, 23000; i = 3, 10000 kg/dayThruputr r = 1, 0.7; r = 2, 0.8; r = 3, 0.9; r = 4, 1.0; i = 1, r = l,
1.389; i = 1, r = 2, 1.666; i = 1, r = 3, 1.944; I = 1, r= 4, 2.222
13
Ef f i,r i = 2, r = 1, 0.6; i = 2, r = 2, 0.7; i = 2, r = 3, 0.8; i =2, r = 4, 0.9; i = 3, r = 1, 3.75; i = 3, r = 2, 4.50; i =3, r = 3, 5.25; i = 3, r = 4, 6.00
13
Ef fbatt 0.81 13
Industrial & Engineering Chemistry Research Article
dx.doi.org/10.1021/ie3006897 | Ind. Eng. Chem. Res. 2013, 52, 142−151146
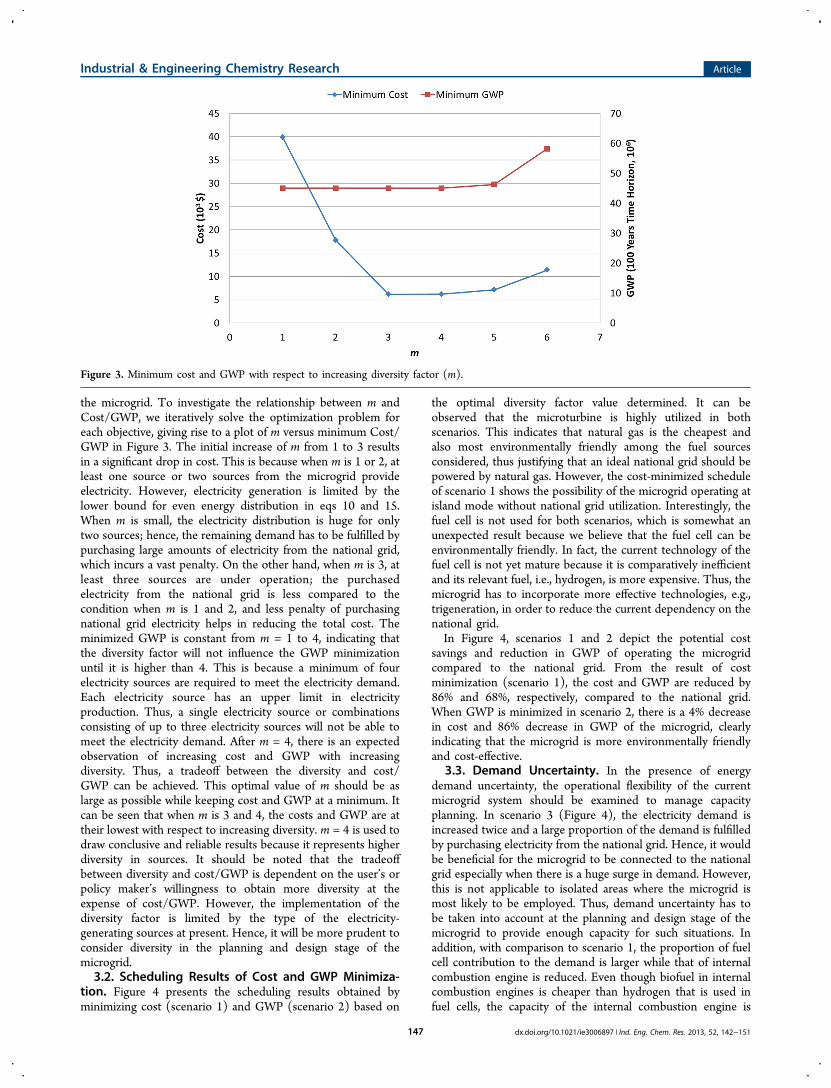
the microgrid. To investigate the relationship between m andCost/GWP, we iteratively solve the optimization problem foreach objective, giving rise to a plot of m versus minimum Cost/GWP in Figure 3. The initial increase of m from 1 to 3 resultsin a significant drop in cost. This is because when m is 1 or 2, atleast one source or two sources from the microgrid provideelectricity. However, electricity generation is limited by thelower bound for even energy distribution in eqs 10 and 15.When m is small, the electricity distribution is huge for onlytwo sources; hence, the remaining demand has to be fulfilled bypurchasing large amounts of electricity from the national grid,which incurs a vast penalty. On the other hand, when m is 3, atleast three sources are under operation; the purchasedelectricity from the national grid is less compared to thecondition when m is 1 and 2, and less penalty of purchasingnational grid electricity helps in reducing the total cost. Theminimized GWP is constant from m = 1 to 4, indicating thatthe diversity factor will not influence the GWP minimizationuntil it is higher than 4. This is because a minimum of fourelectricity sources are required to meet the electricity demand.Each electricity source has an upper limit in electricityproduction. Thus, a single electricity source or combinationsconsisting of up to three electricity sources will not be able tomeet the electricity demand. After m = 4, there is an expectedobservation of increasing cost and GWP with increasingdiversity. Thus, a tradeoff between the diversity and cost/GWP can be achieved. This optimal value of m should be aslarge as possible while keeping cost and GWP at a minimum. Itcan be seen that when m is 3 and 4, the costs and GWP are attheir lowest with respect to increasing diversity. m = 4 is used todraw conclusive and reliable results because it represents higherdiversity in sources. It should be noted that the tradeoffbetween diversity and cost/GWP is dependent on the user’s orpolicy maker’s willingness to obtain more diversity at theexpense of cost/GWP. However, the implementation of thediversity factor is limited by the type of the electricity-generating sources at present. Hence, it will be more prudent toconsider diversity in the planning and design stage of themicrogrid.3.2. Scheduling Results of Cost and GWP Minimiza-
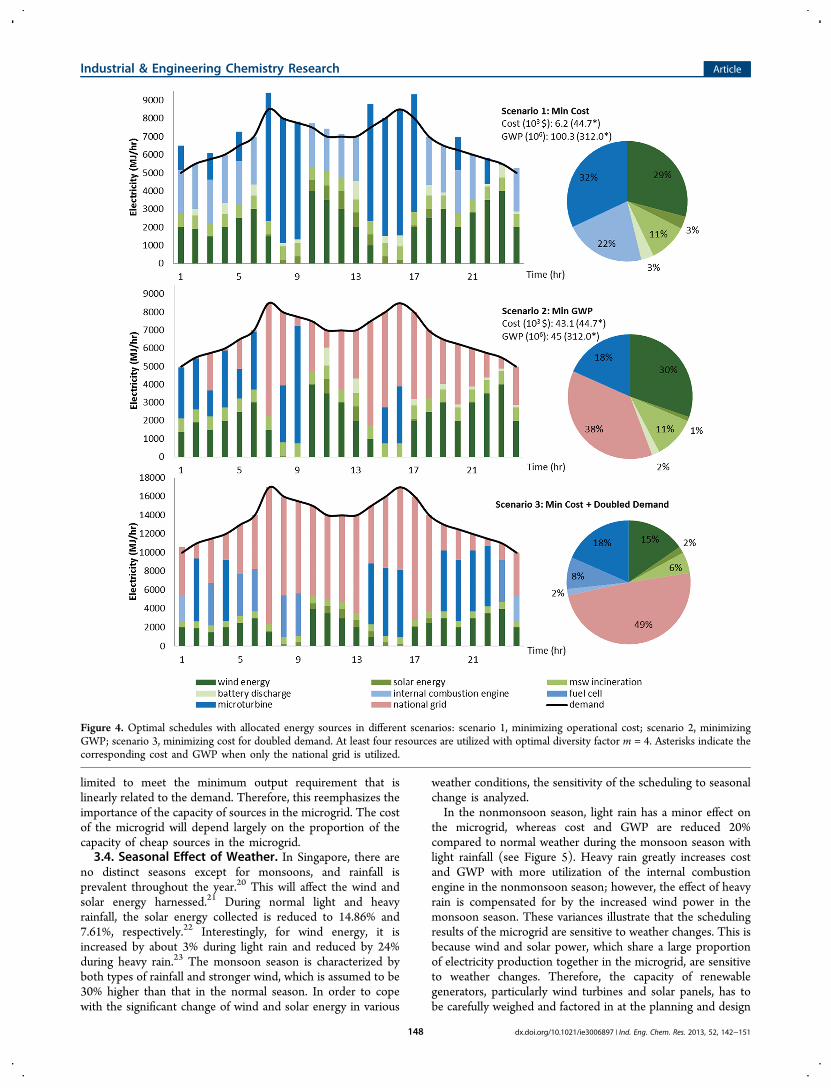
tion. Figure 4 presents the scheduling results obtained byminimizing cost (scenario 1) and GWP (scenario 2) based on
the optimal diversity factor value determined. It can beobserved that the microturbine is highly utilized in bothscenarios. This indicates that natural gas is the cheapest andalso most environmentally friendly among the fuel sourcesconsidered, thus justifying that an ideal national grid should bepowered by natural gas. However, the cost-minimized scheduleof scenario 1 shows the possibility of the microgrid operating atisland mode without national grid utilization. Interestingly, thefuel cell is not used for both scenarios, which is somewhat anunexpected result because we believe that the fuel cell can beenvironmentally friendly. In fact, the current technology of thefuel cell is not yet mature because it is comparatively inefficientand its relevant fuel, i.e., hydrogen, is more expensive. Thus, themicrogrid has to incorporate more effective technologies, e.g.,trigeneration, in order to reduce the current dependency on thenational grid.In Figure 4, scenarios 1 and 2 depict the potential cost
savings and reduction in GWP of operating the microgridcompared to the national grid. From the result of costminimization (scenario 1), the cost and GWP are reduced by86% and 68%, respectively, compared to the national grid.When GWP is minimized in scenario 2, there is a 4% decreasein cost and 86% decrease in GWP of the microgrid, clearlyindicating that the microgrid is more environmentally friendlyand cost-effective.
3.3. Demand Uncertainty. In the presence of energydemand uncertainty, the operational flexibility of the currentmicrogrid system should be examined to manage capacityplanning. In scenario 3 (Figure 4), the electricity demand isincreased twice and a large proportion of the demand is fulfilledby purchasing electricity from the national grid. Hence, it wouldbe beneficial for the microgrid to be connected to the nationalgrid especially when there is a huge surge in demand. However,this is not applicable to isolated areas where the microgrid ismost likely to be employed. Thus, demand uncertainty has tobe taken into account at the planning and design stage of themicrogrid to provide enough capacity for such situations. Inaddition, with comparison to scenario 1, the proportion of fuelcell contribution to the demand is larger while that of internalcombustion engine is reduced. Even though biofuel in internalcombustion engines is cheaper than hydrogen that is used infuel cells, the capacity of the internal combustion engine is
Figure 3. Minimum cost and GWP with respect to increasing diversity factor (m).
Industrial & Engineering Chemistry Research Article
dx.doi.org/10.1021/ie3006897 | Ind. Eng. Chem. Res. 2013, 52, 142−151147
limited to meet the minimum output requirement that islinearly related to the demand. Therefore, this reemphasizes theimportance of the capacity of sources in the microgrid. The costof the microgrid will depend largely on the proportion of thecapacity of cheap sources in the microgrid.3.4. Seasonal Effect of Weather. In Singapore, there are
no distinct seasons except for monsoons, and rainfall isprevalent throughout the year.20 This will affect the wind andsolar energy harnessed.21 During normal light and heavyrainfall, the solar energy collected is reduced to 14.86% and7.61%, respectively.22 Interestingly, for wind energy, it isincreased by about 3% during light rain and reduced by 24%during heavy rain.23 The monsoon season is characterized byboth types of rainfall and stronger wind, which is assumed to be30% higher than that in the normal season. In order to copewith the significant change of wind and solar energy in various
weather conditions, the sensitivity of the scheduling to seasonalchange is analyzed.In the nonmonsoon season, light rain has a minor effect on
the microgrid, whereas cost and GWP are reduced 20%compared to normal weather during the monsoon season withlight rainfall (see Figure 5). Heavy rain greatly increases costand GWP with more utilization of the internal combustionengine in the nonmonsoon season; however, the effect of heavyrain is compensated for by the increased wind power in themonsoon season. These variances illustrate that the schedulingresults of the microgrid are sensitive to weather changes. This isbecause wind and solar power, which share a large proportionof electricity production together in the microgrid, are sensitiveto weather changes. Therefore, the capacity of renewablegenerators, particularly wind turbines and solar panels, has tobe carefully weighed and factored in at the planning and design
Figure 4. Optimal schedules with allocated energy sources in different scenarios: scenario 1, minimizing operational cost; scenario 2, minimizingGWP; scenario 3, minimizing cost for doubled demand. At least four resources are utilized with optimal diversity factor m = 4. Asterisks indicate thecorresponding cost and GWP when only the national grid is utilized.
Industrial & Engineering Chemistry Research Article
dx.doi.org/10.1021/ie3006897 | Ind. Eng. Chem. Res. 2013, 52, 142−151148
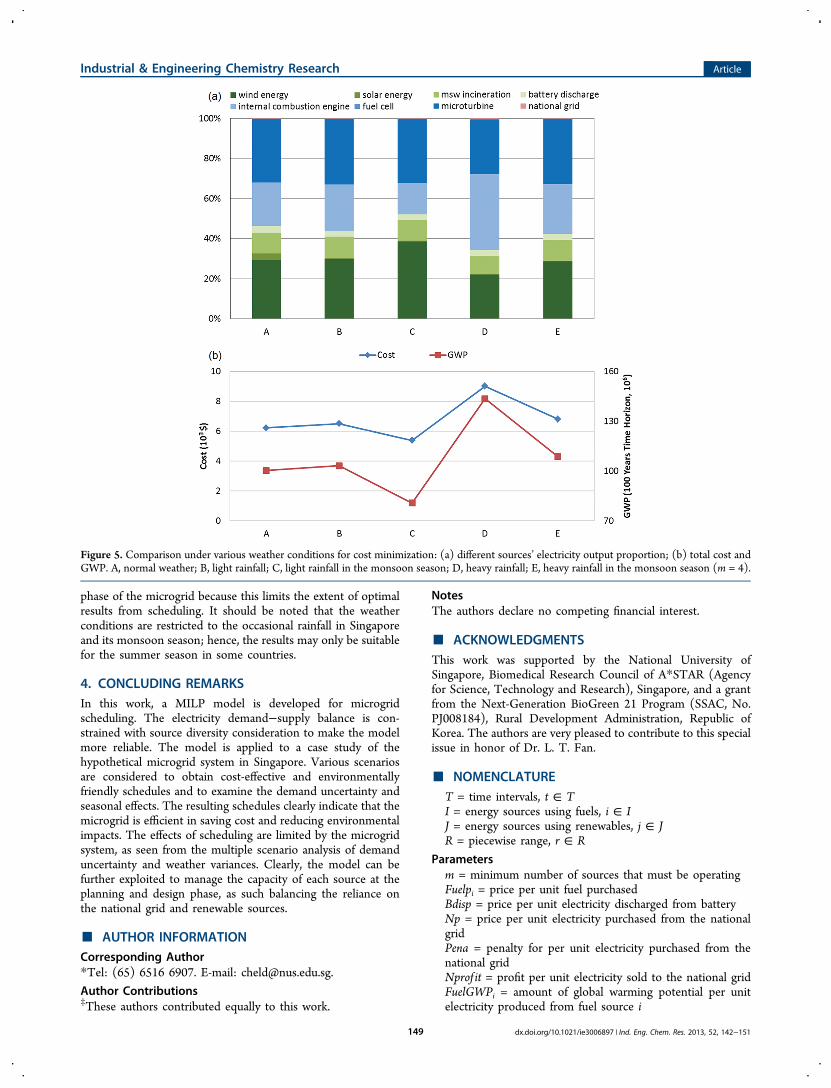
phase of the microgrid because this limits the extent of optimalresults from scheduling. It should be noted that the weatherconditions are restricted to the occasional rainfall in Singaporeand its monsoon season; hence, the results may only be suitablefor the summer season in some countries.
4. CONCLUDING REMARKSIn this work, a MILP model is developed for microgridscheduling. The electricity demand−supply balance is con-strained with source diversity consideration to make the modelmore reliable. The model is applied to a case study of thehypothetical microgrid system in Singapore. Various scenariosare considered to obtain cost-effective and environmentallyfriendly schedules and to examine the demand uncertainty andseasonal effects. The resulting schedules clearly indicate that themicrogrid is efficient in saving cost and reducing environmentalimpacts. The effects of scheduling are limited by the microgridsystem, as seen from the multiple scenario analysis of demanduncertainty and weather variances. Clearly, the model can befurther exploited to manage the capacity of each source at theplanning and design phase, as such balancing the reliance onthe national grid and renewable sources.
■ AUTHOR INFORMATIONCorresponding Author*Tel: (65) 6516 6907. E-mail: [email protected].
Author Contributions‡These authors contributed equally to this work.
NotesThe authors declare no competing financial interest.
■ ACKNOWLEDGMENTSThis work was supported by the National University ofSingapore, Biomedical Research Council of A*STAR (Agencyfor Science, Technology and Research), Singapore, and a grantfrom the Next-Generation BioGreen 21 Program (SSAC, No.PJ008184), Rural Development Administration, Republic ofKorea. The authors are very pleased to contribute to this specialissue in honor of Dr. L. T. Fan.
■ NOMENCLATURET = time intervals, t ∈ TI = energy sources using fuels, i ∈ IJ = energy sources using renewables, j ∈ JR = piecewise range, r ∈ R
Parametersm = minimum number of sources that must be operatingFuelpi = price per unit fuel purchasedBdisp = price per unit electricity discharged from batteryNp = price per unit electricity purchased from the nationalgridPena = penalty for per unit electricity purchased from thenational gridNprof it = profit per unit electricity sold to the national gridFuelGWPi = amount of global warming potential per unitelectricity produced from fuel source i
Figure 5. Comparison under various weather conditions for cost minimization: (a) different sources’ electricity output proportion; (b) total cost andGWP. A, normal weather; B, light rainfall; C, light rainfall in the monsoon season; D, heavy rainfall; E, heavy rainfall in the monsoon season (m = 4).
Industrial & Engineering Chemistry Research Article
dx.doi.org/10.1021/ie3006897 | Ind. Eng. Chem. Res. 2013, 52, 142−151149
RewGWPj = amount of global warming potential per unitelectricity produced from source jBGWP = amount of global warming potential per unitelectricity produced from battery dischargeNGWP = amount of global warming potential per unitelectricity produced from the national gridDemandt = local demand for electricity at time tPredrenwj,t = estimated electricity output for renewablesources j at time tDL = amount of carbon credits at the dangerous levelB = battery storage capacityW = minimum amount of electricity to be store in thebatteryCapi = fuel capacity in source unit iLB = lower bound of the fuel ratio of generator capacityN = factor used to reduce the lower bound of batterydischargeAvailablei = total available fuel storage for source iThruputr = throughput of the piecewise relationship rEf f i,r = electricity conversion factor of fuel for source i at thepiecewise relationship rEf fbatt = round-trip efficiency of the batteryF = large number
Binary Variablesyzi,r,t = 1 if the piecewise linear relationship r is used forsource i at time t and 0 otherwiseyfueli,t = 1 if the corresponding fuel is used for source i attime t and 0 otherwiseyrenewj,t = 1 if renewable sources j is used at time t and 0otherwiseybdischarget = 1 if the battery is discharged at time t and 0otherwiseybcharget = 1 if the battery is charged at time t and 0otherwiseyebuynt = 1 if electricity is purchased from the national grid attime t and 0 otherwiseyetont = 1 if electricity is sold to the national grid at time tand 0 otherwise
Continuous Variablescost = total cost for scheduling the microgridenv = total global warming potential for scheduling themicrogridtfueli = total amount of fuel for source i required over thetime horizonfueli,r,t = amount of fuel for source i required from thepiecewise relationship r at time tefueli,t = amount of electricity produced from source i at timeterenewj,t = amount of electricity produced from renewablesource j at time tsaverenewj,t = amount of electricity saved to the battery fromrenewable source j at time tbdischarget = amount of electricity discharged from thebattery at time tbcharget = amount of electricity charged to the battery attime tetobatteryt = amount of excess electricity produced sent tothe battery for storage at time tebatterystoret = amount of electricity stored in the battery attime tebuynt = amount of electricity purchased from the nationalgrid at time t
etont = amount of electricity sold to the national grid at timet
■ REFERENCES(1) Platt, G.; Berry, A.; Cornforth, D. What Role for Microgrids? InSmart Grid: Integrating Renewable, Distributed & Efficient Energy;Sioshansi, P. F., Ed.; Elsevier: New York, 2012; pp 185−207.(2) Lasseter, R. H.; Paigi, P. Proceedings of 35th Annual IEEE PowerElectronics Specialists Conference, Aachen, Germany, June 20−25,2004; pp 4285−4290 (Microgrid: a Conceptual Solution, v6).(3) Lasseter, R. H. Proceedings of 2002 IEEE Power EngineeringSociety Winter Meeting, New York, Jan 27−31, 2002; pp 305−308.(Microgrid, v1).(4) Venkataramanan, G.; Marnay, C. A Larger Role for Microgrids.IEEE Power Energy Mag. 2008, 6 (3), 78−82.(5) Tanrioven, M. Reliability and Cost-benefits of Adding AlternatePower Sources to an Independent Micro-grid Community. J. PowerSources 2005, 150, 136−149.(6) Pinedo, M. L. Planning and Scheduling in Manufacturing andServices; Springer Verlag: Berlin, 2009; pp 3−11.(7) Morais, H.; Kadar, P.; Faria, P.; Vale, Z. A.; Khodr, H. M.Optimal Scheduling of a Renewable Micro-grid in an Isolated LoadArea Using Mixed-Integer Linear Programming. Renewable Energy2010, 35 (1), 151−156.(8) Ren, H.; Zhou, W.; Nakagami, K.; Gao, W.; Wu, Q. Multi-objective Optimization for the Operation of Distributed EnergySystems Considering Economic and Environmental Aspects. Appl.Energy 2010, 87 (12), 3642−3651.(9) Ren, H.; Gao, W. A MILP Model for Integrated Plan andEvaluation of Distributed Energy Systems. Appl. Energy 2010, 87 (3),1001−1014.(10) Zamarripa, M.; Vasquez, J. C.; Guerrero, J. M.; Graells, M. InComputer Aided Chemical Engineering 2011; Proceedings of the 21stEuropean Symposium on Computer Aided Process EngineeringESCAPE 21, Chalkidiki, Greece, May 29−June 1, 2011; Pistikopoulos,E. N., Georgiadis, M. C., Kokossis A. C., Eds.; Elsevier BV: New York,2011; pp 1819−1823 (Detailed Operation Scheduling and Control forRenewable Energy Powered Microgrids, v29).(11) Mohammadi, M.; Hosseinian, S. H.; Gharehpetian, G. B. GA-based Optimal Sizing of Microgrid and DG Units Under Pool andHybrid Electricity Markets. Int. J. Electr. Power Energy Syst. 2012, 35(1), 83−92.(12) Costello, K. A Perspective on Fuel Diversity. The Electricity J.2005, 18 (4), 28−47.(13) Naraharisetti, P. K.; Karimi, I. A.; Anand, A.; Lee, D.-Y. A LinearDiversity ConstraintApplication to Scheduling in Microgrids. Energy2011, 36 (7), 4235−4243.(14) Pulselli, F. M. Global Warming Potential and the Net CarbonBalance. In Encyclopedia of Ecology, 1st ed.; Jorgensen, S. E., Fath, B.D., Eds.; Elsevier BV: Oxford, U.K., 2008; Vol. 3, pp 1741−1746.(15) Curran, M. A. Life Cycle Assessment. In Encyclopedia of Ecology,1st ed.; Jorgensen, S. E., Fath, B. D., Eds.; Elsevier BV: Oxford, U.K.,2008; Vol. 3, p 8.(16) Assamoi, B.; Lawryshyn, Y. The Environmental Comparison ofLandfilling vs. Incineration of MSW Accounting for Waste Diversion.Waste Manage. [Online early access]. DOI: 10.1016/j.was-man.2011.10.023. Published Online: Nov 17, 2011, ttp://www.sciencedirect.com/science/article/pii/S0956053X1100482X, accessedMar 14, 2012 (accepted manuscript, has not undergone finalcopyediting, typesetting, or proof review).(17) Grubb, M.; Butler, L.; Twomey, P. Diversity and Security in UKElectricity Generation: The Influence of Low-carbon Objectives.Energy Policy 2006, 34 (18), 4050−4062.(18) Lim, J.; Toh, E. Singapore Energy Statistics 2011. Research andStatistics Unit; Energy Market Authority: Singapore, 2011; p 14.(19) Brook, A.; Kendrick, D.; Meeraus, A. GAMS, a User’s Guide.ACM SIGNUM Newsletter 1988, 23 (3−4), 10−11.(20) Goh, T. N. Statistical Study of Solar Radiation Information in anEquatorial Region (Singapore). Sol. Energy 1979, 22 (2), 105−111.
Industrial & Engineering Chemistry Research Article
dx.doi.org/10.1021/ie3006897 | Ind. Eng. Chem. Res. 2013, 52, 142−151150
(21) Choi, E. C. C.; Tanurdjaja, A. Extreme Wind Studies inSingapore. An Area with Mixed Weather System. J. Wind Eng. Ind.Aerodyn. 2002, 90 (12−15), 1611−1630.(22) Parishwad, G. V.; Bhardwaj, R. K.; Nema, V. K. Effect of Rainfallon the Estimation of Monthly Mean Hourly Solar Radiation for India.Renewable Energy 1998, 13 (4), 505−521.(23) Walker, S. N.; Wade, J. E. Effects of Precipitation on Wind TurbinePerformance; NASA STI/Recon Technical Report; NASA: Wash-ington, DC, 1988.(24) Lora, E. E. S.; Palacio, J. C. E.; Rocha, M. H.; Reno, M. L. G.;Venturini, O. J.; Olmo, O. A. D. Issues to Consider, Existing Tools andConstraints in Biofuels Sustainability Assessments. Energy 2011, 36(4), 2097−2110.(25) Raugei, M.; Bargigli, S.; Ulgiati, S. A Multi-criteria Life CycleAssessment of Molten Carbonate Fuel Cells (MCFC)A Compar-ison to Natural Gas Turbines. Int. J. Hydrogen Energy 2005, 30 (2),123−130.(26) Kannan, R.; Leong, K. C.; Osman, R.; Ho, H. K.; Tso, C. P. GasFired Combined Cycle Plant in Singapore: Energy Use, GWP andCostA Life Cycle Approach. Energy Convers. Manage. 2005, 46 (13−14), 2145−2157.(27) Kannan, R.; Leong, K. C.; Osman, R.; Ho, H. K.; Tso, C. P. LifeCycle Assessment Study of Solar PV Systems: An Example of a2.7kWp Distributed Solar PV System in Singapore. Sol. Energy 2006,80 (5), 555−563.(28) Wagner, H. J.; Baack, C.; Eickelkamp, T.; Epe, A.; Lohmann, J.;Troy, S. Life Cycle Assessment of the Offshore Wind Farm AlphaVentus. Energy 2011, 36 (5), 2459−2464.(29) Tay, E. Singapore’s Carbon Dioxide Emissions Per Capita andCarbon Intensity. http://www.lowcarbonsg.com/2009/05/14/singapores-carbon-dioxide-emissions-per-capita-and-carbon-intensity/,accessed Feb 22, 2012.
Industrial & Engineering Chemistry Research Article
dx.doi.org/10.1021/ie3006897 | Ind. Eng. Chem. Res. 2013, 52, 142−151151