microfinance sector note - equirus...
TRANSCRIPT

August 16, 2016 Analyst: Anirvan [email protected] (+91-7069030858) Page 1 of 63Before reading this report, you must refer to the disclaimer on the last page.
Microfinance aims at catering to economically active, low income, self-employed women who lack access to organized sector credit. We take a contra-view to the market as we believe microfinance has limited growth opportunities with multiple risks of over-leveraging and pricing competition due to fast growth at the cost of due diligence and entry of new players. We believe the sector’s risk reward is unfavorable and we are cautious on companies on the fast track path to grow AUM at all costs. We prefer diversified businesses such as Equitas, but rich valuation leaves room for near term price correction. We initiate on Equitas Holdings and Ujjivan Financial Services with SHORT rating and Sep’17 TP of Rs. 142/share and Rs. 372/share respectively.
Brief background and industry snapshot:
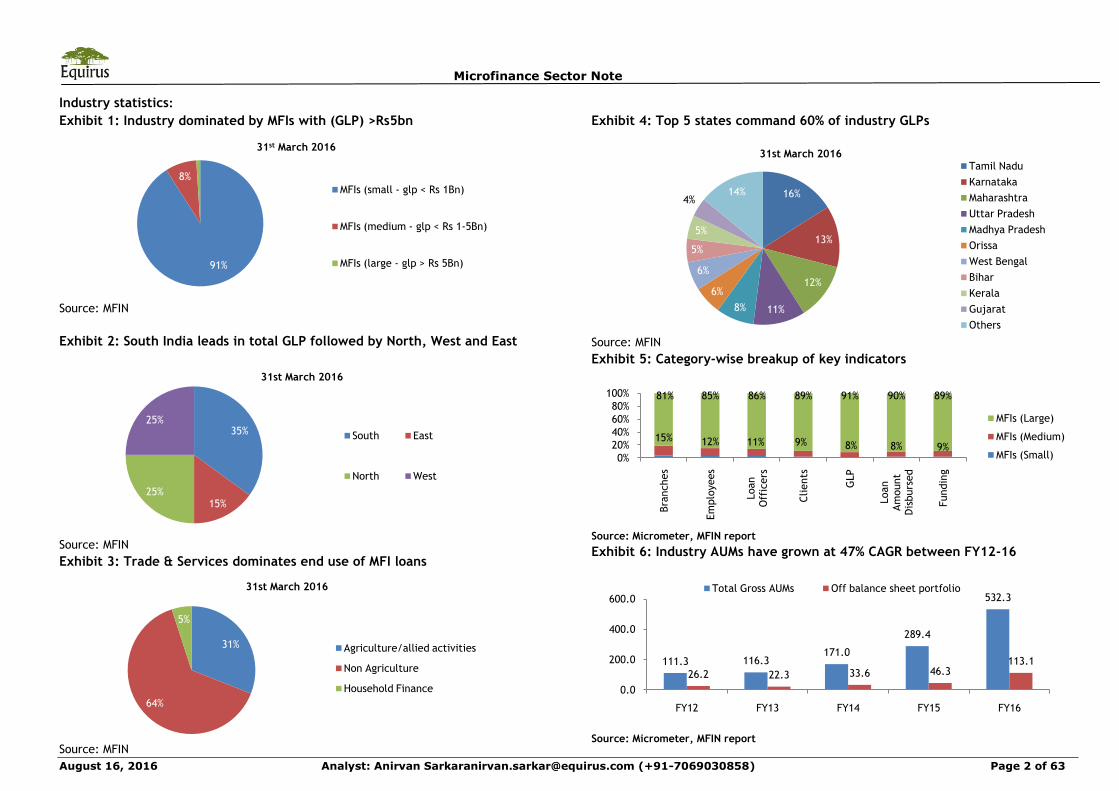
As of FY16, 56 registered NBFC-MFIs have total gross AUM of Rs. 532.3bn (47% CAGR between FY12-16) of which the top 10 MFIs command 72% share. South India leads in GLPs (35%), followed by North and West India (25% each) and East India (15%). Non-agricultural activities account for 64% of portfolio, agriculture and allied activities 31% and household finance 5%.
Transition from SHG to JLG, emergence of SFBs: The microfinance industry has evolved from operating as a mediator for SHG-bank linkages, to for-profit companies providing JLG based loans to economically active self-employed women. In 2015, 8 MFIs received small finance banking (SFB) license from RBI. They are Ujjivan Financial Services, Janalakshmi Financial Services, Equitas Holdings, Disha Microfin, ESAF Microfinance, RGVN Microfinance, Suryoday Microfinance, and Utkarsh Microfinance. SFBs are required to make the bank operational within 18 months of receiving the license and to list the bank separately within 3 years of going operational.
Our thesis:
Limited headroom for microfinance industry growth, fast track growth would require unreal increase in penetration: We take a contra-view to the market as we believe the addressable market for microfinance is much lower than what headline numbers suggest. Notwithstanding India’s large population of economically active poor, microfinance can address limited households (~120mn in FY16) with average ticket size growth of at most 10% yoy. Our calculations (exhibit 16) indicate that industry penetration has to increase from 25% in FY16 to 53% by FY21E to achieve 30% CAGR during this period. This is not possible without expansion in rural areas where economies of scale are difficult.
Risks include bulk defaults from reckless growth: While social collateral protects credit quality, the business bears inherent risks. Previous microfinance crises in India, in Krishna (FY06), Karnataka (FY09) and A.P. (FY10) were preceded by high AUM growth leading to bulk defaults. At present, MFIs are targeting super-normal growth backed by increased investor interest and fund flow. However, we believe super-normal growth at the bottom of the pyramid is bound to be followed by mass defaults and subsequent crises. Also, with
majority of customers being unbanked, the business operates largely on cash basis, with disbursements and collections in cash, leaving significant scope for frauds/thefts.
Fast track growth at the bottom of the pyramid from too many players has a cost!
Possible spread reduction due to supernormal growth will affect margins:Microfinance commands high interest rates due to high risk profile, and creditquality rests on social collateral and limited supply of credit. With too manyparticipants looking to grow quickly, customers will have more choice, andpricing competition can reduce spreads and margins for microfinance business.
Enhanced risk of overleveraging from banks entering microfinance: Whileexisting credit bureaus are regularly updated with borrowing data of customers(regulation stipulates microfinance customers can borrow upto Rs. 60K - recentlyincreased to Rs. 0.1mn - from at most 2 MFIs), the entry of banks inmicrofinance complicates credit data efficiency as bank borrowing data may notbe captured, leading to the risk of overleverage and credit defaults.
Controlled growth appetite and picking quality over quantity willdifferentiate winners and losers: With increased investor interest, MFIs havetargeted super-normal growth to attract funds at the cost of due diligence, atrend that has historically preceded the 3 microfinance crises in India. This willdifferentiate winners from losers in the medium to long term. A classic exampleof slow growth at the bottom of the pyramid is GRUH Finance, whose loan bookstands at Rs. 110bn after 30 years of operations. Newer companies growingultra-fast during favourable market conditions ignore the associated risks ofunsustainable performance, volatility in growth and change in customer creditbehaviour resulting from spurt in credit supply.
Due diligence, control and supervision key to success, larger players score: Microfinance addresses economically active poor forming the top layer of the bottom of the pyramid, not the bottom itself. Our channel checks indicate that credit behaviour has a regional influence. Cherry-picking the right socio-economic group in the right geographies is crucial to maintain asset quality.
Because of limited digitization, retaining strong control and supervision over operations is crucial in microfinance. This is where larger players with strong branch networks have an advantage over smaller players who are forced to operate with a broader radius of operations, reducing control over their domain.
SHORT on Equitas Holdings, SHORT on Ujjivan Financial: We prefer Equitas’s diversified business and their reducing dependence on microfinance but we believe their high valuation would lead to price correction and we are SHORT on the stock. We are cautious on Ujjivan’s portfolio concentration in microfinance and unproven track record of scaling up individual lending business, and we initiate with SHORT rating on the stock.
© 2016 Equirus All rights reserved
Microfinance Sector Note
Fast track growth at the bottom of the pyramid a huge risk, prefer MFIs diversifying businesses,
valuations at unfavorable risk-reward, Initiate with SHORT on Equitas and Ujjivan
Microfinance Sector Note
August 16, 2016 Analyst: Anirvan [email protected] (+91-7069030858) Page 2 of 63
Industry statistics:
Exhibit 1: Industry dominated by MFIs with (GLP) >Rs5bn
Source: MFIN
Exhibit 2: South India leads in total GLP followed by North, West and East
Source: MFIN
Exhibit 3: Trade & Services dominates end use of MFI loans
Source: MFIN
Exhibit 4: Top 5 states command 60% of industry GLPs
Source: MFIN
Exhibit 5: Category-wise breakup of key indicators
Source: Micrometer, MFIN report
Exhibit 6: Industry AUMs have grown at 47% CAGR between FY12-16
Source: Micrometer, MFIN report
91%
8%
1% 31st March 2016
MFIs (small - glp < Rs 1Bn)
MFIs (medium - glp < Rs 1-5Bn)
MFIs (large - glp > Rs 5Bn)
35%
15%25%
25%
31st March 2016
South East
North West
31%
64%
5%
31st March 2016
Agriculture/allied activities
Non Agriculture
Household Finance
16%
13%
12%
11%8%
6%
6%
5%
5%
4%14%
31st March 2016Tamil Nadu
Karnataka
Maharashtra
Uttar Pradesh
Madhya Pradesh
Orissa
West Bengal
Bihar
Kerala
Gujarat
Others
15% 12% 11% 9% 8% 8% 9%
81% 85% 86% 89% 91% 90% 89%
0%
20%
40%
60%
80%
100%
Bra
nches
Em
plo
yees
Loan
Off
icers
Clients
GLP
Loan
Am
ount
Dis
burs
ed
Fundin
g
MFIs (Large)
MFIs (Medium)
MFIs (Small)
111.3 116.3171.0
289.4
532.3
26.2 22.3 33.6 46.3113.1
0.0
200.0
400.0
600.0
FY12 FY13 FY14 FY15 FY16
Total Gross AUMs Off balance sheet portfolio
Microfinance Sector Note
August 16, 2016 Analyst: Anirvan [email protected] (+91-7069030858) Page 3 of 63
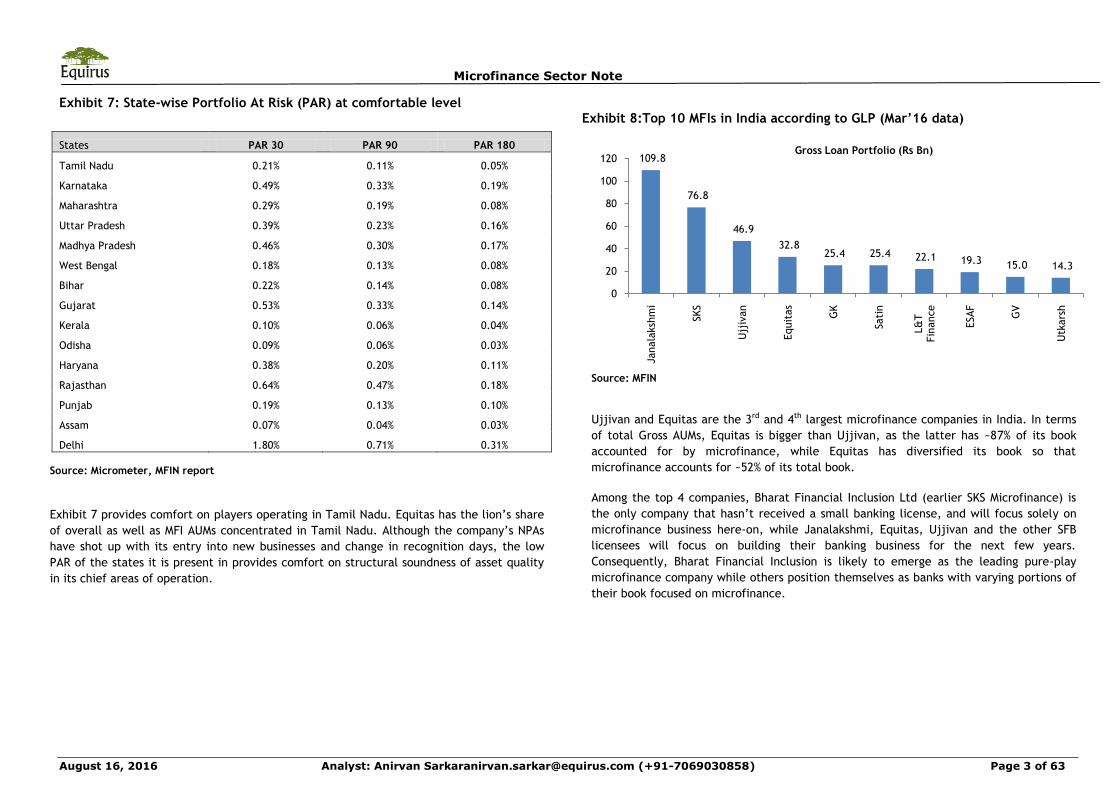
Exhibit 7: State-wise Portfolio At Risk (PAR) at comfortable level
States PAR 30 PAR 90 PAR 180
Tamil Nadu 0.21% 0.11% 0.05%
Karnataka 0.49% 0.33% 0.19%
Maharashtra 0.29% 0.19% 0.08%
Uttar Pradesh 0.39% 0.23% 0.16%
Madhya Pradesh 0.46% 0.30% 0.17%
West Bengal 0.18% 0.13% 0.08%
Bihar 0.22% 0.14% 0.08%
Gujarat 0.53% 0.33% 0.14%
Kerala 0.10% 0.06% 0.04%
Odisha 0.09% 0.06% 0.03%
Haryana 0.38% 0.20% 0.11%
Rajasthan 0.64% 0.47% 0.18%
Punjab 0.19% 0.13% 0.10%
Assam 0.07% 0.04% 0.03%
Delhi 1.80% 0.71% 0.31%
Source: Micrometer, MFIN report
Exhibit 7 provides comfort on players operating in Tamil Nadu. Equitas has the lion’s share
of overall as well as MFI AUMs concentrated in Tamil Nadu. Although the company’s NPAs
have shot up with its entry into new businesses and change in recognition days, the low
PAR of the states it is present in provides comfort on structural soundness of asset quality
in its chief areas of operation.
Exhibit 8:Top 10 MFIs in India according to GLP (Mar’16 data)
Source: MFIN
Ujjivan and Equitas are the 3rd and 4th largest microfinance companies in India. In terms
of total Gross AUMs, Equitas is bigger than Ujjivan, as the latter has ~87% of its book
accounted for by microfinance, while Equitas has diversified its book so that
microfinance accounts for ~52% of its total book.
Among the top 4 companies, Bharat Financial Inclusion Ltd (earlier SKS Microfinance) is
the only company that hasn’t received a small banking license, and will focus solely on
microfinance business here-on, while Janalakshmi, Equitas, Ujjivan and the other SFB
licensees will focus on building their banking business for the next few years.
Consequently, Bharat Financial Inclusion is likely to emerge as the leading pure-play
microfinance company while others position themselves as banks with varying portions of
their book focused on microfinance.
109.8
76.8
46.9
32.8 25.4 25.4 22.1 19.3 15.0 14.3
0
20
40
60
80
100
120
Janala
ksh
mi
SKS
Ujj
ivan
Equit
as
GK
Sati
n
L&
T
Fin
ance
ESAF
GV
Utk
ars
h
Gross Loan Portfolio (Rs Bn)

Microfinance Sector Note
August 16, 2016 Analyst: Anirvan [email protected] (+91-7069030858) Page 4 of 63
Exhibit 9: Evolution of industry key metrics in the last 4 years
FY12 FY13 FY14 FY15 FY16
Number of clients (mn) 14.8 13.4 16.5 22.6 32.5
Total loans disbursed (mn) NA 12.9 17.6 25.5 34.7
Total loan amount disbursed (Rsbn) NA 158.1 236.8 376.0 618.6
Number of employees ('000) 49.0 42.2 48.1 62.4 85.9
Number of loan officers ('000) 30.2 26.8 30.1 38.9 53.8
Gross AUM 111.8 116.4 171.0 289.4 53.2
Average loan outstanding per client (Rs '000) 7.5 8.7 10.4 12.8 16.4
Average loan disbursed per account NA 12.2 13.4 14.7 17.8
Average clients per branch 2,135 2,161 2,415 2,851 3,358
Average GLP per branch (Rsmn) 16.1 18.8 25 36.5 55.1
Average client per loan officer 491 501 549 582 603
Average GLP per loan officer (Rsmn) 3.7 4.3 5.7 7.4 9.9

Microfinance Sector Note
August 16, 2016 Analyst: Anirvan [email protected] (+91-7069030858) Page 5 of 63
Exhibit 10: State-wise key indicators for Microfinance industry
States MFI count GLP (Rsbn)
Loan amount
disbursed (Annual,
Rsbn)
Loan disbursed
(Annual, mn)
Average amount
disbursed per
account ('000)
Clients (lakhs) Branches Employees
Tamil Nadu 19 86.87 102.65 5.51 18.63 5.65 1,352 12,665
Karnataka 24 71.65 90 6.253 14.39 3.823 1,198 11,475
Maharashtra 32 63.29 79.42 4.416 17.98 3.711 1,174 10,224
Uttar Pradesh 19 56.45 67.58 3.176 21.28 3.127 988 8,717
Madhya Pradesh 27 40.84 49.73 2.571 19.34 2.805 984 7,494
Odisha 13 31.41 41.68 2.497 16.69 2.135 510 4,525
West Bengal 14 30.75 43.79 2.605 16.81 2.191 643 5,541
Bihar 21 29.21 39.2 2.199 17.83 1.931 629 5,087
Kerala 10 24.34 31.02 1.734 17.89 1.223 350 3,630
Gujarat 19 20.64 22.41 0.977 22.94 1.234 433 3,360
Rajasthan 14 12.59 16.2 0.835 19.40 0.754 217 1,990
Haryana 14 11.65 14.48 0.651 22.24 0.491 169 1,670
Punjab 10 9.88 13.42 0.645 20.81 0.562 128 1,199
Jharkhand 17 8.98 12.53 0.714 17.55 0.566 239 1,850
Chattisgarh 17 8.77 11.23 0.587 19.13 0.586 263 1,826
Assam 10 7.73 9.51 0.466 20.41 0.532 203 1,306
Uttarakhand 11 5.93 4 0.232 17.24 0.331 82 726
Delhi 8 5.82 6.17 0.222 27.79 0.556 41 1,370
Puducherry 10 1.93 2.29 0.114 20.09 0.122 18 176
Andhra Pradesh 5 0.78 2.13 0.129 16.51 0.115 361 2,135
Tripura 5 0.4 0.68 0.04 17.00 0.034 22 152
Microfinance Sector Note
August 16, 2016 Analyst: Anirvan [email protected] (+91-7069030858) Page 6 of 63
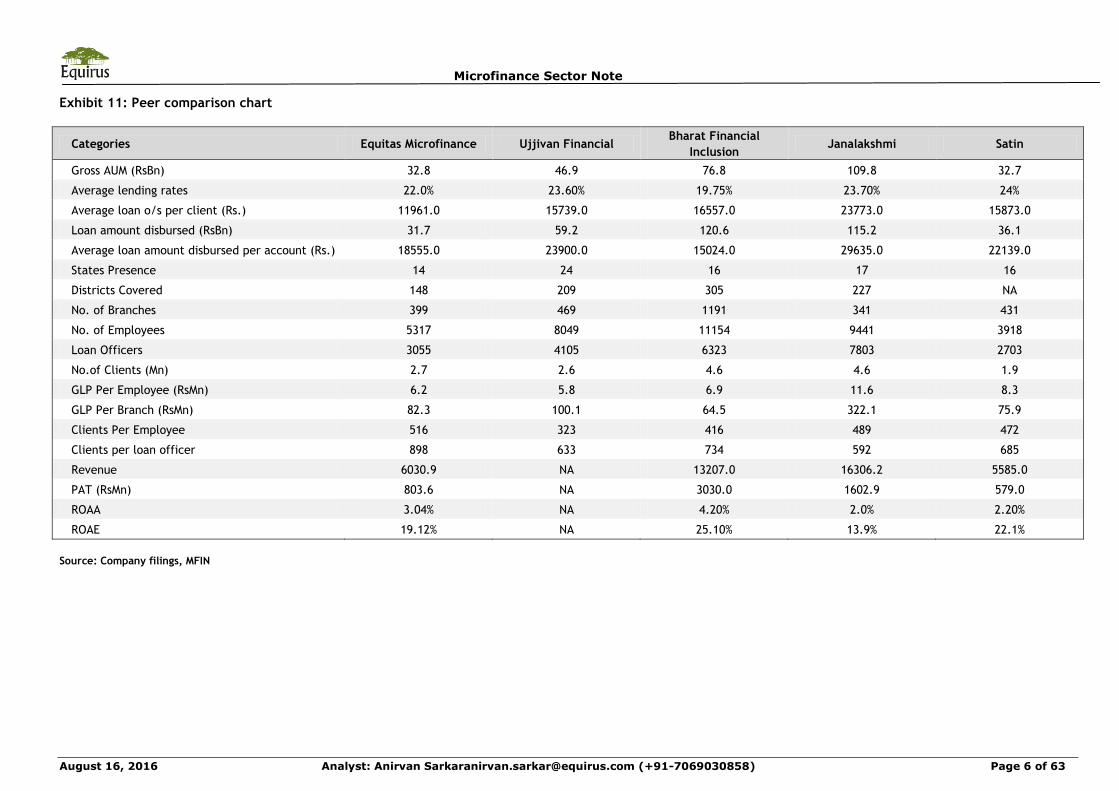
Exhibit 11: Peer comparison chart
Categories Equitas Microfinance Ujjivan FinancialBharat Financial
InclusionJanalakshmi Satin
Gross AUM (RsBn) 32.8 46.9 76.8 109.8 32.7
Average lending rates 22.0% 23.60% 19.75% 23.70% 24%
Average loan o/s per client (Rs.) 11961.0 15739.0 16557.0 23773.0 15873.0
Loan amount disbursed (RsBn) 31.7 59.2 120.6 115.2 36.1
Average loan amount disbursed per account (Rs.) 18555.0 23900.0 15024.0 29635.0 22139.0
States Presence 14 24 16 17 16
Districts Covered 148 209 305 227 NA
No. of Branches 399 469 1191 341 431
No. of Employees 5317 8049 11154 9441 3918
Loan Officers 3055 4105 6323 7803 2703
No.of Clients (Mn) 2.7 2.6 4.6 4.6 1.9
GLP Per Employee (RsMn) 6.2 5.8 6.9 11.6 8.3
GLP Per Branch (RsMn) 82.3 100.1 64.5 322.1 75.9
Clients Per Employee 516 323 416 489 472
Clients per loan officer 898 633 734 592 685
Revenue 6030.9 NA 13207.0 16306.2 5585.0
PAT (RsMn) 803.6 NA 3030.0 1602.9 579.0
ROAA 3.04% NA 4.20% 2.0% 2.20%
ROAE 19.12% NA 25.10% 13.9% 22.1%
Source: Company filings, MFIN
Microfinance Sector Note
August 16, 2016 Analyst: Anirvan [email protected] (+91-7069030858) Page 7 of 63
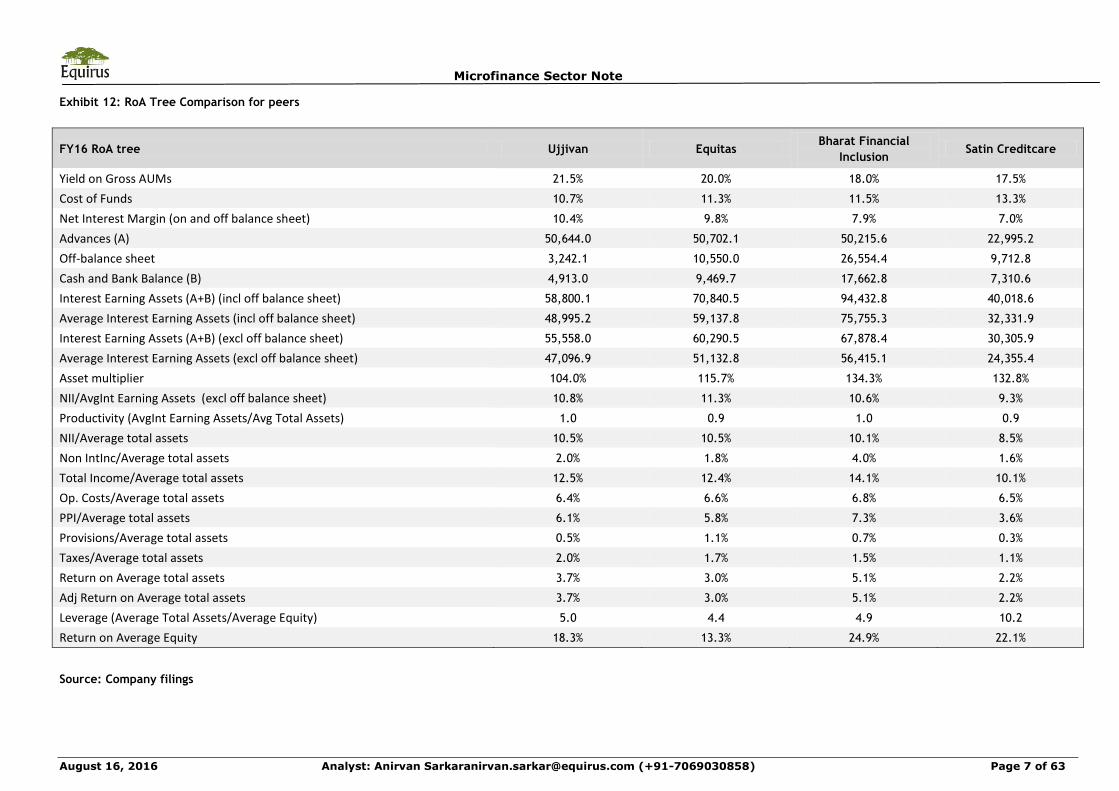
Exhibit 12: RoA Tree Comparison for peers
FY16 RoA tree Ujjivan EquitasBharat Financial
InclusionSatin Creditcare
Yield on Gross AUMs 21.5% 20.0% 18.0% 17.5%
Cost of Funds 10.7% 11.3% 11.5% 13.3%
Net Interest Margin (on and off balance sheet) 10.4% 9.8% 7.9% 7.0%
Advances (A) 50,644.0 50,702.1 50,215.6 22,995.2
Off-balance sheet 3,242.1 10,550.0 26,554.4 9,712.8
Cash and Bank Balance (B) 4,913.0 9,469.7 17,662.8 7,310.6
Interest Earning Assets (A+B) (incl off balance sheet) 58,800.1 70,840.5 94,432.8 40,018.6
Average Interest Earning Assets (incl off balance sheet) 48,995.2 59,137.8 75,755.3 32,331.9
Interest Earning Assets (A+B) (excl off balance sheet) 55,558.0 60,290.5 67,878.4 30,305.9
Average Interest Earning Assets (excl off balance sheet) 47,096.9 51,132.8 56,415.1 24,355.4
Asset multiplier 104.0% 115.7% 134.3% 132.8%
NII/AvgInt Earning Assets (excl off balance sheet) 10.8% 11.3% 10.6% 9.3%
Productivity (AvgInt Earning Assets/Avg Total Assets) 1.0 0.9 1.0 0.9
NII/Average total assets 10.5% 10.5% 10.1% 8.5%
Non IntInc/Average total assets 2.0% 1.8% 4.0% 1.6%
Total Income/Average total assets 12.5% 12.4% 14.1% 10.1%
Op. Costs/Average total assets 6.4% 6.6% 6.8% 6.5%
PPI/Average total assets 6.1% 5.8% 7.3% 3.6%
Provisions/Average total assets 0.5% 1.1% 0.7% 0.3%
Taxes/Average total assets 2.0% 1.7% 1.5% 1.1%
Return on Average total assets 3.7% 3.0% 5.1% 2.2%
Adj Return on Average total assets 3.7% 3.0% 5.1% 2.2%
Leverage (Average Total Assets/Average Equity) 5.0 4.4 4.9 10.2
Return on Average Equity 18.3% 13.3% 24.9% 22.1%
Source: Company filings

Microfinance Sector Note
August 16, 2016 Analyst: Anirvan [email protected] (+91-7069030858) Page 8 of 63
Ujjivan is the 4th largest microfinance company in India by total gross AUM,
and the 3rd largest by gross microfinance AUM, enjoys better geographical
spread
With a total Gross AUM of Rs. 53.9bn (microfinance AUM of Rs 46.9bn) as of Mar ‘16,
Ujjivan is the 4rd largest NBFC-MFI in India behind Bharat Financial Inclusion Ltd,
Janalakshmi Financial Services and Equitas Holdings. In terms of microfinance portfolio
gross AUM, Ujjivan ranks 3rd, as Equitas holdings has a smaller microfinance portfolio and
a larger individual lending portfolio.
While Equitas and Bharat Financial Inclusion have a larger branch network than Ujjivan,
the latter has a more diversified presence across more states and UTs compared to the
other 2. As of Mar’16, Equitas has 549 branches across 14 states/UTs, BFIL has 1,191
branches across 19 states and 329 districts, and Janalakshmi has 341 branches across 17
states. Compared to them, Ujjivan has 469 branches spread across 24 states and UTs.
While concentration risk is higher for the other companies, it does provide a strong
regional growth opportunity if they target the right areas of growth and execute well.
Bharat Financial Inclusion (BFIL) has higher RoA/RoE than Ujjivan, followed
by Equitas and Satin Creditcare
BFIL enjoys stronger other income profile than Ujjivan, Equitas and Satin, and hence
higher RoA/RoE (5.1%/24.9% for BFIL compared to 3.7%/18.3% for Ujjivan, 3.0%/13.3% for
Equitas and 2.2%/22.1% for Satin). Satin has extremely high leverage for an NBFC-MFI, at
10.2x, compared to 4.9x for each of Ujjivan and BFIL and 4.4x for Equitas. Although
higher expenses in the next few years will bring down the RoA for Ujjivan and Equitas,
they have room for leverage growth as they transform into a bank, so RoE decline will be
protected.
Ujjivan has stronger other income and total income profile and higher cost efficiency
compared to Equitas and Satin and thus enjoys higher RoA/RoE. Satin has one of the
lowest RoAs among NBFC-MFIs (2.2%) in the peer group, owing to high costs (6.5% of avg
assets) and needs to gain cost efficiency in order to ramp up its return ratios.
While both Equitas and Ujjivan have started offering fee income products (insurance), it
will take time to build up and this is not a primary focus area for either of the
companies. Any positive surprise on this would boost returns even higher.
Exhibit 13: Comparison of FY16 RoA/RoE/leverage across companies
Source: Company filings, Equirus Research
0%
5%
10%
15%
20%
25%
30%
Ujjivan Equitas Bharat Financial Inclusion
Satin Creditcare
RoA RoE

Microfinance Sector Note
August 16, 2016 Analyst: Anirvan [email protected] (+91-7069030858) Page 9 of 63
Exhibit 14: Competitive scorecard for Equitas and Ujjivan
Category Ujjivan Equitas
BusinessMicrofinance will reman core business with 60% of gross AUMs in
microfinance by FY22E
Rapidly diversifying product mix to reduce microfinance to 20% of book by
FY22E
Transition so farIndividual loan book has grown on a low base, no proven track record
of scaling up individual loan book without breaching healthy NPA levels
Proven track record - has increased individual lending to 48% of book in
1QFY17 from 23.5% in FY13
Individual product focus
Lower, within individual loans they are focusing on both housing and
MSE. Lower ticket unsecured loans forms bulk of housing book,
enhancing asset quality risk
Higher, within individual lending focus is on UCV and MSE, with housing at
10% of total individual book and will not be a focus area.
Credit costs outlook
Credit costs will build up due to buildup of individual loan book and
change in recognition days but will remain lower than Equitas in the
near term
Credit costs will build up and will remain higher due to bigger individual
loan book and change in recognition days
Opex outlookOpex will increase with investments in branch infrastructure,
technology and people, will remain lower than Equitas
Opex will increase and will be higher than Ujivan because of more
investment in liability expansion
Deposit scale up
Will be slower than that of Equitas. 280 out of 550 will be bank
branches by FY17E, with no mention of physically separate locations
for liability expansion
Will gain quicker traction in deposit momentum as 412 out of 550 will be
bank branches and each bank branch will have a physically separate
liability premise in a nearby, more visible location
Return ratios RoA will pick up after FY18E and stabilize at ~1.9% RoA wwill pick up after FY18E and stabilize at ~1.8%
Risk reward
Risks are not diversified, any cyclical correction in microfinance will
obliterate the loan book. High valuations assume seamless transition
and do not factor in transition pains or cyclical sector correction
Risks getting rapidly diversified, individual lending growing and
microfinance dependence diminishing rapidly. High valuations assume
seamless transition and do not factor in transition painsSource: Equirus Securities

Microfinance Sector Note
August 16, 2016 Analyst: Anirvan [email protected] (+91-7069030858) Page 10 of 63
Microfinance: The road ahead
Addressable microfinance market is less than what headline numbers reflect, limiting
growth opportunities for pureplay microfinance companies: While microfinance is a
great business to replace the moneylender and provide access to organized sector
financing for economically weaker sections, the actual market which microfinance can
address in an economically viable manner is quite limited and not reflected by total
rural population. We take a look to analyze the actual addressable market and what
penetration it would take to sustain the present growth rates.
Exhibit 15 shows income distribution in India as of 2015. From the different income
groups shown, the maximum targetable households for microfinance in India are the
middle and low income groups, i.e. a total of 164mn households. Since microfinance
targets economically active women only, not all of these households can be targeted,
which further reduces the targetable market size. We assume ~75% of these households
constitute the target market for microfinance, which comes to ~120mn households.
Exhibit 15: Income distribution in India
Classification Monthly income (Rs '000) No of households (in mn)
Rich 93 2
High income 30 53
Middle income 13 82
Low income 7.5 82
Poor 3.5 56
Total 275
Source: CMIE report
The FY16 average ticket size for microfinance in India was Rs. 17.8K. We estimate that
sustainable healthy ticket size growth can be up to 10% per annum, marginally above GDP
growth rate and inflation. As shown in exhibit 16, for microfinance industry gross AUMs
to grow at 30% CAGR for the next 5 years, industry penetration would have to go up
from 25% in FY16 to 53% in FY21E and 72% in FY23E. This is not feasible for the
industry, as it needs expansion into remote areas where economies of scale cannot be
achieved. This implies that the growth spurt witnessed in the last few years cannot be
sustained. For urban and semi-urban focused companies like Ujjivan, growth would be
an additional challenge as a large part of the targetable market is based in rural India.
Exhibit 16: Increase in penetration with growth in MFI AUMs
FY16 FY17E FY18E FY19E FY20E FY21E FY22E FY23E
Total addressable households (mn)
120 122 124 125 127 129 131 133
Household growth
1.5% 1.5% 1.5% 1.5% 1.5% 1.5% 1.5%
Average ticket (Rs '000)
18 20 22 24 26 29 32 35
Addressable market (Rsbn)
2,137 2,386 2,663 2,974 3,320 3,707 4,139 4,621
Present market (Rsbn)
532 692 900 1,170 1,520 1,977 2,569 3,340
yoy growth 30% 30% 30% 30% 30% 30% 30%
Market penetration
25% 29% 34% 39% 46% 53% 62% 72%
Source: CMIE, MFIN, Equirus Securities
Microfinance crises in the past have been preceded by periods of aggressive growth
causing NPA spikes: India’s past microfinance crises (Karnataka (FY09) and A.P (FY10))
were preceded by periods of aggressive AUM growth, leading to overleveraging and
subsequent building up of uncontrollable NPAs. Post the A.P. crises, MFI AUM growth was
muted till FY13 post which MFI AUMs have grown at a 66% CAGR between FY13-FY16
fueled by equity infusion by PE/VC funds, and with increased investor interest in the
industry as well as banks entering into microfinance lending, this will lead to
overleveraging which will cause asset quality crisis.
Convergence of domains across banks and NBFC-MFIs, emergence of more diversified
businesses and Universal Banks: While SFBs like Ujjivan, Equitas, Satin, ESAF etc are
ramping up their individual lending products in an attempt to diversify their businesses
and position themselves as banks, large private sector banks such as Indusind Bank and
YES Bank have focused on growing their microfinance portfolio (not as a core business) in
view of the attractive RoAs in this segment. This indicates that the financial sector in
India is witnessing a convergence of domains across banks and NBFCs. This especially
holds for retail focused banks and retail NBFCs, housing finance companies, NBFC-MFIs
etc. This, however, increases asset quality risk in microfinance due to possible
overleveraging by customers due to oversupply of credit and information inefficiency.
This also introduces risks to profitability from possible price competition in a crowded
space which offers more choice to customers.
Microfinance Sector Note
August 16, 2016 Analyst: Anirvan [email protected] (+91-7069030858) Page 11 of 63
Twin impact of corporate lending asset quality disaster with Government’s Financial
Inclusion initiatives will encourage more universal banks: The increased focus of the
government on financial inclusion and bringing small scale industries under organized
sector financing has timed itself with rising NPAs in corporate banking. This leads to 2
things a) more banks shifting focus from corporate to retail and b) more banks/FIs
diversifying their retail lending portfolio to reduce product concentration risk. This will
lead to more banks/FIs re-positioning themselves as Universal Banks to avoid failures due
to stress on any one particular consumer segment.
NBFC-MFI recipients of SFB licenses risk not being able to scale up banking business:
In the light of NBFC-MFIs being granted SFB licenses, it should be noted that we have no
historical precedence of conversion of an NBFC-MFI to a bank. There remains a risk that
they fail to scale up deposits to counter the drop in yields with reduced cost of funds, in
which case returns will drop substantially. While we have been conservative with our
assumptions, we will revisit our thesis post more clarity on their deposit strategy and
visible traction.
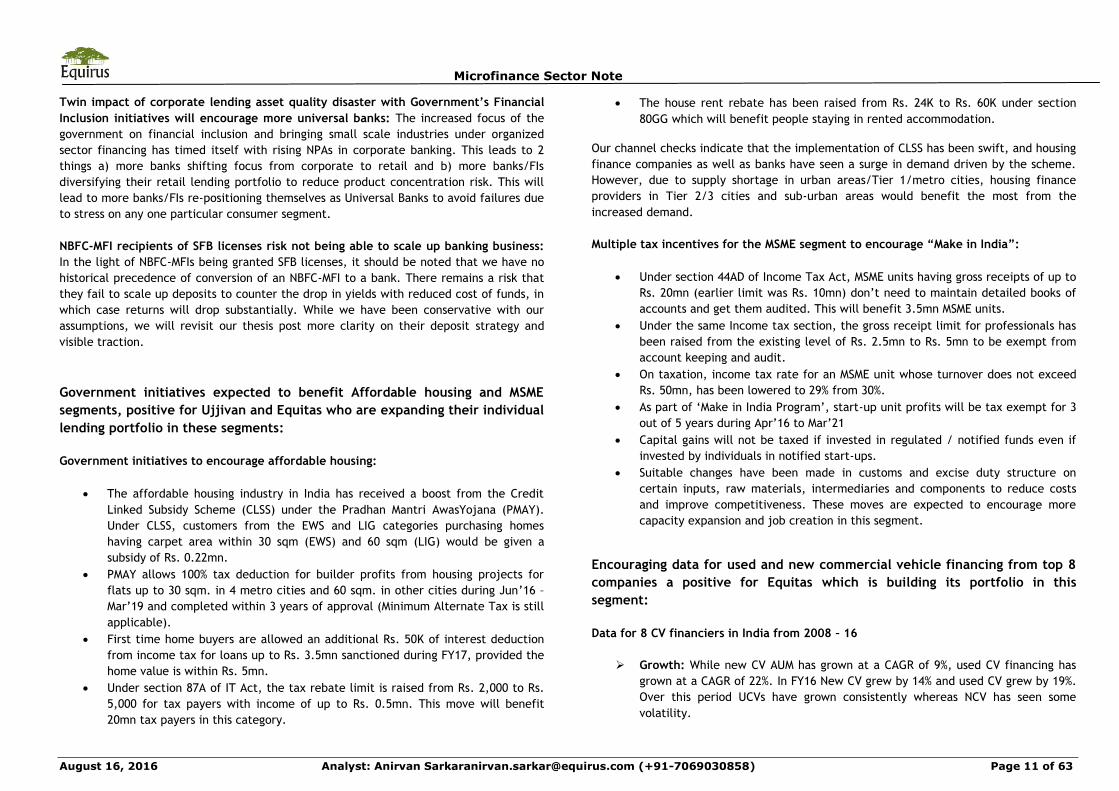
Government initiatives expected to benefit Affordable housing and MSME
segments, positive for Ujjivan and Equitas who are expanding their individual
lending portfolio in these segments:
Government initiatives to encourage affordable housing:
The affordable housing industry in India has received a boost from the Credit
Linked Subsidy Scheme (CLSS) under the Pradhan Mantri AwasYojana (PMAY).
Under CLSS, customers from the EWS and LIG categories purchasing homes
having carpet area within 30 sqm (EWS) and 60 sqm (LIG) would be given a
subsidy of Rs. 0.22mn.
PMAY allows 100% tax deduction for builder profits from housing projects for
flats up to 30 sqm. in 4 metro cities and 60 sqm. in other cities during Jun’16 –
Mar’19 and completed within 3 years of approval (Minimum Alternate Tax is still
applicable).
First time home buyers are allowed an additional Rs. 50K of interest deduction
from income tax for loans up to Rs. 3.5mn sanctioned during FY17, provided the
home value is within Rs. 5mn.
Under section 87A of IT Act, the tax rebate limit is raised from Rs. 2,000 to Rs.
5,000 for tax payers with income of up to Rs. 0.5mn. This move will benefit
20mn tax payers in this category.
The house rent rebate has been raised from Rs. 24K to Rs. 60K under section
80GG which will benefit people staying in rented accommodation.
Our channel checks indicate that the implementation of CLSS has been swift, and housing
finance companies as well as banks have seen a surge in demand driven by the scheme.
However, due to supply shortage in urban areas/Tier 1/metro cities, housing finance
providers in Tier 2/3 cities and sub-urban areas would benefit the most from the
increased demand.
Multiple tax incentives for the MSME segment to encourage “Make in India”:
Under section 44AD of Income Tax Act, MSME units having gross receipts of up to
Rs. 20mn (earlier limit was Rs. 10mn) don’t need to maintain detailed books of
accounts and get them audited. This will benefit 3.5mn MSME units.
Under the same Income tax section, the gross receipt limit for professionals has
been raised from the existing level of Rs. 2.5mn to Rs. 5mn to be exempt from
account keeping and audit.
On taxation, income tax rate for an MSME unit whose turnover does not exceed
Rs. 50mn, has been lowered to 29% from 30%.
As part of ‘Make in India Program’, start-up unit profits will be tax exempt for 3
out of 5 years during Apr’16 to Mar’21
Capital gains will not be taxed if invested in regulated / notified funds even if
invested by individuals in notified start-ups.
Suitable changes have been made in customs and excise duty structure on
certain inputs, raw materials, intermediaries and components to reduce costs
and improve competitiveness. These moves are expected to encourage more
capacity expansion and job creation in this segment.
Encouraging data for used and new commercial vehicle financing from top 8
companies a positive for Equitas which is building its portfolio in this
segment:
Data for 8 CV financiers in India from 2008 – 16
Growth: While new CV AUM has grown at a CAGR of 9%, used CV financing has
grown at a CAGR of 22%. In FY16 New CV grew by 14% and used CV grew by 19%.
Over this period UCVs have grown consistently whereas NCV has seen some
volatility.

Microfinance Sector Note
August 16, 2016 Analyst: Anirvan [email protected] (+91-7069030858) Page 12 of 63
Lending rate: Lending rate for new vehicles in FY15 and 1HFY16 stood at 11.3%
for MHCV and 13.5% for LCVs. For used vehicle lending rate has remained largely
unchanged at 15.4% for used MHCVs and 16.5% for used LCV’s.
LTV: LTV in used CV is 77% for both MHCV and LCV. Average tenure in used
MHCV and LCV segments is 31 months
Improvement in asset quality and recovery/upgradations in the CV segment:
The percentage of repossessed vehicles being released back to customers on
payment of dues has increased to 50-60% compared to 20-30% at peak stress
levels. Time taken to sell the vehicle after repossession has also come down to
15-45 days from 45-90 days earlier.
Delinquency level in used CV segment for 90+ dpd and 180+ dpd are at 6.7% and
2.3% in Mar’16 compared with 7.3% and 2.2% as on Mar’15.
Jharkhand, Bihar, Goa and Puducherry have been impacted by mining related
issues are performing weaker compared to other states. Maharashtra and MP are
also performing weak where financiers have good presence due to drought
situation. Delhi also seems to be performing weak.
Flow Rate analysis carried out in respect to 4,500 contracts that were more than
180 days overdue (as on Sept 30th, 2015) says that in 65% of cases either the
account has been fully resolved (11% of cases) or borrower has paid some
amount despite slipping by more than 6 EMIs in past. In 30% of cases the
contract continues to be in 180 dpd bucket as the overdue amount has not yet
come down; however, borrower is making 1 full EMI payment regularly. In 20% of
cases, the borrower has paid some amount but not paid full EMI amount.
Average loss incurred by financiers at the time of vehicle sale in MHCV segment
has increased by 48% in FY14. However, loss levels have come down to 35% in
1HFY16. Loss level continues to remain high in LCV segment at average loss of
46% in 1HFY16.
Microfinance Sector Note
August 16, 2016 Analyst: Anirvan [email protected] (+91-7069030858) Page 13 of 63
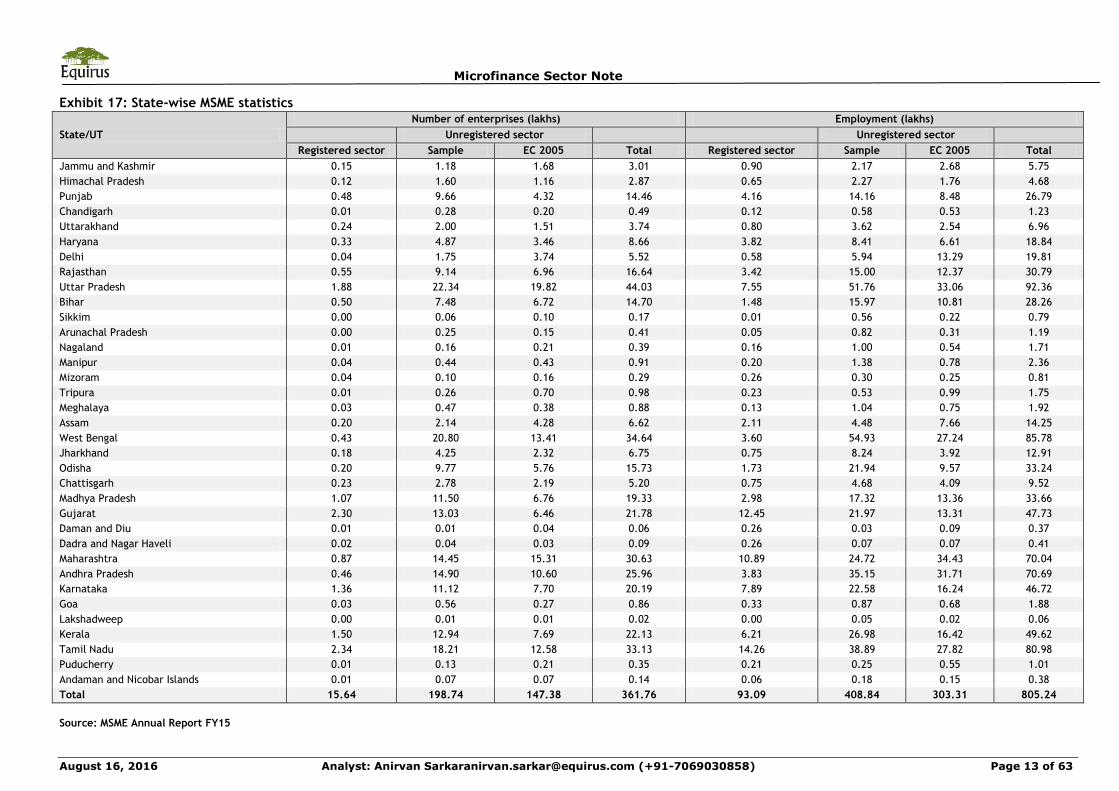
Exhibit 17: State-wise MSME statistics
State/UT
Number of enterprises (lakhs) Employment (lakhs)
Unregistered sector Unregistered sector
Registered sector Sample EC 2005 Total Registered sector Sample EC 2005 Total
Jammu and Kashmir 0.15 1.18 1.68 3.01 0.90 2.17 2.68 5.75
Himachal Pradesh 0.12 1.60 1.16 2.87 0.65 2.27 1.76 4.68
Punjab 0.48 9.66 4.32 14.46 4.16 14.16 8.48 26.79
Chandigarh 0.01 0.28 0.20 0.49 0.12 0.58 0.53 1.23
Uttarakhand 0.24 2.00 1.51 3.74 0.80 3.62 2.54 6.96
Haryana 0.33 4.87 3.46 8.66 3.82 8.41 6.61 18.84
Delhi 0.04 1.75 3.74 5.52 0.58 5.94 13.29 19.81
Rajasthan 0.55 9.14 6.96 16.64 3.42 15.00 12.37 30.79
Uttar Pradesh 1.88 22.34 19.82 44.03 7.55 51.76 33.06 92.36
Bihar 0.50 7.48 6.72 14.70 1.48 15.97 10.81 28.26
Sikkim 0.00 0.06 0.10 0.17 0.01 0.56 0.22 0.79
Arunachal Pradesh 0.00 0.25 0.15 0.41 0.05 0.82 0.31 1.19
Nagaland 0.01 0.16 0.21 0.39 0.16 1.00 0.54 1.71
Manipur 0.04 0.44 0.43 0.91 0.20 1.38 0.78 2.36
Mizoram 0.04 0.10 0.16 0.29 0.26 0.30 0.25 0.81
Tripura 0.01 0.26 0.70 0.98 0.23 0.53 0.99 1.75
Meghalaya 0.03 0.47 0.38 0.88 0.13 1.04 0.75 1.92
Assam 0.20 2.14 4.28 6.62 2.11 4.48 7.66 14.25
West Bengal 0.43 20.80 13.41 34.64 3.60 54.93 27.24 85.78
Jharkhand 0.18 4.25 2.32 6.75 0.75 8.24 3.92 12.91
Odisha 0.20 9.77 5.76 15.73 1.73 21.94 9.57 33.24
Chattisgarh 0.23 2.78 2.19 5.20 0.75 4.68 4.09 9.52
Madhya Pradesh 1.07 11.50 6.76 19.33 2.98 17.32 13.36 33.66
Gujarat 2.30 13.03 6.46 21.78 12.45 21.97 13.31 47.73
Daman and Diu 0.01 0.01 0.04 0.06 0.26 0.03 0.09 0.37
Dadra and Nagar Haveli 0.02 0.04 0.03 0.09 0.26 0.07 0.07 0.41
Maharashtra 0.87 14.45 15.31 30.63 10.89 24.72 34.43 70.04
Andhra Pradesh 0.46 14.90 10.60 25.96 3.83 35.15 31.71 70.69
Karnataka 1.36 11.12 7.70 20.19 7.89 22.58 16.24 46.72
Goa 0.03 0.56 0.27 0.86 0.33 0.87 0.68 1.88
Lakshadweep 0.00 0.01 0.01 0.02 0.00 0.05 0.02 0.06
Kerala 1.50 12.94 7.69 22.13 6.21 26.98 16.42 49.62
Tamil Nadu 2.34 18.21 12.58 33.13 14.26 38.89 27.82 80.98
Puducherry 0.01 0.13 0.21 0.35 0.21 0.25 0.55 1.01
Andaman and Nicobar Islands 0.01 0.07 0.07 0.14 0.06 0.18 0.15 0.38
Total 15.64 198.74 147.38 361.76 93.09 408.84 303.31 805.24
Source: MSME Annual Report FY15

August 16, 2016 Analyst: Anirvan Sarkar [email protected] (+91-79-61909526) Page 14 of 63 Before reading this report, you must refer to the disclaimer on the last page.
Equitas Holdings Absolute : SHORT
Relative : UNDERWEIGHT
Initiating Note Regular Coverage 20% downside in 14 months
Perfectly positioned to leverage quality growth across verticals, rich valuations leave room for near term correction, initiate with SHORT
Financials
© 2016 Equirus All rights reserved
Rating Information
Price (Rs) 176
Target Price (Rs) 142
Target Date 30-Sep-17
Target Set On 16-Aug-16
Implied yrs of growth (ERE) 20
Fair Value (ERE) 141
Fair Value (DDM) NA
Ind Benchmark BANKEX
Model Portfolio Position NA
Stock Information
Market Cap (Rs mn) 59,109.8
Free Float (%) 100%
52 Wk H/L (Rs) 206.25/134.15
Avg Daily Volume (1yr) 63,88,685.1
Avg Daily Value (1yr) 1,061.7
Equity Cap (Rs Mn) 3,353.7
Face Value (Rs) 10.0
Bloomberg Code EQUITAS IN
Ownership Recent 3M 12M %
Promoters 0.00% 0.0% 0.0%
DII 29.3% 0.0% 0.0%
FII 48.1% 0.0% 0.0%
Public 22.6% 0.0% 0.0%
Price % 1M% 3M% 12M%
Absolute -0.5% 17.3% NA
Vs Industry -0.9% 2.8% NA
UJJIVAN 11.5% 74.7% NA
BHARATFIN 2.6% 25.2% 45.3%
Consolidated Quarterly EPS forecast
Rs/Share 1Q 2Q 3Q 4Q
EPS (16A) - - - -
EPS (17E) 1.9 1.6 1.7 1.8
Equitas Holdings is the 4th largest Indian microfinance company with ~8% market share
and microfinance Gross AUM of Rs. 32.8bn as of 4QFY16. We expect them to benefit
from sustainable quality growth in both group and individual lending portfolios to
attain 30% CAGR in total Gross AUM from FY16 to FY22E on the back of regional
presence across flourishing markets in India. However, the stock is trading at 2.7x
FY17E P/ABV and we believe the robust growth prospects, sturdy asset quality and
solid strategy are priced in the CMP, but near-term uncertainties on bank transition
and profitability are not. We believe the stock will correct in the near-term and
initiate coverage with a SHORT rating, arriving at ERoE based Sep’17 TP of Rs. 142
implying 20 years of growth with average RoE of 15.5% and cost of equity of 14.4%.
Branch concentration in the right states will support robust growth in next 5 years:
Equitas has ~83% of its 572 branches in states like TN, Mah, Kar, Raj and MP which
contribute to 88% of Gross AUMs. There is a flourishing market in microfinance,
affordable housing, used CV financing and MSME financing in these states. They are
converting 412 existing branches to bank branches, which will help them scale up
deposit base and maintain return ratios during the transition phase. We expect
Equitas’ Gross/Net AUMs to reach Rs. 300.4bn/284.7bn by FY22E and their deposit
base to reach 40% of total loans and advances, i.e. Rs. 113.9bn by FY22E.
Asset quality will remain sound backed by stringent credit quality monitoring and
controlled ticket size: Equitas’ GNPA/NNPA ratios are 1.61%/1.14% for the total
portfolio. While the microfinance business enjoys low GNPA/NNPA of 0.23%/0.05%, the
UCV/MSE and housing finance portfolios have GNPA/NNPA of 2.94%/2.19% and
5.54%/4.90% respectively. During transition to bank, NPAs are expected to grow due to
reduction of recognition days from 150 to 90. Given low Portfolio At Risk (PAR) for the
industry in Equitas’s states of presence, low ticket size and stringent risk management
practices, asset quality should improve after initial bumps.
Reducing dependence on microfinance a positive, proven track record in scaling up
MSE/UCV financing business ensures transition into more diversified asset base:
While Equitas has steadily reduced dependence on microfinance, their individual loan
book growth will be boosted by multiple government initiatives, such as CLSS under
PMAY, lack of organized players in UCV financing and enhanced MSME tax incentives.
Key Risks relate to slower scale up in deposit base and regulatory pressure in
microfinance: The fixed deposit market is hyper competitive and scale up of deposits
to 40% of total loans could face challenges. Regulatory clampdown remains a risk for
microfinance companies.
Consolidated Financials
Rs. Mn YE Mar FY16A FY17E FY18E FY19E
Interest Income 10,368 14,013 17,791 21,352
Interest Expense 4,360 5,413 6,949 8,634
Net Interest Inc. 5,777 8,599 10,842 12,718
Other Income 1,012 1,675 2,457 3,101
Operating Exp 3,597 5,753 8,644 9,966
Provisions 591 889 1,657 2,181
PAT 1,671 2,346 1,948 2,387
Loan and Advances 50,702 68,544 84,194 1,07,670
Deposits 0 6,854 12,629 26,917
Net Worth 13,414 22,754 24,703 27,090
NIM 11.40% 9.87% 9.47% 8.93%
Credit Cost 1.39% 1.49% 2.17% 2.27%
Rs Per Share FY16A FY17E FY18E FY19E
EPS 6.2 7.0 5.8 7.1
Adjusted EPS 6.2 7.0 5.8 7.1
Book Value 50 68 74 81
Adjusted BVPS 48 65 68 74
DPS 0 0 0 0
P/B (x) 3.5x 2.6x 2.4x 2.2x
Adj P/B (x) 3.7x 2.7x 2.6x 2.4x
Adj ROE (%) 13.31% 12.97% 8.21% 9.22%
RoA (%) 3.05% 2.71% 1.59% 1.53%

Equitas Holdings Absolute – SHORT Relative – UNDERWEIGHT 20% downside in 14Months
August 16, 2016 Analyst: Anirvan Sarkar [email protected] (+91-79-61909526) Page 15 of 63
Company Snapshot
How we differ from Consensus
- Equirus Consensus % Diff Comment
EPS FY17E 7.0 5.8 22%
We are conservative in our assumptions
on loan growth and provisioning
expenses and hence our estimate for
FY18 PAT is 23% lower than that of the
street
FY18E 5.8 7.5 -23%
NII +
Other
Inc
FY17E 10,275 9,924 4%
FY18E 13,299 13,744 -3%
PAT FY17E 2,346 1,937 21%
FY18E 1,948 2,520 -23%
Our Key Investment arguments: Equitas will experience super-normal growth in the near
to medium term and we like their low dependence on microfinance, low ticket sizes and
robust risk management; High valuations are a concern and we initiate coverage with a
SHORT rating expecting near term correction in the stock price.
Key Assumptions 2016A 2017E 2018E 2019E 2020E
Yields on Advances (%) 20.0% 19.0% 18.3% 17.8% 17.5%
Yield on Investments (%) 12.3% 5.0% 7.2% 7.2% 7.2%
Cost of Funds (%) 11.3% 9.9% 9.9% 9.4% 9.1%
NIMs (%) 11.4% 9.9% 9.5% 8.9% 8.6%
NII Growth (%) 47.3% 48.8% 26.1% 17.3% 29.7%
PPI Growth (%) 49.2% 41.6% 2.9% 25.7% 41.1%
Credit costs (%) 1.4% 1.5% 2.2% 2.3% 2.2%
PAT Growth (%) 56.8% 40.4% -17.0% 22.5% 45.7%
Advances Growth (%) 46.3% 35.2% 22.8% 27.9% 43.2%
Deposit Growth (%) NA NA 84.2% 113.1% 71.8%
Key Risks: Delay in building deposit base, unfavorable political intervention.
Key Triggers: Execution and credit risk monitoring, positive news on scaling up advances
and deposits base
Sensitivity to Key Variables % Change % Impact on EPS
Net Interest Income 10 % 36.7 %
Provisioning Costs 10 % -3.8 %
ERoE Valuations & Assumptions
Rf Ke Term. Growth RoE in Terminal Yr
7.2% 14.4% 5.0% 18.2%
FY16A FY17-21E FY22-26E FY27-36E
NII Growth 47.3% 20.7% - -
NIM (%) 11.3% 10.0% - -
Adj EPS 6.2 9.1 26.8 101.9
Adj RoE (%) 13.3% 11.6% 16.6% 18.0%
-
Years of strong growth 1 5 10 20
Valuation as on date (Rs) 60 55 81 146
Valuation as of Mar’17 65 60 88 159
Our Sep’17 target price of Rs. 142 is based on ERoE valuation assuming 20 years of
growth, implying FY17E P/ABV multiple of 2.2x with an average RoE of 15.5%.
Company Description:
Incorporated in 2005, Equitas Financial Services Ltd (Equitas) is a Tamil Nadu
headquartered microfinance company which has been granted a small banking license by
RBI in 2015. The company offers Microfinance loans, housing loans, Used Commercial
Vehicle (UCV) loans and MSE loans. As on June 30th, 2016, the firm has a distribution
network of 572 branches across 14 states/UTs.
Comparable valuationMkt Cap Rs.
Mn.
Price
Target
Target
Date
EPS P/E BPS P/B RoE Div Yield
Company Reco. CMP FY16A FY17E FY18E FY16A FY17E FY18E FY16A FY17E FY16A FY17E FY18E FY16A FY17E
EQUITAS SHORT 176 59,110 142 Sep '17 6.2 7.0 5.8 28.5 25.2 30.4 47.9 2.7 13.3% 13.0% 8.2% 0.0% 0.5%
UJJIVAN SHORT 451 53,291 372 Sep '17 20.1 20.2 18.1 22.4 22.3 24.9 118.8 2.6 18.9% 13.8% 9.9% 0.1% 0.2%
BHAFIN NA 784 99,884 NA NA 23.9 44.5 50.9 33.0 17.6 15.4 108.6 4.9 24.9% 34.1% 25.9% 0.0% 0.4%

Equitas Holdings Absolute – SHORT Relative – UNDERWEIGHT 20% downside in 14Months
August 16, 2016 Analyst: Anirvan Sarkar [email protected] (+91-79-61909526) Page 16 of 63
Investment Rationale
AUM growth to be helped by strategic concentration in high growth markets in Microfinance, MSE, UCV and affordable housing, conversion into bank branches will help build deposit momentum:
Equitas enjoys a large branch network concentrated in relatively fewer states. As of
Jun’16, the company had 572 branches across 12 states, 1 UT and Delhi. As of 4QFY16,
83% of their branches were concentrated in the top 5 states of TN, Karnataka,
Maharashtra, Rajasthan and M.P. and they contribute to 88% of total gross AUMs (refer
Exhibit 1).
Exhibit 1: Branch concentration coincides with AUM concentration
Source: Company Filings
Equitas has scaled up their individual lending portfolio which stands at ~48% of total gross
AUMs as of 1QFY17 compared to 23.5% in 4QFY13. The company aims to further reduce
microfinance to 30% of their gross AUMs by FY20E.
Within individual lending portfolio, UCV financing (52%) and MSE financing (40%)
contribute to 92% while housing finance constitutes 8% of individual book gross AUMs and
4% of total gross AUMs. Equitas’ primary focus is to grow its UCV and MSE segments to the
bulk of its total gross AUMs while housing finance will remain a smaller part of the total
portfolio. We estimate that by FY22E, the total gross AUMs will consist of 20% in MFI
loans, 75% in UCV and MSE, and 5% in housing finance.
Equitas has received approval from RBI to convert 412 of its branches to bank branches,
which should help deposit building momentum and help them maintain NIM and
profitability. However, scaling up deposits is a gradual process and we estimate that
Equitas will fund 40% of their loan book with deposits by FY22E.
1. Unambitious target for microfinance growth to be easily met due to
impressive Overlap with large Microfinance markets:
As of 31st March 2016, the top 5 states in India (by Microfinance Gross Loan Portfolio
(GLP)) accounted for 60% of total microfinance GLP in India. From exhibit 2, we see that
Equitas Microfinance has 87% of its MF AUMs concentrated in these 5 states, of which 61%
of is in Tamil Nadu, the largest Microfinance market in India. This strong overlap in focus
areas with the overall industry should help them achieve their targeted growth in their
MF portfolio.
Exhibit 2: Comparison of microfinance AUM distribution across states for Equitas vs. industry
States Percentage of total GLP Percentage of Equitas' GLP
Tamil Nadu 16% 61%
Karnataka 13% 7%
Maharashtra 12% 13%
Uttar Pradesh 11% 0%
Madhya Pradesh 8% 6%
Orissa 6% 0%
West Bengal 6% 0%
Bihar 5% 0%
Kerala 5% 0%
Gujarat 4% 0%
Others 14% 13%Source: Company Filings
We estimate that Equitas’ microfinance gross AUM will grow at 11% CAGR from FY16 –
FY22E to Rs. 60.1bn, in-line with the company’s target of gradually lowering the
microfinance share of the total book by diversifying into UCV, MSE and housing finance.
40.4%
17.3%
8.6%
8.4%
7.8%
6.9%
2.9%7.7%
Tamil Nadu Maharashtra Karnataka
Rajasthan MP Gujarat
Chhattisgarh Others
56.9%
14.8%
7.7%
3.9%
4.7%
4.1%
1.5%
6.4%
Branch concentration AUM concentration

Equitas Holdings Absolute – SHORT Relative – UNDERWEIGHT 20% downside in 14Months
August 16, 2016 Analyst: Anirvan Sarkar [email protected] (+91-79-61909526) Page 17 of 63
Given their strong presence in microfinance hubs in India, this growth is an easily
achievable target.
Exhibit 3: Projected growth in Equitas’ Microfinance Gross AUMs
Source: Company, Equirus Research
2. MSE financing to be boosted by credit growth in the sector, branchand AUM concentration in MSE hubs and multiple tax initiatives byGOI towards “Make in India”
a) Concentrated branch network in MSE hubs in India, proven track record in
scaling up MSE financing provides comfort on ability to grow:
As shown in Exhibit 4, Equitas has 52% of its total MSE AUMs concentrated in the
top 5 states with the largest number of MSMEs. Tamil Nadu, the strongest hub of
Equitas is home to a flourishing MSME sector as the state ranks 3rd in terms of
number of enterprises as well as employment. Tamil Nadu ranks 2nd in terms of
total fixed assets of MSME sector, as shown in Exhibit 22 in annexure, the first
position being held by Gujarat where Equitas has an extensive network as well.
Equitas has already demonstrated its ability to scale up its MSE lending book as
MSE AUMs form 19% of total gross AUMs.
Exhibit 4: Equitas branch network and MSE financing book distribution in top states by number of enterprises
% of total MSME
enterprises
Equitas
branchesEquitas MSE financing AUM %
Uttar Pradesh 12% 0 0%
West Bengal 10% 0 0%
Tamil Nadu 9% 231 33%
Maharashtra 8% 96 19%
Andhra
Pradesh 7% 9 0%
Kerala 6% 0 0%
Gujarat 6% 39 6%
Karnataka 6% 50 11%
Madhya
Pradesh 5% 43 5%
Total 70% 468 74%
Source: MSME AR 2015, company filings
21,440.0
32,830.036,396.9 38,823.3
43,676.250,955.6
56,475.860,090.3
0
10,000
20,000
30,000
40,000
50,000
60,000
70,000
FY15A FY16A FY17E FY18E FY19E FY20E FY21E FY22E
Microfinance Gross AUM (Rs mn)

Equitas Holdings Absolute – SHORT Relative – UNDERWEIGHT 20% downside in 14Months
August 16, 2016 Analyst: Anirvan Sarkar [email protected] (+91-79-61909526) Page 18 of 63
b) Multiple tax incentives for the MSME segment to encourage “Make in India”:
Under section 44AD of Income Tax Act, MSMEs having gross receipts of up to Rs.
20mn (earlier limit was Rs. 10mn) don’t need to maintain detailed books of
accounts and get them audited. This will benefit 3.5mn MSMEs.
Under the same Income tax section, the gross receipt limit for professionals has
been raised from the existing level of Rs. 2.5mn to Rs. 5mn to be exempt from
account keeping and audit.
On taxation, income tax rate for MSMEs whose turnover does not exceed Rs.
50mn, has been lowered to 29% from 30%.
As part of ‘Make in India Program’, start-up unit profits will be tax exempt for 3
out of 5 years during Apr’16 to Mar’21.
Capital gains will not be taxed if invested in regulated / notified funds even if
invested by individuals in notified start-ups.
Suitable changes have been made in customs and excise duty structure on
certain inputs, raw materials, intermediaries and components to reduce costs
and improve competitiveness. These moves are expected to encourage more
capacity expansion and job creation in this segment.
These incentives are expected to boost MSME growth in the country and will enhance financing needs, creating more opportunities for Equitas.
c) Bank credit growth points to healthy growth in MSE financing: Bank credit to
MSE segment has grown much more compared to medium and large enterprises
(Exhibit 5), reflecting that number of enterprises in this segment has grown and
hence the market opportunity for financiers is more for the micro and small
enterprises compared to medium.
We expect Equitas to grow its MSE AUMs at a 41% CAGR between FY17 and FY22E to reach
Rs. 98.1bn in gross MSE AUMs by FY22E
Exhibit 5: Growth in Bank credit to MSME sub-segments
Rs million Mar'08 Mar'09 Mar'10 Mar'11 Mar'12 Mar'13 Mar'14 Mar'15
Micro & Small enterprises
1,327 1,690 2,064 2,102 2,367 2,843 3,482 3,800
yoy growth NA 27% 22% 2% 13% 20% 22% 9%
Medium enterprises 1,108 1,222 1,326 1,165 1,248 1,247 1,241 1,245
yoy growth NA 10% 9% -12% 7% 0% -1% 0%
Total 2,435 2,912 3,390 3,267 3,614 4,091 4,723 5,046
Source: RBI
Exhibit 6: Projected growth in Equitas’s MSE gross AUMs
Source: Equirus Research, company filings
17,610.723,246.1
31,171.0
48,077.2
68,861.4
98,127.5
0.0
20,000.0
40,000.0
60,000.0
80,000.0
1,00,000.0
1,20,000.0
FY17E FY18E FY19E FY20E FY21E FY22E
MSE gross AUMs (Rs mn)

Equitas Holdings Absolute – SHORT Relative – UNDERWEIGHT 20% downside in 14Months
August 16, 2016 Analyst: Anirvan Sarkar [email protected] (+91-79-61909526) Page 19 of 63
3. Used commercial vehicles has a huge potential market dominated by
informal financiers, UCV financing at 25% of total gross AUMs
provides comfort on ability to scale up business:
Market dominated by informal financiers provides easy growth for Equitas,
proven track record in UCV financing growth provides comfort on ability to
grow AUMs: The used commercial vehicle (UCV) market in India is dominated by
the unorganized sector which dominates 55% of the market, with the only
organized sector participation coming from Shriram City Union Finance, TATA
OK, Tata Motors Assured and Eicher Sure. This leaves a vast opportunity for the
organized sector. Equitas has grown its UCV financing gross AUMs to Rs. 16.15bn
(25% of total gross AUMs) in 1QFY17. Their extensive presence in Tamil Nadu will
help them since the only significant local competition is from Shriram City Union
Finance, and informal financiers provide an easy way of growing market share.
The entry barrier in this segment is high, with dealer network establishment
being the prime criteria for gaining business traction, so we expect healthy
growth by taking market share from informal financiers.
UCV financing growth has been more consistent compared to new CV
financing: Data from 8 CV financiers from 2008 – 2016 shows that while new CV
AUM has grown at a CAGR of 9%, used CV financing has grown at a CAGR of 22%.
In FY16 New CV grew by 14% and Used CV grew by 19%. Even for the period
under consideration, UCVs have grown consistently whereas NCVs have seen
some volatility.
Moreover their recent initiative, Equitas Technologies Pvt. Ltd. provides freight
facilitation by connecting transport service providers to customers. This should
help them pick up traction in financing transporters and should further help UCV
portfolio growth. We expect Equitas to grow its UCV financing gross AUMs at a
41% CAGR between FY17E and FY22E to Rs. 127.3bn in FY22E
Exhibit 7: Expected Growth in UCV portfolio AUMs
Source: Equirus Research, company filings
22,844.430,154.6
40,434.6
62,365.2
89,326.2
1,27,289.9
0.0
20,000.0
40,000.0
60,000.0
80,000.0
1,00,000.0
1,20,000.0
1,40,000.0
FY17E FY18E FY19E FY20E FY21E FY22E
UCV gross AUMs (Rs mn)

Equitas Holdings Absolute – SHORT Relative – UNDERWEIGHT 20% downside in 14Months
August 16, 2016 Analyst: Anirvan Sarkar [email protected] (+91-79-61909526) Page 20 of 63
4. Credit Linked Subsidy Scheme (CLSS) will drive affordable housinggrowth, extensive network in states with projects in progress willhelp housing book grow:
a) CLSS implementation boosting affordable housing growth, Equitas well-placed
to tap into the growth: Our channel checks indicate that the implementation of
CLSS under PMAY has been swift, and housing finance companies as well as
banks have seen a surge in demand driven by the scheme. While housing is not a
core part of their portfolio and Equitas will continue to focus more on other
products, their housing finance business stands to benefit from this housing
boom.
b) Strong presence in states with in-progress affordable housing projectsprovides first mover advantage:
As shown in Exhibits 8 and 9, Equitas enjoys a good branch network in the top 10
states where affordable housing in partnership (AHP) under PMAY has taken off,
as well as the states where projects under Beneficiary Led Construction Scheme
(BLCS) have started. The strategic positioning places them in a sweet spot to
cater to increased housing finance demand in these states. Moreover, they have
15 branches in A.P. and Telengana, states with 35%/47% share in project
cost/number of projects in affordable housing in partnership. Larger MFIs other
than Bharat Financial have very limited or no presence in these 2 states, which
provides them no competition from the new MFI entrants looking to grow in
affordable housing. We estimate they will grow housing finance gross AUMs at a
35% CAGR between FY16-FY22E to Rs. 15bn in FY22E (~5% of total gross AUMs).
Exhibit 8: State-wise progress of affordable housing under AHP (Affordable Housing in Partnership)
Financial Progress Physical progress
StateTotal
projectsProject cost
Central Assistance
involved
Central assistance
released
Dwelling units
(EWS)
Under
progress
Completed
DUs
Yet to start
DUs
Equitas
branches
Maharashtra 15 102.0 13.8 0.0 91,946 0 0 91,946 95
Andhra Pradesh 78 67.1 18.0 3.3 120,106 0 0 120,106 9
Telengana 144 48.8 12.1 4.0 80,481 0 0 80,481 6
Madhya Pradesh 31 32.4 5.2 2.1 34,740 0 0 34,740 43
Gujarat 32 25.8 5.5 2.2 36,757 12,250 823 23,684 38
Chattisgarh 11 19.1 1.9 0.8 12,670 2,792 718 9,160 16
Rajasthan 23 13.8 1.8 0.4 12,307 3,766 0 8,541 46
Tamil Nadu 21 9.2 1.7 0.2 11,556 4,448 0 7,108 222
Karnataka 21 8.9 2.5 0.0 16,522 0 0 16,522 47
Odisha 4 3.8 0.8 0.3 5,548 0 0 5,548 0
Uttarakhand 2 1.5 0.1 0.0 464 0 0 464 1
Total in India 382 332 63 13 423,097 23,256 1,541 398,300 523
Source: Ministry of Housing and Urban Poverty Alleviation

Equitas Holdings Absolute – SHORT Relative – UNDERWEIGHT 20% downside in 14Months
August 16, 2016 Analyst: Anirvan Sarkar [email protected] (+91-79-61909526) Page 21 of 63
Exhibit 9: State-wise progress of affordable housing under BLCS
Financial Progress Physical progress
StateTotal
projectsProject cost
Central Assistance
involved
Central assistance
released
Houses
involved
Under
progress
Completed
Houses
Yet to start
Houses
Equitas
branches
Maharashtra 2 3.3 1.1 0.0 7,399 0.0 0.0 7,399 95
Andhra Pradesh 32 38.7 11.0 0.0 73,041 0.0 0.0 73,041 9
Bihar 85 12.5 4.5 1.8 30,216 0.0 0.0 30,216 0
Madhya Pradesh 12 4.1 1.1 0.4 7,297 0.0 0.0 7,297 43
Mizoram 8 2.1 1.5 0.1 10,286 0.0 0.0 10,286 0
Himachal
Pradesh17 1.0 0.3 0.1 1,914 0.0 0.0 1,914 0
J&K 4 0.2 0.1 0.0 683 0.0 0.0 683 0
Jharkhand 38 7.3 3.0 1.2 20,239 0.0 0.0 20,239 0
Tamil Nadu 185 6.9 4.0 1.2 26,978 9,637 104 17,237 222
Kerala 14 2.6 1.3 0.0 9,299 0.0 0.0 9,299 0
Uttarakhand 19 0.8 0.3 0.1 2,293 0.0 0.0 2,293 1
West Bengal 108 30.3 11.2 0.9 74,880 6,888.0 0.0 67,992 0
Total in India 524 110 40 6 264,525 16,525 104 247,896 370
Source: Ministry of Housing and Urban Poverty Alleviation

Equitas Holdings Absolute – SHORT Relative – UNDERWEIGHT 20% downside in 14Months
August 16, 2016 Analyst: Anirvan Sarkar [email protected] (+91-79-61909526) Page 22 of 63
Exhibit 10: Projected growth in Equitas’s Housing Gross AUMs
Source: Equirus Research, company filings
Exhibit 11: Gross AUM split – Individual lending will grow to 70% of total AUM by FY20E and 80% by FY22E
Source: Equirus Research, company filings
1,800.0 2,460.04,044.1 4,852.9
6,066.1
8,492.6
11,295.2
15,022.6
0
5,000
10,000
15,000
20,000
FY15A FY16A FY17E FY18E FY19E FY20E FY21E FY22E
Housing gross AUM (Rs mn)
45% 40% 36% 30% 25% 20%
28.2% 32.8% 35%36.7% 39.5% 42.4%
21.8% 25.3% 27.0% 28.3% 30.5% 32.7%
5% 2% 2% 5% 5% 5%
0%
20%
40%
60%
80%
100%
FY17E FY18E FY19E FY20E FY21E FY22E
Microfinance UCV MSE Housing

Equitas Holdings Absolute – SHORT Relative – UNDERWEIGHT 20% downside in 14Months
August 16, 2016 Analyst: Anirvan Sarkar [email protected] (+91-79-61909526) Page 23 of 63
Asset quality will remain robust backed by stringent credit
quality monitoring and low microfinance ticket size, continuing
reduction in microfinance exposure and low dependence on
housing adds further comfort:
1. Housing portfolio NPAs are high but bulky exposures are limited, will remain
a miniscule portion of overall loan portfolio: Equitas’ housing finance portfolio
GNPA/NNPA stand at 3.89%/3.16% as of 1QFY17. Although this is a relatively high
number, half of the NPAs are contributed by 10-12 accounts of Rs. 5-10mn each.
Moreover, housing is not a core part of their strategy and hence housing finance
will remain a small part of their portfolio (FY22E ~5% of total gross AUMs).
2. Microfinance portfolio NPAs remain low, ticket sizes are among the lowest in
the industry, steadily reducing exposure to microfinance guards against
cyclical corrections: Within microfinance portfolio Equitas has maintained
excellent credit quality with 0.23%/0.05% GNPA/NNPA ratios in 1QFY17.
Although consolidated NPAs have increased in the last few quarters,
microfinance NPAs have remained steady at healthy levels (exhibit 12). At Rs.
21,974, Equitas has the one of the lowest average ticket size in microfinance
industry, and they don’t intend to increase microfinance ticket size significantly
above this level, which provides comfort on microfinance asset quality.
Moreover, as the company is on track to reduce microfinance exposure to 20% of
gross AUMs by FY22E, any cyclical corrections in the microfinance industry will
guard Equitas against NPAs spiking up.
3. UCV financing NPAs will stay in control, industry data shows encouraging
trends in asset quality improvement:
Data from 8 CV financiers shows that in FY16:
The percentage of repossessed vehicles being released back to customers on
payment of dues has increased to 50-60% compared to 20-30% at peak stress
levels.
Time taken to sell the vehicle after repossession has also come down to 15-45
days from 45-90 days earlier.
Delinquency level in used CV segment for 90+ dpd and 180+ dpd are at 6.7% and
2.3% on Mar’16 compared with 7.3% and 2.2% as on Mar’15.
Flow Rate analysis carried out in respect to 4,500 contracts that were more than
180 days overdue (as on Sept 30th, 2015) says that in 65% of cases either the
account has been fully resolved (11% of cases) or borrower has paid some
amount despite slipping by more than 6 EMIs in past. In 30% of cases the
contract continues to be in 180 dpd bucket as the overdue amount has not yet
come down; however, borrower is making 1 full EMI payment regularly. In 20% of
cases, the borrower has paid some amount but not paid full EMI amount.
Average loss incurred by financiers at the time of vehicle sale in MHCV segment
has increased by 48% in FY14. However, loss levels have come down to 35% in
1HFY16. Loss level continues to remain high in LCV segment at average loss of
46% in 1HFY16.
4. UCV NPA levels have increased largely due to change in recognition days,
underlying asset quality has shown improvement: Equitas’s UCV GNPA/NNPA
are at 4.06%/2.94% in 1QFY17 (exhibit 12). Between 4QFY15 and 1QFY17, NPAs
have increased qoq only in 1QFY16 and 1QFY17, on change in recognition days
from 180 days to 150 days respectively. In the other quarters, both GNPA and
NNPA have steadily declined, reflecting underlying improvement in asset
quality.
5. Strong systems, processes and due diligence guards against asset quality
deterioration even as NPAs build up further, real time updates guard against
cash frauds: Going ahead, Equitas’s NPAs are expected to build up further as
their UCV/MSE book shifts from 150 day recognition to a 120 day policy and then
to a 90 day recognition policy on conversion to a bank. This has already shown
signs of improvement, as the loss given default (LGD) in UCVs have reduced to
42%-43% in FY16 from 55% in FY15. The company provides incentives to loan
officers based on number of customers acquired and not on ticket sizes, which
reduces the propensity to aggressively mis-sell loans without necessary due
diligence. Equitas also very efficient collection mechanism involving individual
customer passbooks and sms updates that provides almost real-time updates,
guarding against cash frauds.
Equitas Holdings Absolute – SHORT Relative – UNDERWEIGHT 20% downside in 14Months
August 16, 2016 Analyst: Anirvan Sarkar [email protected] (+91-79-61909526) Page 24 of 63
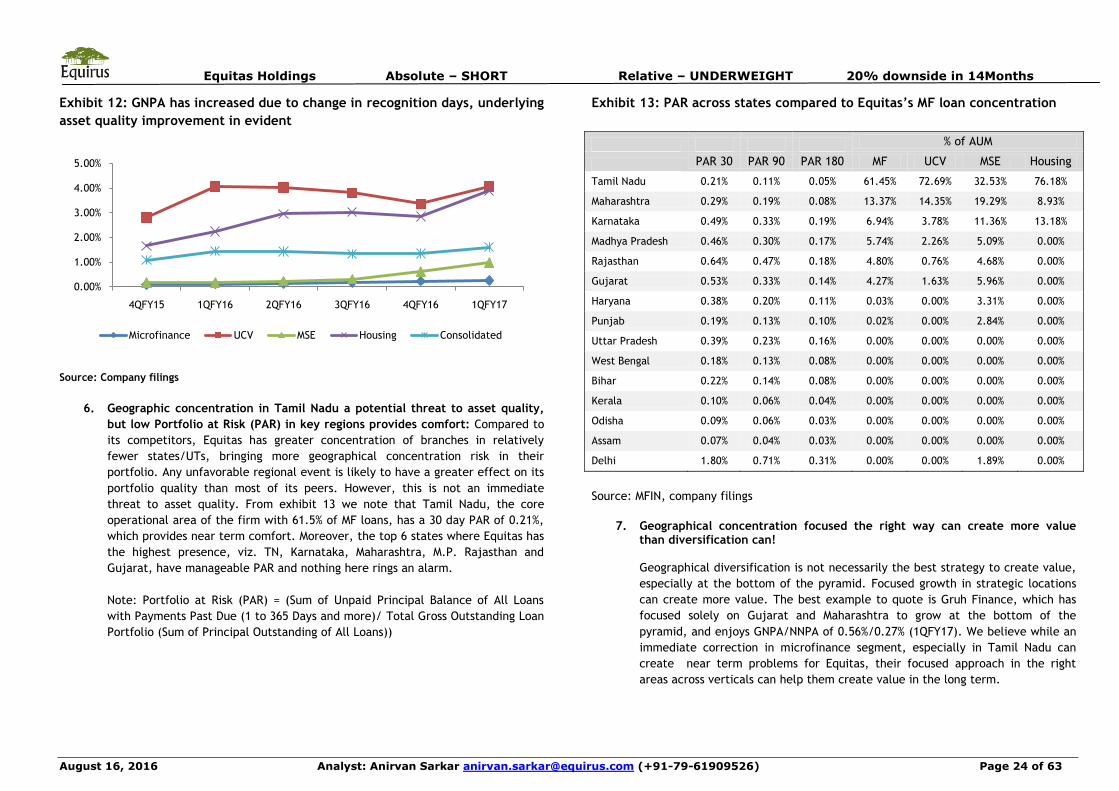
Exhibit 12: GNPA has increased due to change in recognition days, underlying
asset quality improvement in evident
Source: Company filings
6. Geographic concentration in Tamil Nadu a potential threat to asset quality,
but low Portfolio at Risk (PAR) in key regions provides comfort: Compared to
its competitors, Equitas has greater concentration of branches in relatively
fewer states/UTs, bringing more geographical concentration risk in their
portfolio. Any unfavorable regional event is likely to have a greater effect on its
portfolio quality than most of its peers. However, this is not an immediate
threat to asset quality. From exhibit 13 we note that Tamil Nadu, the core
operational area of the firm with 61.5% of MF loans, has a 30 day PAR of 0.21%,
which provides near term comfort. Moreover, the top 6 states where Equitas has
the highest presence, viz. TN, Karnataka, Maharashtra, M.P. Rajasthan and
Gujarat, have manageable PAR and nothing here rings an alarm.
Note: Portfolio at Risk (PAR) = (Sum of Unpaid Principal Balance of All Loans
with Payments Past Due (1 to 365 Days and more)/ Total Gross Outstanding Loan
Portfolio (Sum of Principal Outstanding of All Loans))
Exhibit 13: PAR across states compared to Equitas’s MF loan concentration
% of AUM
PAR 30 PAR 90 PAR 180 MF UCV MSE Housing
Tamil Nadu 0.21% 0.11% 0.05% 61.45% 72.69% 32.53% 76.18%
Maharashtra 0.29% 0.19% 0.08% 13.37% 14.35% 19.29% 8.93%
Karnataka 0.49% 0.33% 0.19% 6.94% 3.78% 11.36% 13.18%
Madhya Pradesh 0.46% 0.30% 0.17% 5.74% 2.26% 5.09% 0.00%
Rajasthan 0.64% 0.47% 0.18% 4.80% 0.76% 4.68% 0.00%
Gujarat 0.53% 0.33% 0.14% 4.27% 1.63% 5.96% 0.00%
Haryana 0.38% 0.20% 0.11% 0.03% 0.00% 3.31% 0.00%
Punjab 0.19% 0.13% 0.10% 0.02% 0.00% 2.84% 0.00%
Uttar Pradesh 0.39% 0.23% 0.16% 0.00% 0.00% 0.00% 0.00%
West Bengal 0.18% 0.13% 0.08% 0.00% 0.00% 0.00% 0.00%
Bihar 0.22% 0.14% 0.08% 0.00% 0.00% 0.00% 0.00%
Kerala 0.10% 0.06% 0.04% 0.00% 0.00% 0.00% 0.00%
Odisha 0.09% 0.06% 0.03% 0.00% 0.00% 0.00% 0.00%
Assam 0.07% 0.04% 0.03% 0.00% 0.00% 0.00% 0.00%
Delhi 1.80% 0.71% 0.31% 0.00% 0.00% 1.89% 0.00%
Source: MFIN, company filings
7. Geographical concentration focused the right way can create more valuethan diversification can!
Geographical diversification is not necessarily the best strategy to create value,
especially at the bottom of the pyramid. Focused growth in strategic locations
can create more value. The best example to quote is Gruh Finance, which has
focused solely on Gujarat and Maharashtra to grow at the bottom of the
pyramid, and enjoys GNPA/NNPA of 0.56%/0.27% (1QFY17). We believe while an
immediate correction in microfinance segment, especially in Tamil Nadu can
create near term problems for Equitas, their focused approach in the right
areas across verticals can help them create value in the long term.
0.00%
1.00%
2.00%
3.00%
4.00%
5.00%
4QFY15 1QFY16 2QFY16 3QFY16 4QFY16 1QFY17
Microfinance UCV MSE Housing Consolidated

Equitas Holdings Absolute – SHORT Relative – UNDERWEIGHT 20% downside in 14Months
August 16, 2016 Analyst: Anirvan Sarkar [email protected] (+91-79-61909526) Page 25 of 63
Impact on margins due to transition to SFB will be limited; refinancing opportunities will help better asset liability management
Equitas is one of the 8 microfinance companies which were granted small banking
licenses by RBI in 2015. They aim to be operational by the 1QCY17, and RBI guidelines
mandate them to list the SFB separately within 3 years of commencement of operations.
Once Equitas transforms into a bank, they would be required to comply with SLR/CRR
guidelines by RBI, which are 21.25%/4% post the 9th August 2016 monetary policy
announcement. Their yields are expected to decline owing to lower yields on mandatory
regulatory assets. The company intends to reduce securitization going ahead.
1. Deposit traction will be quick with physical separation between asset and
liability divisions of 412 bank branches: Equitas has received RBI approval for
412 bank branches, which will mean 412 of their 572 branches will be converted
into bank branches, with a separate liability division in a nearby and more
visible location. This strategy will help gain quick traction on gathering deposits.
2. Drop in NIM will be limited even with cautious assumption on deposit
momentum and factoring in drop in yield on AUMs: Equitas’ deposit building
strategy is to garner a part of target deposit base from existing customers, and
raise wholesale deposits to fund the remaining. Post that, they intend to
refinance wholesale deposits with cheaper small ticket retail term deposits and
CASA which will bring the cost of funds further down.
We remain cautious on our assumptions about the pace of building deposits and
assume that 40% of loans and advances can be funded by deposits by FY22E. We
also remain conservative on cost of deposits and assume that cost of deposits
will be ~7.5% in FY22E, to account for the risk that CASA buildup will take time.
While the company has no intent of lowering its lending rates, we still factor in
a 220bps drop in yield on AUMs over the next 3 years to account for
diversification of the portfolio and entry into secured lending, and arrive at
FY18E/FY19E NIMs of 9.5%/8.9% (including off balance sheet) and we estimate
NIMs will drop to 7.9% by FY22E.
3. Moreover, they have significant scope of refinancing from NABARD, SIDBI and
MUDRA, from whom they receive financing at present; however as a bank they
would be provided longer funding tenures which should help asset liability
mismatch problems.

Equitas Holdings Absolute – SHORT Relative – UNDERWEIGHT 20% downside in 14Months
August 16, 2016 Analyst: Anirvan Sarkar [email protected] (+91-79-61909526) Page 26 of 63
Rise in expenses will peak out in FY18; impact on RoA/RoE will
be limited
In FY16 Equitas reported a CI ratio of 53%. CI ratio is expected to increase in the next few
years due to investments in opening branches, hiring manpower, technology expenses
and channel costs. The company plans to convert 412 branches into banking branches
with separate, more visible liability locations for liability expansion by Mar’17.
In view of the elevated costs in the next few years, combined with a reduction in yields
and margins on conversion to a bank as well as elevated credit costs, we expect the
company’s RoA to decline. We estimate RoA will drop to 2.7%/1.6%/1.6% in
FY17E/FY18E/FY19E before picking up in FY20E and stabilizing at ~1.9% levels in FY22E.
However, at present the bank has a leverage of ~4.4x and the bank has room for increase
in leverage, which should limit drop in RoE. We estimate RoE will reach
12.2%/15.6%/18.1% in FY20E/FY21E/FY22E.
Exhibit 14: Costs will peak out in FY18 post which benefits of scale will reflect
Source: Company filings, Equirus estimates
Exhibit 15: RoA will decline going ahead but higher leverage will prop up RoE
Source: Company, Equirus Securities
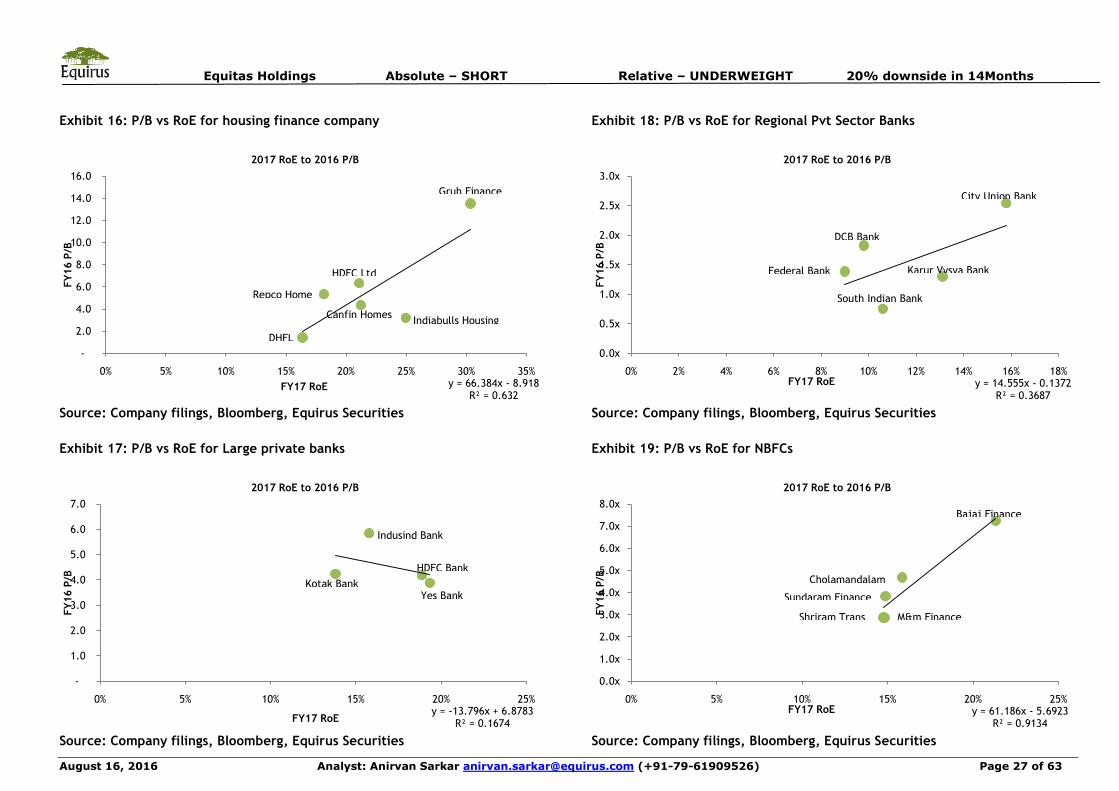
Valuation: At present Equitas is trading at Rs. 176, i.e. at 3.7x FY16A P/ABV. Although
we believe in the strong fundamentals of the company, the present valuation is high and
prices in a seamless bank transition and limited drop in NIM/profitability. The near term
uncertainties of execution and profitability are not factored in the present valuation. In
view of the valuations of new generation private sector banks, old generation private
sector banks, retail NBFCs and microfinance companies (Exhibits 16 through 20), and the
expected drop in profitability in FY17E/FY18E, we believe Equitas needs to prove its
execution on transition in order to be awarded comparable multiples, and should get a
discount to factor transition risks. We arrive at ERoE based Sep’17 TP of Rs. 142 assuming
20 years of growth with average RoE of 15.5% and cost of equity of 14.4%, implying FY17E
P/ABV of 2.2x. 0.0%
10.0%
20.0%
30.0%
40.0%
50.0%
60.0%
70.0%
FY15A FY16A FY17E FY18E FY19E FY20E FY21E FY22E
Cost to income
0.0%
5.0%
10.0%
15.0%
20.0%
FY15A FY16A FY17E FY18E FY19E FY20E FY21E FY22E
RoA RoE
Equitas Holdings Absolute – SHORT Relative – UNDERWEIGHT 20% downside in 14Months
August 16, 2016 Analyst: Anirvan Sarkar [email protected] (+91-79-61909526) Page 27 of 63
Exhibit 16: P/B vs RoE for housing finance company
Source: Company filings, Bloomberg, Equirus Securities
Exhibit 17: P/B vs RoE for Large private banks
Source: Company filings, Bloomberg, Equirus Securities
Exhibit 18: P/B vs RoE for Regional Pvt Sector Banks
Source: Company filings, Bloomberg, Equirus Securities
Exhibit 19: P/B vs RoE for NBFCs
Source: Company filings, Bloomberg, Equirus Securities
y = 66.384x - 8.918R² = 0.632
-
2.0
4.0
6.0
8.0
10.0
12.0
14.0
16.0
0% 5% 10% 15% 20% 25% 30% 35%
FY
16 P
/B
FY17 RoE
2017 RoE to 2016 P/B
y = -13.796x + 6.8783R² = 0.1674
-
1.0
2.0
3.0
4.0
5.0
6.0
7.0
0% 5% 10% 15% 20% 25%
FY
16 P
/B
FY17 RoE
2017 RoE to 2016 P/B
y = 14.555x - 0.1372R² = 0.3687
0.0x
0.5x
1.0x
1.5x
2.0x
2.5x
3.0x
0% 2% 4% 6% 8% 10% 12% 14% 16% 18%
FY
16 P
/B
FY17 RoE
2017 RoE to 2016 P/B
y = 61.186x - 5.6923R² = 0.9134
0.0x
1.0x
2.0x
3.0x
4.0x
5.0x
6.0x
7.0x
8.0x
0% 5% 10% 15% 20% 25%
FY
16 P
/B
FY17 RoE
2017 RoE to 2016 P/B
Gruh Finance
Indiabulls Housing
DHFL
Repco Home
HDFC Ltd
Canfin Homes
Indusind Bank
Kotak BankYes Bank
HDFC Bank
City Union Bank
Federal Bank
South Indian Bank
Karur Vysya Bank
Bajaj Finance
Sundaram Finance
Cholamandalam
M&m FinanceShriram Trans
DCB Bank

Equitas Holdings Absolute – SHORT Relative – UNDERWEIGHT 20% downside in 14Months
August 16, 2016 Analyst: Anirvan Sarkar [email protected] (+91-79-61909526) Page 28 of 63
Exhibit 20: P/B vs RoE for Microfinance
Source: Company filings, Bloomberg, Equirus Securities
y = 17.975x + 1.0488R² = 0.9229
0.0x
1.0x
2.0x
3.0x
4.0x
5.0x
6.0x
7.0x
8.0x
0% 5% 10% 15% 20% 25% 30% 35% 40%
FY
16 P
/B
FY17 RoE
2017 RoE to 2016 P/B
Equitas
SKS Microfinance
Ujjivan
City Union Bank

Equitas Holdings Absolute – SHORT Relative – UNDERWEIGHT 20% downside in 14Months
August 16, 2016 Analyst: Anirvan Sarkar [email protected] (+91-79-61909526) Page 29 of 63
Exhibit 21: ROE-ROA Tree Analysis
FY16A FY17E FY18E FY19E
Yield on Gross AUMs 20.0% 19.0% 18.3% 17.8%
Yield on Investments NA 7.5% 7.5% 7.5%
Cost of Funds 11.3% 9.9% 9.9% 9.4%
Net Interest Margin (incl off balance sheet) 11.4% 9.9% 9.5% 8.9%
Advances (A) 50,702 68,544 84,194 1,07,670
Investments (B) 119 13,234 16,706 22,172
Cash In Hand & Balance with RBI & balances with banks [C]
9,470 9,342 11,793 15,651
Securitization (D) 10,572 12,338 12,864 13,653
Interest Earning Assets (on and off balance sheet) (E = A+B+C+D)
70,863 1,03,458 1,25,557 1,59,145
Average Interest Earning Assets (on and off balance sheet) (F)
59,145 87,160 1,14,508 1,42,351
NII/Avg Int Earning Assets (on and off balance sheet) 11.4% 9.9% 9.5% 8.9%
Interest Earning Assets (on balance sheet) (G = A+B+C) 60,291 91,121 1,12,693 1,45,492
Average Interest Earning Assets (on balance sheet) (H) 51,133 75,706 1,01,907 1,29,093
Asset multiplier (F/H) 1.16 1.15 1.12 1.10
NII/Avg Int Earning Assets (on balance sheet) 13.5% 11.4% 10.6% 9.9%
Non Int Inc/Avg Int Earning Assets 2.0% 2.2% 2.4% 2.4%
Total Income/Avg Int Earning Assets 15.5% 13.6% 13.0% 12.3%
Op. Costs/Avg Int Earning Assets 7.0% 7.6% 8.5% 7.7%
PPI/Avg Int Earning Assets 6.2% 6.0% 4.6% 4.5%
Provisions/Avg Int Earning Assets 1.2% 1.2% 1.6% 1.7%
Taxes/Avg Int Earning Assets 1.8% 1.7% 1.0% 1.0%
Return on Avg Int Earning Assets 3.3% 3.1% 1.9% 1.8%
Extraordinary item 0.0 0.0 0.0 0.0
Adj Return on Avg Int Earning Assets 3.3% 3.1% 1.9% 1.8%
Productivity (Avg Int Earning Assets/Avg Total Assets) 0.93 0.87 0.83 0.83
Return on Average Total Assets 3.0% 2.7% 1.6% 1.5%
Leverage (Average Total Assets/Average Equity) 4.4 4.8 5.2 6.0
Return on Average Equity 13.3% 13.0% 8.2% 9.2%
Source: Company, Equirus Securities
Investment Risks and Concerns
SFB transition could be painless:
Our cautious stance on Equitas is based on high valuations which do not factor in the risks
related to their transition to a bank, the interim dip in profitability, and possible delays
in return ratios picking up. However, it is possible that Equitas makes a seamless bank
transition without any significant dip in profitability, which would cause the stock to
remain at elevated valuations. It is possible that they succeed in garnering a sizeable
deposit base to provide sufficient low cost funds for building their asset base in which
case NIMs will stay higher than what we estimate and return ratios also stay elevated.

Equitas Holdings Absolute – SHORT Relative – UNDERWEIGHT 20% downside in 14Months
August 16, 2016 Analyst: Anirvan Sarkar [email protected] (+91-79-61909526) Page 30 of 63
Corporate Governance
• Board has been constituted in compliance with the Companies Act, 2013 andthe SEBI Listing Regulations • Equitas has been recognized for its voluntary compliance with the highestlevels of corporate governance. CRISIL has reviewed and re-affirmed Equitas at Level 2 on Governance & Value Creation Rating, with only six other corporates viz., Bharti Airtel Limited, HDFC Bank Limited, Housing Development Finance Corporation Limited, Infosys Limited, Mahindra & Mahindra Limited and Hero Motocorp Limited being rated at Level 1 • The Board comprises of 13 Directors. In compliance with the requirements ofthe SEBI Listing Regulations, Chairman is a non-executive Independent Director and have one executive Director, 12 non-executive Directors including eight Independent Directors on Board and there is no relationship between directors inter-se • The Board at present has eight (8) Committees viz., Audit & Risk ManagementCommittee, Business Committee, Nomination, Remuneration and Governance Committee, Corporate Social Responsibility Committee, Stakeholders Relationship Committee, IPO Committee, Small Finance Bank Committee and Resources Committee • The books of accounts of the company are audited by Deloitte Haskins & Sells
Key Management profile
Mr. P.N Vasudevan, Managing Director
Mr.P. N. Vasudevan is the MD of the Company. He has been a Director since inception and the MD since July 26, 2007. He is a qualified company secretary from the ICSI. He has extensive experience in the financial services sector and had served as the Head – Consumer Banking Group in Development Credit Bank Limited, for more than one and half years. He has also worked for about two decades in Cholamandalam Investment and Finance Co Limited, where he joined as a management trainee and resigned as vice president and business head of vehicle finance. He was also the chairman of the managing committee of the South India Hire Purchase Association for the year Financial Year 2006
Mr. S Bhaskar, Chief Financial Officer
Mr. S.Bhaskar was appointed as the CFO in Nov 14. He is a qualified CA from the ICAI. He started his career with PWC, where he worked for one and a half years. He later moved to Cholamandalam Investment and Finance Company Limited where he worked for two decades. Prior to joining Equitas Group, he was the
Group Treasurer and Senior Vice President – Audit for the Murugappa Group, Chennai.
Mr. H Mahalingam, President and Group Chief Technology Officer
Mr.H. Mahalingam is the President and Group CTO of EMFL. He holds a Masters degree in Science (Statistics) from University of Madras. He also holds a certification in Oracle from BiTech Training and Overseas Projects Services. Prior to joining Equitas, he was the Chief Manager for Kothari Safe Deposits Limited and the Chief Manager- Information Technology at Cholamandalam Investment and Finance Company Limited.
Mr. H.K.N Raghavan, Chief Executive Officer-EMFL
Mr. H.K.N. Raghavan is the CEO of EMFL. He holds a Bachelors degree in Commerce from Osmania University and Executive Program in Business Management from IIM, Calcutta. Prior to joining EMFL, he had worked in various fast-moving consumer goods companies like Hindustan Unilever Limited, Agro Tech Foods Provident Fund, Henkel SPIC India Limited, Dabur Foods Limited and Subhiksha Trading Services Limited.
Mr. V.S Murthy, Chief Executive Officer-EFL
Mr. V. S. Murthy is the Chief Executive Officer of EFL. He holds a Bachelors degree in Commerce and a Masters degree in Business Administration from Osmania University. His prior experience includes working with Cholamandalam DBS Finance Limited and Dhandapani Finance Limited as the Head – Secured Loans. He joined the Equitas group to head Educational Initiatives and was given additional responsibility of Micro Finance - Branch Operations in January 2012.
Mr. N Shridharan, Chief Financial Officer-EMFL
Mr. N. Sridharan is the Chief Financial Officer of EMFL. He is a qualified CA from the ICAI. He has over three decades of experience in finance and accounts. He started his career with CMC Limited in 1986 and he was Deputy General Manager- Finance and Internal Audit at the time of resignation. His prior experience includes SRA Systems Limited as General Manager- Finance for nine years and was associated with Subhiksha Trading Services as Vice President – MIS and Commercial Control.
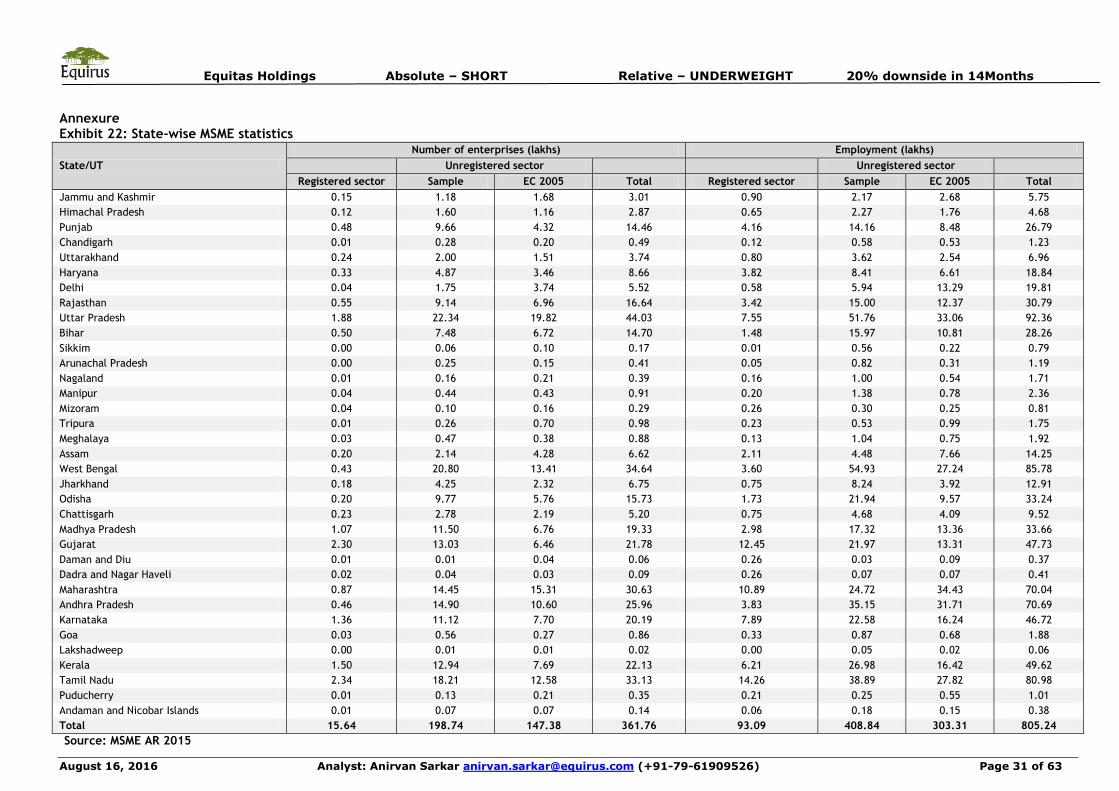
Equitas Holdings Absolute – SHORT Relative – UNDERWEIGHT 20% downside in 14Months
August 16, 2016 Analyst: Anirvan Sarkar [email protected] (+91-79-61909526) Page 31 of 63
Annexure Exhibit 22: State-wise MSME statistics
State/UT
Number of enterprises (lakhs) Employment (lakhs)
Unregistered sector Unregistered sector
Registered sector Sample EC 2005 Total Registered sector Sample EC 2005 Total
Jammu and Kashmir 0.15 1.18 1.68 3.01 0.90 2.17 2.68 5.75
Himachal Pradesh 0.12 1.60 1.16 2.87 0.65 2.27 1.76 4.68
Punjab 0.48 9.66 4.32 14.46 4.16 14.16 8.48 26.79
Chandigarh 0.01 0.28 0.20 0.49 0.12 0.58 0.53 1.23
Uttarakhand 0.24 2.00 1.51 3.74 0.80 3.62 2.54 6.96
Haryana 0.33 4.87 3.46 8.66 3.82 8.41 6.61 18.84
Delhi 0.04 1.75 3.74 5.52 0.58 5.94 13.29 19.81
Rajasthan 0.55 9.14 6.96 16.64 3.42 15.00 12.37 30.79
Uttar Pradesh 1.88 22.34 19.82 44.03 7.55 51.76 33.06 92.36
Bihar 0.50 7.48 6.72 14.70 1.48 15.97 10.81 28.26
Sikkim 0.00 0.06 0.10 0.17 0.01 0.56 0.22 0.79
Arunachal Pradesh 0.00 0.25 0.15 0.41 0.05 0.82 0.31 1.19
Nagaland 0.01 0.16 0.21 0.39 0.16 1.00 0.54 1.71
Manipur 0.04 0.44 0.43 0.91 0.20 1.38 0.78 2.36
Mizoram 0.04 0.10 0.16 0.29 0.26 0.30 0.25 0.81
Tripura 0.01 0.26 0.70 0.98 0.23 0.53 0.99 1.75
Meghalaya 0.03 0.47 0.38 0.88 0.13 1.04 0.75 1.92
Assam 0.20 2.14 4.28 6.62 2.11 4.48 7.66 14.25
West Bengal 0.43 20.80 13.41 34.64 3.60 54.93 27.24 85.78
Jharkhand 0.18 4.25 2.32 6.75 0.75 8.24 3.92 12.91
Odisha 0.20 9.77 5.76 15.73 1.73 21.94 9.57 33.24
Chattisgarh 0.23 2.78 2.19 5.20 0.75 4.68 4.09 9.52
Madhya Pradesh 1.07 11.50 6.76 19.33 2.98 17.32 13.36 33.66
Gujarat 2.30 13.03 6.46 21.78 12.45 21.97 13.31 47.73
Daman and Diu 0.01 0.01 0.04 0.06 0.26 0.03 0.09 0.37
Dadra and Nagar Haveli 0.02 0.04 0.03 0.09 0.26 0.07 0.07 0.41
Maharashtra 0.87 14.45 15.31 30.63 10.89 24.72 34.43 70.04
Andhra Pradesh 0.46 14.90 10.60 25.96 3.83 35.15 31.71 70.69
Karnataka 1.36 11.12 7.70 20.19 7.89 22.58 16.24 46.72
Goa 0.03 0.56 0.27 0.86 0.33 0.87 0.68 1.88
Lakshadweep 0.00 0.01 0.01 0.02 0.00 0.05 0.02 0.06
Kerala 1.50 12.94 7.69 22.13 6.21 26.98 16.42 49.62
Tamil Nadu 2.34 18.21 12.58 33.13 14.26 38.89 27.82 80.98
Puducherry 0.01 0.13 0.21 0.35 0.21 0.25 0.55 1.01
Andaman and Nicobar Islands 0.01 0.07 0.07 0.14 0.06 0.18 0.15 0.38
Total 15.64 198.74 147.38 361.76 93.09 408.84 303.31 805.24
Source: MSME AR 2015
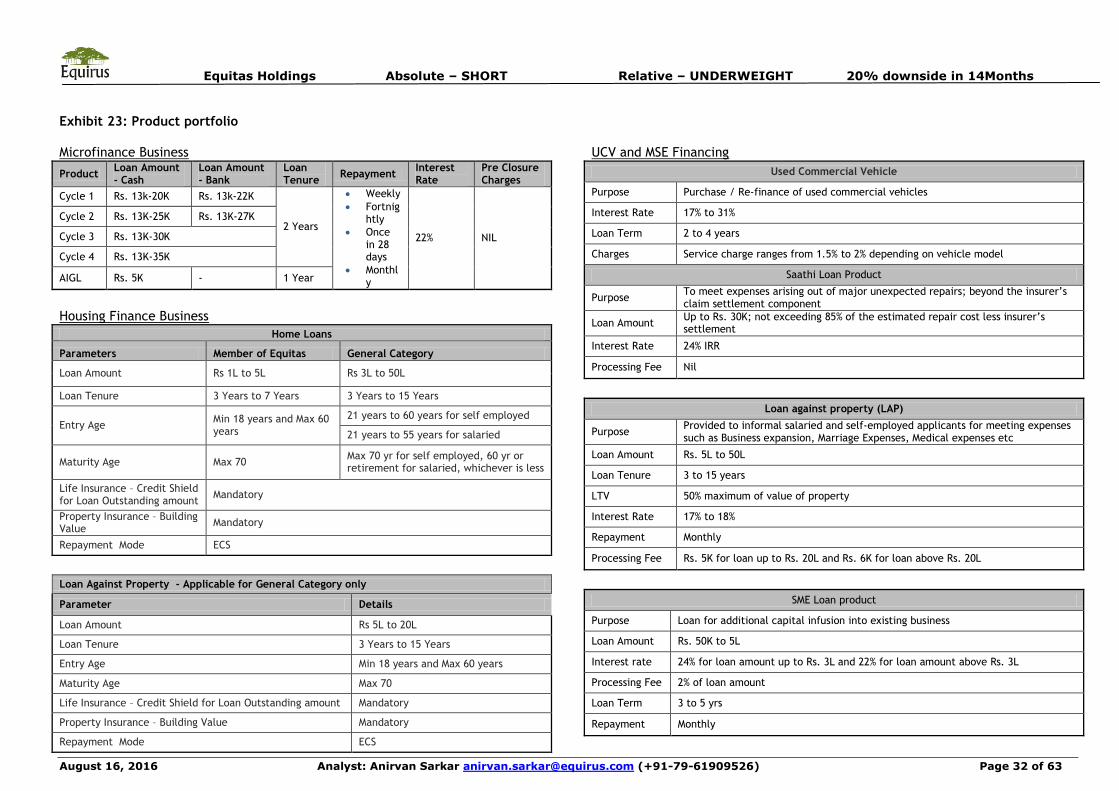
Equitas Holdings Absolute – SHORT Relative – UNDERWEIGHT 20% downside in 14Months
August 16, 2016 Analyst: Anirvan Sarkar [email protected] (+91-79-61909526) Page 32 of 63
Exhibit 23: Product portfolio
Microfinance Business
Product Loan Amount - Cash
Loan Amount - Bank
Loan Tenure
Repayment Interest Rate
Pre Closure Charges
Cycle 1 Rs. 13k-20K Rs. 13k-22K
2 Years
Weekly
Fortnightly
Oncein 28days
Monthly
22% NIL
Cycle 2 Rs. 13K-25K Rs. 13K-27K
Cycle 3 Rs. 13K-30K
Cycle 4 Rs. 13K-35K
AIGL Rs. 5K - 1 Year
Housing Finance Business
Home Loans
Parameters Member of Equitas General Category
Loan Amount Rs 1L to 5L Rs 3L to 50L
Loan Tenure 3 Years to 7 Years 3 Years to 15 Years
Entry Age Min 18 years and Max 60 years
21 years to 60 years for self employed
21 years to 55 years for salaried
Maturity Age Max 70 Max 70 yr for self employed, 60 yr or retirement for salaried, whichever is less
Life Insurance – Credit Shield for Loan Outstanding amount
Mandatory
Property Insurance – Building Value
Mandatory
Repayment Mode ECS
Loan Against Property - Applicable for General Category only
Parameter Details
Loan Amount Rs 5L to 20L
Loan Tenure 3 Years to 15 Years
Entry Age Min 18 years and Max 60 years
Maturity Age Max 70
Life Insurance – Credit Shield for Loan Outstanding amount Mandatory
Property Insurance – Building Value Mandatory
Repayment Mode ECS
UCV and MSE Financing
Used Commercial Vehicle
Purpose Purchase / Re-finance of used commercial vehicles
Interest Rate 17% to 31%
Loan Term 2 to 4 years
Charges Service charge ranges from 1.5% to 2% depending on vehicle model
Saathi Loan Product
Purpose To meet expenses arising out of major unexpected repairs; beyond the insurer’s claim settlement component
Loan Amount Up to Rs. 30K; not exceeding 85% of the estimated repair cost less insurer’s settlement
Interest Rate 24% IRR
Processing Fee Nil
Loan against property (LAP)
Purpose Provided to informal salaried and self-employed applicants for meeting expenses such as Business expansion, Marriage Expenses, Medical expenses etc
Loan Amount Rs. 5L to 50L
Loan Tenure 3 to 15 years
LTV 50% maximum of value of property
Interest Rate 17% to 18%
Repayment Monthly
Processing Fee Rs. 5K for loan up to Rs. 20L and Rs. 6K for loan above Rs. 20L
SME Loan product
Purpose Loan for additional capital infusion into existing business
Loan Amount Rs. 50K to 5L
Interest rate 24% for loan amount up to Rs. 3L and 22% for loan amount above Rs. 3L
Processing Fee 2% of loan amount
Loan Term 3 to 5 yrs
Repayment Monthly

Equitas Holdings Absolute – SHORT Relative – UNDERWEIGHT 20% downside in 14Months
August 16, 2016 Analyst: Anirvan Sarkar [email protected] (+91-79-61909526) Page 33 of 63
Consolidated Quarterly Earnings Forecast and Key Drivers Rs in Mn 1Q16A 2Q16A 3Q16A 4Q16A 1Q17A 2Q17E 3Q17E 4Q17E 1Q18E 2Q18E 3Q18E 4Q18E FY16A FY17E FY18E FY19E
Interest Income 2,156 2,407 2,668 2,906 3,118 3,273 3,651 3,970 4,157 4,317 4,563 4,754 10,137 14,013 17,791 21,352 Interest Expense 900 1,029 1,153 1,277 1,215 1,241 1,413 1,544 1,621 1,675 1,778 1,875 4,360 5,413 6,949 8,634
Net Interest Income 1,256 1,378 1,515 1,629 1,903 2,033 2,238 2,425 2,536 2,642 2,784 2,880 5,777 8,599 10,842 12,718
Non Interest Income 237 228 250 296 370 379 424 502 558 595 634 670 1,012 1,675 2,457 3,101
Total Income 1,493 1,606 1,765 1,925 2,273 2,412 2,662 2,927 3,094 3,236 3,418 3,550 6,789 10,275 13,299 15,819
Operating and Other Expenses 748 851 948 1,050 1,134 1,375 1,518 1,727 2,011 2,104 2,222 2,307 3,597 5,753 8,644 9,966 Staff Cost 486 528 626 698 752 899 977 1,094 1,254 1,291 1,341 1,370 2,338 3,722 5,256 5,660 Other Operating Expenses 261 323 322 352 381 476 541 633 757 813 881 938 1,259 2,032 3,389 4,306 Pre-Provision Income 745 755 817 875 1,139 1,037 1,145 1,200 1,083 1,133 1,196 1,242 3,192 4,521 4,655 5,853 Provisions and Write-offs 164 138 143 146 176 187 254 273 332 392 457 477 591 889 1,657 2,181 PBT 581 617 674 729 963 850 891 927 751 741 739 766 2,601 3,632 2,997 3,672 TAX 207 218 243 261 352 298 312 325 263 259 259 268 930 1,286 1,049 1,285 Extraordinary - - - - - - - - - - - - - - - - PAT 374 399 431 468 612 553 579 603 488 482 481 498 1,671 2,346 1,948 2,387 EPS 1 1 2 2 1.9 1.6 1.7 1.8 1.5 1.4 1.4 1.5 6.2 7.0 5.8 7.1 Key Drivers YoA 20.5% 21.8% 19.4% 20.0% 23.1% 22.1% 21.7% 21.7% 21.7% 21.2% 21.2% 21.1% 20.0% 19.0% 18.3% 17.8% YoI NA NA NA NA NA NA 7.2% 7.2% 7.2% 7.2% 7.2% 7.2% 12.3% 5.0% 7.2% 7.2% CoF 11.8% 13.4% 11.1% 11.6% 11.0% 10.7% 10.6% 10.5% 9.9% 10.1% 9.8% 9.8% 11.3% 9.9% 9.9% 9.4%
NIM 11.9% 12.5% 11.0% 11.2% 12.0% 10.8% 10.2% 9.8% 9.6% 9.4% 9.5% 9.4% 11.4% 9.9% 9.5% 8.9%
C/I Ratio 50.1% 53.0% 53.7% 54.5% 49.9% 57.0% 57.0% 59.0% 65.0% 65.0% 65.0% 65.0% 53.0% 56.0% 65.0% 63.0%
CD Ratio NA NA NA NA NA NA 2000.0% 1000.0% 888.9% 800.0% 727.3% 666.7% NA 1000.0% 666.7% 400.0% Non-Interest Income/ Total Income
15.9% 14.2% 14.2% 15.4% 16.3% 15.7% 15.9% 17.1% 18.0% 18.4% 18.5% 18.9% 14.9% 16.3% 18.5% 19.6%
ROA 3.3% 3.3% 3.1% 3.0% 3.7% 3.1% 2.7% 2.4% 1.8% 1.6% 1.5% 1.5% 3.0% 2.7% 1.6% 1.5% ROE 12.6% 13.0% 13.6% 14.2% 14.2% 10.4% 10.6% 10.7% 8.5% 8.2% 8.0% 8.1% 13.3% 13.0% 8.2% 9.2% Sequential Growth (%)
NII 7.7% 9.8% 9.9% 7.5% 16.8% 6.8% 10.1% 8.4% 4.6% 4.2% 5.4% 3.4% - - - -
TI 9.7% 7.6% 9.9% 9.1% 18.1% 6.1% 10.4% 10.0% 5.7% 4.6% 5.6% 3.8% - - - -
PPI 4.5% 1.3% 8.1% 7.2% 30.2% -8.9% 10.4% 4.8% -9.8% 4.6% 5.6% 3.8% - - - - Provisions and Write-offs 5.5% -16.2% 3.5% 2.3% 20.2% 6.3% 36.2% 7.4% 21.5% 18.1% 16.7% 4.3% - - - - PAT 2.5% 6.8% 7.8% 8.6% 30.8% -9.6% 4.7% 4.1% -19.0% -1.4% -0.2% 3.5% - - - - EPS 2.2% 5.8% 8.8% 8.1% 7.5% -100.0% NA NA NA NA NA NA - - - - Advances 15.9% - - 1.1% 12.6% 7.6% 7.6% 3.7% 5.6% 5.6% 5.6% 4.3% - - - -
Deposits - - - - - - - 107.3% 18.8% 17.4% 16.2% 13.7% - - - -
Total Business 15.9% - - 1.1% 12.6% 21.2% 21.6% 22.7% 6.8% 6.8% 14.1% 14.0% - - - -
Yearly Growth (%) NII - - - - 51.5% 47.5% 47.8% 48.9% 33.3% 30.0% 24.4% 18.7% 47.3% 48.8% 26.1% 17.3% TI - - - - 52.2% 50.1% 50.9% 52.1% 36.1% 34.2% 28.4% 21.3% 47.2% 51.3% 29.4% 18.9% PPI - - - - 52.8% 37.3% 40.2% 37.2% -4.9% 9.2% 4.5% 3.5% 49.2% 41.6% 2.9% 25.7%
Provisions and Write-offs - - - - 6.8% 35.4% 78.2% 186.9% 88.9% 109.8% 79.8% 74.7% 17.2% 50.5% 86.3% 31.6%
PAT - - - - 63.6% 38.4% 34.5% 28.9% -20.2% -12.9% -17.0% -17.4% 56.8% 40.4% -17.0% 22.5%
EPS - - - - 33.8% 12.0% 7.8% 3.8% -21.8% -12.9% -17.0% -17.4% 38.5% 12.9% -17.0% 22.5% Advances - - - - 42.2% - 31.9% 35.2% 26.8% 24.4% 22.1% 22.8% 46.3% 35.2% 22.8% 27.9% Deposits - - - - - - - - - - 235.8% 84.2% - - 84.2% 113.1%
Total Business - - - - 42.2% - - 48.7% 41.0% 40.0% 32.3% 28.4% 46.3% 48.7% 28.4% 39.0%

Equitas Holdings Absolute – SHORT Relative – UNDERWEIGHT 20% downside in 14Months
August 16, 2016 Analyst: Anirvan Sarkar [email protected] (+91-79-61909526) Page 34 of 63
Consolidated Financials P&L FY16A FY17E FY18E FY19E Balance Sheet FY16A FY17E FY18E FY19E Cash Flow FY16A FY17E FY18E FY19E
Interest Income 10,137 14,013 17,791 21,352 Equity Capital 2,699 3,357 3,357 3,357 Net Profit 1,671 2,346 1,948 2,387
Interest Expense 4,360 5,413 6,949 8,634 Reserve 10,714 19,397 21,345 23,732 Depreciation 137 0 0 0
NII 5,777 8,599 10,842 12,718 Deposits 0 6,854 12,629 26,917 Changes in Dep 0 6,854 5,775 14,288
Operating Exp 3,597 5,753 8,644 9,966 Borrowings 46,833 55,425 65,988 77,420 Changes in Borr 16,511 8,592 10,563 11,432
PPI 3,192 4,521 4,655 5,853 Current liabilities 4,819 22,997 33,796 42,630 Changes in Inv 1,636 -13,116 -3,472 -5,466
Provisions 591 889 1,657 2,181 Total Liabilities 65,065 1,08,030 1,37,116 1,74,057 Changes in L&A -16,056 -17,842 -15,650 -23,475
Non Int Inc 1,012 1,675 2,457 3,101 Net Fixed Assets 658 2,500 4,249 6,374 Changes in Others 289 7,885 5,036 6,816
Profit Before Taxes 2,601 3,632 2,997 3,672 Loans and Adv 50,702 68,544 84,194 1,07,670 Net Cash Ops 4,189 -5,281 4,200 5,983
Tax 930 1,286 1,049 1,285 Investments 119 13,234 16,706 22,172 Net Cash from Inv -191 -1,842 -1,750 -2,125
Rep PAT bef ext 1,671 2,346 1,948 2,387 Int Earning Assets 60,291 91,121 1,12,693 1,45,492 Net Cash from Fin 35 6,995 0 0
Extraordinary 0 0 0 0 Cash 9,470 9,342 11,793 15,651 Cash Generation 4,033 -128 2,451 3,858
Adjusted PAT 1,671 2,346 1,948 2,387 Other LTA Ending Cash Balance 9,470 9,342 11,793 15,651
EPS (Rs) 6.2 7.0 5.8 7.1 OCA 4,117 14,410 20,174 22,191 RoE (%) 13.3% 13.0% 8.2% 9.2%
Adj EPS 6.2 7.0 5.8 7.1 Total Assets 65,065 1,08,030 1,37,116 1,74,057 Adjusted RoE (%) 13.3% 13.0% 8.2% 9.2%
BVPS (Rs.) 49.7 67.8 73.6 80.7 Yield 20.00% 19.00% 18.31% 17.78% RoA(%) 3.0% 2.7% 1.6% 1.5%
Adj BVPS (Rs.) 47.9 64.6 68.3 73.6 Cost of Funds 11.30% 9.92% 9.86% 9.44% Adjusted RoA (%) 3.0% 2.7% 1.6% 1.5%
DPS (Rs.) 0.0 0.0 0.0 0.0 P&L Provisions 591 889 1657 2181
Credit Cost (%) 1.39% 1.49% 2.17% 2.27% Cost to Income 52.98% 56.00% 65.00% 63.00% P/E 28.2 24.9 30.0 24.5
NIMs (%) 11.3% 11.4% 10.6% 9.9% Cost to Average Asset 6.56% 6.65% 7.05% 6.41% Adj P/E 28.2 24.9 30.0 24.5
NII Growth 47.3% 48.8% 26.1% 17.3% L&A Growth 46.34% 35.19% 22.83% 27.88% P/BV 3.5 2.6 2.4 2.2
Adj PAT Growth (%) 56.8% 40.4% -17.0% 22.5% Leverage 4.37 4.79 5.17 6.01 Adj P/BV 3.6 2.7 2.6 2.4
Adj EPS Growth (%) 38.5% 12.9% -17.0% 22.5% C/D Ratio NA 1000.00% 666.67% 400.00% Div Payout (%) - - - -
Adj BVPS Growth 14.1% 36.4% 8.6% 9.7% Provisions (%) 17.20% 50.48% 86.30% 31.61% Div Yield(%) - - - -
Dividend Gr. (%) - - - - GNPA 1.34% 2.24% 2.98% 3.13% -
Tax Rate (%) 35.7% 35.4% 35.0% 35.0% NNPA 0.94% 1.57% 2.09% 2.19% -
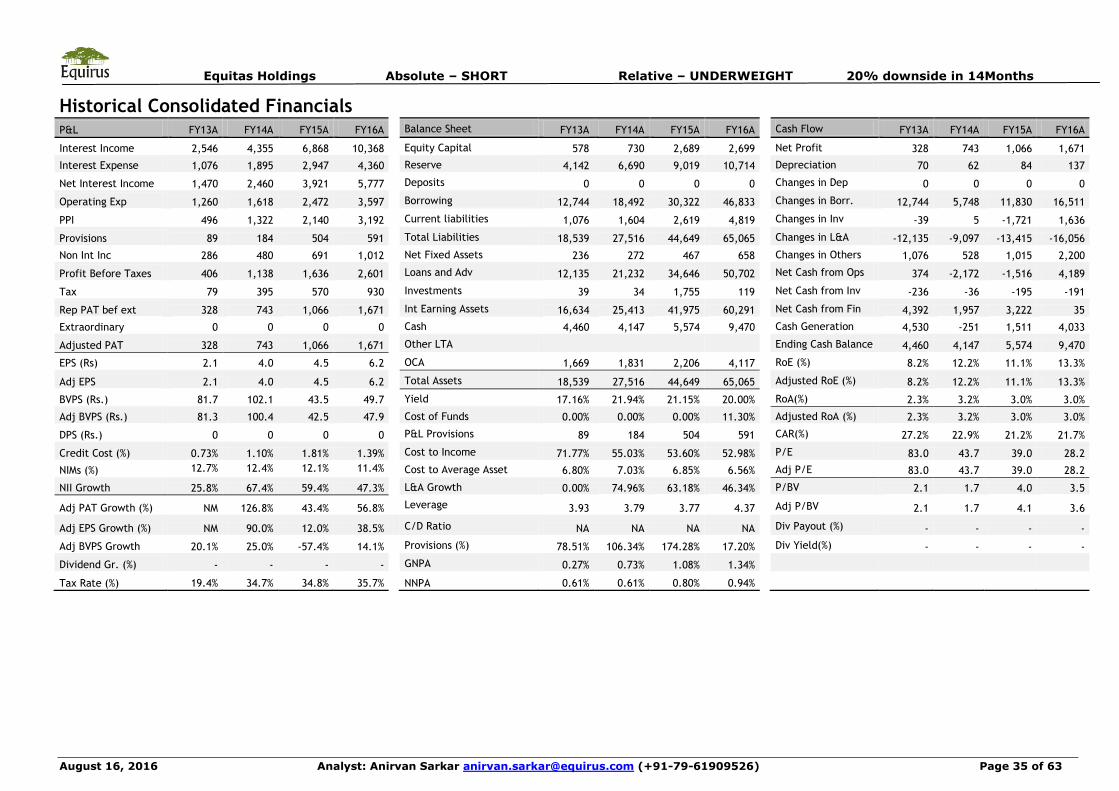
Equitas Holdings Absolute – SHORT Relative – UNDERWEIGHT 20% downside in 14Months
August 16, 2016 Analyst: Anirvan Sarkar [email protected] (+91-79-61909526) Page 35 of 63
Historical Consolidated Financials P&L FY13A FY14A FY15A FY16A Balance Sheet FY13A FY14A FY15A FY16A Cash Flow FY13A FY14A FY15A FY16A
Interest Income 2,546 4,355 6,868 10,368 Equity Capital 578 730 2,689 2,699 Net Profit 328 743 1,066 1,671
Interest Expense 1,076 1,895 2,947 4,360 Reserve 4,142 6,690 9,019 10,714 Depreciation 70 62 84 137
Net Interest Income 1,470 2,460 3,921 5,777 Deposits 0 0 0 0 Changes in Dep 0 0 0 0
Operating Exp 1,260 1,618 2,472 3,597 Borrowing 12,744 18,492 30,322 46,833 Changes in Borr. 12,744 5,748 11,830 16,511
PPI 496 1,322 2,140 3,192 Current liabilities 1,076 1,604 2,619 4,819 Changes in Inv -39 5 -1,721 1,636
Provisions 89 184 504 591 Total Liabilities 18,539 27,516 44,649 65,065 Changes in L&A -12,135 -9,097 -13,415 -16,056
Non Int Inc 286 480 691 1,012 Net Fixed Assets 236 272 467 658 Changes in Others 1,076 528 1,015 2,200
Profit Before Taxes 406 1,138 1,636 2,601 Loans and Adv 12,135 21,232 34,646 50,702 Net Cash from Ops 374 -2,172 -1,516 4,189
Tax 79 395 570 930 Investments 39 34 1,755 119 Net Cash from Inv -236 -36 -195 -191
Rep PAT bef ext 328 743 1,066 1,671 Int Earning Assets 16,634 25,413 41,975 60,291 Net Cash from Fin 4,392 1,957 3,222 35
Extraordinary 0 0 0 0 Cash 4,460 4,147 5,574 9,470 Cash Generation 4,530 -251 1,511 4,033
Adjusted PAT 328 743 1,066 1,671 Other LTA Ending Cash Balance 4,460 4,147 5,574 9,470
EPS (Rs) 2.1 4.0 4.5 6.2 OCA 1,669 1,831 2,206 4,117 RoE (%) 8.2% 12.2% 11.1% 13.3%
Adj EPS 2.1 4.0 4.5 6.2 Total Assets 18,539 27,516 44,649 65,065 Adjusted RoE (%) 8.2% 12.2% 11.1% 13.3%
BVPS (Rs.) 81.7 102.1 43.5 49.7 Yield 17.16% 21.94% 21.15% 20.00% RoA(%) 2.3% 3.2% 3.0% 3.0%
Adj BVPS (Rs.) 81.3 100.4 42.5 47.9 Cost of Funds 0.00% 0.00% 0.00% 11.30% Adjusted RoA (%) 2.3% 3.2% 3.0% 3.0%
DPS (Rs.) 0 0 0 0 P&L Provisions 89 184 504 591 CAR(%) 27.2% 22.9% 21.2% 21.7%
Credit Cost (%) 0.73% 1.10% 1.81% 1.39% Cost to Income 71.77% 55.03% 53.60% 52.98% P/E 83.0 43.7 39.0 28.2
NIMs (%) 12.7% 12.4% 12.1% 11.4% Cost to Average Asset 6.80% 7.03% 6.85% 6.56% Adj P/E 83.0 43.7 39.0 28.2
NII Growth 25.8% 67.4% 59.4% 47.3% L&A Growth 0.00% 74.96% 63.18% 46.34% P/BV 2.1 1.7 4.0 3.5
Adj PAT Growth (%) NM 126.8% 43.4% 56.8% Leverage 3.93 3.79 3.77 4.37 Adj P/BV 2.1 1.7 4.1 3.6
Adj EPS Growth (%) NM 90.0% 12.0% 38.5% C/D Ratio NA NA NA NA Div Payout (%) - - - -
Adj BVPS Growth 20.1% 25.0% -57.4% 14.1% Provisions (%) 78.51% 106.34% 174.28% 17.20% Div Yield(%) - - - -
Dividend Gr. (%) - - - - GNPA 0.27% 0.73% 1.08% 1.34%
Tax Rate (%) 19.4% 34.7% 34.8% 35.7% NNPA 0.61% 0.61% 0.80% 0.94%

August 16, 2016 Analyst: Anirvan Sarkar [email protected] (+91-79-61909526) Page 36 of 63 Before reading this report, you must refer to the disclaimer on the last page.
Ujjivan Financial Services Absolute : SHORT
Relative : UNDERWEIGHT
Initiating Note Regular Coverage 18% downside in 14 months
Continued dependence on microfinance a clear risk, unfavorable risk reward going ahead, initiate with SHORT
Financials
© 2016 Equirus All rights reserved
Rating Information
Price (Rs) 451
Target Price (Rs) 372
Target Date 30th Sep‟17
Target Set On 16th Aug‟16
Implied yrs of growth (ERE) 20
Fair Value (ERE) 371
Fair Value (DDM) NA
Ind Benchmark BANKEX
Model Portfolio Position -
Stock Information
Market Cap (Rs mn) 53,291
Free Float (%) 100.00 %
52 Wk H/L (Rs) 547.5/216.65
Avg Daily Volume (1yr) 46,02,102
Avg Daily Value (1yr) 1,724
Equity Cap (Rs Mn) 1,182
Face Value (Rs) 10
Bloomberg Code UJJIVAN IN
Ownership Recent 3M 12M %
Promoters 0.0 % 0.0 % 0.0 %
DII 23.9 % 0.0 % 0.0 %
FII 47.2 % 0.0 % 0.0 %
Public* 29.0 % 0.0 % 0.0 %
Price % 1M% 3M% 12M%
Absolute 11.5 % 74.7 % -
Vs Industry 11.0 % 60.1 % -
EQUITAS -0.5 % 17.3 % -
BHAFIN 2.6 % 25.2 % 45.3 %
Consolidated Quarterly EPS forecast
Rs/Share 1Q 2Q 3Q 4Q
EPS (16A) - - - -
EPS (17E) 6.4 4.7 4.3 4.2
Ujjivan Financial Services is the 3rd largest microfinance company in India with ~9%
market share (as of Mar‟16) and Microfinance Gross AUM of Rs. 46.9bn. We remain
cautious on the company‟s portfolio concentration in microfinance (87% in 1QFY17),
and estimate microfinance will stay at 60% of gross AUMs by FY22E. In view of limited
growth opportunities in microfinance, inherent risks in the microfinance industry,
uncertainty of deposit scale-up and high valuations, we initiate with a SHORT rating
with ERoE based Sep‟17 TP of Rs. 372 implying FY17E P/ABV of 2.2x.
Microfinance industry’s addressable market has limited room for growth,
restricting Ujjivan’s growth potential: Although microfinance industry gross AUMs
have grown at a 63% CAGR between FY13-16, we estimate that for a 30% CAGR to
sustain, MFI industry penetration has to increase to 53% by FY21E from 25% in FY16.
Attaining such penetration will require expansion into rural India, which is not scalable
for all players in the industry. We estimate Ujjivan‟s microfinance gross AUMs will
grow at ~22% CAGR till FY22E. However, their urban/semi-urban focus restricts their
growth opportunities as most of the targetable market is in rural areas.
No proven ability in scaling up individual lending products a key risk: Despite
growing from a low base of Rs. 460mn in FY13A to Rs. 6.9bn in FY16A, individual loans
still constitutes only 13% of the total loan book. Although Ujjivan is well-placed to
capture growth in housing and MSE, they do not have any proven track record of
scaling up their individual lending business without breaching healthy NPA level.
Asset quality risks remain elevated with a vulnerable customer base in
microfinance: While Ujjivan‟s GNPA/NNPA ratios stand at a healthy 0.18%/0.04% at
present, their portfolio concentration in microfinance and increased focus on
unsecured housing poses asset quality risk. Cyclical corrections and group defaults in
microfinance can lead to NPA spike, driving up credit costs and affecting profitability
as past microfinance crises have been preceded by periods of reckless growth leading
to overleveraging and NPAs growing to uncontrolled levels.
Ability to scale up deposit base poses unprecedented challenge: In addition to
building an asset base, any lag in building deposit base will compress margins and
reduce returns for Ujjivan once it transforms into a bank. The benefit to cost of funds
from deposits will take time because the company has to offer higher rates in the
beginning to attract customers.
Political intervention and Regulatory tightening are key risks: Political intervention
is a major risk for microfinance companies. Moreover, regulatory tightening in the
form of reducing lending rate caps or other measures will affect profitability.
Consolidated Financials
Rs. Mn YE Mar FY16A FY17E FY18E FY19E
Interest Income 9,310 13,064 15,677 18,826
Interest Expense 4,210 5,450 6,780 8,570
Net Interest Inc. 5,099 7,614 8,897 10,256
Other Income 966 1,426 1,831 2,251
Operating Exp 3,093 5,336 6,787 7,434
Provisions 253 586 1,142 1,908
PAT 1,772 2,038 1,820 2,057
Loan and Advances
50,644 63,735 74,801 91,400
Deposits 0 3,187 7,480 13,710
Net Worth 11,978 17,518 19,337 21,394
NIM 12.3 % 10.5 % 9.5 % 9.0 %
Credit Cost 0.61 % 1.02 % 1.65 % 2.30 %
Rs Per Share FY16A FY17E FY18E FY19E
EPS 20.1 20.2 18.1 20.4
Adjusted EPS 20.1 20.2 18.1 20.4
Book Value 119.0 174.0 192.1 212.5
Adjusted BVPS 118.8 171.8 184.5 200.4
DPS 0.0 0.0 0.0 0.0
P/B (x) 3.8 2.6 2.3 2.1
Adj P/B (x) 3.8 2.6 2.4 2.2
Adj ROE (%) 18.9 % 13.8 % 9.9 % 10.1 %
RoA (%) 3.7 % 2.8 % 2.0 % 1.8 %
*Public includes 0.85% of Director and Director Group
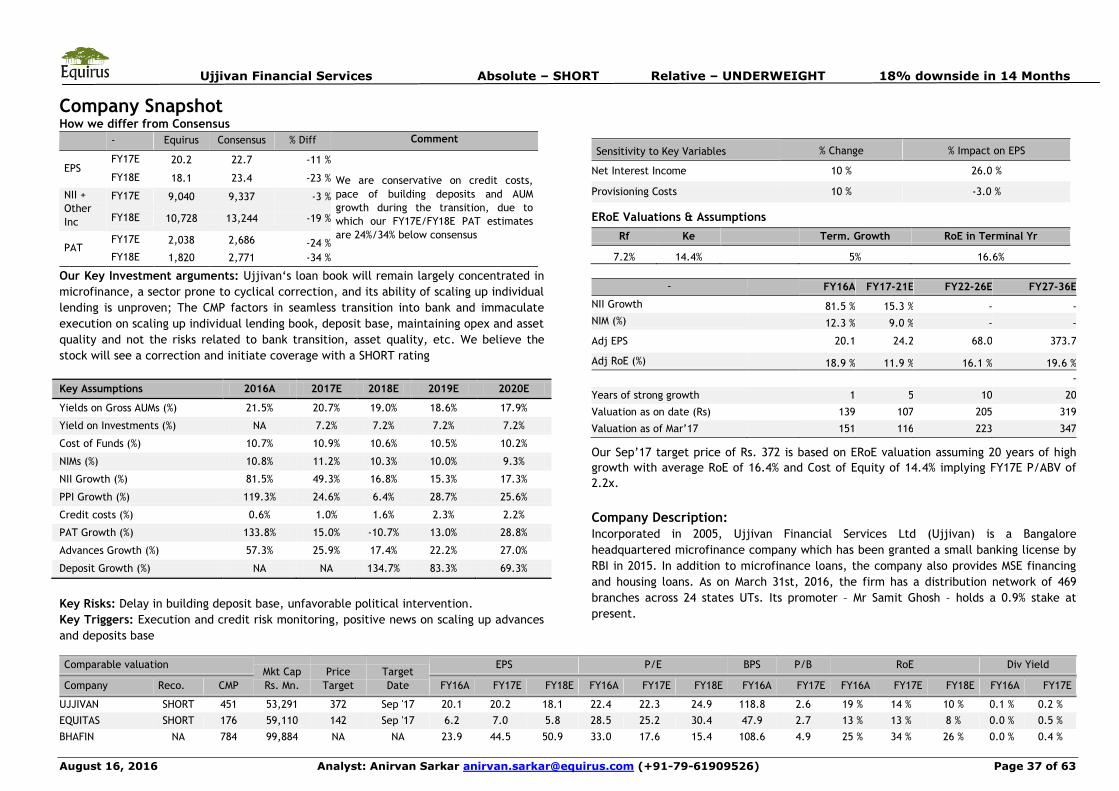
Ujjivan Financial Services Absolute – SHORT Relative – UNDERWEIGHT 18% downside in 14 Months
August 16, 2016 Analyst: Anirvan Sarkar [email protected] (+91-79-61909526) Page 37 of 63
Company Snapshot How we differ from Consensus
- Equirus Consensus % Diff Comment
EPS FY17E 20.2 22.7 -11 %
We are conservative on credit costs,
pace of building deposits and AUM
growth during the transition, due to
which our FY17E/FY18E PAT estimates
are 24%/34% below consensus
FY18E 18.1 23.4 -23 %
NII +
Other
Inc
FY17E 9,040 9,337 -3 %
FY18E 10,728 13,244 -19 %
PAT FY17E 2,038 2,686 -24 %
FY18E 1,820 2,771 -34 %
Our Key Investment arguments: Ujjivan„s loan book will remain largely concentrated in
microfinance, a sector prone to cyclical correction, and its ability of scaling up individual
lending is unproven; The CMP factors in seamless transition into bank and immaculate
execution on scaling up individual lending book, deposit base, maintaining opex and asset
quality and not the risks related to bank transition, asset quality, etc. We believe the
stock will see a correction and initiate coverage with a SHORT rating
Key Assumptions 2016A 2017E 2018E 2019E 2020E
Yields on Gross AUMs (%) 21.5% 20.7% 19.0% 18.6% 17.9%
Yield on Investments (%) NA 7.2% 7.2% 7.2% 7.2%
Cost of Funds (%) 10.7% 10.9% 10.6% 10.5% 10.2%
NIMs (%) 10.8% 11.2% 10.3% 10.0% 9.3%
NII Growth (%) 81.5% 49.3% 16.8% 15.3% 17.3%
PPI Growth (%) 119.3% 24.6% 6.4% 28.7% 25.6%
Credit costs (%) 0.6% 1.0% 1.6% 2.3% 2.2%
PAT Growth (%) 133.8% 15.0% -10.7% 13.0% 28.8%
Advances Growth (%) 57.3% 25.9% 17.4% 22.2% 27.0%
Deposit Growth (%) NA NA 134.7% 83.3% 69.3%
Key Risks: Delay in building deposit base, unfavorable political intervention.
Key Triggers: Execution and credit risk monitoring, positive news on scaling up advances
and deposits base
Sensitivity to Key Variables % Change % Impact on EPS
Net Interest Income 10 % 26.0 %
Provisioning Costs 10 % -3.0 %
ERoE Valuations & Assumptions
Rf Ke Term. Growth RoE in Terminal Yr
7.2% 14.4% 5% 16.6%
- FY16A FY17-21E FY22-26E FY27-36E
NII Growth 81.5 % 15.3 % - -
NIM (%) 12.3 % 9.0 % - -
Adj EPS 20.1 24.2 68.0 373.7
Adj RoE (%) 18.9 % 11.9 % 16.1 % 19.6 %
-
Years of strong growth 1 5 10 20
Valuation as on date (Rs) 139 107 205 319
Valuation as of Mar‟17 151 116 223 347
Our Sep‟17 target price of Rs. 372 is based on ERoE valuation assuming 20 years of high
growth with average RoE of 16.4% and Cost of Equity of 14.4% implying FY17E P/ABV of
2.2x.
Company Description:
Incorporated in 2005, Ujjivan Financial Services Ltd (Ujjivan) is a Bangalore
headquartered microfinance company which has been granted a small banking license by
RBI in 2015. In addition to microfinance loans, the company also provides MSE financing
and housing loans. As on March 31st, 2016, the firm has a distribution network of 469
branches across 24 states UTs. Its promoter – Mr Samit Ghosh – holds a 0.9% stake at
present.
Comparable valuationMkt Cap
Rs. Mn.
Price
Target
Target
Date
EPS P/E BPS P/B RoE Div Yield
Company Reco. CMP FY16A FY17E FY18E FY16A FY17E FY18E FY16A FY17E FY16A FY17E FY18E FY16A FY17E
UJJIVAN SHORT 451 53,291 372 Sep '17 20.1 20.2 18.1 22.4 22.3 24.9 118.8 2.6 19 % 14 % 10 % 0.1 % 0.2 %
EQUITAS SHORT 176 59,110 142 Sep '17 6.2 7.0 5.8 28.5 25.2 30.4 47.9 2.7 13 % 13 % 8 % 0.0 % 0.5 %
BHAFIN NA 784 99,884 NA NA 23.9 44.5 50.9 33.0 17.6 15.4 108.6 4.9 25 % 34 % 26 % 0.0 % 0.4 %

Ujjivan Financial Services Absolute – SHORT Relative – UNDERWEIGHT 18% downside in 14 Months
August 16, 2016 Analyst: Anirvan Sarkar [email protected] (+91-79-61909526) Page 38 of 63
Investment Rationale
Microfinance to remain core business and individual lending to remain the smaller part
At present, microfinance constitutes 87% of Ujjivan‟s gross AUMs and the rest is
contributed by individual loans. The company plans to have 50% of its loan book in
individual lending by FY22E. However, Ujjivan does not have any proven track record of
being able to scale up its individual lending book without breaching healthy NPA levels.
Although individual lending has grown at a CAGR of 147% from a low base between FY13-
16, microfinance remains their core strength. We remain cautious on their ability to grow
their individual lending book, especially during the transition phase, and estimate that by
FY22E microfinance should constitute ~60% of gross AUMs and individual lending should
contribute to 40% of the AUMs. Thus even post conversion to bank, Ujjivan will largely
remain dependent on microfinance.
1. Microfinance AUMs have limited room for growth, addressable marketis smaller than what headline numbers reflect:
a) Addressable market in microfinance indicates limited room for healthy growth:
Between FY13-16, Microfinance industry AUMs have grown at a CAGR of 66% while
Ujjivan has grown its microfinance AUMs at a CAGR of 63%. While industry AUMs are
expected to grow at a 30% CAGR for the next few years, we estimate the
“addressable” microfinance market removing very low income/poor/below poverty
level sections which cannot be addressed by microfinance for the business to be
viable.
Exhibit 1 shows income distribution in India as of 2015. From the different
income groups shown, the total targetable households for microfinance in India
are the middle and low income groups, i.e. a total of 164mn households. Since
microfinance targets economically active women only, not all of these
households can be targeted, which further reduces the targetable market size.
We make a bullish assumption that ~75% of these households constitute the
target market for microfinance, which comes to ~120mn households and assume
this number holds for FY16.
Exhibit 1: Income distribution in India (FY15)
Classification Monthly income (Rs '000) No of households (in mn)
Rich 93 2
High income 30 53
Middle income 13 82
Low income 7.5 82
Poor 3.5 56
Total 275
Source: CMIE report
The FY16 average ticket size for microfinance in India was Rs. 17.8K. We estimate that
sustainable healthy ticket size growth per year can be up to 10%, marginally above GDP
growth rate and inflation. As shown in exhibit 3, for microfinance industry gross AUMs to
grow at 30% CAGR for the next 5 years, industry penetration would have to go up from
25% in FY16 to 53% in FY21E and 98% in FY25E. This is not feasible for the industry, as it
would need to penetrate remote rural areas where economies of scale cannot be
achieved. This only implies that the present growth spurt witnessed in the last few years
cannot be sustained much longer. For urban and semi-urban focused companies like
Ujjivan, growth would be an additional challenge as a large part of the targetable market
is based in rural India.
We estimate Ujjivan‟s microfinance gross AUMs will grow at ~22% CAGR between FY16
and FY22E to Rs. 154.8bn in FY22E. We see their continued high dependence on
microfinance as a risk to both growth as well as asset quality as achieving this growth is
dependent on a limited opportunity market and any attempt to grow beyond the
economically viable market will translate into future NPAs.
b) Microfinance crises in the past have been preceded by periods of aggressive
growth causing NPA spikes: India‟s past microfinance crises (Karnataka (FY09) and
A.P (FY10)) were preceded by periods of aggressive AUM growth, leading to
overleveraging and subsequent building up of uncontrollable NPAs. Post the A.P.
crises, MFI AUM growth was muted till FY13 post which MFI AUMs have grown at a
66% CAGR between FY13-FY16 fueled by equity infusion by PE/VC funds, and with
increased investor interest in the industry as well as banks entering into
microfinance lending, this will lead to overleveraging which will cause asset quality
crisis.

Ujjivan Financial Services Absolute – SHORT Relative – UNDERWEIGHT 18% downside in 14 Months
August 16, 2016 Analyst: Anirvan Sarkar [email protected] (+91-79-61909526) Page 39 of 63
Exhibit 2: Projected growth in Ujjivan’s Microfinance Gross AUMs
Source: Company filings, Equirus Securities
Exhibit 3: Growth in Microfinance Industry penetration with AUM growth
FY16 FY17E FY18E FY19E FY20E FY21E FY22E FY23E FY24E FY25E
Total addressable households (mn) 120 122 124 125 127 129 131 133 135 137
Household growth 1.5% 1.5% 1.5% 1.5% 1.5% 1.5% 1.5% 1.5% 1.5%
Average ticket size (Rs) 17,805 19,586 21,544 23,698 26,068 28,675 31,543 34,697 38,167 41,983
Addressable market size (Rs bn) 2,137 2,386 2,663 2,974 3,320 3,707 4,139 4,621 5,159 5,760
Present households/customers (mn) 32 0 0 0 0 0 0 0 0 0
Present market size 530 689 896 1,164 1,514 1,968 2,558 3,326 4,323 5,620
Y-o-y growth in market size 30% 30% 30% 30% 30% 30% 30% 30% 30%
Market penetration 25% 29% 34% 39% 46% 53% 62% 72% 84% 98%
Source: CMIE, Equirus Securities
29,313.0
46,947.9
58,684.867,487.6
76,935.8
92,323.0
1,18,173.4
1,54,807.2
0.0
20,000.0
40,000.0
60,000.0
80,000.0
1,00,000.0
1,20,000.0
1,40,000.0
1,60,000.0
1,80,000.0
FY15 FY16 FY17E FY18E FY19E FY20E FY21E FY22E
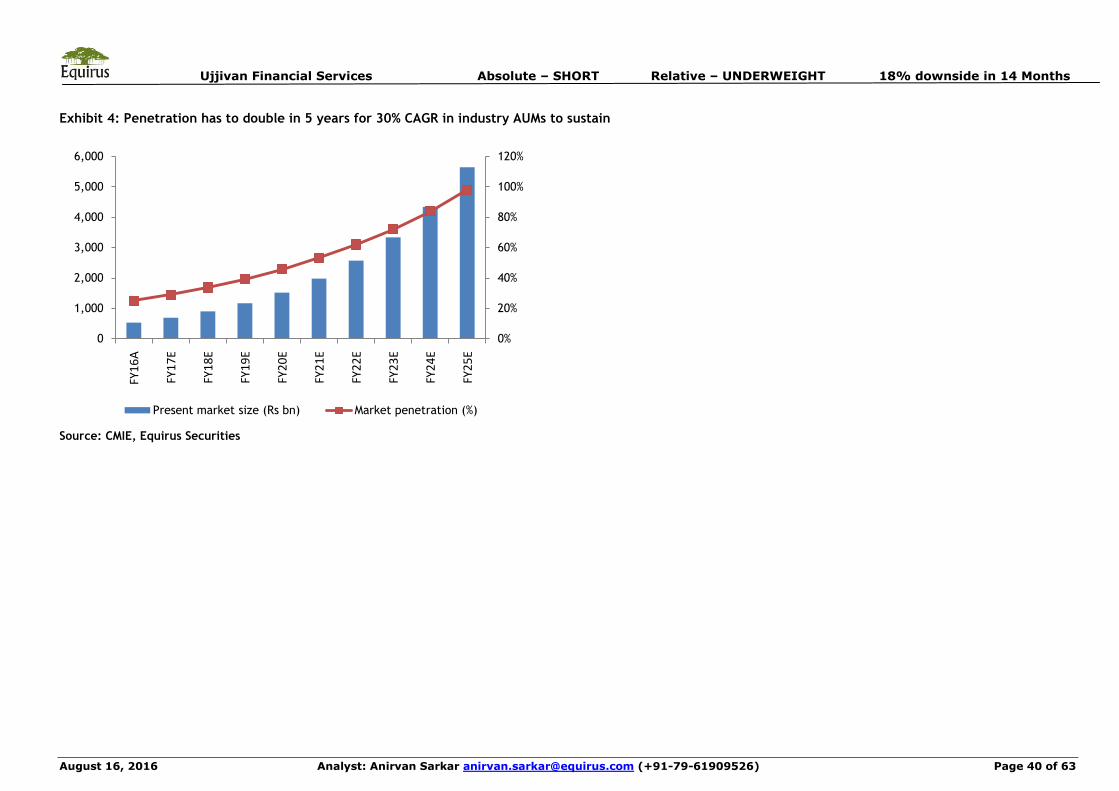
Ujjivan Financial Services Absolute – SHORT Relative – UNDERWEIGHT 18% downside in 14 Months
August 16, 2016 Analyst: Anirvan Sarkar [email protected] (+91-79-61909526) Page 40 of 63
Exhibit 4: Penetration has to double in 5 years for 30% CAGR in industry AUMs to sustain
Source: CMIE, Equirus Securities
0%
20%
40%
60%
80%
100%
120%
0
1,000
2,000
3,000
4,000
5,000
6,000
FY1
6A
FY1
7E
FY1
8E
FY1
9E
FY2
0E
FY2
1E
FY2
2E
FY2
3E
FY2
4E
FY2
5E
Present market size (Rs bn) Market penetration (%)
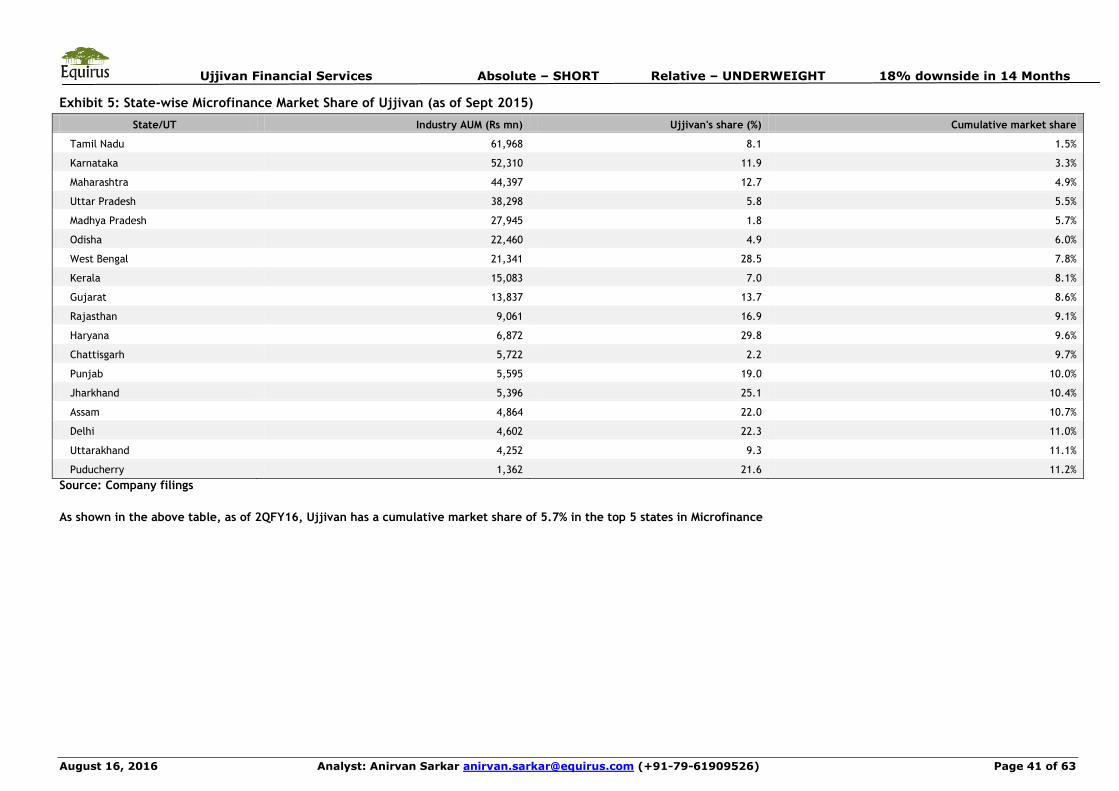
Ujjivan Financial Services Absolute – SHORT Relative – UNDERWEIGHT 18% downside in 14 Months
August 16, 2016 Analyst: Anirvan Sarkar [email protected] (+91-79-61909526) Page 41 of 63
Exhibit 5: State-wise Microfinance Market Share of Ujjivan (as of Sept 2015)
State/UT Industry AUM (Rs mn) Ujjivan's share (%) Cumulative market share
Tamil Nadu 61,968 8.1 1.5%
Karnataka 52,310 11.9 3.3%
Maharashtra 44,397 12.7 4.9%
Uttar Pradesh 38,298 5.8 5.5%
Madhya Pradesh 27,945 1.8 5.7%
Odisha 22,460 4.9 6.0%
West Bengal 21,341 28.5 7.8%
Kerala 15,083 7.0 8.1%
Gujarat 13,837 13.7 8.6%
Rajasthan 9,061 16.9 9.1%
Haryana 6,872 29.8 9.6%
Chattisgarh 5,722 2.2 9.7%
Punjab 5,595 19.0 10.0%
Jharkhand 5,396 25.1 10.4%
Assam 4,864 22.0 10.7%
Delhi 4,602 22.3 11.0%
Uttarakhand 4,252 9.3 11.1%
Puducherry 1,362 21.6 11.2%
Source: Company filings
As shown in the above table, as of 2QFY16, Ujjivan has a cumulative market share of 5.7% in the top 5 states in Microfinance

Ujjivan Financial Services Absolute – SHORT Relative – UNDERWEIGHT 18% downside in 14 Months
August 16, 2016 Analyst: Anirvan Sarkar [email protected] (+91-79-61909526) Page 42 of 63
2. Strong presence in MSE clusters and increased focus on higher ticket
loans to help MSE lending growth, execution remains the key risk:
a) Cluster overlap provides growth opportunity: Ujjivan‟s MSE financing portfolio
is expected to witness healthy growth led by multiple tax benefits for MSEs.
From exhibit 7, we note that Ujjivan has 39% of its branches in the top 5 states,
and 64% of its branches in the top 10 states with the largest number of MSME
enterprises (refer exhibit 28 in annexure for complete data on state-wise MSME
enterprises in India). The geographical advantage is positive for the bank to
scale up its MSE lending business.
b) Ticket size has room for growth, will boost AUM growth: Ujjivan‟s present MSE
loan ticket size is between Rs. 50K – Rs. 0.2mn (average Rs. 65K, micro
enterprises), their next focus areas is higher ticket size loans of Rs. 0.2mn – 1mn
and Rs. 1mn – 2mn targeting small enterprises. The company is introducing 5
additional MSE loan products (both secured and unsecured) to cater to micro and
small enterprises. The MSE lending vertical thus has scope for growth from both
customer addition as well as ticket size growth.
c) Bank credit growth points to healthy growth MSE financing: Bank credit to MSE
segment has grown much more compared to medium and large enterprises
(exhibit 6), reflecting that number of micro and small enterprises has grown and
hence the market opportunity for financiers is more for the micro and small
enterprises compared to medium.
d) Execution remains the key risk: Ujjivan‟s individual lending portfolio is at a
nascent stage and growing this segment maintaining asset quality while
transforming to a bank will be a challenge that Ujjivan hasn‟t demonstrated it
can deliver on. The present valuations factor in immaculate execution but we
remain cautious on this front.
e) We expect Ujjivan will grow its MSE lending book at a 51% CAGR from FY16 to
FY22E to Rs. 32.19bn.
f) Multiple tax incentives for the MSME segment to encourage “Make in India”:
Under section 44AD of Income Tax Act, MSME units having gross receipts of up to
Rs. 20mn (earlier limit was Rs. 10mn) don‟t need to maintain detailed books of
accounts and get them audited. This will benefit 3.5mn MSME units.
Under the same Income tax section, the gross receipt limit for professionals has
been raised from the existing level of Rs. 2.5mn to Rs. 5mn to be exempt from
account keeping and audit.
On taxation, income tax rate for an MSME unit whose turnover does not exceed
Rs. 50mn has been lowered to 29% from 30%.
As part of „Make in India Program‟, start-up unit profits will be tax exempt for 3
out of 5 years during Apr‟16 to Mar‟21.
Capital gains will not be taxed if invested in regulated / notified funds even if
invested by individuals in notified start-ups.
Suitable changes have been made in customs and excise duty structure on
certain inputs, raw materials, intermediaries and components to reduce costs
and improve competitiveness. These moves are expected to encourage more
capacity expansion and job creation in this segment.
These incentives are expected to boost MSME growth in the country and will enhance
financing needs, creating more opportunities for Ujjivan.
Exhibit 6: Growth in Bank credit to MSME sub-segments
Rs million Mar'08 Mar'09 Mar'10 Mar'11 Mar'12 Mar'13 Mar'14 Mar'15
Micro & Small enterprises
1,327 1,690 2,064 2,102 2,367 2,843 3,482 3,800
yoy growth NA 27% 22% 2% 13% 20% 22% 9%
Medium enterprises 1,108 1,222 1,326 1,165 1,248 1,247 1,241 1,245
yoy growth NA 10% 9% -12% 7% 0% -1% 0%
Total 2,435 2,912 3,390 3,267 3,614 4,091 4,723 5,046
Source: RBI
Exhibit 7: Top 10 states in India by number of MSME enterprises
% of total MSME enterprises Ujjivan branches
Uttar Pradesh 12% 4%
West Bengal 10% 11%
Tamil Nadu 9% 12%
Maharashtra 8% 12%
Andhra Pradesh 7% 0%
Kerala 6% 3%
Gujarat 6% 7%
Karnataka 6% 13%
Madhya Pradesh 5% 3%
Total 70% 64%
Source: MFIN report FY15, company filings
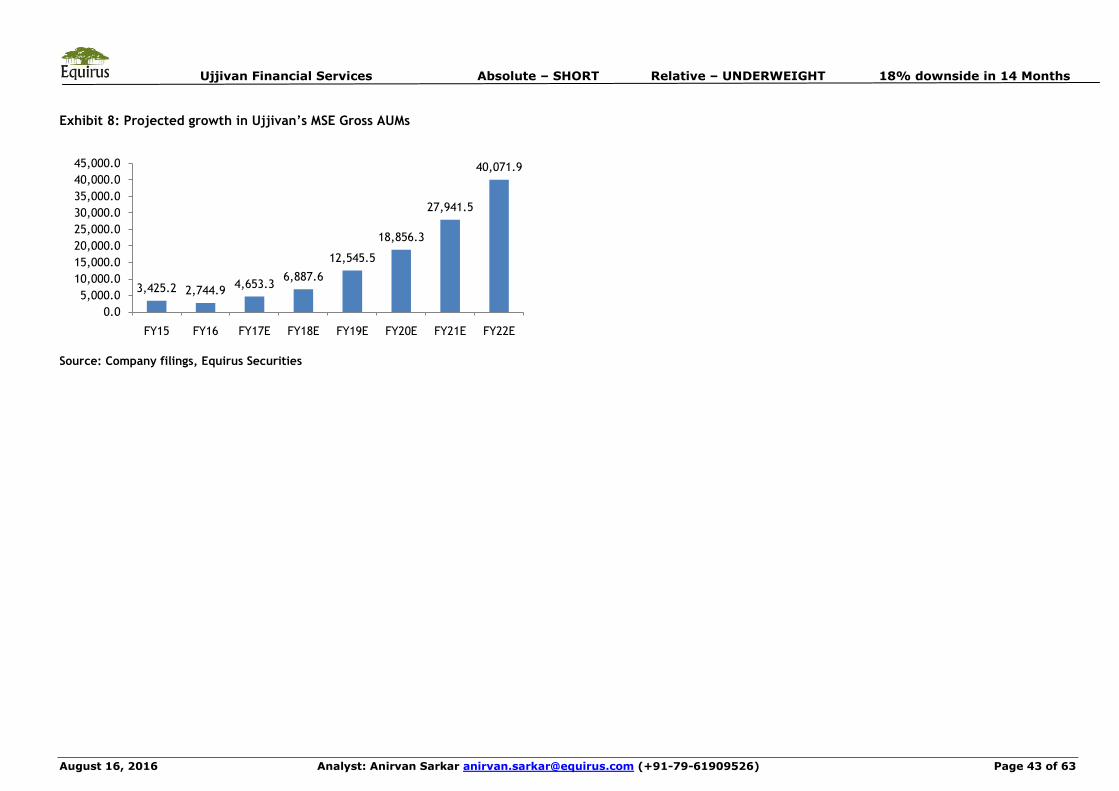
Ujjivan Financial Services Absolute – SHORT Relative – UNDERWEIGHT 18% downside in 14 Months
August 16, 2016 Analyst: Anirvan Sarkar [email protected] (+91-79-61909526) Page 43 of 63
Exhibit 8: Projected growth in Ujjivan’s MSE Gross AUMs
Source: Company filings, Equirus Securities
3,425.2 2,744.94,653.3
6,887.6
12,545.5
18,856.3
27,941.5
40,071.9
0.0
5,000.0
10,000.0
15,000.0
20,000.0
25,000.0
30,000.0
35,000.0
40,000.0
45,000.0
FY15 FY16 FY17E FY18E FY19E FY20E FY21E FY22E

Ujjivan Financial Services Absolute – SHORT Relative – UNDERWEIGHT 18% downside in 14 Months
August 16, 2016 Analyst: Anirvan Sarkar [email protected] (+91-79-61909526) Page 44 of 63
3. Presence in states with affordable housing projects in progress
provides first mover advantage, larger part of portfolio being
unsecured housing adds to asset quality risk:
As shown in exhibits 11 and 12, Ujjivan enjoys a good branch network in the top
10 states where affordable housing in partnership (AHP) under PMAY has taken
off, as well as the states where projects under Beneficiary Led Construction
Scheme (BLCS) have started. The strategic positioning places them in a sweet
spot to cater to increased housing finance demand in these states.
a) CLSS implementation boosting affordable housing growth, but bulk of housing
book in unsecured lending poses significant asset quality risk: Our channel
checks indicate that the implementation of CLSS under PMAY has been swift,
and housing finance companies as well as banks have seen a surge in demand
driven by the scheme. Due to supply shortage in urban areas/Tier 1/metro
cities, housing finance providers in Tier 2/3 cities and sub-urban/rural areas
would benefit the most from the increased demand which is expected to
continue for the next few years.
Ujjivan stands to benefit from this affordable housing boom. At present, they
have 3 housing finance products with ticket sizes of Rs. 51K – 0.15mn, Rs. 0.2mn
– 0.5mn and Rs. 0.5mn - 1mn. This leaves room for ticket size growth along with
volume growth. We estimate Ujjivan‟s housing portfolio will grow at a CAGR of
59% between FY16 and FY22E to reach Rs. 39.9bn (~15% of total gross AUMs).
b) Absence in AP/Telengana blocks out 35% of affordable housing opportunities
in AHP: A.P. and Telengana together account for 35%/47% (exhibit 11) of project
cost/number of projects of affordable housing in partnership projects. Absence
in these 2 states reduces the potential housing finance market for Ujjivan.
c) Risk from high proportion of low ticket unsecured loans: In FY16, Ujjivan‟s
total housing finance portfolio of Rs. 2.5bn consisted of only Rs. 206.9mn of
secured lending, while the rest of the portfolio comprised of unsecured housing
which poses asset quality risk. Historically small ticket housing finance loans
have had more NPAs compared to larger ticket loans for the banking industry,
and the situation has worsened in recent quarters with PSU banks reporting a
doubling of NPAs in the last 5 years for housing loans < Rs. 0.2mn which has
historically had higher NPAs than larger ticket secured loans.
Exhibit 9: Projected growth in Ujjivan’s Gross AUMs in housing
Source: Company filings, Equirus Securities
Exhibit 10: Gross AUM split – Individual lending will grow to 40% of total AUM
by FY22E
Source: Company filings, Equirus Securities
2,501.5 3,525.1 4,967.47,000.0
12,501.0
22,325.2
39,869.7
0.0
5,000.0
10,000.0
15,000.0
20,000.0
25,000.0
30,000.0
35,000.0
40,000.0
45,000.0
FY16 FY17E FY18E FY19E FY20E FY21E FY22E
87% 84% 80% 73% 68% 63% 60%
5.0% 6.6% 8.2%11.9%
13.8%14.8%
15.1%
4.6% 5.0% 5.9% 6.7% 9.2% 11.8% 15.0%
3.0% 4.4% 5.4% 7.9% 9.1% 9.8% 9.9%
0%
20%
40%
60%
80%
100%
FY16 FY17E FY18E FY19E FY20E FY21E FY22E
Group lending MSE lending
Housing finance Agri and Animal husbandry
Others
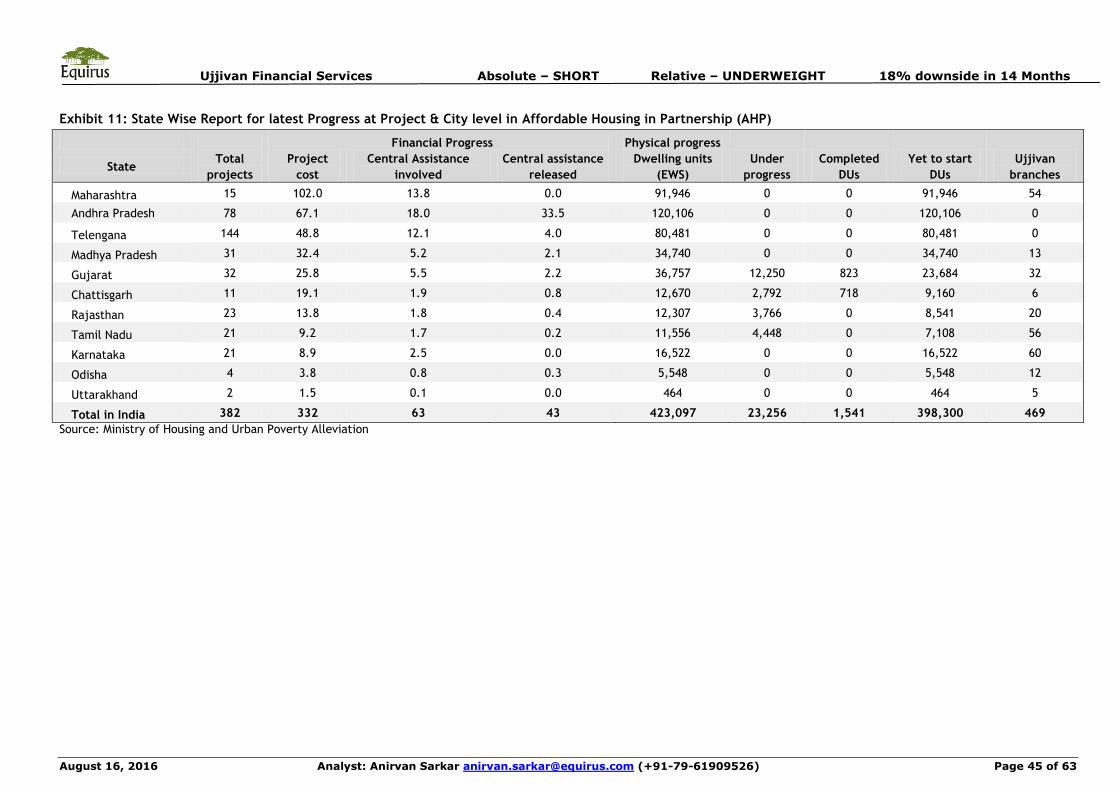
Ujjivan Financial Services Absolute – SHORT Relative – UNDERWEIGHT 18% downside in 14 Months
August 16, 2016 Analyst: Anirvan Sarkar [email protected] (+91-79-61909526) Page 45 of 63
Exhibit 11: State Wise Report for latest Progress at Project & City level in Affordable Housing in Partnership (AHP)
Financial Progress Physical progress
StateTotal
projects
Project
cost
Central Assistance
involved
Central assistance
released
Dwelling units
(EWS)
Under
progress
Completed
DUs
Yet to start
DUs
Ujjivan
branches
Maharashtra 15 102.0 13.8 0.0 91,946 0 0 91,946 54
Andhra Pradesh 78 67.1 18.0 33.5 120,106 0 0 120,106 0
Telengana 144 48.8 12.1 4.0 80,481 0 0 80,481 0
Madhya Pradesh 31 32.4 5.2 2.1 34,740 0 0 34,740 13
Gujarat 32 25.8 5.5 2.2 36,757 12,250 823 23,684 32
Chattisgarh 11 19.1 1.9 0.8 12,670 2,792 718 9,160 6
Rajasthan 23 13.8 1.8 0.4 12,307 3,766 0 8,541 20
Tamil Nadu 21 9.2 1.7 0.2 11,556 4,448 0 7,108 56
Karnataka 21 8.9 2.5 0.0 16,522 0 0 16,522 60
Odisha 4 3.8 0.8 0.3 5,548 0 0 5,548 12
Uttarakhand 2 1.5 0.1 0.0 464 0 0 464 5
Total in India 382 332 63 43 423,097 23,256 1,541 398,300 469
Source: Ministry of Housing and Urban Poverty Alleviation

Ujjivan Financial Services Absolute – SHORT Relative – UNDERWEIGHT 18% downside in 14 Months
August 16, 2016 Analyst: Anirvan Sarkar [email protected] (+91-79-61909526) Page 46 of 63
Exhibit 12: State Wise Report for latest Progress at Project & City level in Beneficiary Led Construction Scheme (BLCS)
Financial Progress Physical progress
State Total projects Project cost
Central
Assistance
involved
Central
assistance
released
Houses
involved
Under
progress
Completed
Houses
Yet to start
Houses
Ujjivan
branches
Maharashtra 2 3.3 1.1 0.0 7,399 0.0 0.0 7,399 54
Andhra Pradesh 32 38.7 11.0 0.0 73,041 0.0 0.0 73,041 0
Bihar 85 12.5 4.5 1.8 30,216 0.0 0.0 30,216 24
Madhya Pradesh 12 4.1 1.1 0.4 7,297 0.0 0.0 7,297 13
Mizoram 8 2.1 1.5 0.1 10,286 0.0 0.0 10,286 0
Himachal Pradesh 17 1.0 0.3 0.1 1,914 0.0 0.0 1,914 1
J&K 4 0.2 0.1 0.0 683 0.0 0.0 683 0
Jharkhand 38 7.3 3.0 1.2 20,239 0.0 0.0 20,239 15
Tamil Nadu 185 6.9 4.0 1.2 26,978 9,637 104 17,237 56
Kerala 14 2.6 1.3 0.0 9,299 0.0 0.0 9,299 12
Uttarakhand 19 0.8 0.3 0.1 2,293 0.0 0.0 2,293 5
West Bengal 108 30.3 11.2 0.9 74,880 6,888.0 0.0 67,992 52
Total in India 524 110 40 6 264,525 16,525 104 247,896 232
Source: Ministry of Housing and Urban Poverty Alleviation

Ujjivan Financial Services Absolute – SHORT Relative – UNDERWEIGHT 18% downside in 14 Months
August 16, 2016 Analyst: Anirvan Sarkar [email protected] (+91-79-61909526) Page 47 of 63
Asset quality faces risk from high exposure to microfinance and
high proportion of unsecured housing finance, geographical
spread provides partial comfort against segment concentration
risk
Ujjivan‟s GNPA/NNPA ratios stand at 0.15%/0.04% for the total portfolio against the
industry average of 0.2%. As they scale up their individual lending business and transform
into a bank, NPAs are expected to go up due to 1) higher ticket sizes and 2) tighter
recognition policy applicable to banks.
a) Diversified asset base to buffer against event driven downturns: Ujjivan
enjoys a unique geographical diversity as its loan book is spread across 24 states
in India and 209 districts. As shown in exhibit 13, no single state accounts for
more than 15.2% of gross AUM. The diversification will help them maintain asset
quality even if the economic situation turns unfavorable in any particular state.
Exhibit 13: State-wise contribution of gross AUM, no state accounts for more than 15.2% of total gross AUM
State FY11 FY12 FY13 FY14 FY15 9M16
Karnataka 23.9% 21.9% 18.4% 17.2% 16.5% 15.2% West Bengal 13.8% 13.3% 13.5% 14.3% 14.8% 14.9% Maharashtra 11.9% 11.6% 11.6% 12.7% 13.4% 13.8% Tamil Nadu 11.1% 9.5% 9.3% 11.5% 12.3% 12.3% Uttar Pradesh 5.9% 6.8% 7.5% 6.2% 5.5% 5.5% Haryana 2.7% 4.2% 5.2% 5.0% 5.0% 5.0% Gujarat 2.6% 2.9% 3.0% 3.5% 4.0% 4.6% Bihar 4.4% 4.7% 5.2% 4.9% 4.3% 4.1% Rajasthan 5.8% 5.5% 5.8% 4.8% 3.9% 3.7% Jharkhand 5.6% 4.9% 4.5% 3.9% 3.4% 3.3% Orissa 3.3% 2.5% 2.1% 2.3% 2.5% 2.7%
Assam 1.1% 2.0% 2.2% 2.0% 2.2% 2.6%
Punjab 0.2% 0.6% 1.5% 2.1% 2.3% 2.6% Kerala 1.1% 1.9% 2.7% 3.1% 2.8% 2.6% New Delhi 4.3% 5.1% 4.5% 3.6% 2.9% 2.5% Madhya Pradesh 0.0% 0.0% 0.0% 0.3% 1.2% 1.2% Uttarakhand 1.5% 1.3% 1.5% 1.3% 1.0% 1.0% Tripura 0.0% 0.0% 0.0% 0.0% 0.6% 0.8% Pondicherry 0.4% 0.5% 0.5% 0.6% 0.8% 0.7% Meghalaya 0.4% 0.5% 0.5% 0.4% 0.3% 0.3% Chhattisgarh 0.0% 0.0% 0.0% 0.0% 0.2% 0.3% Chandigarh 0.3% 0.3% 0.4% 0.3% 0.2% 0.3% Goa 0.1% 0.1% 0.1% 0.1% 0.1% 0.1%
Himachal Pradesh 0.0% 0.0% 0.0% 0.0% 0.1% 0.1%
Total 100% 100% 100% 100% 100% 100%
Source: Company filings
b) Microfinance AUMs are vulnerable to cyclical corrections, high concentration
in microfinance a risk to the business: While there are no immediate threats to
Ujjivan‟s microfinance portfolio asset quality, we remain cautious on asset
quality of the microfinance sector as a whole as economic downturns cause NPAs
to spike, and group defaults are a common phenomenon. The past 3
microfinance crises in India (Krishna (FY06), Karnatak (FY09) and A.P. (2010)
were preceded by periods of high AUM growth backed by equity infusion by
VC/PEs, and at present we are witnessing a similar supernormal growth for the
sector backed by increased investor interest and fund inflows. While Ujjivan has
strong systems and processes in place, the next few years will be a challenge as
they focus on transformation into a bank, and simultaneously try to grow their
individual lending book.
c) Large unsecured housing book adds to asset quality risk in individual lending:
Out of Ujjivan‟s Rs. 2.5bn of housing finance book only 8% (Rs. 206.9mn) consists
of secured housing and the rest is small ticket unsecured housing, a sector which
has historically had much higher NPAs compared to higher ticket housing loans.
This trend has worsened in recent quarters.
PSU banks have reported FY16 NPAs of ~12% for small housing loans up to Rs.
0.2mn, compared to ~6% in FY11
FY16 NPAs in home loans with ticket size between Rs. 0.2mn – 0.5mn were ~3.4%
Exhibit 14: NPAs in small-ticket housing loans for select PSUs in FY16
Bank FY16 NPA in housing loans < Rs 0.2mn
Andhra Bank 51.9%
UCO Bank 41.8%
Syndicate Bank 36.9%
Indian Overseas Bank 30.8%
Bank of Baroda 21.0%
In line with the company‟s goal, we estimate Ujjivan will have ~15% of FY22E gross
AUMs in housing. This is very high exposure to a risky sector that we are cautious on
and we expect Ujjivan‟s NPAs to spike in later years even though they have the best-in-
class asset quality in their existing overall book.
d) Proactive recognition and provisioning policies will avoid buildup of stressed
assets: Ujjivan has stringent early trigger and recognition practices that enable quick

Ujjivan Financial Services Absolute – SHORT Relative – UNDERWEIGHT 18% downside in 14 Months
August 16, 2016 Analyst: Anirvan Sarkar [email protected] (+91-79-61909526) Page 48 of 63
corrective action. They also have a pro-active provisioning policy, so they provide for
~2% of standard assets although RBI requires them to provide for 1%. Ujjivan has a more
stringent provisioning policy compared to Equitas as shown in the exhibit 15.
Exhibit 15: Comparison of provisioning policy for Ujjivan and Equitas
Ujjivan Equitas
Standard Assets*
Standard asset provisioning including 1-7
days is the balancing figure to maintain 1%
on general loan portfolio and 2% on
individual loan portfolio
1.25%
Non-Performing Assets
(NPA)
a. Sub-Standard Assets
i. Overdue for 30 days and
more but less than 60 days20% 10%
ii. Overdue for 60 days and
more but less than 90 days50% 25%
b. Doubtful Assets
iii. Doubtful Assets –
Overdue for 90 days and
more but less than 180 days
(120 days for Equitas)
80% 50%
iv. Doubtful Assets – Overdue
for 180 days and more100% 100%
Loss Assets 100% 100%
Source: Company filings
Exhibit 16: NPAs trending up as a result of entry into new businesses, will
spike in the medium term and stabilization will take time
Source: Company filings
0.00%
0.50%
1.00%
1.50%
2.00%
2.50%
FY15 FY16 FY17E FY18E FY19E
GNPA NNPA
Ujjivan Financial Services Absolute – SHORT Relative – UNDERWEIGHT 18% downside in 14 Months
August 16, 2016 Analyst: Anirvan Sarkar [email protected] (+91-79-61909526) Page 49 of 63
Margin impact will be significant due to SFB transformation, NIM (including off balance sheet) will reduce to 6.8% by FY22E
Ujjivan is one of the 8 microfinance companies which were granted small banking
licenses by RBI in 2015. They aim to be operational by beginning of CY17, and RBI
guidelines mandate them to list the SFB separately within 3 years of commencement of
operations, prior to which they would look to merge the holding company and the bank.
Pace of deposit building an unprecedented challenge: Once Ujjivan transforms into a
bank, they would be required to comply with SLR/CRR guidelines by RBI, which are
21.25%/4.0% post the 9th August 2016 monetary policy announcement. Their yield on
assets is expected to decline owing to lower yields on mandatory regulatory assets. While
the company intends to change its funding mix to replace term loans with money market
instruments (CP, CD, NCD) the challenge would be to raise deposits, especially CASA,
without which cost of funds will not come down meaningfully, reducing NIMs and return
ratios.
Deposit building will take time and NIMs will be impacted in the interim period:
Ujjivan aims to have 60% of its loan book funded by deposits by 2022. Their strategy is to
garner 40% of target deposit base from existing customers, and raise wholesale deposits
to fund the remaining 60%. Post that, they intend to refinance the wholesale deposits
with cheaper small ticket retail term deposits and CASA which will bring the cost of funds
further down.
This strategy has several challenges.
The existing customer base of MFI companies does not have enough savings to
provide sizeable deposits to Ujjivan. For very low balance accounts technology
costs often surpass the benefit to cost of funds. Hence contribution of existing
customers to deposits should be limited.
In the absence of suitable contribution from customers, Ujjivan would need to
raise wholesale deposits whose cost would be more than retail deposits
For both retail and wholesale deposits, the cost of deposits has to be higher
than that of banks to attract customers. Thus any meaningful benefit to cost of
funds will come only after deposit base is large and granular enough to reduce
pricing without losing customers.
No dedicated liability locations, fewer banking branches will mean sluggish deposit
growth: Ujjivan is opening 80 new bank branches and converting 200 of its existing
branches into bank branches, so that out of a total of 550 branches 280 will be bank
branches. Moreover, there has been no mention of separate liability locations for these
branches, which means liability building will remain a bigger challenge for Ujjivan
compared to Equitas.
We remain cautious on our assumptions about the pace of building deposits and assume
that 30% of loans and advances can be funded by deposits by FY22E. We also remain
conservative on cost of deposits and assume that cost of deposits will be ~8% in FY22E, to
account for the risk that CASA buildup will take time. While the company has no intent of
lowering its lending rates, we still factor in a 290bps drop in yield on AUMs over the next
3 years to account for diversification of the portfolio and entry into secured lending, and
arrive at FY18E/FY19E NIMs of 9.5%/9.0% (including off balance sheet). We expect NIMs
will drop to 6.9% by FY22E
Rise in expenses will peak out in FY18E, thereafter credit costs will pick up
leading to RoAs stabilizing at ~1.9%
Ujjivan‟s CI ratio (51% in FY16) is expected to increase in the next few years due to
investments in opening branches, hiring manpower, technology expenses and channel
costs. The company plans to invest Rs. 3bn in technology over the next 5 years and open
80 additional branches by Mar‟17 so that they have 550 branches by end of FY17. They
also plan to convert 200 of their existing branches into bank branches.
CI ratio will peak at ~63% in FY18: The cost of upgrading a new branch is ~Rs. 1.5mn
(capitalized). The incremental opex involved in running a bank branch that has been
converted from an existing branch is ~Rs. 0.2 – 0.25mn. The present cost of running a
branch is Rs. 0.4 – 0.45mn, and post upgradation it should be ~Rs. 0.6 – 0.65mn.
As Ujjivan plans on completion of branch opening and conversion by 4QFY17E, we expect
to see the full year impact of incremental branch opex reflected in FY18E. However, the
benefit to asset growth will kick in gradually starting in FY19E, resulting in CI ratios
peaking in FY18E and coming down gradually. We build in CI ratios of 59%/63%/59% for
FY17E/18E/19E.

Ujjivan Financial Services Absolute – SHORT Relative – UNDERWEIGHT 18% downside in 14 Months
August 16, 2016 Analyst: Anirvan Sarkar [email protected] (+91-79-61909526) Page 50 of 63
Exhibit 17: Costs will peak out in FY18 before declining
Source: Company, Equirus Securities
Credit costs will pick up post FY18, RoA will stabilize at 1.9% - 2%: Even as opex peaks
out at FY18 and CI ratios improve starting FY19, credit costs will increase due to higher
NPAs in individual lending as well as lower recognition days and more stringent
provisioning requirements. Thus RoAs will not improve significantly post reducing to 2% in
FY18E, and will stabilize at ~1.9% - 2% in the later years. This can go down even further if
microfinance segment witnesses any cyclical correction by then.
RoEs will improve post bottoming out in FY18E with increasing leverage: Even though
RoA will not pick up meaningfully post declining in FY18E, RoE will pick up after FY18E as
leverage increases post conversion to a bank. We estimate RoE will increase to ~15.3% in
FY22E with a leverage of 8.3x
Exhibit 18: RoA will decline going ahead but increasing leverage will prop up
RoE
Source: Company filings, Equirus estimates
Valuations:
Ujjivan is trading at an FY16A P/ABV of 3.8x, which we believe prices in immaculate
execution on transition into a bank, no cyclical corrections in microfinance, controlled
asset quality and credit costs, healthy return ratios and does not factor in possible
difficulties in transition to bank, any cyclical correction in microfinance or regulatory
risks. In view of the valuation of old generation and new generation private banks, retial
NBFCs, housing finance companies and microfinance companies we believe Ujjivan needs
to prove its execution abilities to be awarded comparable multiples and the stock should
see correction in the near term. We arrive at a an ERoE based Sep‟17 valuation of Rs. 372
for the stock, assuming 20 years of high growth with average RoE of 16.4%, implying
FY17E P/ABV of 2.2x and initiate with a SHORT rating on the stock.
0%
10%
20%
30%
40%
50%
60%
70%
FY15 FY16 FY17E FY18E FY19E FY20E FY21E FY22E
Cost income ratio Cost to AUM
0.0%
1.0%
2.0%
3.0%
4.0%
5.0%
6.0%
0.0%
5.0%
10.0%
15.0%
20.0%
FY15 FY16 FY17E FY18E FY19E FY20E FY21E FY22E
RoE RoA

Ujjivan Financial Services Absolute – SHORT Relative – UNDERWEIGHT 18% downside in 14 Months
August 16, 2016 Analyst: Anirvan Sarkar [email protected] (+91-79-61909526) Page 51 of 63
Exhibit 19: P/B vs RoE for Housing finance companies
Source: Equirus Securities
Exhibit 20: P/B vs RoE for Large Private Sector banks
Exhibit 21: P/B vs RoE for Regional Pvt Sector Banks
Source: Equirus Securities
Exhibit 22: P/B vs RoE for NBFCs
y = 66.384x - 8.918R² = 0.632
-
2.0
4.0
6.0
8.0
10.0
12.0
14.0
16.0
0% 5% 10% 15% 20% 25% 30% 35%
FY
16 P
/B
FY17 RoE
2017 RoE to 2016 P/B
y = -13.796x + 6.8783R² = 0.1674
-
1.0
2.0
3.0
4.0
5.0
6.0
7.0
0% 5% 10% 15% 20% 25%
FY
16 P
/B
FY17 RoE
2017 RoE to 2016 P/B
y = 14.884x - 0.2017R² = 0.3986
0.0x
0.5x
1.0x
1.5x
2.0x
2.5x
3.0x
0% 2% 4% 6% 8% 10% 12% 14% 16% 18%
FY
16 P
/B
FY17 RoE
2017 RoE to 2016 P/B
y = 61.186x - 5.6923R² = 0.9134
0.0x
1.0x
2.0x
3.0x
4.0x
5.0x
6.0x
7.0x
8.0x
0% 5% 10% 15% 20% 25%
FY
16 P
/B
FY17 RoE
2017 RoE to 2016 P/B
Gruh Finance
Indiabulls Housing
DHFL
Repco Home
HDFC Ltd
Canfin Homes
Indusind Bank
Kotak BankYes Bank
HDFC Bank
DCB Bank
Federal Bank
South Indian Bank
Karur Vysya Bank
City Union Bank
Bajaj Finance
Sundaram Finance
Cholamandalam
M&m FinanceShriram Trans

Ujjivan Financial Services Absolute – SHORT Relative – UNDERWEIGHT 18% downside in 14 Months
August 16, 2016 Analyst: Anirvan Sarkar [email protected] (+91-79-61909526) Page 52 of 63
Exhibit 23: P/B vs RoE for Microfinance
Source: Equirus Securities
y = 17.975x + 1.0488R² = 0.9229
0.0x
1.0x
2.0x
3.0x
4.0x
5.0x
6.0x
7.0x
8.0x
0% 5% 10% 15% 20% 25% 30% 35% 40%
FY
16 P
/B
FY17 RoE
2017 RoE to 2016 P/B
Equitas
SKS Microfinance
Ujjivan
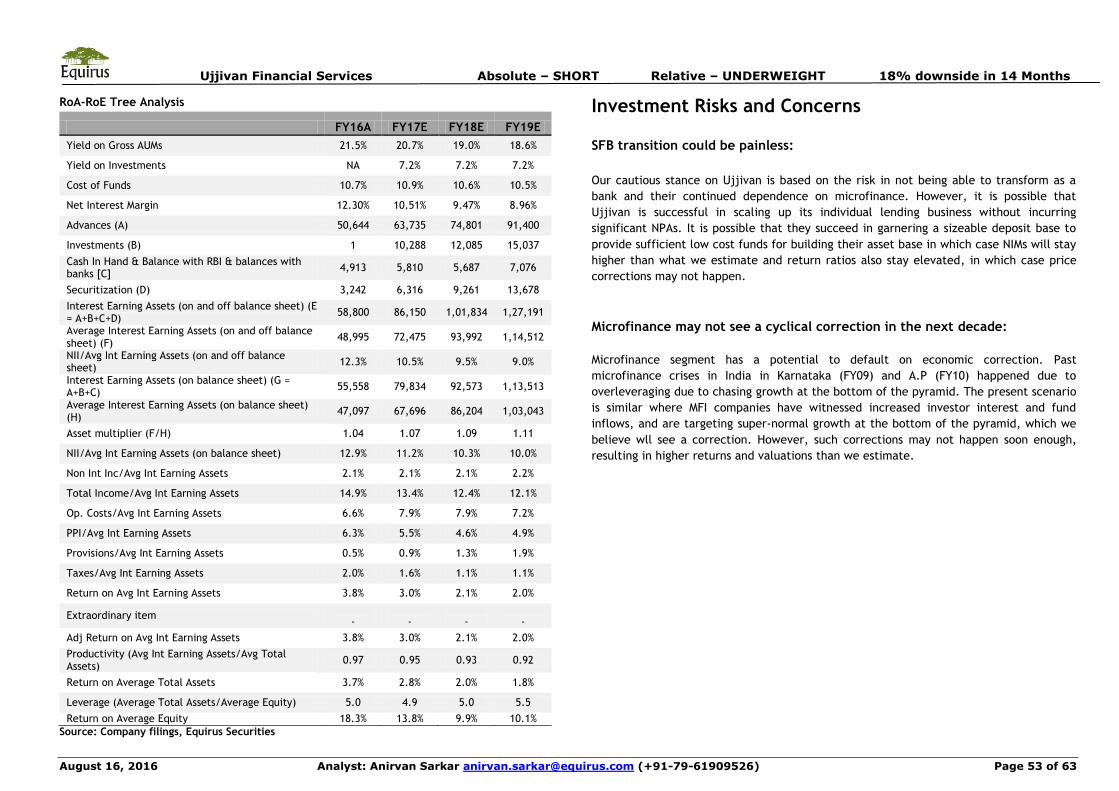
Ujjivan Financial Services Absolute – SHORT Relative – UNDERWEIGHT 18% downside in 14 Months
August 16, 2016 Analyst: Anirvan Sarkar [email protected] (+91-79-61909526) Page 53 of 63
RoA-RoE Tree Analysis
FY16A FY17E FY18E FY19E
Yield on Gross AUMs 21.5% 20.7% 19.0% 18.6%
Yield on Investments NA 7.2% 7.2% 7.2%
Cost of Funds 10.7% 10.9% 10.6% 10.5%
Net Interest Margin 12.30% 10.51% 9.47% 8.96%
Advances (A) 50,644 63,735 74,801 91,400
Investments (B) 1 10,288 12,085 15,037
Cash In Hand & Balance with RBI & balances with banks [C]
4,913 5,810 5,687 7,076
Securitization (D) 3,242 6,316 9,261 13,678
Interest Earning Assets (on and off balance sheet) (E = A+B+C+D)
58,800 86,150 1,01,834 1,27,191
Average Interest Earning Assets (on and off balance sheet) (F)
48,995 72,475 93,992 1,14,512
NII/Avg Int Earning Assets (on and off balance sheet)
12.3% 10.5% 9.5% 9.0%
Interest Earning Assets (on balance sheet) (G = A+B+C)
55,558 79,834 92,573 1,13,513
Average Interest Earning Assets (on balance sheet) (H)
47,097 67,696 86,204 1,03,043
Asset multiplier (F/H) 1.04 1.07 1.09 1.11
NII/Avg Int Earning Assets (on balance sheet) 12.9% 11.2% 10.3% 10.0%
Non Int Inc/Avg Int Earning Assets 2.1% 2.1% 2.1% 2.2%
Total Income/Avg Int Earning Assets 14.9% 13.4% 12.4% 12.1%
Op. Costs/Avg Int Earning Assets 6.6% 7.9% 7.9% 7.2%
PPI/Avg Int Earning Assets 6.3% 5.5% 4.6% 4.9%
Provisions/Avg Int Earning Assets 0.5% 0.9% 1.3% 1.9%
Taxes/Avg Int Earning Assets 2.0% 1.6% 1.1% 1.1%
Return on Avg Int Earning Assets 3.8% 3.0% 2.1% 2.0%
Extraordinary item - - - -
Adj Return on Avg Int Earning Assets 3.8% 3.0% 2.1% 2.0%
Productivity (Avg Int Earning Assets/Avg Total Assets)
0.97 0.95 0.93 0.92
Return on Average Total Assets 3.7% 2.8% 2.0% 1.8%
Leverage (Average Total Assets/Average Equity) 5.0 4.9 5.0 5.5
Return on Average Equity 18.3% 13.8% 9.9% 10.1%
Source: Company filings, Equirus Securities
Investment Risks and Concerns
SFB transition could be painless:
Our cautious stance on Ujjivan is based on the risk in not being able to transform as a
bank and their continued dependence on microfinance. However, it is possible that
Ujjivan is successful in scaling up its individual lending business without incurring
significant NPAs. It is possible that they succeed in garnering a sizeable deposit base to
provide sufficient low cost funds for building their asset base in which case NIMs will stay
higher than what we estimate and return ratios also stay elevated, in which case price
corrections may not happen.
Microfinance may not see a cyclical correction in the next decade:
Microfinance segment has a potential to default on economic correction. Past
microfinance crises in India in Karnataka (FY09) and A.P (FY10) happened due to
overleveraging due to chasing growth at the bottom of the pyramid. The present scenario
is similar where MFI companies have witnessed increased investor interest and fund
inflows, and are targeting super-normal growth at the bottom of the pyramid, which we
believe wll see a correction. However, such corrections may not happen soon enough,
resulting in higher returns and valuations than we estimate.

Ujjivan Financial Services Absolute – SHORT Relative – UNDERWEIGHT 18% downside in 14 Months
August 16, 2016 Analyst: Anirvan Sarkar [email protected] (+91-79-61909526) Page 54 of 63
Corporate Governance • The company has complied with the requirements of the applicable
regulations, including the SEBI Listing Regulations, the Companies Act, 2013 and
the SEBI ICDR Regulations, in respect of corporate governance including
constitution of the Board and committees thereof
• Currently the Board has 10 Directors including one Executive Director, nine
Non-Executive Directors including four Independent Directors. Board also
includes one woman Director
• The books of accounts of the company are audited by Statutory Auditors i.e.
Deloitte Haskins & Sells and Internal Auditors i.e. V Nagarajan & Co.
• The company in compliance with Section 177 of the Companies Act, 2013 has
established a Whistle Blower Policy/Vigil Mechanism for the directors and
employees to report genuine concerns or grievances about unethical behaviour,
actual or suspected fraud or violation of the company‟s Code of Conduct or
Ethics Policy
• No proceedings have been initiated against Company for economic offences
and no penalties have been imposed upon Company and Directors by statutory
or regulatory authorities
• There have been instances of discrepancies/non-compliance in relation to
certain filings made by Company with the RoC under applicable law. Company
have filed rectified forms with the RoC and the examination is yet to be done by
ROC
Key Management profile
Mr. Samit Ghosh, Managing Director and Chief Executive Officer
Samit Ghosh serves as MD and CEO in the Company. Mr. Ghosh was a career banker for 30 years and worked both in South Asia and the Middle East. He started his career with Citibank in 1975 and later worked with Standard Chartered Bank, HDFC Bank and the Bank Muscat. He holds MBA degree from the Wharton School of Business at the University of Pennsylvania. He was President of Microfinance Institutions Network and the chairman of AKMI and is a board member of Women's World Banking Capital Partners L.P
Ms. Sudha Suresh, Chief Financial Officer
Sudha Suresh is the CFO of the Company. She is a CA with a corporate career spanning over 18 years. During her association with Ujjivan, she was responsible for areas of strategic business planning and budgetary controls, treasury management, accounts and taxation, and management of board and regulatory compliances
Ms. Carol Furtado, Chief Operating Officer, South
Carol Furtado is the COO, South. She has been with Ujjivan since inception. She is a finance professional with over 20 years of experience, having worked in ANZ Grindlays and Bank Muscat. In 2009, she won the Financial Women's Association award in recognition of her demonstrated professional commitment from Women's World Bank.
Mr. Manish Raj, Chief Operating Officer, North
Manish Raj is the COO, North. Manish joined Ujjivan in 2010. Recently, in Oct 15, he was promoted to the position of COO – North region. He has completed post graduate diploma in rural management from Xavier Institute of Management, Bhubaneswar
Mr. Abhiroop Chatterjee, Chief Operating Officer, East
Abhiroop Chatterjee is the COO, East. He was promoted as COO – East region in April 14. He has a post graduate diploma in rural management from Xavier Institute of Management, Bhubaneswar.
Mr. Jolly Zachariah, Chief Operating Officer, West Jolly Zachariah is the COO, West since 08. He has over 22 years of banking experience with Citigroup. He has played an important role in establishing Ujjivan presence in urban Maharashtra and Gujarat.
Mr. Martin Pampilly, Head of Operations and Services Quality Mr. Pampilly has over 14 years of experience, including with companies such as ANZ Grindlays, Bank Muscat and Centurion Bank. He was a member of centralised operations unit at Centurion Bank. He joined Ujjivan in 2009 as regional operations manager (South), and managed the successful testing, training and implementation of the core banking project. He has successfully completed the strategic leadership program at Harvard in April 2013. In May 2013, he was promoted as the COO - East region

Ujjivan Financial Services Absolute – SHORT Relative – UNDERWEIGHT 18% downside in 14 Months
August 16, 2016 Analyst: Anirvan Sarkar [email protected] (+91-79-61909526) Page 55 of 63
ANNEXURE
Ujjivan has 27% and 62% of its branches in the top 5 and top 10 MSME clusters in India,
except for Andhra where the absence is understandable given the 2010 crash in MFI asset
quality owing to Andhra government interference.
Exhibit 24: Top SME clusters in India and Ujjivan’s network
SME clusters Ujjivan branches
# % # %
Maharashtra 58 15% 54 12%
Gujarat 49 13% 32 7%
Uttar Pradesh 39 10% 21 4%
Andhra Pradesh 32 8% 0 0%
Punjab 30 8% 17 4%
TN 28 7% 56 12%
Haryana 24 6% 28 6%
Rajasthan 20 5% 20 4%
Delhi 19 5% 0 0%
Karnataka 19 5% 60 13%
West Bengal 17 4% 52 11%
Orissa 13 3% 12 3%
Kerala 10 3% 12 3%
Madhya Pradesh 10 3% 13 3%
Others 20 1% 92 20%
Total 388 100% 469 100%
Source: UNIDO, company financials
Exhibit 25: Shareholding Pattern
48.7%
9.6%
26.8%
0.4% 11.6%
1.4% 1.5%
Shareholding Pattern as on May 20th 2016
Foreign Investors
Mutual Funds
Bodies Corporate
Banks/Fis/NBFCs/Trusts
Resident Induviduals/HUFs
Employees & Directors
Others

Ujjivan Financial Services Absolute – SHORT Relative – UNDERWEIGHT 18% downside in 14 Months
August 16, 2016 Analyst: Anirvan Sarkar [email protected] (+91-79-61909526) Page 56 of 63
Exhibit 26: Product Portfolio
Group Loan Purpose Loan amount
Interest Rate
Repayment Processing fees
Business Loan
Provides loan to self-employed women for financing diverse business needs
Rs 6K to 50K
22% 1-2 years 1% of loan amount
Family Loan
For women with low income to finance a range of needs such as school expenses of children, medical care, house repairs etc
Rs 6K to 35K
22% 1-2 years 1% of loan amount
Agriculture and Allied loan
Lends to women for meeting cost of cultivation and working capital activities for farming and allied activities
Rs 6K to 50K
22% 1-2 years 1% of loan amount
Business Top-up Loan
Allows customers access to additional money over and above their initial business loan
Rs 3K to 6K
22% 9 months 1% of loan amount
Emergency Loan
To meet the unforeseen medical emergency requirements of customer and loan is disbursed within 24 hours of request
Rs 2K to 5K
22% 6 months Nil
Education Loan
To help finance the education expenses of children
Rs 5K to 15K
22% 12 months 1% of loan amount
Loyalty Loan
Top up loan to assist loyal customers attain additional liquidity in their business cash-flows during the festival season
Rs 5K to 15K
22% 12 months 1% of loan amount
Individual Loan
Purpose Loan amount
Interest Rate
Repayment Processing fees
Business Loan
To individual micro-entrepreneurs who have running business and require funds for WC or FA
Rs 51K to 1.5L
24% 6 months-2 years
2% of loan amount
Individual Loyalty Loans
Customers having running business loans with good repayment history are given loan during festive seasons as an additional credit
Rs 20K-30K
23.6% 12 months 1% of loan amount
Individual Livestock Loan
Offered to dairy farmers living in villages in the working areas of company branches
Rs 41K to 1L
24% 9 months-2 years
1% of loan amount
Home Improvement Loan
Offered to customers who are renovating or expanding their houses
Rs 51K to 5L
19.75-24% (depending on risk)
1-7 years 2% of loan amount
Home Loan
Loans for Home Improvement/Renovation/Extension, Home Construction and Home Purchase
Rs 2L to 10L
15.75% 2-10 years 2.5% of loan amount
Higher Education Loan
The product is for customers who have children at home pursuing higher education
Rs 41K to 3L - distributed in tranches
24% 6 months - 5 years
1% of loan amount
Individual Agriculture Loan
Offered to marginal and tenant farmers who still have shortage of formal credit
Rs 31K to 80K
24% 4-12 months
1% of loan amount
Secured Business Loan
Secured business loan caters to the investment needs of MSE to expand their business
Rs 2L to 10L
20% 2-7 years 2.2% of loan amount
Pragati Individual Loan
Loans are given to customers on an individual basis with any security
Rs. 51K to 1L
23% 2-3 years 1% of loan amount
Pragati Agriculture Loan
The tailor made product offered to marginal and tenant farmers who still have shortage of formal credit
Rs 31K-80K
23% 24 months 1% of loan amount
Pragati Livestock Loan
Offered to dairy farmers living in villages in the working areas of company branches
Rs 51K-1L 23% 24-36 months
1% of loan amount

Ujjivan Financial Services Absolute – SHORT Relative – UNDERWEIGHT 18% downside in 14 Months
August 16, 2016 Analyst: Anirvan Sarkar [email protected] (+91-79-61909526) Page 57 of 63
Exhibit 27: State-wise MSME statistics
State/UT
Number of enterprises (lakhs) Employment (lakhs)
Unregistered sector Unregistered sector
Registered sector Sample EC 2005 Total Registered sector Sample EC 2005 Total
Jammu and Kashmir 0.15 1.18 1.68 3.01 0.90 2.17 2.68 5.75
Himachal Pradesh 0.12 1.60 1.16 2.87 0.65 2.27 1.76 4.68
Punjab 0.48 9.66 4.32 14.46 4.16 14.16 8.48 26.79
Chandigarh 0.01 0.28 0.20 0.49 0.12 0.58 0.53 1.23
Uttarakhand 0.24 2.00 1.51 3.74 0.80 3.62 2.54 6.96
Haryana 0.33 4.87 3.46 8.66 3.82 8.41 6.61 18.84
Delhi 0.04 1.75 3.74 5.52 0.58 5.94 13.29 19.81
Rajasthan 0.55 9.14 6.96 16.64 3.42 15.00 12.37 30.79
Uttar Pradesh 1.88 22.34 19.82 44.03 7.55 51.76 33.06 92.36
Bihar 0.50 7.48 6.72 14.70 1.48 15.97 10.81 28.26
Sikkim 0.00 0.06 0.10 0.17 0.01 0.56 0.22 0.79
Arunachal Pradesh 0.00 0.25 0.15 0.41 0.05 0.82 0.31 1.19
Nagaland 0.01 0.16 0.21 0.39 0.16 1.00 0.54 1.71
Manipur 0.04 0.44 0.43 0.91 0.20 1.38 0.78 2.36
Mizoram 0.04 0.10 0.16 0.29 0.26 0.30 0.25 0.81
Tripura 0.01 0.26 0.70 0.98 0.23 0.53 0.99 1.75
Meghalaya 0.03 0.47 0.38 0.88 0.13 1.04 0.75 1.92
Assam 0.20 2.14 4.28 6.62 2.11 4.48 7.66 14.25
West Bengal 0.43 20.80 13.41 34.64 3.60 54.93 27.24 85.78
Jharkhand 0.18 4.25 2.32 6.75 0.75 8.24 3.92 12.91
Odisha 0.20 9.77 5.76 15.73 1.73 21.94 9.57 33.24
Chattisgarh 0.23 2.78 2.19 5.20 0.75 4.68 4.09 9.52
Madhya Pradesh 1.07 11.50 6.76 19.33 2.98 17.32 13.36 33.66
Gujarat 2.30 13.03 6.46 21.78 12.45 21.97 13.31 47.73
Daman and Diu 0.01 0.01 0.04 0.06 0.26 0.03 0.09 0.37
Dadra and Nagar Haveli 0.02 0.04 0.03 0.09 0.26 0.07 0.07 0.41
Maharashtra 0.87 14.45 15.31 30.63 10.89 24.72 34.43 70.04
Andhra Pradesh 0.46 14.90 10.60 25.96 3.83 35.15 31.71 70.69
Karnataka 1.36 11.12 7.70 20.19 7.89 22.58 16.24 46.72
Goa 0.03 0.56 0.27 0.86 0.33 0.87 0.68 1.88
Lakshadweep 0.00 0.01 0.01 0.02 0.00 0.05 0.02 0.06
Kerala 1.50 12.94 7.69 22.13 6.21 26.98 16.42 49.62
Tamil Nadu 2.34 18.21 12.58 33.13 14.26 38.89 27.82 80.98
Puducherry 0.01 0.13 0.21 0.35 0.21 0.25 0.55 1.01
Andaman and Nicobar Islands 0.01 0.07 0.07 0.14 0.06 0.18 0.15 0.38
Total 15.64 198.74 147.38 361.76 93.09 408.84 303.31 805.24
Source: MSME AR 2015
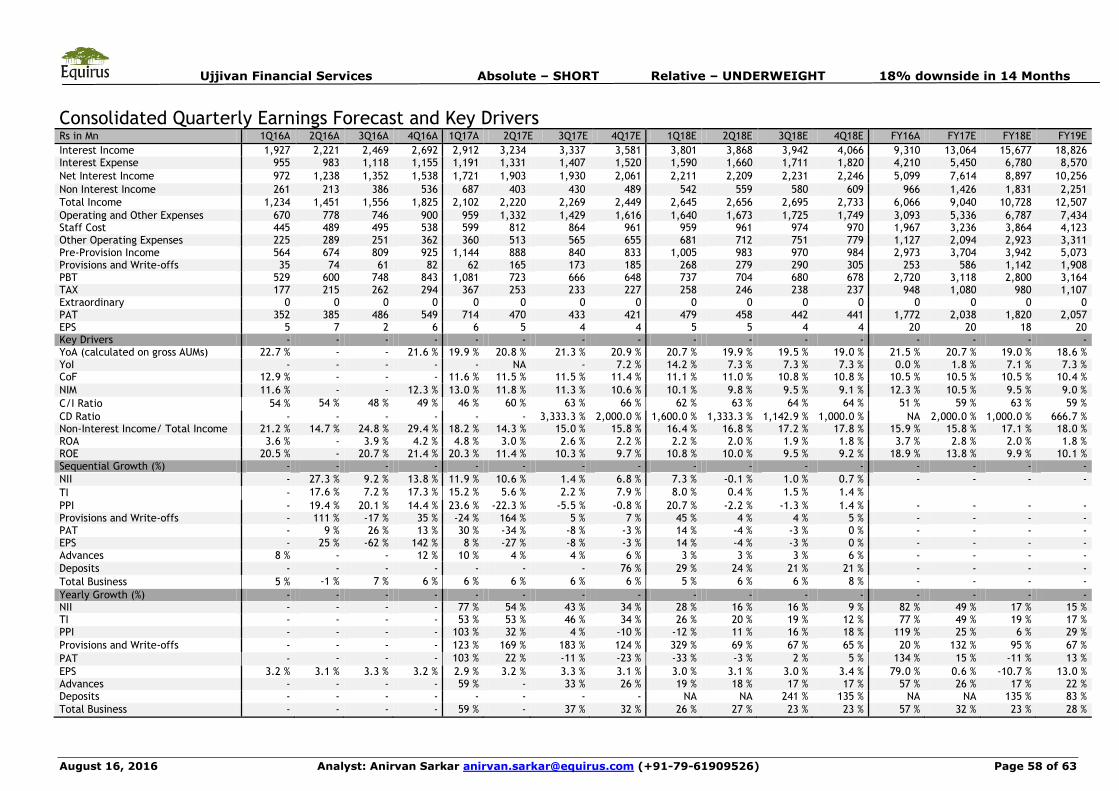
Ujjivan Financial Services Absolute – SHORT Relative – UNDERWEIGHT 18% downside in 14 Months
August 16, 2016 Analyst: Anirvan Sarkar [email protected] (+91-79-61909526) Page 58 of 63
Consolidated Quarterly Earnings Forecast and Key Drivers Rs in Mn 1Q16A 2Q16A 3Q16A 4Q16A 1Q17A 2Q17E 3Q17E 4Q17E 1Q18E 2Q18E 3Q18E 4Q18E FY16A FY17E FY18E FY19E
Interest Income 1,927 2,221 2,469 2,692 2,912 3,234 3,337 3,581 3,801 3,868 3,942 4,066 9,310 13,064 15,677 18,826 Interest Expense 955 983 1,118 1,155 1,191 1,331 1,407 1,520 1,590 1,660 1,711 1,820 4,210 5,450 6,780 8,570
Net Interest Income 972 1,238 1,352 1,538 1,721 1,903 1,930 2,061 2,211 2,209 2,231 2,246 5,099 7,614 8,897 10,256
Non Interest Income 261 213 386 536 687 403 430 489 542 559 580 609 966 1,426 1,831 2,251
Total Income 1,234 1,451 1,556 1,825 2,102 2,220 2,269 2,449 2,645 2,656 2,695 2,733 6,066 9,040 10,728 12,507
Operating and Other Expenses 670 778 746 900 959 1,332 1,429 1,616 1,640 1,673 1,725 1,749 3,093 5,336 6,787 7,434 Staff Cost 445 489 495 538 599 812 864 961 959 961 974 970 1,967 3,236 3,864 4,123 Other Operating Expenses 225 289 251 362 360 513 565 655 681 712 751 779 1,127 2,094 2,923 3,311 Pre-Provision Income 564 674 809 925 1,144 888 840 833 1,005 983 970 984 2,973 3,704 3,942 5,073 Provisions and Write-offs 35 74 61 82 62 165 173 185 268 279 290 305 253 586 1,142 1,908 PBT 529 600 748 843 1,081 723 666 648 737 704 680 678 2,720 3,118 2,800 3,164 TAX 177 215 262 294 367 253 233 227 258 246 238 237 948 1,080 980 1,107 Extraordinary 0 0 0 0 0 0 0 0 0 0 0 0 0 0 0 0 PAT 352 385 486 549 714 470 433 421 479 458 442 441 1,772 2,038 1,820 2,057 EPS 5 7 2 6 6 5 4 4 5 5 4 4 20 20 18 20 Key Drivers - - - - - - - - - - - - - - - - YoA (calculated on gross AUMs) 22.7 % - - 21.6 % 19.9 % 20.8 % 21.3 % 20.9 % 20.7 % 19.9 % 19.5 % 19.0 % 21.5 % 20.7 % 19.0 % 18.6 % YoI - - - - - NA - 7.2 % 14.2 % 7.3 % 7.3 % 7.3 % 0.0 % 1.8 % 7.1 % 7.3 % CoF 12.9 % - - - 11.6 % 11.5 % 11.5 % 11.4 % 11.1 % 11.0 % 10.8 % 10.8 % 10.5 % 10.5 % 10.5 % 10.4 %
NIM 11.6 % - - 12.3 % 13.0 % 11.8 % 11.3 % 10.6 % 10.1 % 9.8 % 9.5 % 9.1 % 12.3 % 10.5 % 9.5 % 9.0 %
C/I Ratio 54 % 54 % 48 % 49 % 46 % 60 % 63 % 66 % 62 % 63 % 64 % 64 % 51 % 59 % 63 % 59 %
CD Ratio - - - - - - 3,333.3 % 2,000.0 % 1,600.0 % 1,333.3 % 1,142.9 % 1,000.0 % NA 2,000.0 % 1,000.0 % 666.7 % Non-Interest Income/ Total Income 21.2 % 14.7 % 24.8 % 29.4 % 18.2 % 14.3 % 15.0 % 15.8 % 16.4 % 16.8 % 17.2 % 17.8 % 15.9 % 15.8 % 17.1 % 18.0 % ROA 3.6 % - 3.9 % 4.2 % 4.8 % 3.0 % 2.6 % 2.2 % 2.2 % 2.0 % 1.9 % 1.8 % 3.7 % 2.8 % 2.0 % 1.8 % ROE 20.5 % - 20.7 % 21.4 % 20.3 % 11.4 % 10.3 % 9.7 % 10.8 % 10.0 % 9.5 % 9.2 % 18.9 % 13.8 % 9.9 % 10.1 % Sequential Growth (%) - - - - - - - - - - - - - - - -
NII - 27.3 % 9.2 % 13.8 % 11.9 % 10.6 % 1.4 % 6.8 % 7.3 % -0.1 % 1.0 % 0.7 % - - - -
TI - 17.6 % 7.2 % 17.3 % 15.2 % 5.6 % 2.2 % 7.9 % 8.0 % 0.4 % 1.5 % 1.4 %
PPI - 19.4 % 20.1 % 14.4 % 23.6 % -22.3 % -5.5 % -0.8 % 20.7 % -2.2 % -1.3 % 1.4 % - - - - Provisions and Write-offs - 111 % -17 % 35 % -24 % 164 % 5 % 7 % 45 % 4 % 4 % 5 % - - - - PAT - 9 % 26 % 13 % 30 % -34 % -8 % -3 % 14 % -4 % -3 % 0 % - - - - EPS - 25 % -62 % 142 % 8 % -27 % -8 % -3 % 14 % -4 % -3 % 0 % - - - - Advances 8 % - - 12 % 10 % 4 % 4 % 6 % 3 % 3 % 3 % 6 % - - - -
Deposits - - - - - - - 76 % 29 % 24 % 21 % 21 % - - - -
Total Business 5 % -1 % 7 % 6 % 6 % 6 % 6 % 6 % 5 % 6 % 6 % 8 % - - - -
Yearly Growth (%) - - - - - - - - - - - - - - - - NII - - - - 77 % 54 % 43 % 34 % 28 % 16 % 16 % 9 % 82 % 49 % 17 % 15 % TI - - - - 53 % 53 % 46 % 34 % 26 % 20 % 19 % 12 % 77 % 49 % 19 % 17 % PPI - - - - 103 % 32 % 4 % -10 % -12 % 11 % 16 % 18 % 119 % 25 % 6 % 29 %
Provisions and Write-offs - - - - 123 % 169 % 183 % 124 % 329 % 69 % 67 % 65 % 20 % 132 % 95 % 67 %
PAT - - - - 103 % 22 % -11 % -23 % -33 % -3 % 2 % 5 % 134 % 15 % -11 % 13 %
EPS 3.2 % 3.1 % 3.3 % 3.2 % 2.9 % 3.2 % 3.3 % 3.1 % 3.0 % 3.1 % 3.0 % 3.4 % 79.0 % 0.6 % -10.7 % 13.0 % Advances - - - - 59 % - 33 % 26 % 19 % 18 % 17 % 17 % 57 % 26 % 17 % 22 % Deposits - - - - - - - - NA NA 241 % 135 % NA NA 135 % 83 %
Total Business - - - - 59 % - 37 % 32 % 26 % 27 % 23 % 23 % 57 % 32 % 23 % 28 %
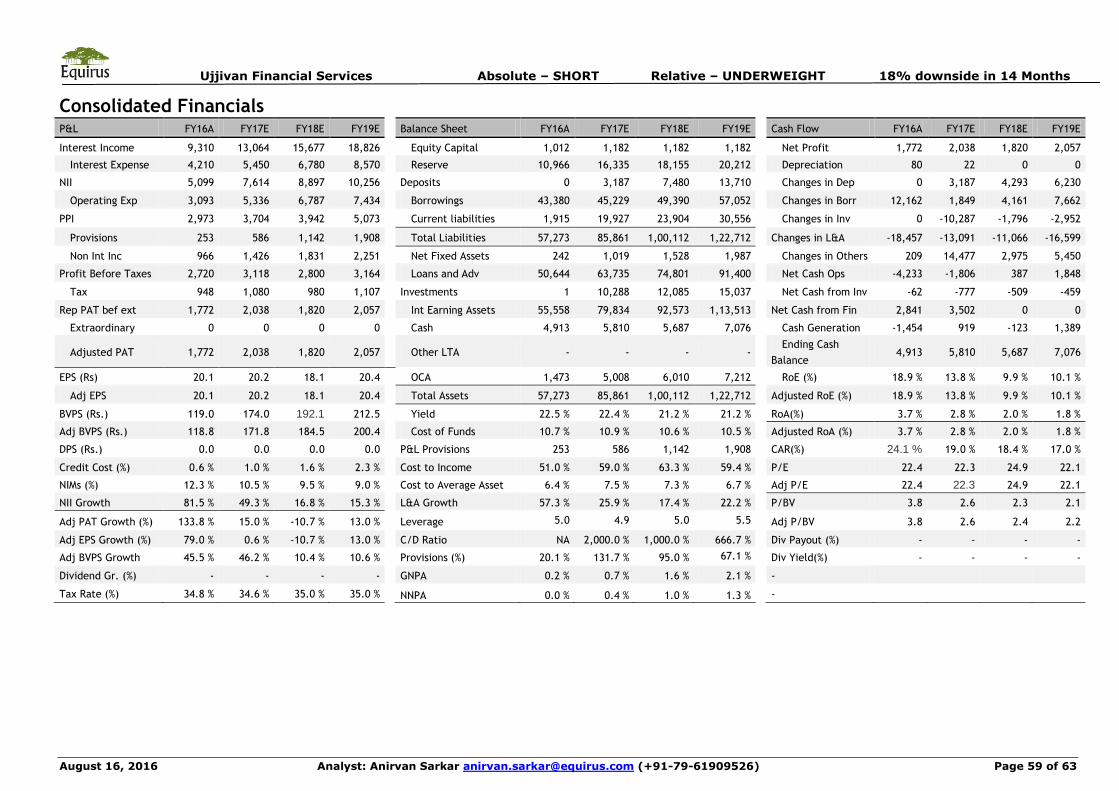
Ujjivan Financial Services Absolute – SHORT Relative – UNDERWEIGHT 18% downside in 14 Months
August 16, 2016 Analyst: Anirvan Sarkar [email protected] (+91-79-61909526) Page 59 of 63
Consolidated Financials P&L FY16A FY17E FY18E FY19E Balance Sheet FY16A FY17E FY18E FY19E Cash Flow FY16A FY17E FY18E FY19E
Interest Income 9,310 13,064 15,677 18,826 Equity Capital 1,012 1,182 1,182 1,182 Net Profit 1,772 2,038 1,820 2,057
Interest Expense 4,210 5,450 6,780 8,570 Reserve 10,966 16,335 18,155 20,212 Depreciation 80 22 0 0
NII 5,099 7,614 8,897 10,256 Deposits 0 3,187 7,480 13,710 Changes in Dep 0 3,187 4,293 6,230
Operating Exp 3,093 5,336 6,787 7,434 Borrowings 43,380 45,229 49,390 57,052 Changes in Borr 12,162 1,849 4,161 7,662
PPI 2,973 3,704 3,942 5,073 Current liabilities 1,915 19,927 23,904 30,556 Changes in Inv 0 -10,287 -1,796 -2,952
Provisions 253 586 1,142 1,908 Total Liabilities 57,273 85,861 1,00,112 1,22,712 Changes in L&A -18,457 -13,091 -11,066 -16,599
Non Int Inc 966 1,426 1,831 2,251 Net Fixed Assets 242 1,019 1,528 1,987 Changes in Others 209 14,477 2,975 5,450
Profit Before Taxes 2,720 3,118 2,800 3,164 Loans and Adv 50,644 63,735 74,801 91,400 Net Cash Ops -4,233 -1,806 387 1,848
Tax 948 1,080 980 1,107 Investments 1 10,288 12,085 15,037 Net Cash from Inv -62 -777 -509 -459
Rep PAT bef ext 1,772 2,038 1,820 2,057 Int Earning Assets 55,558 79,834 92,573 1,13,513 Net Cash from Fin 2,841 3,502 0 0
Extraordinary 0 0 0 0 Cash 4,913 5,810 5,687 7,076 Cash Generation -1,454 919 -123 1,389
Adjusted PAT 1,772 2,038 1,820 2,057 Other LTA - - - - Ending Cash
Balance 4,913 5,810 5,687 7,076
EPS (Rs) 20.1 20.2 18.1 20.4 OCA 1,473 5,008 6,010 7,212 RoE (%) 18.9 % 13.8 % 9.9 % 10.1 %
Adj EPS 20.1 20.2 18.1 20.4 Total Assets 57,273 85,861 1,00,112 1,22,712 Adjusted RoE (%) 18.9 % 13.8 % 9.9 % 10.1 %
BVPS (Rs.) 119.0 174.0 192.1 212.5 Yield 22.5 % 22.4 % 21.2 % 21.2 % RoA(%) 3.7 % 2.8 % 2.0 % 1.8 %
Adj BVPS (Rs.) 118.8 171.8 184.5 200.4 Cost of Funds 10.7 % 10.9 % 10.6 % 10.5 % Adjusted RoA (%) 3.7 % 2.8 % 2.0 % 1.8 %
DPS (Rs.) 0.0 0.0 0.0 0.0 P&L Provisions 253 586 1,142 1,908 CAR(%) 24.1 % 19.0 % 18.4 % 17.0 %
Credit Cost (%) 0.6 % 1.0 % 1.6 % 2.3 % Cost to Income 51.0 % 59.0 % 63.3 % 59.4 % P/E 22.4 22.3 24.9 22.1
NIMs (%) 12.3 % 10.5 % 9.5 % 9.0 % Cost to Average Asset 6.4 % 7.5 % 7.3 % 6.7 % Adj P/E 22.4 22.3 24.9 22.1
NII Growth 81.5 % 49.3 % 16.8 % 15.3 % L&A Growth 57.3 % 25.9 % 17.4 % 22.2 % P/BV 3.8 2.6 2.3 2.1
Adj PAT Growth (%) 133.8 % 15.0 % -10.7 % 13.0 % Leverage 5.0 4.9 5.0 5.5 Adj P/BV 3.8 2.6 2.4 2.2
Adj EPS Growth (%) 79.0 % 0.6 % -10.7 % 13.0 % C/D Ratio NA 2,000.0 % 1,000.0 % 666.7 % Div Payout (%) - - - -
Adj BVPS Growth 45.5 % 46.2 % 10.4 % 10.6 % Provisions (%) 20.1 % 131.7 % 95.0 % 67.1 % Div Yield(%) - - - -
Dividend Gr. (%) - - - - GNPA 0.2 % 0.7 % 1.6 % 2.1 % -
Tax Rate (%) 34.8 % 34.6 % 35.0 % 35.0 % NNPA 0.0 % 0.4 % 1.0 % 1.3 % -
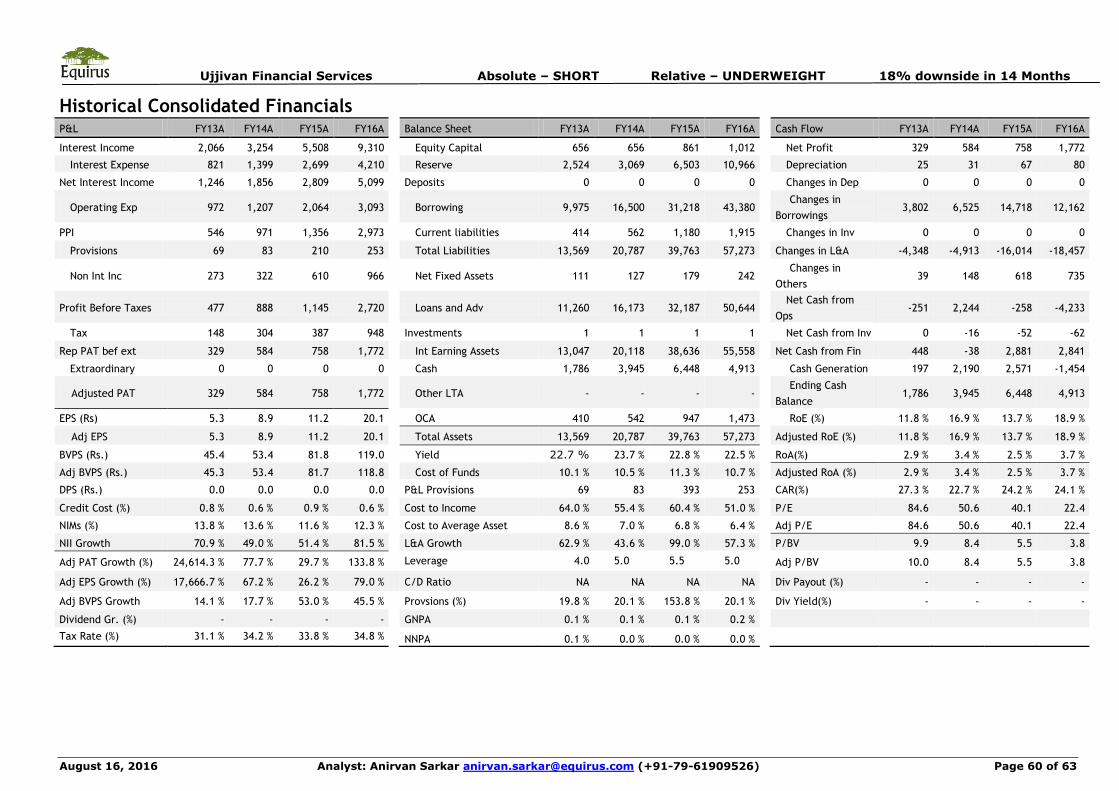
Ujjivan Financial Services Absolute – SHORT Relative – UNDERWEIGHT 18% downside in 14 Months
August 16, 2016 Analyst: Anirvan Sarkar [email protected] (+91-79-61909526) Page 60 of 63
Historical Consolidated Financials P&L FY13A FY14A FY15A FY16A Balance Sheet FY13A FY14A FY15A FY16A Cash Flow FY13A FY14A FY15A FY16A
Interest Income 2,066 3,254 5,508 9,310 Equity Capital 656 656 861 1,012 Net Profit 329 584 758 1,772
Interest Expense 821 1,399 2,699 4,210 Reserve 2,524 3,069 6,503 10,966 Depreciation 25 31 67 80
Net Interest Income 1,246 1,856 2,809 5,099 Deposits 0 0 0 0 Changes in Dep 0 0 0 0
Operating Exp 972 1,207 2,064 3,093 Borrowing 9,975 16,500 31,218 43,380 Changes in
Borrowings 3,802 6,525 14,718 12,162
PPI 546 971 1,356 2,973 Current liabilities 414 562 1,180 1,915 Changes in Inv 0 0 0 0
Provisions 69 83 210 253 Total Liabilities 13,569 20,787 39,763 57,273 Changes in L&A -4,348 -4,913 -16,014 -18,457
Non Int Inc 273 322 610 966 Net Fixed Assets 111 127 179 242 Changes in
Others 39 148 618 735
Profit Before Taxes 477 888 1,145 2,720 Loans and Adv 11,260 16,173 32,187 50,644 Net Cash from
Ops -251 2,244 -258 -4,233
Tax 148 304 387 948 Investments 1 1 1 1 Net Cash from Inv 0 -16 -52 -62
Rep PAT bef ext 329 584 758 1,772 Int Earning Assets 13,047 20,118 38,636 55,558 Net Cash from Fin 448 -38 2,881 2,841
Extraordinary 0 0 0 0 Cash 1,786 3,945 6,448 4,913 Cash Generation 197 2,190 2,571 -1,454
Adjusted PAT 329 584 758 1,772 Other LTA - - - - Ending Cash
Balance 1,786 3,945 6,448 4,913
EPS (Rs) 5.3 8.9 11.2 20.1 OCA 410 542 947 1,473 RoE (%) 11.8 % 16.9 % 13.7 % 18.9 %
Adj EPS 5.3 8.9 11.2 20.1 Total Assets 13,569 20,787 39,763 57,273 Adjusted RoE (%) 11.8 % 16.9 % 13.7 % 18.9 %
BVPS (Rs.) 45.4 53.4 81.8 119.0 Yield 22.7 % 23.7 % 22.8 % 22.5 % RoA(%) 2.9 % 3.4 % 2.5 % 3.7 %
Adj BVPS (Rs.) 45.3 53.4 81.7 118.8 Cost of Funds 10.1 % 10.5 % 11.3 % 10.7 % Adjusted RoA (%) 2.9 % 3.4 % 2.5 % 3.7 %
DPS (Rs.) 0.0 0.0 0.0 0.0 P&L Provisions 69 83 393 253 CAR(%) 27.3 % 22.7 % 24.2 % 24.1 %
Credit Cost (%) 0.8 % 0.6 % 0.9 % 0.6 % Cost to Income 64.0 % 55.4 % 60.4 % 51.0 % P/E 84.6 50.6 40.1 22.4
NIMs (%) 13.8 % 13.6 % 11.6 % 12.3 % Cost to Average Asset 8.6 % 7.0 % 6.8 % 6.4 % Adj P/E 84.6 50.6 40.1 22.4
NII Growth 70.9 % 49.0 % 51.4 % 81.5 % L&A Growth 62.9 % 43.6 % 99.0 % 57.3 % P/BV 9.9 8.4 5.5 3.8
Adj PAT Growth (%) 24,614.3 % 77.7 % 29.7 % 133.8 % Leverage 4.0 5.0 5.5 5.0 Adj P/BV 10.0 8.4 5.5 3.8
Adj EPS Growth (%) 17,666.7 % 67.2 % 26.2 % 79.0 % C/D Ratio NA NA NA NA Div Payout (%) - - - -
Adj BVPS Growth 14.1 % 17.7 % 53.0 % 45.5 % Provsions (%) 19.8 % 20.1 % 153.8 % 20.1 % Div Yield(%) - - - -
Dividend Gr. (%) - - - - GNPA 0.1 % 0.1 % 0.1 % 0.2 %
Tax Rate (%) 31.1 % 34.2 % 33.8 % 34.8 % NNPA 0.1 % 0.0 % 0.0 % 0.0 %

Ujjivan Financial Services Absolute – SHORT Relative – UNDERWEIGHT 18% downside in 14 Months
August 16, 2016 Analyst: Anirvan Sarkar [email protected] (+91-79-61909526) Page 61 of 63
Equirus Securities
Pankaj Sharma Executive Director [email protected] 91-79-61909540/41
Research Analysts Sector/Industry Email Equity Sales E-mail
Abhishek Shindadkar IT Services [email protected] 91-79-61909515 Vishad Turakhia [email protected] 91-22-43320633
Anirvan Sarkar Banking & Financial Service [email protected] 91-79-61909526 Subham Sinha [email protected] 91-22-43320631
Devam Modi Power & Infrastructure [email protected] 91-79-61909516 Sweta Sheth [email protected] 91-22-43320634
Dhaval Dama FMCG, Mid-Caps [email protected] 91-79-61909518 Dealing Room E-mail
Maulik Patel Oil and Gas [email protected] 91-79-61909519 Ashish Shah [email protected] 91-79-61909504
Nimish Mehta Pharma [email protected] 91-79-61909550 Ilesh Savla [email protected] 91-79-61909505
Umesh Raut Industrials [email protected] 91-79-61909529 Jigar Chokshi [email protected] 91-79-61909506
Associates E-mail Manoj Kejriwal [email protected] 91-79-61909508
Ankit Choudhary [email protected] 91-79-61909533 Sandip Amrutiya [email protected] 91-79-61909503
Manoj Gori [email protected] 91-79-61909523 Compliance Officer E-mail
Meet Chande [email protected] 91-79-61909513 Smita Sharma [email protected] 91-79-61909509
Parva Soni [email protected] 91-79-61909541
Pranav Mehta [email protected] 91-79-61909514
Raj Kantawala [email protected] 91-79-61909532
Saylee Warade [email protected] 91-79-61909527
Vikas Jain [email protected] 91-79-61909531
Rating & Coverage Definitions: Absolute Rating • LONG : Over the investment horizon, ATR >= Ke for companies with Free Float market cap > Rs 5 billion and ATR>= 20% for rest of the companies • SHORT: ATR <= negative 5% over investment horizon• TRADE: Stocks that do not meet the criteria for either LONG or SHORTRelative Rating • OVERWEIGHT: Likely to outperform the benchmark by at least 5% over investment horizon• BENCHMARK: likely to perform in line with the benchmark• UNDERWEIGHT: likely to under-perform the benchmark by at least 5% over investment horizon
Target Price and Investment Horizon Target Price is a point value for stocks with Absolute rating of LONG or SHORT and a range value for stocks rated TRADE. Investment Horizon is set at a minimum 3 months to maximum 15 months with target date falling on last day of a calendar quarter.
Lite vs. Regular Coverage vs. Spot Coverage We aim to keep our rating and estimates updated at least once a quarter for Regular Coverage stocks. Generally, we would have access to the company and we would maintain detailed financial model for Regular coverage companies. We intend to publish updates on Lite coverage stocks only an opportunistic basis and subject to our ability to contact the management. Our rating and estimates for Lite coverage stocks may not be current. Spot coverage is meant for one-off coverage of a specific company and in such cases, earnings forecast and target price are optional. Spot coverage is meant to stimulate discussion rather than provide a research opinion.
Registered Office:
Equirus Securities Private Limited
Unit No. 1201, 12th Floor, C Wing, Marathon Futurex,
N M Joshi Marg, Lower Parel,
Mumbai-400013.
Tel. No: +91 – (0)22 – 4332 0600
Fax No: +91- (0)22 – 4332 0601
Corporate Office:
3rd floor, House No. 9,
Magnet Corporate Park, Near Zydus Hospital, B/H Intas Sola Bridge,
S.G. Highway Ahmedabad-380054
Gujarat
Tel. No: +91 (0)79 - 6190 9550
Fax No: +91 (0)79 – 6190 9560
Ujjivan Financial Services Absolute – SHORT Relative – UNDERWEIGHT 18% downside in 14 Months
August 16, 2016 Analyst: Anirvan Sarkar [email protected] (+91-79-61909526) Page 62 of 63
© 2016 Equirus Securities Private Limited. All rights reserved. For Private Circulation only. This report or any portion hereof may not be reprinted, sold or redistributed without the written consent of Equirus Securities Private Limited
Analyst Certification I, Anirvan Sarkar, author to this report, hereby certify that all of the views expressed in this report accurately reflect my personal views about the subject company or companies and its or their securities. I also
certify that no part of my compensation was, is or will be, directly or indirectly, related to the specific recommendations or views expressed in this report.
Disclaimers Equirus Securities Private Limited (ESPL) having Corporate Identification Number U65993MH2007PTC176044 is registered in India with Securities and Exchange Board of India (SEBI) as a trading member on the
Capital Market (Reg. No. INB231301731), Futures & Options Segment (Reg. No.INF231301731) of the National Stock Exchange of India Ltd. (NSE) and on Cash Segment (Reg. No.INB011301737) of Bombay Stock
Exchange Limited (BSE).We are under the process of seeking registration under SEBI (Research Analyst) Regulations, 2014. There are no disciplinary actions that have been taken by any regulatory authority. ESPL
is a subsidiary of Equirus Capital Pvt. Ltd. (ECPL) which is registered with SEBI as Category I Merchant Banker. ESPL/its affiliates provide investment banking services including but not limited to Private Equity,
Mergers & Acquisitions, Structured Finance and Institutional Equities.
ESPL/its affiliates might have, managed or co-managed public offering of securities of the subject company or have received a mandate from the subject company or might have received compensation from the subject company for investment banking or brokerage services in the past twelve months. ESPL & its affiliates, their directors and employees may from time to time have positions or options in the company and buy or sell the securities of the company (ies) mentioned herein. ESPL or its Analyst did not receive any compensation or other benefits from the companies mentioned in the report or third party in connection with preparation of the research report. Accordingly, neither ESPL nor Research Analysts have any material conflict of interest at the time of publication of this report. Compensation of our Research Analysts is not based on any specific merchant banking, investment banking or brokerage service transactions. ESPL has not been engaged in market making activity for the subject company. Research Analyst might have served as an employee of the subject company in the past.
This document is not directed or intended for distribution to, or use by, any person or entity who is a citizen or resident of or located in any locality, state, country or other jurisdiction, where such distribution,
publication, availability or use would be contrary to law, regulation or which would subject ESPL and affiliates to any registration or licensing requirement within such jurisdiction. The securities described herein
may or may not be eligible for sale in all jurisdictions or to a certain category of investors. Persons in whose possession this document may come are required to inform themselves of, and to observe, such
applicable restrictions. Please delete this document if you are not authorized to view the same. By reading this document you represent and warrant that you have full authority and all rights necessary to view
and read this document.
This document has been prepared solely for information purpose and does not constitute a solicitation to any person to buy, sell or subscribe a security. ESPL is not soliciting any action based on this report. The
information and opinions contained herein is from publicly available data or based on information obtained in good faith from sources believed to be reliable but ESPL provides no guarantee as to its accuracy or
completeness. The information contained herein stand on date, which are subject to change or modification. Any such changes could impact our interpretation of relevant information contained herein. While we
would endeavour to update the information herein on reasonable basis. ESPL, its affiliates, their directors and employees are under no obligation to update or keep the information current. Also there may be
regulatory, compliance, or other reasons that may prevent ESPL and its group companies from doing so. This document is prepared for assistance only and is not intended to be and must not alone be taken as the
basis for an investment decision. Each recipient of this document should make such investigations as it deems necessary to arrive at an independent evaluation of an investment in the securities of companies
referred to in this document including the merits and risks involved. This document is intended for general circulation and does not take into account the specific investment objectives, financial situation or
particular needs of any particular person. ESPL and its group companies, employees, directors and agents accept no liability, and disclaim all responsibility, for the consequences of you or anyone else acting, or
refraining to act, in reliance on the information contained in this publication or for any decision based on it. ESPL/its affiliates do and seek to do business with companies covered in its research report. Thus,
investors should be aware that the firm may have conflict of interest.
Additional Disclaimer for U.S. Persons ESPL/its affiliates are not a registered broker – dealer under the U.S. Securities Exchange Act of 1934, as amended (the“1934 act”) and under applicable state laws in the United States. In addition Equirus is not a
registered investment adviser under the U.S. Investment Advisers Act of 1940, as amended (the "Advisers Act" and together with the 1934 Act, the "Acts), and under applicable state laws in the United States.
Accordingly, in the absence of specific exemption under the Acts, any brokerage and investment services provided by Equirus, including the products and services described herein are not available to or intended
for U.S. persons. The information contained in this Report is not intended for any person who is a resident of the United States of America or a resident of any jurisdiction, the laws of which imposes prohibition
on soliciting the securities business in that jurisdiction without going through the registration requirements and/or prohibit the use of any information contained in this website. This Report and its respective
contents does not constitute an offer or invitation to purchase or subscribe for any securities or solicitation of any investments or investment services and/or shall not be considered as an advertisement tool.
"U.S. Persons" are generally defined as a natural person, residing in the United States or any entity organized or incorporated under the laws of the United States. US Citizens living abroad may also be deemed
"US Persons" under certain rules.
Ujjivan Financial Services Absolute – SHORT Relative – UNDERWEIGHT 18% downside in 14 Months
August 16, 2016 Analyst: Anirvan Sarkar [email protected] (+91-79-61909526) Page 63 of 63
Disclosures
Disclosure of Interest statement for the subject Company Yes/No If Yes, nature of such interest
Analyst/ESPL/Associate/Relatives‟ financial interest No
Analyst/ESPL/Associate/Relatives‟ actual/beneficial ownership of 1% or more No
Analyst/ESPL/Associate/Relatives‟ material conflict of interest No
Whether ECPL managed any public offering in past 12 months No
* Associate means individual who assist Analyst