microfabricated passive vapor preconcentrator/injector ... · microfabricated passive vapor...
TRANSCRIPT
1
ELECTRONIC SUPPLEMENTARY INFORMATION FOR
Microfabricated Passive Vapor Preconcentrator/Injector Designed for Microscale Gas Chromatography
Jung Hwan Seo,ab Sun Kyu Kim,ad Edward T. Zellers,*ade Katsuo Kurabayashi*abc
a Engineering Research Center for Wireless Integrated Microsensing and Systems (WIMS),
University of Michigan, Ann Arbor, MI 48109, USA bDepartment of Mechanical Engineering, University of Michigan, Ann Arbor, MI 48109, USA.
E-mail: [email protected]; Fax:+1-734-647-3170; Tel: 1-734-615-5211 cDepartment of Electrical Engineering and Computer Science, University of Michigan, Ann
Arbor, MI 48109, USA dDepartment of Environmental Health Sciences, University of Michigan, Ann Arbor, MI
48109, USA E-mail: [email protected]; Fax: 734-763-8095; Tel: 734-936-0766 eDepartment of Chemistry, University of Michigan, Ann Arbor, MI 48109, USA
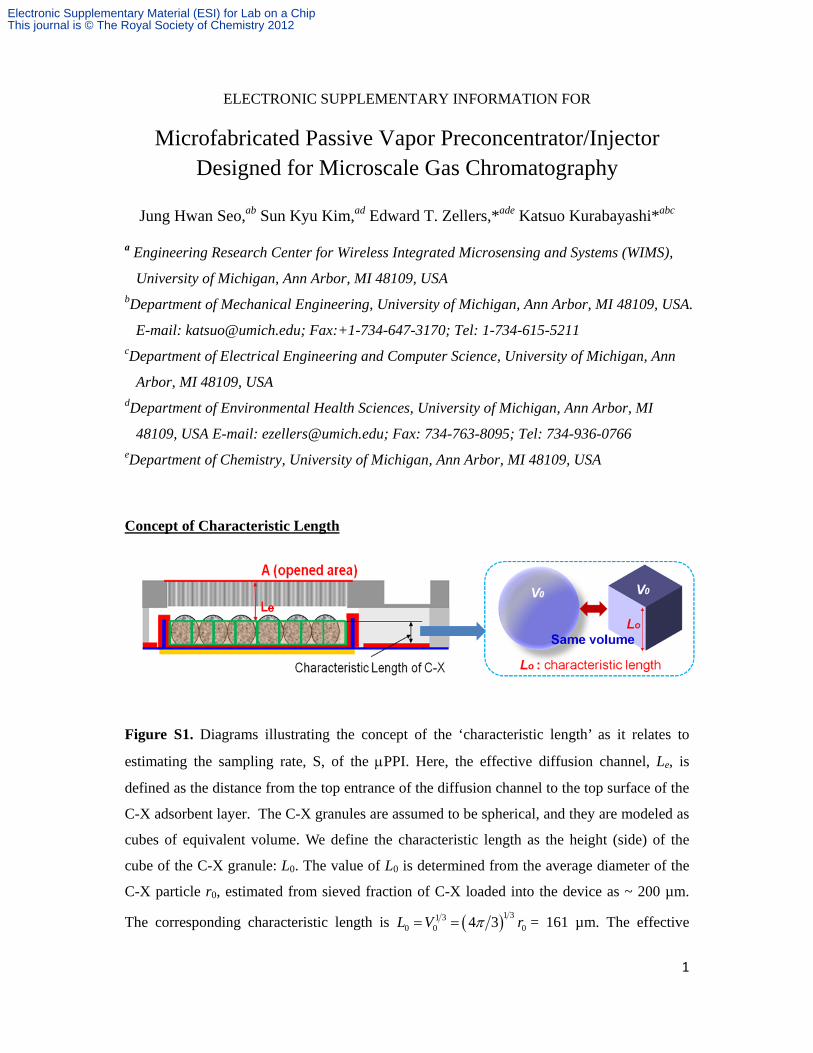
Concept of Characteristic Length
Figure S1. Diagrams illustrating the concept of the ‘characteristic length’ as it relates to
estimating the sampling rate, S, of the PPI. Here, the effective diffusion channel, Le, is
defined as the distance from the top entrance of the diffusion channel to the top surface of the
C-X adsorbent layer. The C-X granules are assumed to be spherical, and they are modeled as
cubes of equivalent volume. We define the characteristic length as the height (side) of the
cube of the C-X granule: L0. The value of L0 is determined from the average diameter of the
C-X particle r0, estimated from sieved fraction of C-X loaded into the device as ~ 200 µm.
The corresponding characteristic length is 1 31 30 0 04 3L V r = 161 µm. The effective
Electronic Supplementary Material (ESI) for Lab on a ChipThis journal is © The Royal Society of Chemistry 2012
2
diffusion length, 1 2eL L L = 265 µm (see below and main article for definitions of L1 and
L2), is obtained by subtracting L0 = 161 µm from the distance from the cavity floor to the top
entrance of the diffusion channel (= 426 µm).
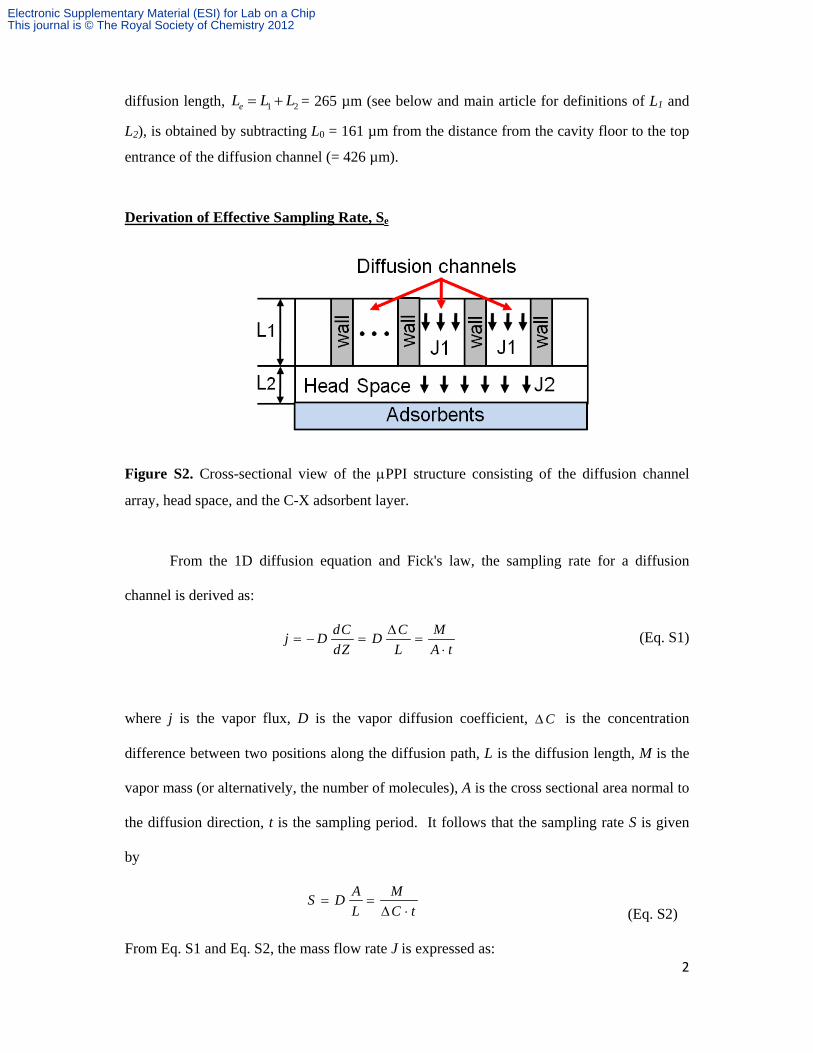
Derivation of Effective Sampling Rate, Se
Figure S2. Cross-sectional view of the PPI structure consisting of the diffusion channel
array, head space, and the C-X adsorbent layer.
From the 1D diffusion equation and Fick's law, the sampling rate for a diffusion
channel is derived as:
dC C Mj D D
dZ L A t
(Eq. S1)
where j is the vapor flux, D is the vapor diffusion coefficient, C is the concentration
difference between two positions along the diffusion path, L is the diffusion length, M is the
vapor mass (or alternatively, the number of molecules), A is the cross sectional area normal to
the diffusion direction, t is the sampling period. It follows that the sampling rate S is given
by
A MS D
L C t
(Eq. S2)
From Eq. S1 and Eq. S2, the mass flow rate J is expressed as:
Electronic Supplementary Material (ESI) for Lab on a ChipThis journal is © The Royal Society of Chemistry 2012
3
( )J C S (Eq. S3)
The vapor flow driven by diffusion takes place inside the device through two regions: (a) the
diffusion channel layer and (b) the head space. Applying the mass conservation rule to the
above two regions, we obtain the following equations.
1 1 2 2 1 2( ) ( )i i eJ C C S C C S C C S (Eq. S4)
where C1 is the vapor concentration at the top surface of the diffusion channel layer of
thickness L1 and total diffusion cross sectional area A1, Ci is the vapor concentration at the
interface between the diffusion channel layer and the head space of height L2 and cross
sectional area A2, C2 is the concentration at the adsorbent surface, 11
1
AS D
L is the sample
flow rate through the diffusion channel layer, 22
2
AS D
L is the sample flow rate through the
head space, and Se is the overall effective sample flow rate for the entire diffusion length (L1
+ L2). From Eq. S4, we obtain
1 2 1 2
1 2 1 2 2 1e
S S A AS D
S S A L A L
(Eq. S5)
The sampling rate for each region can be calculated from Eq. 1 as S1 = 11.4 mL/min and S2 =
52.1 mL/min. A1 is 4.5 mm2 and the cross sectional area (A2) in the headspace is 49% larger
than A1 due to the lack of diffusion grid walls. From Eq. S5, the overall effective sampling
rate Se is 9.3 mL/min.
Electronic Supplementary Material (ESI) for Lab on a ChipThis journal is © The Royal Society of Chemistry 2012
4
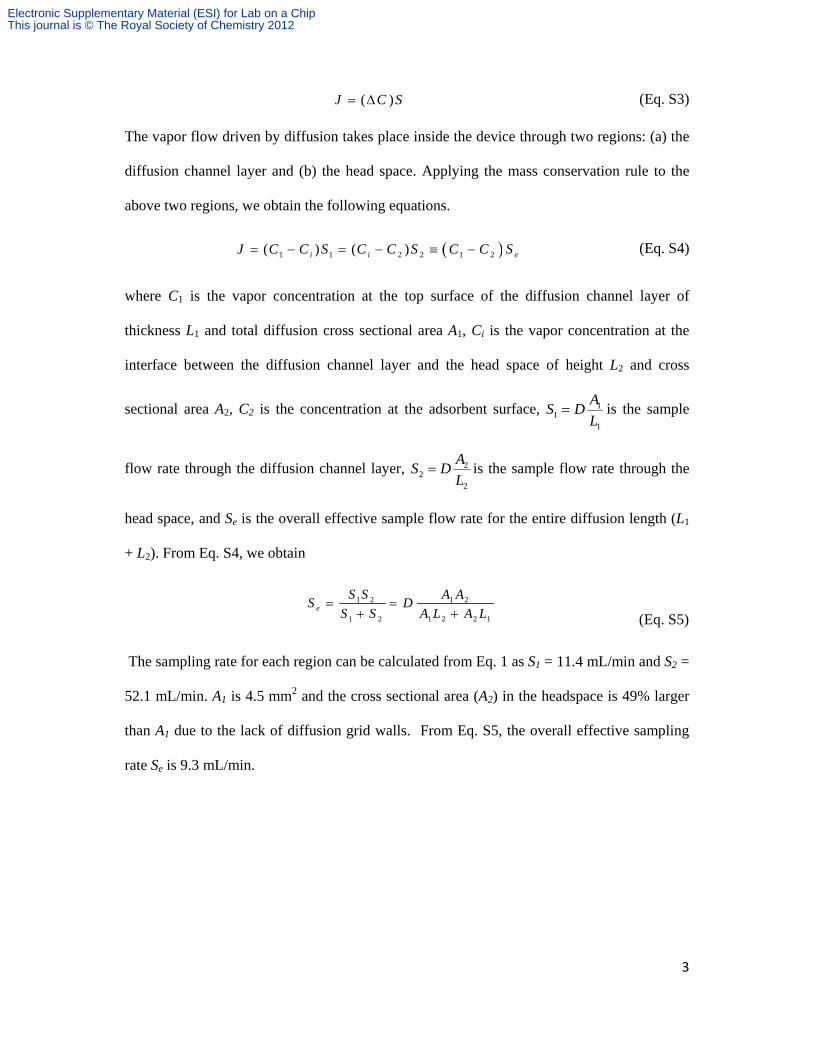
Modeling Gas Flow Dynamics
Figure S3. (A) Velocity field of desorbed vapors in a carrier gas flowing inside the cavity
from the inlet and the top diffusion channels, divided into three regions close to the outlets.
(B) Computational fluid dynamics analysis of the vertical (z-direction) velocity of the vapor
flow at the top surface of the diffusion channels (colored) with suction pressure applied to the
outlets. (C) Vapor flow patterns inside the device cavity and distribution of velocity
magnitude at vertical cross sections (normal to the outlet flows).
Electronic Supplementary Material (ESI) for Lab on a ChipThis journal is © The Royal Society of Chemistry 2012
5
Upon heating the device membrane, vapor molecules desorbed from the adsorbent
materials might escape through the diffusion channels due to the developed concentration
gradient in the vertical direction. To understand how the carrier gas flow dynamics affect the
potential for sample loss during the suction process, we performed computational fluid
dynamics (CFD) analysis of the designed PPI device. Results show that all thermally
desorbed vapors migrate to the outlets without escaping through the diffusion channels. The
red arrows in Fig. S3A indicate the flow direction at the inlets (including diffusion channels)
and outlets. The CFD model numerically solves the full Navier-Stokes equations assuming
Newtonian incompressible flow in the cavity chamber. It predicts the relatively complex flow
pattern of the vapor molecules in a carrier gas in either the laminar or turbulent regime. The
heater temperature and the suction pressure at the outlet are both programmable and
controllable. Thus, all boundary conditions are determined according to the operational
conditions of our choice. The initial pressure of the inlet is set at ambient pressure here. The
pressure drop at the outlet, provided by a mini diaphragm pump, is assumed to be 15 kPa.
The ambient temperature and the temperature of the cavity floor upon desorption are set at
25°C and 300°C, respectively.
The CFD analysis considered the worst-case condition that would yield the maximum
vapor loss and the lowest vapor flow rate at a given pressure drop. The condition is realized
when the analysis assumes that the cavity is empty (i.e., there is no adsorbent), which is
verified by the model in Fig. S6. In the real device setting, the volume of the adsorbents
filling the cavity reduces the effective cross-sectional area through which the vapor is
horizontally carried during the sample injection process. This real condition results in higher
horizontal (x-direction) vapor velocity, and hence less vapor losses at the same pressure drop
as used in the analysis. Assuming a spherical adsorbent granules, the vapor desorption rate of
34.0 mL/min, which was calculated for the overall cavity area using Eq. 2 and Eq. 3 in the
Electronic Supplementary Material (ESI) for Lab on a ChipThis journal is © The Royal Society of Chemistry 2012
6
main text, is converted to a linear velocity of 0.1 m/sec emanating radially from each
adsorbent granule. The average desorption linear velocity projected in the vertical (z-)
direction is 0.07 m/sec; a value that represents a true boundary condition in the vertical
direction from the bed of adsorbents packed within the cavity. To be conservative in our
prediction, we applied a vapor desorption linear velocity of 0.12 m/sec in the vertical
direction as the boundary condition from the bottom chamber floor.
Figures S3B and C show the prediction of the net vertical (z-direction) velocity of the
vapor in the carrier gas, accounting for the counter flow of vapor by diffusion at the
desorption temperature. Our simulation indicates that the carrier gas will pass through the
entire open area of the diffusion channel grid and will be collected by the outlets without
vapor loss. It also shows no vortices or stagnation points inside the cavity. A suction flow rate
of 60 mL/min ensures that the z-direction velocities of the carrier gas have negative values
over the whole area at the top surface of the diffusion channel grid. Under this condition, it is
expected that the desorbed vapor molecules are effectively captured by the carrier gas and
drawn out through the outlet ports. Therefore, we employed the 3-outlet design as the optimal
passive preconcentrator design in our study.
Electronic Supplementary Material (ESI) for Lab on a ChipThis journal is © The Royal Society of Chemistry 2012
7
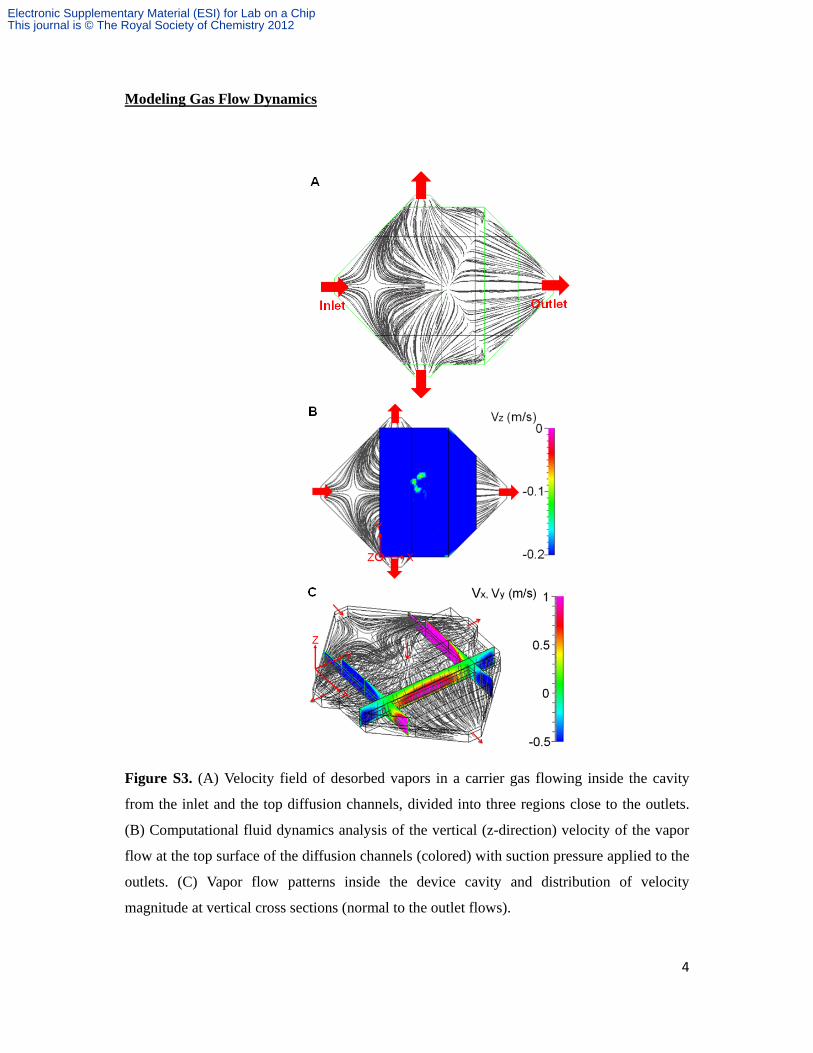
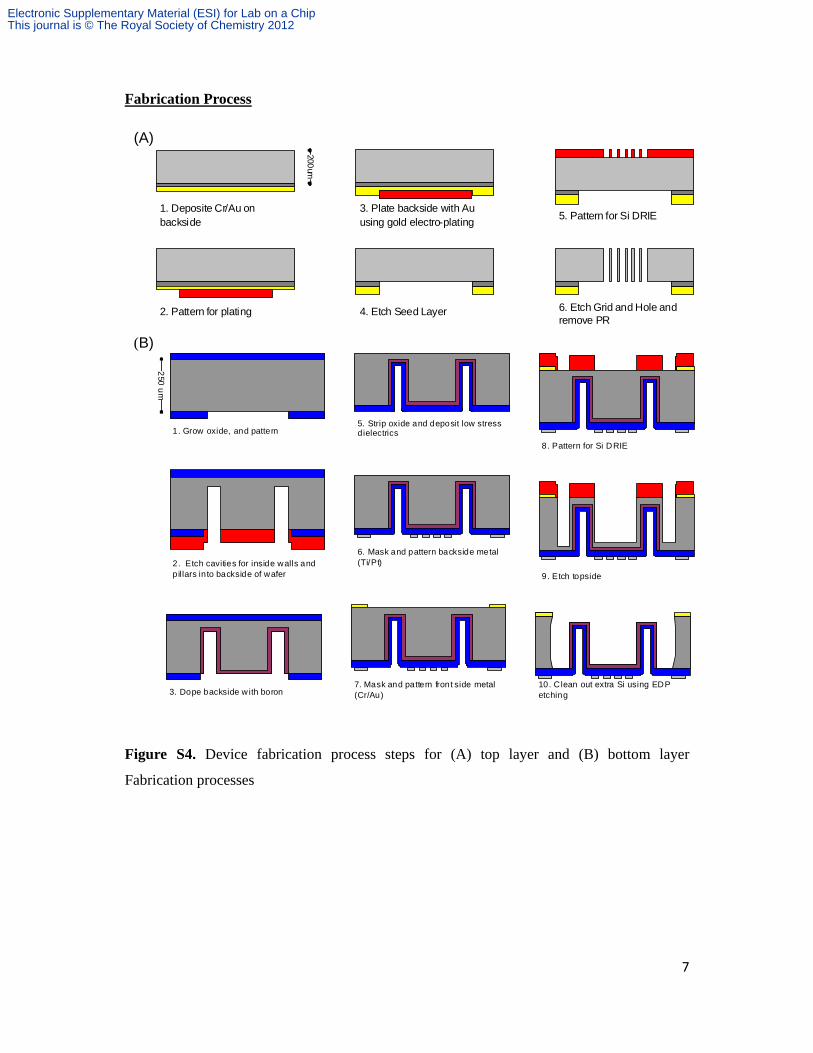
Fabrication Process
Figure S4. Device fabrication process steps for (A) top layer and (B) bottom layer
Fabrication processes
(A)
(B)
200um
1. Deposite Cr/Au on backside
3. Plate backside with Au using gold electro-plating
5. Pattern for Si DRIE
6. Etch Grid and Hole and remove PR
4. Etch Seed Layer2. Pattern for plating
8. Pattern for Si DRIE
9. Etch topside
10. C lean out extra Si using EDP etching
5. Strip oxide and deposit low stress dielectrics
6. Mask and pattern backside metal (Ti/Pt)
7. Mask and pattern front side metal (Cr/Au)3. Dope backside w ith boron
2. Etch cavities for inside walls and pillars into backside of wafer
250 u
m
1 . Grow oxide, and pattern
Electronic Supplementary Material (ESI) for Lab on a ChipThis journal is © The Royal Society of Chemistry 2012
8
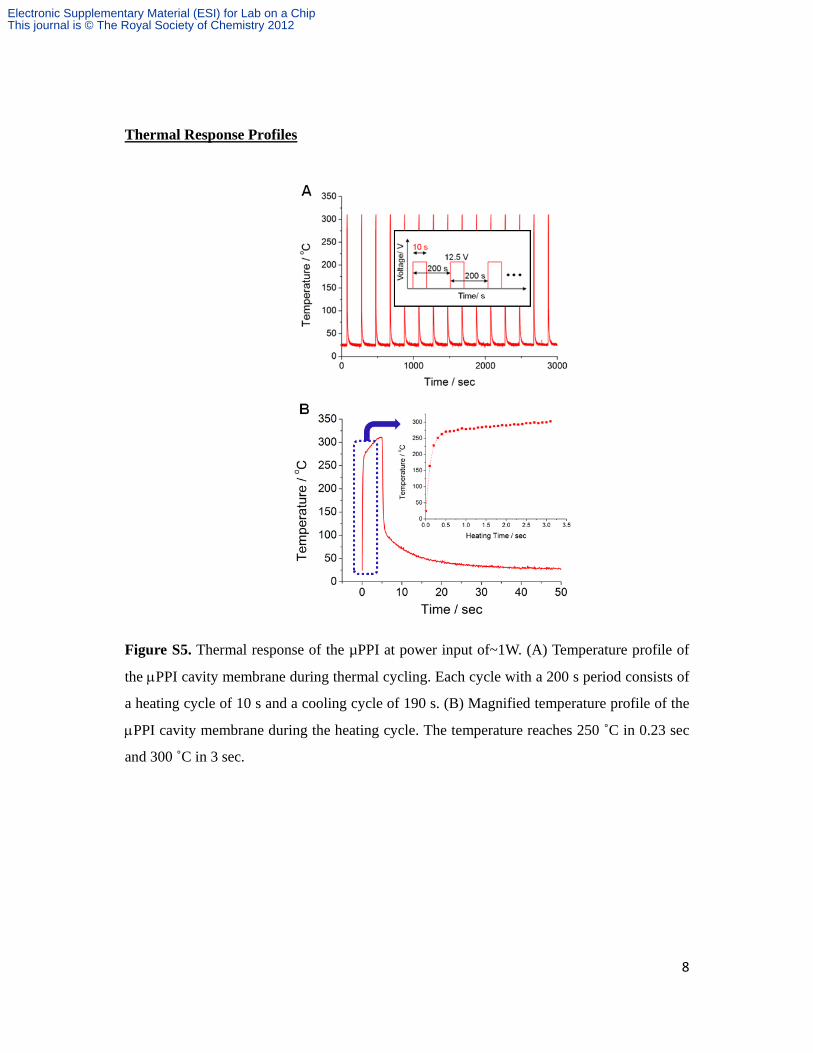
Thermal Response Profiles
Figure S5. Thermal response of the µPPI at power input of~1W. (A) Temperature profile of
the PPI cavity membrane during thermal cycling. Each cycle with a 200 s period consists of
a heating cycle of 10 s and a cooling cycle of 190 s. (B) Magnified temperature profile of the
PPI cavity membrane during the heating cycle. The temperature reaches 250 ˚C in 0.23 sec
and 300 ˚C in 3 sec.
Electronic Supplementary Material (ESI) for Lab on a ChipThis journal is © The Royal Society of Chemistry 2012
9
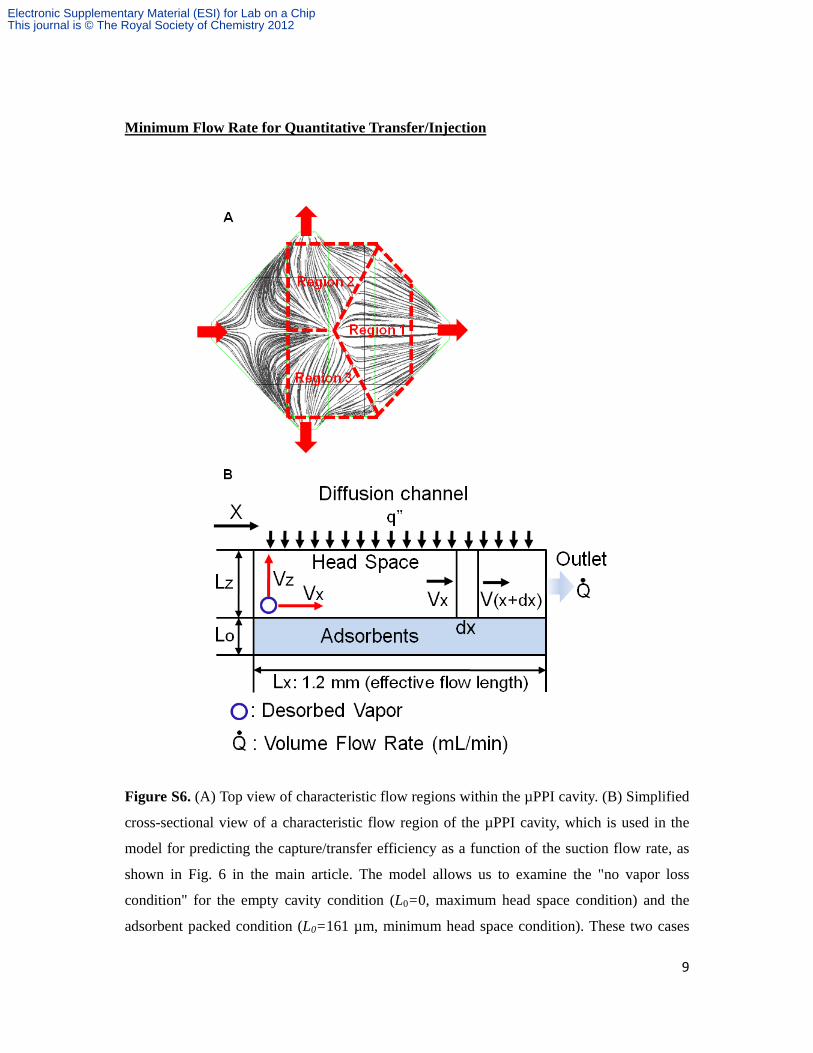
Minimum Flow Rate for Quantitative Transfer/Injection
Figure S6. (A) Top view of characteristic flow regions within the µPPI cavity. (B) Simplified
cross-sectional view of a characteristic flow region of the µPPI cavity, which is used in the
model for predicting the capture/transfer efficiency as a function of the suction flow rate, as
shown in Fig. 6 in the main article. The model allows us to examine the "no vapor loss
condition" for the empty cavity condition (L0=0, maximum head space condition) and the
adsorbent packed condition (L0=161 µm, minimum head space condition). These two cases
Electronic Supplementary Material (ESI) for Lab on a ChipThis journal is © The Royal Society of Chemistry 2012
10
are studied to verify that the CFD model in Fig. S3 is the most conservative (i.e., the worst
scenario) condition.
The CFD analysis indicates that the device cavity can be divided into 3 characteristic
flow regions between the central node of the flow pattern and the 3 outlet positions (Fig.
S3B), regardless of the suction flow rate. These regions have similar velocity distributions
and flow streamline patterns. The top of each characteristic region represents a position at
the bottom of the diffusion channel layer of the PPI. A spatially uniform vapor flux q''
driven by convention vertically enters the characteristic region from the top. The shape of
each characteristic region is approximated as a rectangular box defined by the cavity height
(the adsorbent height L0 + the head space height Lz), the effective flow length Lx, and the
characteristic width Ly. The values of Lx and Ly are determined by taking the average distance
between the two facing sides of the frame delineating the characteristic region in the x-
direction (i.e., the direction pointing towards the outlet from the central note) and y-direction
(i.e., the direction normal to the x-z plane), respectively. For Region 1, Lx is 1.2 mm and Ly is
2.0 mm, whereas Lx and Ly are both 1.2 mm for Regions 2 and 3. Lz is 89 µm and 250 µm for
the adsorbent packed condition and the empty cavity condition, respectively.
The model derives a mathematical formulation which accounts for the fraction of the
amount of vapor arriving at the bottom of the diffusion channel layer in the z-direction before
reaching the outlet to the total amount of vapor leaving the C-X surfaces. The "no loss
condition" refers to the condition where the desorbed vapors leaving the adsorbent surface
should horizontally reach the outlet without vertically arriving at the bottom surface of the
diffusion channel layer. The vapor velocity distribution is assumed to be uniform across the x-
y plane. The x-direction velocity Vx is estimated from the volumetric flow rate at each outlet.
The vapor velocity to the z-direction Vz is equivalent to the vapor desorption linear velocity.
The no loss condition requires the following relationship for the motion of the vapor
Electronic Supplementary Material (ESI) for Lab on a ChipThis journal is © The Royal Society of Chemistry 2012
11
molecules leaving the adsorbent surface at the left-end corner at x =0:
, (Eq. S7)
where tx is the time required for the particle to pass through the cavity in the x-direction, tz is
the time required for the particle to reach the bottom of the diffusion channel layer in the z-
direction. Applying mass balance for the differential control volume between x and x+dx, the
governing equation for Vx is derived as
0x
z
dV q
dx L
, (Eq. S8)
Solving the equation with the boundary conditions: ( ) ( )x x x z zV x L q L L L , and 0 "V q ,
which are derived from conservation of mass for the entire cavity and from the Bernoulli
equation, yields
( )( ) " z
xz
x LV x q
L
(Eq. S9)
Now, the horizontal travel time tx and the vertical travel time tz are given as follows:
0
1xL
xx
t dxV
(Eq. S10)
zz
z
Lt
V (Eq. S11)
Then, the critical position xc, which is the position along the x-direction where tx =tz for the
vapor molecules leaving the adsorbent surface, can be found using Eq. S10 and Eq. S11,
yields
1x
c
L
z xx
t dxV
(Eq. S12)
From Eq. S12, the critical position xc can be determined for a given volumetric flow rate. The
vapor molecules desorbed at 0 < x < xc escape from the diffusion channel while those
desorbed at x > xc are captured by the outlet flows and injected downstream from the PPI.
Electronic Supplementary Material (ESI) for Lab on a ChipThis journal is © The Royal Society of Chemistry 2012
12
Thus, the capture/transfer efficiency eff is given by
100x c
x
L xeff
L
(Eq. S13)
Using Eq. S13, the minimum volumetric flow rates satisfying the "no loss condition"
are 58.7 mL/min and 50.1 mL/min for the empty cavity and the adsorbent-packed cavity,
respectively. Therefore, we can conclude that the empty cavity (maximum head space case)
represents the most conservative condition, leading to the maximum vapor loss. The flow rate
value of 58.7 mL/min is consistent with that used in the aforementioned CFD analysis.
Electronic Supplementary Material (ESI) for Lab on a ChipThis journal is © The Royal Society of Chemistry 2012