microbiote en hématologie -...
TRANSCRIPT
Microbiote en hématologie
Florent Malard, MD, PhD Hématologie Clinique et Thérapie Cellulaire
Université Pierre & Marie Curie Hôpital Saint-Antoine
Paris
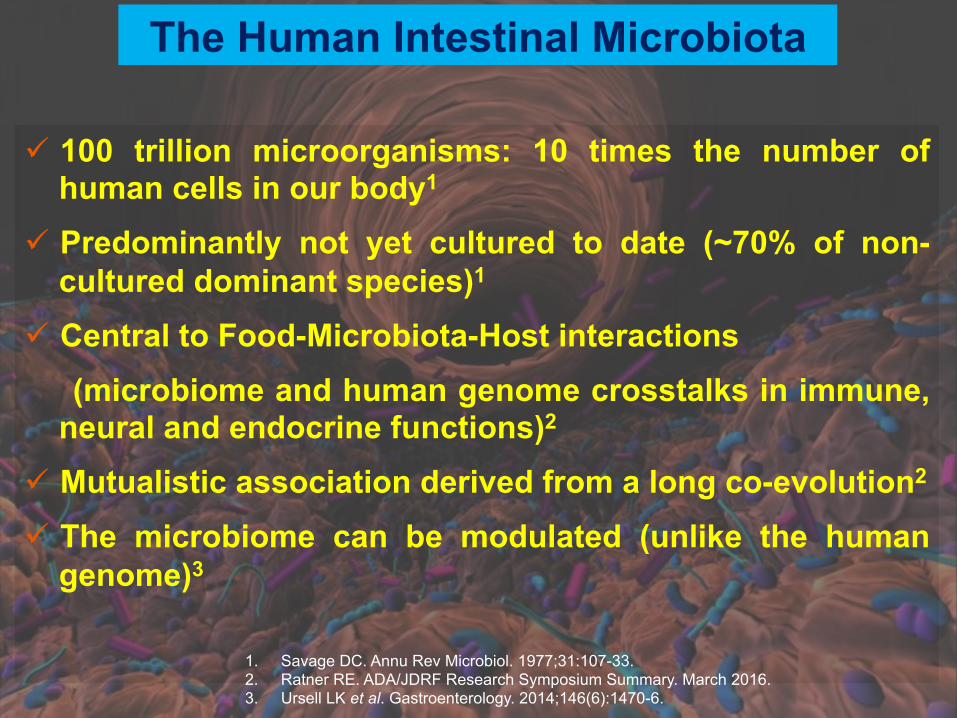
ü 100 trillion microorganisms: 10 times the number of human cells in our body1
ü Predominantly not yet cultured to date (~70% of non-cultured dominant species)1
ü Central to Food-Microbiota-Host interactions (microbiome and human genome crosstalks in immune,
neural and endocrine functions)2 ü Mutualistic association derived from a long co-evolution2 ü The microbiome can be modulated (unlike the human
genome)3
The Human Intestinal Microbiota
1. Savage DC. Annu Rev Microbiol. 1977;31:107-33. 2. Ratner RE. ADA/JDRF Research Symposium Summary. March 2016. 3. Ursell LK et al. Gastroenterology. 2014;146(6):1470-6.
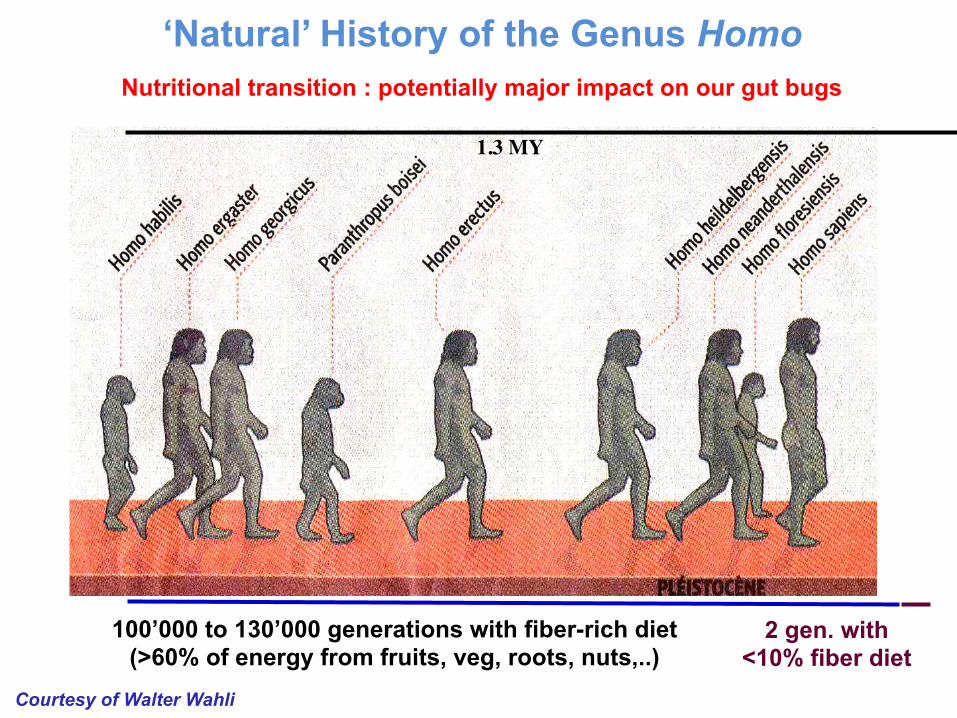
Nutritional transition : potentially major impact on our gut bugs
Courtesy of Walter Wahli
1.3 MY
100’000 to 130’000 generations with fiber-rich diet (>60% of energy from fruits, veg, roots, nuts,..)
2 gen. with <10% fiber diet
‘Natural’ History of the Genus Homo
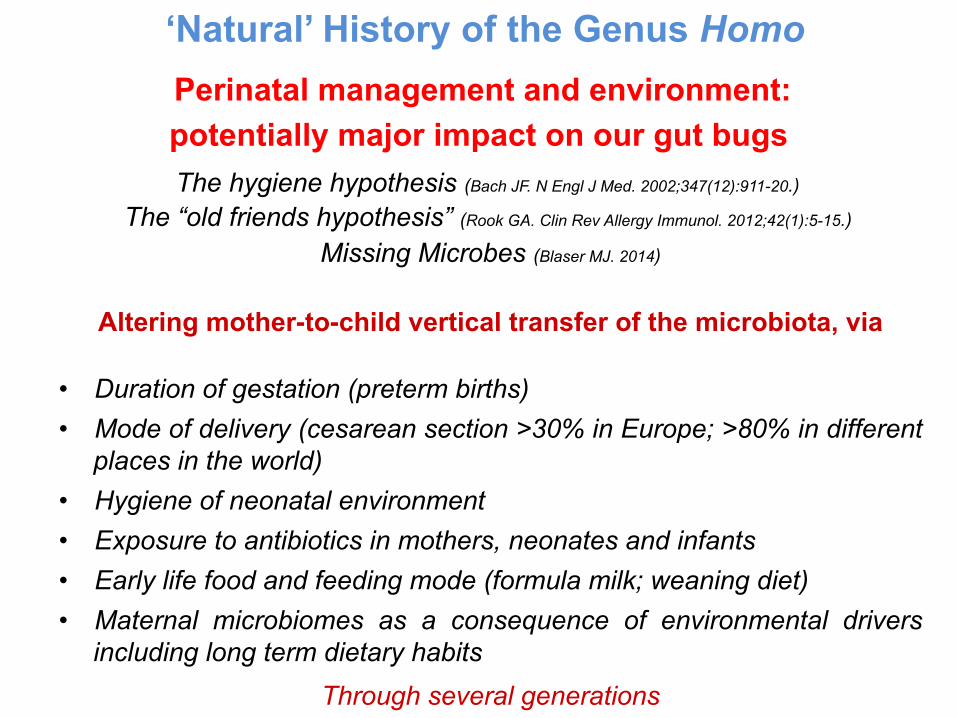
The hygiene hypothesis (Bach JF. N Engl J Med. 2002;347(12):911-20.) The “old friends hypothesis” (Rook GA. Clin Rev Allergy Immunol. 2012;42(1):5-15.)
Missing Microbes (Blaser MJ. 2014)
Altering mother-to-child vertical transfer of the microbiota, via
• Duration of gestation (preterm births) • Mode of delivery (cesarean section >30% in Europe; >80% in different
places in the world) • Hygiene of neonatal environment • Exposure to antibiotics in mothers, neonates and infants • Early life food and feeding mode (formula milk; weaning diet) • Maternal microbiomes as a consequence of environmental drivers
including long term dietary habits Through several generations
Perinatal management and environment: potentially major impact on our gut bugs
‘Natural’ History of the Genus Homo
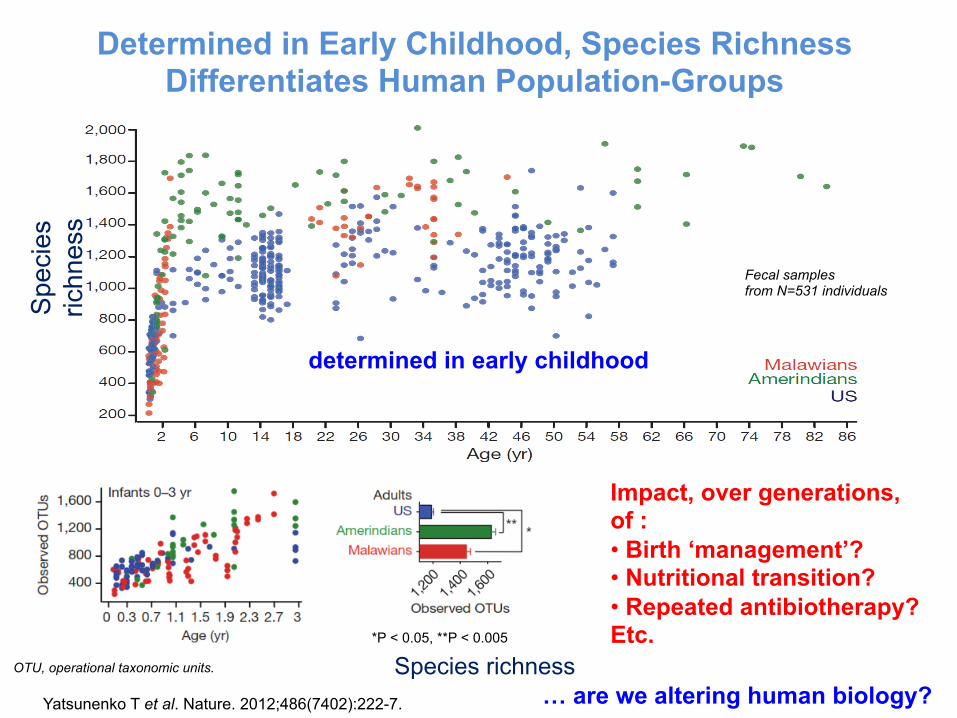
Determined in Early Childhood, Species Richness Differentiates Human Population-Groups
Yatsunenko T et al. Nature. 2012;486(7402):222-7.
Species richness
Spe
cies
ric
hnes
s
Impact, over generations, of : • Birth ‘management’? • Nutritional transition? • Repeated antibiotherapy? Etc.
… are we altering human biology?
determined in early childhood
Fecal samples from N=531 individuals
OTU, operational taxonomic units.
*P < 0.05, **P < 0.005
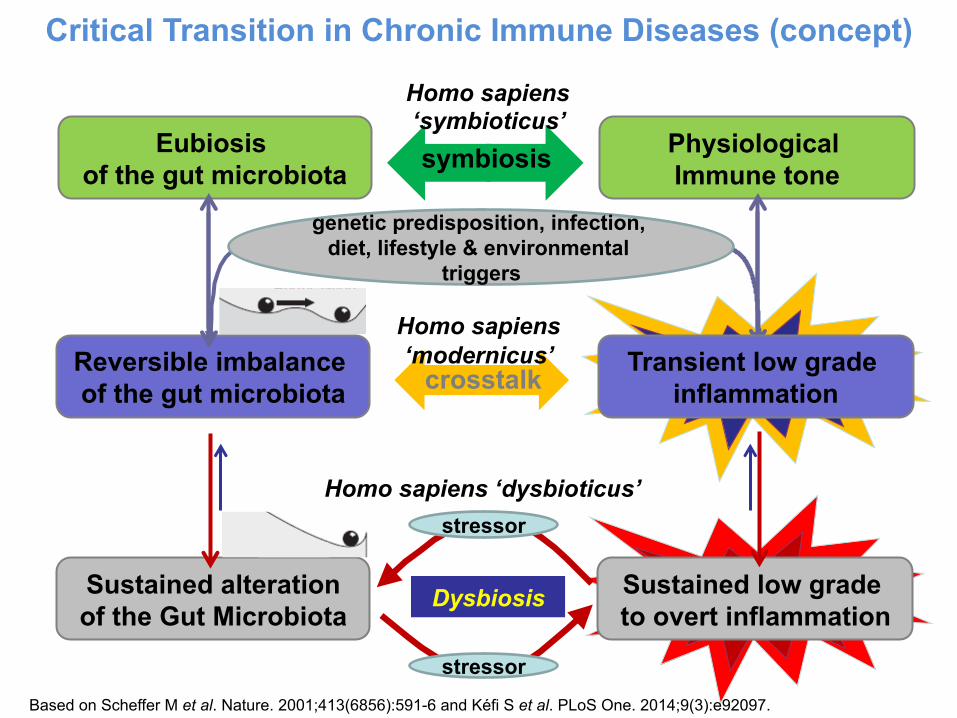
Critical Transition in Chronic Immune Diseases (concept)
Sustained alteration of the Gut Microbiota
Sustained low grade to overt inflammation
Dysbiosis
stressor
stressor
Homo sapiens ‘dysbioticus’
Eubiosis of the gut microbiota
Physiological Immune tone symbiosis
Reversible imbalance of the gut microbiota crosstalk
genetic predisposition, infection, diet, lifestyle & environmental
triggers
Transient low grade inflammation
Homo sapiens ‘modernicus’
Homo sapiens ‘symbioticus’
Based on Scheffer M et al. Nature. 2001;413(6856):591-6 and Kéfi S et al. PLoS One. 2014;9(3):e92097.

Microbiota Modulation: from Nutrition to Bacteriotherapy
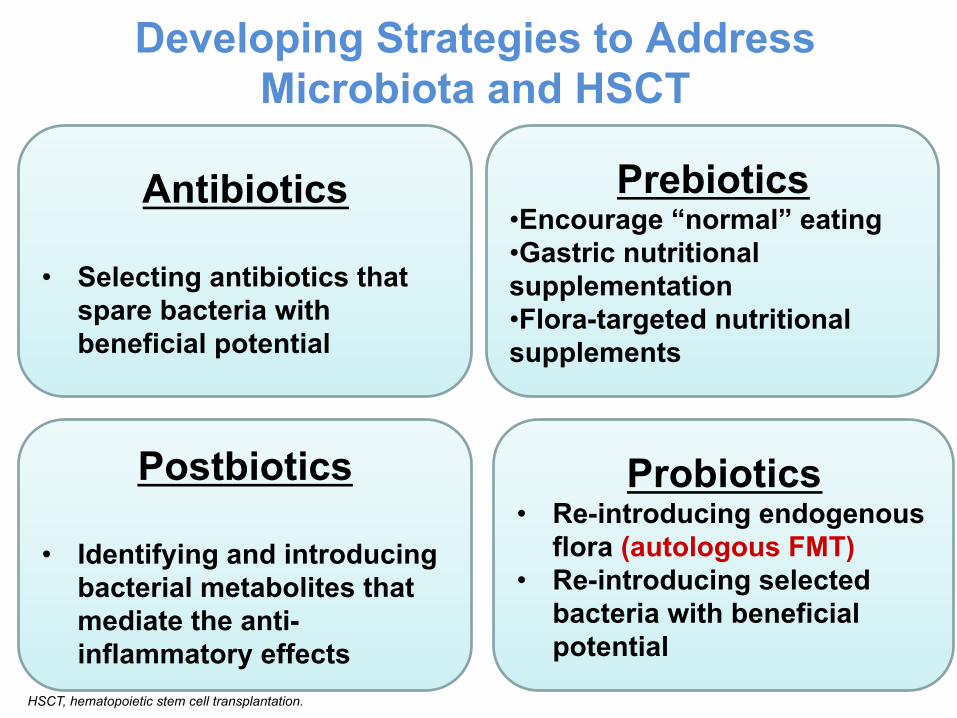
Developing Strategies to Address Microbiota and HSCT
Probiotics • Re-introducing endogenous
flora (autologous FMT) • Re-introducing selected
bacteria with beneficial potential
Postbiotics
• Identifying and introducing bacterial metabolites that mediate the anti-inflammatory effects
Prebiotics • Encourage “normal” eating • Gastric nutritional supplementation • Flora-targeted nutritional supplements
Antibiotics
• Selecting antibiotics that spare bacteria with beneficial potential
HSCT, hematopoietic stem cell transplantation.
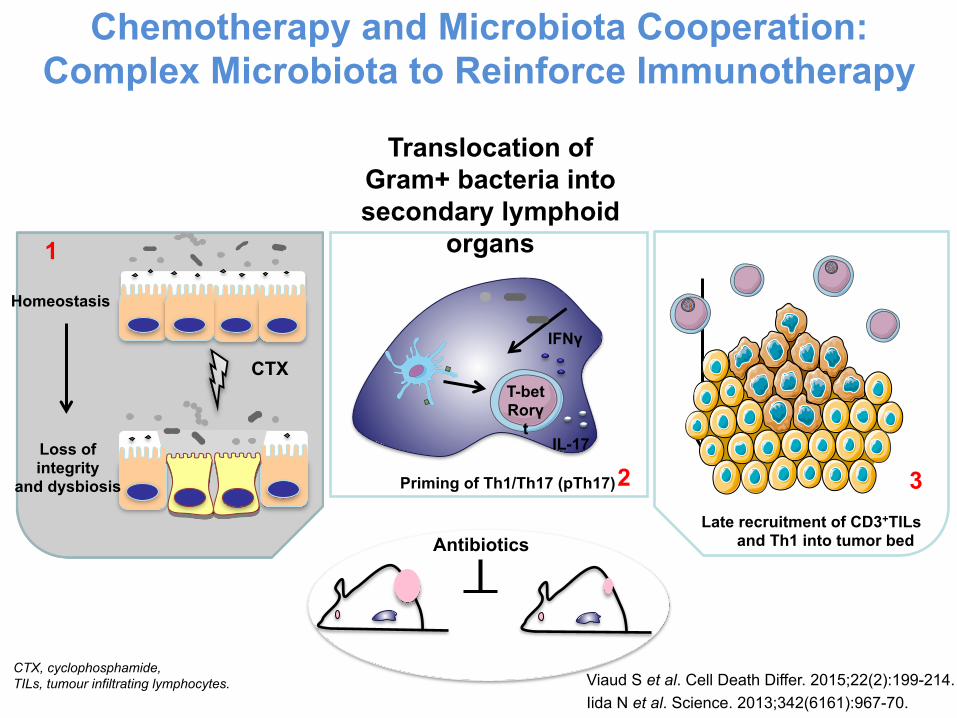
Chemotherapy and Microbiota Cooperation: Complex Microbiota to Reinforce Immunotherapy
Translocation of Gram+ bacteria into secondary lymphoid
organs
Priming of Th1/Th17 (pTh17)
Late recruitment of CD3+TILs and Th1 into tumor bed
T-bet Rorγ
t
IFNγ
IL-17
2 3
CTX
Homeostasis
Loss of integrity
and dysbiosis
1
Antibiotics
Viaud S et al. Cell Death Differ. 2015;22(2):199-214. Iida N et al. Science. 2013;342(6161):967-70.
CTX, cyclophosphamide, TILs, tumour infiltrating lymphocytes.
Anticancer immunotherapy by CTLA-4 blockade relies on the gut microbiota (Vétizou M et al. Science. 2015;350(6264):1079-84.)
• Tumors in antibiotic-treated or germ free mice did not respond to CTLA-4 blockade
• This defect is overcome by gavage with B. fragilis, by immunization with B. fragilis components, or by adoptive transfer of B. fragilis-specific T cells.
• CTLA-4 blockade favors the outgrowth of B. fragilis with anticancer properties.
Gut Microbiota Affects Checkpoint Blockade Efficacy
CTLA, Cytotoxic T lymphocyte antigen-4.
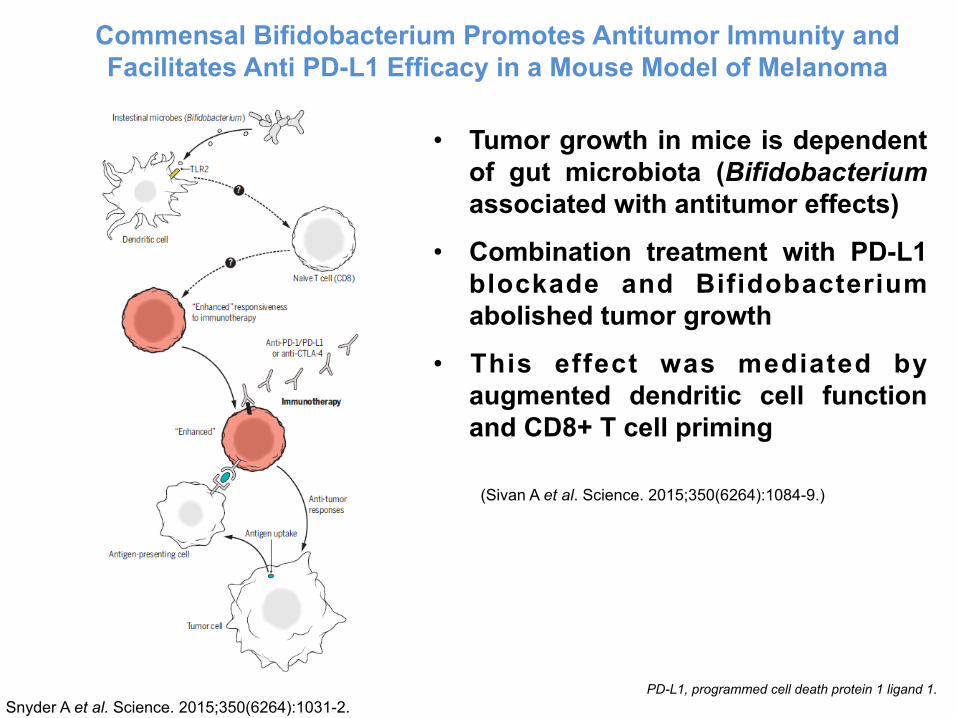
Snyder A et al. Science. 2015;350(6264):1031-2.
Commensal Bifidobacterium Promotes Antitumor Immunity and Facilitates Anti PD-L1 Efficacy in a Mouse Model of Melanoma
(Sivan A et al. Science. 2015;350(6264):1084-9.)
• Tumor growth in mice is dependent of gut microbiota (Bifidobacterium associated with antitumor effects)
• Combination treatment with PD-L1 blockade and Bifidobacterium abolished tumor growth
• This effect was mediated by augmented dendritic cell function and CD8+ T cell priming
PD-L1, programmed cell death protein 1 ligand 1.
The composition of intestinal microbiota can be manipulated to improve immune responses against cancer
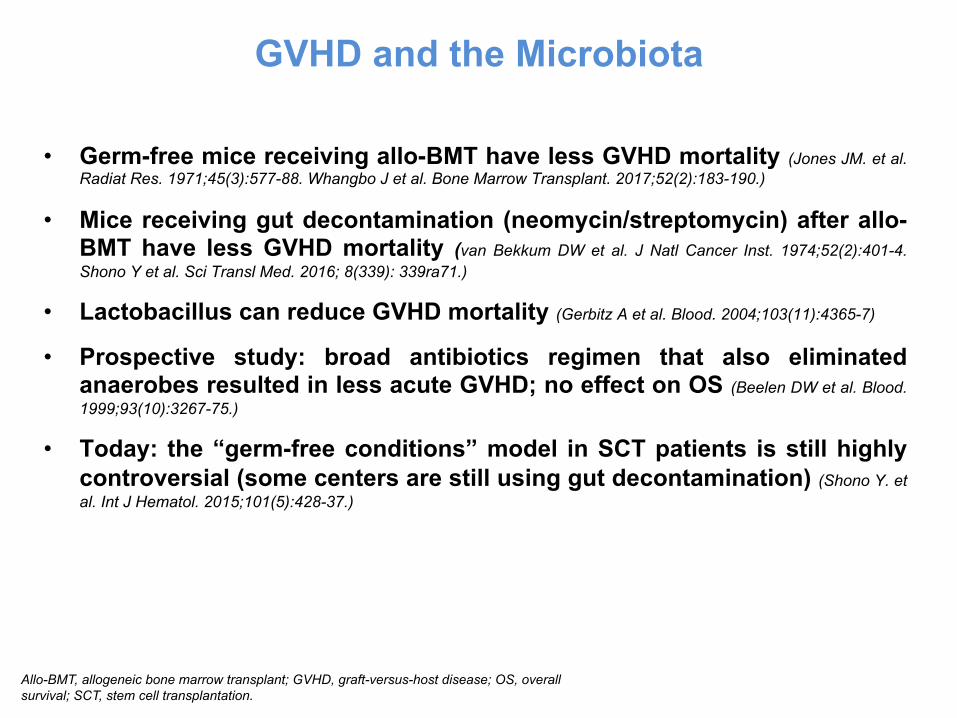
GVHD and the Microbiota
• Germ-free mice receiving allo-BMT have less GVHD mortality (Jones JM. et al. Radiat Res. 1971;45(3):577-88. Whangbo J et al. Bone Marrow Transplant. 2017;52(2):183-190.)
• Mice receiving gut decontamination (neomycin/streptomycin) after allo-BMT have less GVHD mortality (van Bekkum DW et al. J Natl Cancer Inst. 1974;52(2):401-4. Shono Y et al. Sci Transl Med. 2016; 8(339): 339ra71.)
• Lactobacillus can reduce GVHD mortality (Gerbitz A et al. Blood. 2004;103(11):4365-7)
• Prospective study: broad antibiotics regimen that also eliminated anaerobes resulted in less acute GVHD; no effect on OS (Beelen DW et al. Blood. 1999;93(10):3267-75.)
• Today: the “germ-free conditions” model in SCT patients is still highly controversial (some centers are still using gut decontamination) (Shono Y. et al. Int J Hematol. 2015;101(5):428-37.)
Allo-BMT, allogeneic bone marrow transplant; GVHD, graft-versus-host disease; OS, overall survival; SCT, stem cell transplantation.
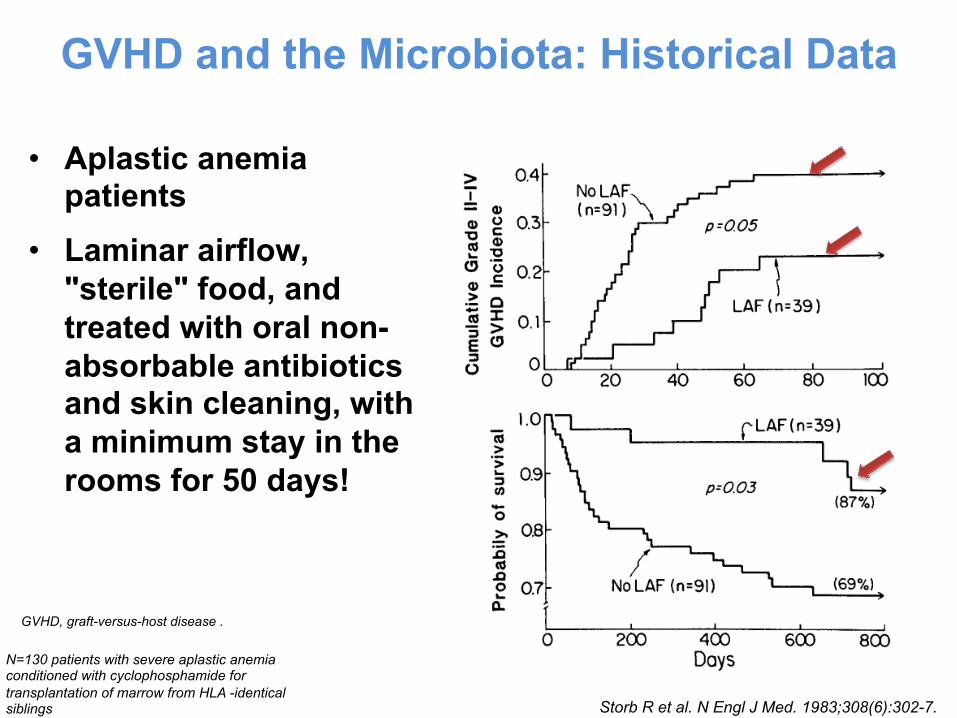
• Aplastic anemia patients
• Laminar airflow, "sterile" food, and treated with oral non-absorbable antibiotics and skin cleaning, with a minimum stay in the rooms for 50 days!
GVHD and the Microbiota: Historical Data
GVHD, graft-versus-host disease .
Storb R et al. N Engl J Med. 1983;308(6):302-7.
N=130 patients with severe aplastic anemia conditioned with cyclophosphamide for transplantation of marrow from HLA -identical siblings
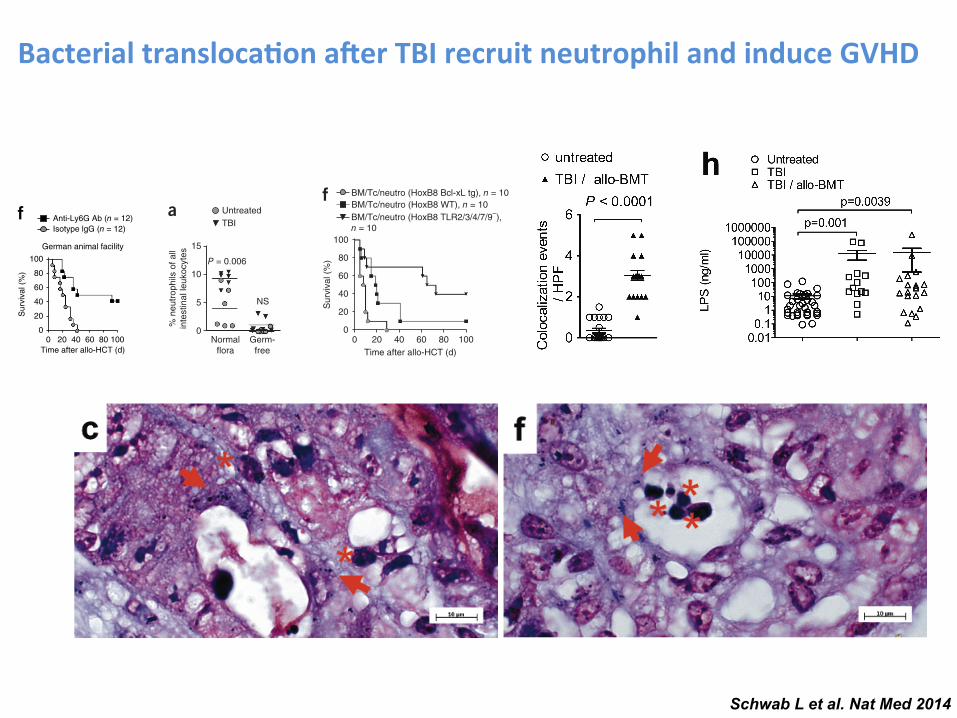
Schwab L et al. Nat Med 2014
Bacterial transloca-on a.er TBI recruit neutrophil and induce GVHD L E T T E R S
NATURE MEDICINE VOLUME 20 | NUMBER 6 | JUNE 2014 649
also performed an experiment comparable to the one described in Figure 1f at an animal facility in the United States, where the mice presumably have a different microflora. We saw improvement in the survival of the US mice when they received the anti-Ly6G antibody after TBI and allo-HCT (Fig. 1j) or when mice (Germany) were condi-tioned with busulphan and cyclophosphamide (BU/CY) chemotherapy (Supplementary Fig. 1a) and when we used a minor histocompat-ibility antigen–mismatched model (BALB/B into C57BL/6, Germany) of allo-HCT (Supplementary Fig. 1b).
To determine the anatomical locations in which neutrophils accu-mulate upon allo-HCT, we used a recently described bioluminescence
method5 that detects a key neutrophil enzyme, active myeloperoxi-dase. We observed peak myeloperoxidase activity on days 3 and 4 following allo-HCT and used complete Freund’s adjuvant as a posi-tive control (Fig. 2a,b). Nonmyeloablative conditioning (fludarabine and cyclophosphamide) led to less myeloperoxidase signal compared to myeloablative conditioning (busulphan and cyclophosphamide) (Fig. 2b). To more precisely locate the myeloperoxidase signal, we performed ex vivo imaging of the organs from the abdominal region where we detected the signal. On day 3, the main signal came from the terminal ileum (Fig. 2c). Histological analysis of the terminal ileum confirmed increased infiltration of Ly6G+ cells (Fig. 2d) and
105
a
104
5 × 10⁴
2 × 10⁴
5 × 10³
2 × 10³
103
RM
A s
igna
l val
ues
500
200
100
50
20
10
Untreated 24 hafterTBI
48 hafterTBI
Gm4841Ly6g
Olfm4Hsd17b6
Sptssbll1m
Cwh43Hao2Rdh7
Akr1c14Ly6d
Ccnb1ip1Hsd3b3
Ugt2b36Gml
AregMaobPrrg4Fmo5Saa3
Anxa1Gm12185,Tgtp1,Tgtp2
Gsdmc2,Gsdmc3,Gsdmc4Fabp6
Sult1d1Cndp1
H19Nox1Arg2
BC023105
Tnip3Ces2a
Cyp3a25Aldh1a7
Cyp3a59,Cyp3a57,Cyp3a25Gbp2
Olfr165
Ly6aCyp2d26
Atg9b
ligp1Cyp2c55
Plk2Dio1
Gm11437Hemt1,Gml
Plet1Myot
Akr1b8Gsdmc2
i Isotype lgG (n = 10)Anti-Ly6G (n = 10)
100
80
60
40
20
0
Sur
viva
l (%
)
Time after syn-HCT (d)0 10 20 30 40 50
jUS animal facilities
100
80
60
40
20
0
Sur
viva
l (%
)
Time after allo-HCT (d)0 10 20 30 40 50
Isotype lgG (n = 15)Anti-Ly6G (n = 15)
e
Ly6C
+ F4/
80+ c
ells
of
CD
45+ C
D11
b+ cel
ls (
%)
80Monocytes
60
40
20
0
NS
Ly6C
– F4/
80+ c
ells
of
CD
45+ C
D11
b+ cel
ls (
%)
20
Macrophages
NS15
10
5
0
Isotype AbAnti-Ly6G Ab
Isotype AbAnti-Ly6G Ab
fIsotype lgG (n = 12)Anti-Ly6G Ab (n = 12)
German animal facility100
80
60
40
20
0
Sur
viva
l (%
)
100806040200Time after allo-HCT (d)
**Liver
GV
HD
his
tolo
gysc
ore
3
2
1
0
***
Largeintestines
GV
HD
his
tolo
gysc
ore
3
2
1
0
h
**
Smallintestines
3
GV
HD
his
tolo
gysc
ore 2
1
0
Anti-Ly6G Ab (n = 6)Isotype lgG (n = 7)
b
6,000
Ly6g
RM
Asi
gnal
val
ues
4,000
2,000
0
Untreated24 h after TBI48 h after TBI
g
*
Isotype lgG (n = 4)Anti-Ly6G Ab (n = 3)
100
IFN
- (
pg m
l–1)
80
60
40
20
0
c
100 ***
**
Ly6G
+ cel
ls o
f CD
45+ C
D11
b+
cells
(%
)
Isotype AbAnti-Ly6G Ab
Day 1
80
60
40
20
0Day 2 Day 3
***
d*** ***
*
Abs
olut
e nu
mbe
rsof
neu
trop
hils
per
200
l per
iphe
ral b
lood 500
Day 1 Day 2 Day 3
400
300
200
300
Isotype AbAnti-Ly6G Ab
Figure 1 Anti-Ly6G antibody treatment improves survival after MHC-mismatched allo-HCT. (a,b) Microarray-based analysis of RNA expression levels of multiple genes in the terminal ileum of BALB/c mice after TBI (9 Gy), n = 4 for each group. (a) Tile display for the 50 most significantly regulated genes, expressed by Robust Multichip Average (RMA) signal values of 4 individual samples from the following groups: untreated, 24 h after TBI and 48 h after TBI. Red square, Ly6G is the second most significantly regulated gene. (b) Expression levels of Ly6g in the intestines at different time points after TBI. Each data point represents an individual animal. Untreated versus 24 h, P < 0.0001; untreated versus 48 h, P < 0.0001, Benjamini-Hochberg q value 2.675 × 10⁻⁵. An unpaired Student’s t-test (two- sided) was applied to calculate P values. All P values were calculated using a Benjamini-Hochberg multiple-testing correction. The experiment was performed once. (c,d) The proportion of CD45+CD11b+Ly6G+ neutrophils in peripheral blood at different time points after allo-HCT from C57BL/6 into BALB/c mice. Relative (c) and absolute (d) numbers of neutrophils are shown from mice injected with 500 g anti-Ly6G antibody or isotype control antibody per mouse on day 1 of allo-HCT. Bar diagrams represent mean s.e.m., n = 6 for each time point, with results pooled from two independent experiments. *P < 0.05, **P < 0.01, ***P < 0.001, unpaired Student’s t-test (two-sided). (e) The proportion of monocytes and macrophages in peripheral blood at day 2 after allo-HCT from C57BL/6 into BALB/c mice. Bar diagrams represent mean s.e.m., n = 6 for each time point (except for day 3 where n = 7), with results pooled from two independent experiments. NS, not significant, P > 0.05, unpaired Student’s t-test (two-sided). (f) Survival of BALB/c recipients receiving allo-HCT from C57BL/6 donors (n = 12 per group). Data are pooled from two experiments (6 mice per experiment at Freiburg University, Germany). Isotype IgG versus anti-Ly6G, P = 0.007. Differences in animal survival were analyzed by log-rank test. (g) IFN- in the serum of the indicated groups on day 7 (from mice injected with 500 g anti-Ly6G antibody per mouse on day 1 of allo-HCT). Data (mean s.e.m.) are pooled from two independent experiments. *P < 0.05, unpaired Student’s t-test (two-sided). (h) Scored histopathologic changes in the small intestines, large intestines and liver isolated on day 7 after allo-HCT (from mice injected with 250 g anti-Ly6G antibody per mouse on day 1 of allo-HCT). Data (mean s.e.m.) are pooled from two independent experiments. **P < 0.01, ***P < 0.001, unpaired Student’s t-test (two-sided). (i) Percentage survival of syn-HCT recipients (B6D2F1 in B6D2F1 model) injected with 500 g anti-Ly6G antibody or isotype control antibody on days 1 to 5 after syn-HCT. Results are representative of two experiments. (j) Percentage survival of BALB/c recipients receiving allo-HCT from C57BL/6 donors. Data are pooled from the three independent experiments (Shreveport, Louisiana, USA, 1 experiment; Salt Lake City, Utah, USA, 2 experiments). Isotype IgG versus anti-Ly6G, P = 0.0014. Differences in animal survival were analyzed by log-rank test.
L E T T E R S
652 VOLUME 20 | NUMBER 6 | JUNE 2014 NATURE MEDICINE
rectum, and signals from SPIO+ E. coli in a dipole-shaped pattern had appeared in the tissue surrounding the intestinal wall (Supplementary Fig. 2c,d). We detected SPIO in the mesenteric lymph follicles close to the intestinal wall (Supplementary Fig. 2e), saw co-localization of neutrophils and bacteria in the intestinal tissue (Supplementary Fig. 3a–g) and, consistent with intestinal leakage, detected increased serum lipopolysaccharide (LPS) levels after TBI followed by allo-HCT (Supplementary Fig. 3h).
To assess whether the recruitment of neutrophils to the ileum following TBI might be caused by invading bacteria, we compared the frequency of neutrophils in the ilea of mice with normal flora with that in the ilea of mice raised under germ-free conditions. Germ-free mice did not show the increased frequency of neutrophils that we observed in the ilea of mice with normal flora after TBI (Fig. 4a), which is compatible with the finding that intestinal inflammation is regulated by the microbiota16.
The marker Ly6G, used to deplete neutrophils, is also present on other cell types17. Therefore, to validate the role of neutrophils in GVHD, we generated chimeric mice using BM from Mcl1fl/fl; Lyz2tm1(cre) mice, which specifically lack neutrophils18. We confirmed the selective lack of neutrophils (Fig. 4b), and found that Mcl1fl/fl; Lyz2tm1(cre) BM chimeras had improved survival (Fig. 4c) and reduced histological GVHD severity after allo-HCT (Fig. 4d) compared to chimeric Mcl1+/+; Lyz2tm1(cre) controls.
To clarify the link between invading bacteria and neutrophil activa-tion, we depleted endogenous neutrophils via injection of anti-Ly6G antibody and then transferred HoxB8 neutrophil progenitors expressing GFP9 into the mice (Supplementary Fig. 1g and Fig. 4e). To assess the contribution of bacterial activation of neutrophils, we compared WT neutrophils to neutrophils lacking TLR2, TLR3, TLR4, TLR7 and TLR9 (TLR2/3/4/7/9−). As these cells are unresponsive to most bacterial pathogen–associated molecular patterns, we expected them to be less
dMcl1fl/fl; Lyz2tm1(cre) (n = 8)Mcl1+/+; Lyz2tm1(cre) (n = 8)
GV
HD
his
tolo
gy s
core
P = 0.006
Liver
3
2
1
0GV
HD
his
tolo
gy s
core
P = 0.0002
Largeintestines
4
3
2
1
0
4
GV
HD
his
tolo
gy s
core
P = 0.0001
Smallintestines
3
2
1
0
3
b
8
Neutrophils Monocytes
Ly6G
+ cel
ls o
fC
D45
+ CD
11b+ c
ells
(%
) CD
115+ Ly6C
+ cells ofC
D45
+ CD
11b+ cells (%
)
Mcl1fl/fl; Lyz2tm1(cre) (n = 6)Mcl1+/+; Lyz2tm1(cre) (n = 6)
NSP = 0.025
2
1
0
6
4
2
0
15
a
10
5
Untreated
0
% n
eutr
ophi
ls o
f all
inte
stin
al le
ukoc
ytes
TBI
NS
Normalflora
Germ-free
P = 0.006100
c
Sur
viva
l (%
) 80
60
40
20
00 20 40 60 80
Time after allo-HCT (d)
Mcl1fl/fl; Lyz2tm1(cre) (n = 11)Mcl1+/+; Lyz2tm1(cre) (n = 10)
e
P < 0.001lleum
GF
P+ c
ells
/HP
F
25
20
15
10
5
0
allo-HCTallo-HCT +HoxB8Bcl-xL tg GFP+
His
tol.
GV
HD
sco
re
P = 0.011
Smallintestines
4
3
2
1
0 His
tol.
GV
HD
sco
re
P = 0.0065
Largeintestines
4
3
2
1
0 His
tol.
GV
HD
sco
re
P = 0.01
Liver
4
3
2
1
0
h
IL-1
2 (p
g m
l–1)
IFN
- (
pg m
l–1)
P = 0.031P = 0.012250150
Bcl-xL tgTLR2/3/4/7/9–WT
200
150
100
50
0
100
50
0
g
Sur
viva
l (%
)
0 20 40 60 80 100Time after allo-HCT (d)
100
f BM/Tc/neutro (HoxB8 Bcl-xL tg), n = 10BM/Tc/neutro (HoxB8 WT), n = 10BM/Tc/neutro (HoxB8 TLR2/3/4/7/9–),n = 10
80
60
40
20
00 20 40 60 80
Time after allo-HCT (d)
BM/Tc (n = 17)BM/Tc + Donor HoxB8WT (n = 10)
Sur
viva
l (%
) 80
60
40
20
0
100
i
j P = 0.0001
P = 0.016
MP
O+ c
ells
/HP
F
80
60
40
20
00
100
l–ll lll–lVGVHD grade
Bcl-xL tgTLR2/3/4/7/9–WT
Bcl-xL tg (n = 4)
TLR2/3/4/7/9– (n = 5)WT (n = 6)
Figure 4 Neutrophil recruitment into the intestines is dependent on commensal microflora, and neutrophil-mediated tissue damage requires neutrophil activation via TLRs. (a) The percentage of intestinal neutrophils (CD45+, F4-80−, Gr-1+ and CD11b+) relative to all intestinal leukocytes is displayed for irradiated (3 d after 9-Gy TBI) and untreated mice under normal or germ-free conditions. Data are pooled from three experiments. Normal flora and untreated or normal flora and irradiated, n = 6; germ-free and irradiated, n = 6; germ-free and untreated, n = 8. (b) Frequency of neutrophils and other cells in the peripheral blood on day 28 after syn-HCT in BM chimeras with BM derived from Mcl1fl/fl; Lyz2tm1(cre) or littermate control (Mcl1+/+; Lyz2tm1(cre)) mice. Data are pooled from two experiments. (c,d) BM chimeras with BM derived from Mcl1fl/fl; Lyz2tm1(cre) or Mcl1+/+; Lyz2tm1(cre) mice after undergoing allo-HCT as described for the BALB/c C57BL/6 combination. (c) Survival of chimeric C57BL/6 mice is shown (Mcl1fl/fl; Lyz2tm1(cre) versus Mcl1+/+; Lyz2tm1(cre), P = 0.002). The experiment was performed twice and the results were pooled. (d) Histopathological GVHD severity of chimeric C57BL/6 mice after allo-HCT (BALB/c C57BL/6) is shown (Mcl1fl/fl; Lyz2tm1(cre) versus Mcl1+/+; Lyz2tm1(cre)). The small intestines, large intestines and liver were isolated on day 5 after allo-HCT and scored. The combined score for inflammation and apoptosis is shown. Data are presented as mean s.e.m. (e). Frequency of GFP+ cells analyzed by immunofluorescence microscopy on day 7 in ilea of mice that received allo-HCT as described for the BALB/c C57BL/6 combination and mice that received allo-HCT and recipient-type GFP+ HoxB8 cells overexpressing Bcl-xL (Bcl-xL tg) (P < 0.001). The experiment was performed twice and the results were pooled (n = 14 for each group). (f) Survival of C57BL/6 recipients is shown. Mice received an allo-HCT as described for the BALB/c C57BL/6 combination and recipient type (C57BL/6) HoxB8 cells with a WT genotype, Bcl-xL overexpression or deficiency of TLR2, TLR3, TLR4, TLR7 and TLR9. The experiment was performed twice and the results were pooled. WT versus TLR2/3/4/7/9−, P = 0.003; WT versus Bcl-xL overexpression, P = 0.012. Neutro, neutrophils. (g) The IL-12 and IFN- levels in the serum of the indicated groups on day 5. The groups represent n = 4 (HoxB8 Bcl-xL tg), n = 5 (TLR2/3/4/7/9−) and n = 4 (WT) animals. Data are presented as mean s.e.m. (h) The small intestines, large intestines and liver were isolated on day 5 after allo-HCT and scored. The combined score for inflammation and apoptosis is shown with representative images for the individual groups. Data are presented as mean s.e.m. Histol., histology. (i) Survival of C57BL/6 recipients (BALB/c C57BL/6 combination) is shown for a group that received BM/Tc alone or additional donor-type HoxB8 cells with a WT genotype. BM/Tc alone versus BM/Tc + donor HoxB8 WT cells, P < 0.001. (j) The frequency of myeloperoxidase-positive (MPO+) cells per HPF was correlated with the GVHD severity in patients that had undergone diagnostic colonoscopy after allo-HCT (GVHD grade 0, n = 8; GVHD grade I–II, n = 14; GVHD grade III–IV, n = 15). The patient characteristics are detailed in Supplementary Table 1.
L E T T E R S
652 VOLUME 20 | NUMBER 6 | JUNE 2014 NATURE MEDICINE
rectum, and signals from SPIO+ E. coli in a dipole-shaped pattern had appeared in the tissue surrounding the intestinal wall (Supplementary Fig. 2c,d). We detected SPIO in the mesenteric lymph follicles close to the intestinal wall (Supplementary Fig. 2e), saw co-localization of neutrophils and bacteria in the intestinal tissue (Supplementary Fig. 3a–g) and, consistent with intestinal leakage, detected increased serum lipopolysaccharide (LPS) levels after TBI followed by allo-HCT (Supplementary Fig. 3h).
To assess whether the recruitment of neutrophils to the ileum following TBI might be caused by invading bacteria, we compared the frequency of neutrophils in the ilea of mice with normal flora with that in the ilea of mice raised under germ-free conditions. Germ-free mice did not show the increased frequency of neutrophils that we observed in the ilea of mice with normal flora after TBI (Fig. 4a), which is compatible with the finding that intestinal inflammation is regulated by the microbiota16.
The marker Ly6G, used to deplete neutrophils, is also present on other cell types17. Therefore, to validate the role of neutrophils in GVHD, we generated chimeric mice using BM from Mcl1fl/fl; Lyz2tm1(cre) mice, which specifically lack neutrophils18. We confirmed the selective lack of neutrophils (Fig. 4b), and found that Mcl1fl/fl; Lyz2tm1(cre) BM chimeras had improved survival (Fig. 4c) and reduced histological GVHD severity after allo-HCT (Fig. 4d) compared to chimeric Mcl1+/+; Lyz2tm1(cre) controls.
To clarify the link between invading bacteria and neutrophil activa-tion, we depleted endogenous neutrophils via injection of anti-Ly6G antibody and then transferred HoxB8 neutrophil progenitors expressing GFP9 into the mice (Supplementary Fig. 1g and Fig. 4e). To assess the contribution of bacterial activation of neutrophils, we compared WT neutrophils to neutrophils lacking TLR2, TLR3, TLR4, TLR7 and TLR9 (TLR2/3/4/7/9−). As these cells are unresponsive to most bacterial pathogen–associated molecular patterns, we expected them to be less
dMcl1fl/fl; Lyz2tm1(cre) (n = 8)Mcl1+/+; Lyz2tm1(cre) (n = 8)
GV
HD
his
tolo
gy s
core
P = 0.006
Liver
3
2
1
0GV
HD
his
tolo
gy s
core
P = 0.0002
Largeintestines
4
3
2
1
0
4
GV
HD
his
tolo
gy s
core
P = 0.0001
Smallintestines
3
2
1
0
3
b
8
Neutrophils Monocytes
Ly6G
+ cel
ls o
fC
D45
+ CD
11b+ c
ells
(%
) CD
115+ Ly6C
+ cells ofC
D45
+ CD
11b+ cells (%
)
Mcl1fl/fl; Lyz2tm1(cre) (n = 6)Mcl1+/+; Lyz2tm1(cre) (n = 6)
NSP = 0.025
2
1
0
6
4
2
0
15
a
10
5
Untreated
0
% n
eutr
ophi
ls o
f all
inte
stin
al le
ukoc
ytes
TBI
NS
Normalflora
Germ-free
P = 0.006100
c
Sur
viva
l (%
) 80
60
40
20
00 20 40 60 80
Time after allo-HCT (d)
Mcl1fl/fl; Lyz2tm1(cre) (n = 11)Mcl1+/+; Lyz2tm1(cre) (n = 10)
e
P < 0.001lleum
GF
P+ c
ells
/HP
F
25
20
15
10
5
0
allo-HCTallo-HCT +HoxB8Bcl-xL tg GFP+
His
tol.
GV
HD
sco
re
P = 0.011
Smallintestines
4
3
2
1
0 His
tol.
GV
HD
sco
re
P = 0.0065
Largeintestines
4
3
2
1
0 His
tol.
GV
HD
sco
re
P = 0.01
Liver
4
3
2
1
0
h
IL-1
2 (p
g m
l–1)
IFN
- (
pg m
l–1)
P = 0.031P = 0.012250150
Bcl-xL tgTLR2/3/4/7/9–WT
200
150
100
50
0
100
50
0
g
Sur
viva
l (%
)0 20 40 60 80 100
Time after allo-HCT (d)
100
f BM/Tc/neutro (HoxB8 Bcl-xL tg), n = 10BM/Tc/neutro (HoxB8 WT), n = 10BM/Tc/neutro (HoxB8 TLR2/3/4/7/9–),n = 10
80
60
40
20
00 20 40 60 80
Time after allo-HCT (d)
BM/Tc (n = 17)BM/Tc + Donor HoxB8WT (n = 10)
Sur
viva
l (%
) 80
60
40
20
0
100
i
j P = 0.0001
P = 0.016
MP
O+ c
ells
/HP
F
80
60
40
20
00
100
l–ll lll–lVGVHD grade
Bcl-xL tgTLR2/3/4/7/9–WT
Bcl-xL tg (n = 4)
TLR2/3/4/7/9– (n = 5)WT (n = 6)
Figure 4 Neutrophil recruitment into the intestines is dependent on commensal microflora, and neutrophil-mediated tissue damage requires neutrophil activation via TLRs. (a) The percentage of intestinal neutrophils (CD45+, F4-80−, Gr-1+ and CD11b+) relative to all intestinal leukocytes is displayed for irradiated (3 d after 9-Gy TBI) and untreated mice under normal or germ-free conditions. Data are pooled from three experiments. Normal flora and untreated or normal flora and irradiated, n = 6; germ-free and irradiated, n = 6; germ-free and untreated, n = 8. (b) Frequency of neutrophils and other cells in the peripheral blood on day 28 after syn-HCT in BM chimeras with BM derived from Mcl1fl/fl; Lyz2tm1(cre) or littermate control (Mcl1+/+; Lyz2tm1(cre)) mice. Data are pooled from two experiments. (c,d) BM chimeras with BM derived from Mcl1fl/fl; Lyz2tm1(cre) or Mcl1+/+; Lyz2tm1(cre) mice after undergoing allo-HCT as described for the BALB/c C57BL/6 combination. (c) Survival of chimeric C57BL/6 mice is shown (Mcl1fl/fl; Lyz2tm1(cre) versus Mcl1+/+; Lyz2tm1(cre), P = 0.002). The experiment was performed twice and the results were pooled. (d) Histopathological GVHD severity of chimeric C57BL/6 mice after allo-HCT (BALB/c C57BL/6) is shown (Mcl1fl/fl; Lyz2tm1(cre) versus Mcl1+/+; Lyz2tm1(cre)). The small intestines, large intestines and liver were isolated on day 5 after allo-HCT and scored. The combined score for inflammation and apoptosis is shown. Data are presented as mean s.e.m. (e). Frequency of GFP+ cells analyzed by immunofluorescence microscopy on day 7 in ilea of mice that received allo-HCT as described for the BALB/c C57BL/6 combination and mice that received allo-HCT and recipient-type GFP+ HoxB8 cells overexpressing Bcl-xL (Bcl-xL tg) (P < 0.001). The experiment was performed twice and the results were pooled (n = 14 for each group). (f) Survival of C57BL/6 recipients is shown. Mice received an allo-HCT as described for the BALB/c C57BL/6 combination and recipient type (C57BL/6) HoxB8 cells with a WT genotype, Bcl-xL overexpression or deficiency of TLR2, TLR3, TLR4, TLR7 and TLR9. The experiment was performed twice and the results were pooled. WT versus TLR2/3/4/7/9−, P = 0.003; WT versus Bcl-xL overexpression, P = 0.012. Neutro, neutrophils. (g) The IL-12 and IFN- levels in the serum of the indicated groups on day 5. The groups represent n = 4 (HoxB8 Bcl-xL tg), n = 5 (TLR2/3/4/7/9−) and n = 4 (WT) animals. Data are presented as mean s.e.m. (h) The small intestines, large intestines and liver were isolated on day 5 after allo-HCT and scored. The combined score for inflammation and apoptosis is shown with representative images for the individual groups. Data are presented as mean s.e.m. Histol., histology. (i) Survival of C57BL/6 recipients (BALB/c C57BL/6 combination) is shown for a group that received BM/Tc alone or additional donor-type HoxB8 cells with a WT genotype. BM/Tc alone versus BM/Tc + donor HoxB8 WT cells, P < 0.001. (j) The frequency of myeloperoxidase-positive (MPO+) cells per HPF was correlated with the GVHD severity in patients that had undergone diagnostic colonoscopy after allo-HCT (GVHD grade 0, n = 8; GVHD grade I–II, n = 14; GVHD grade III–IV, n = 15). The patient characteristics are detailed in Supplementary Table 1.
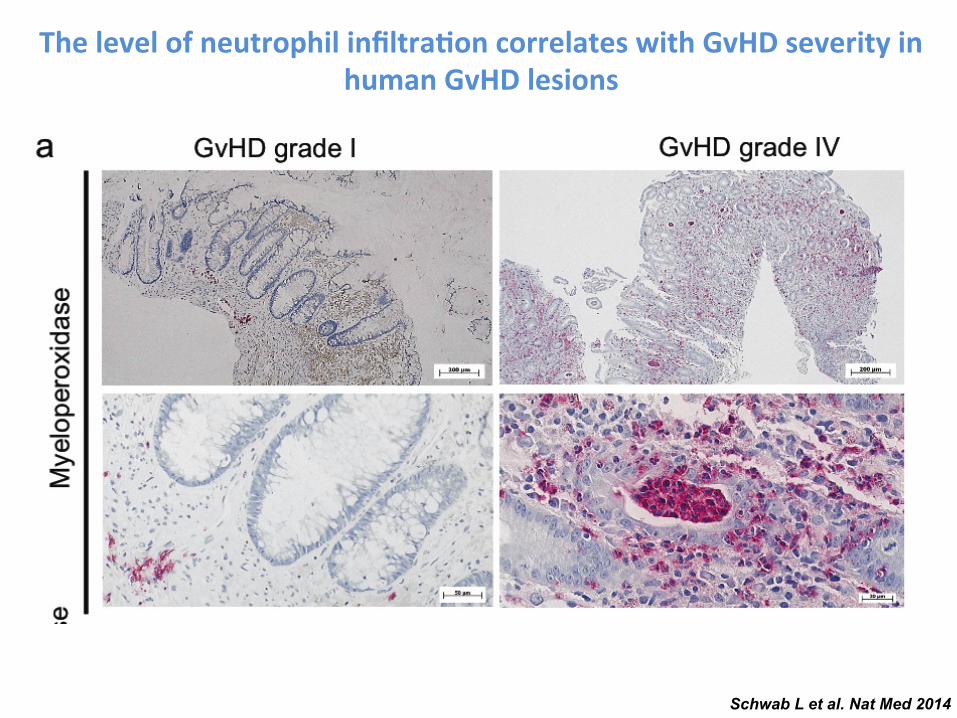
Schwab L et al. Nat Med 2014
The level of neutrophil infiltra-on correlates with GvHD severity in human GvHD lesions
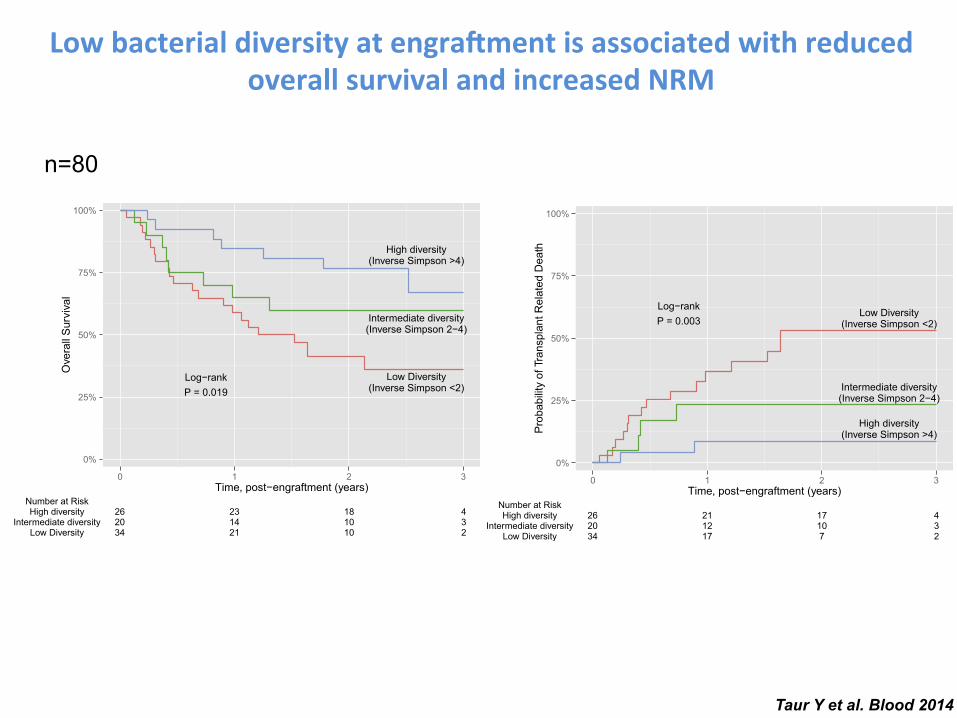
between models for these 2 outcomes was that disease risk waspredictive of overall survival but not transplant-related mortality. Thefollow-up and outcomes are depicted individually for each subject inFigure 2. Of the 36 deaths, 21 (58%) were transplant related and 15(42%) were due to relapse or progression of disease. Transplant-related deaths were frequently due to GVHD or infection and weremore frequent in patients with lowmicrobiota diversity.We did notobserve any evidence of censoring bias. As inverse Simpson diversitydecreased, the corresponding taxonomic composition of the fecalmicrobiota appeared less complex, with fewer distinct members.In subjects with lower diversity, the microbiota was generally domi-nated by a single bacterial genus. Dominating genera includedEnterococcus, Streptococcus, Enterobacteriaceae (Escherichia andKluyvera), and Lactobacillus. These bacterial taxa were also ob-served in a prior report characterizing the microbiota of this allo-HSCT patient cohort.3
To determine whether the presence or absence of specificbacterial taxa correlated with mortality, we compared the microbiotacomposition of patients who died or survived by the LEfSe method(Table 4). The postengraftment microbiota of subjects who dieddiffered significantly from the microbiota of patients who survived,harboring a greater abundance of g-Proteobacteria, including Enter-obacteriaceae. Conversely, Lachnospiraceae and Actinomycetaceaewere observed in greater relative abundance in subjects who re-mained alive during the follow-up period. We did not observesignificant associations with mortality for any of the remaining taxa.
Discussion
The intestinal microbiota consists of hundreds of distinct bacterialspecies that contribute to host health through a variety of functions
Figure 1. Kaplan-Meier plot of diversity and overall
survival and transplant related mortality.
BLOOD, 14 AUGUST 2014 x VOLUME 124, NUMBER 7 INTESTINAL BACTERIAL DIVERSITY IN ALLO-HSCT 1177
For personal use only.on February 3, 2015. by guest www.bloodjournal.orgFrom
Taur Y et al. Blood 2014
Low bacterial diversity at engra.ment is associated with reduced overall survival and increased NRM
n=80
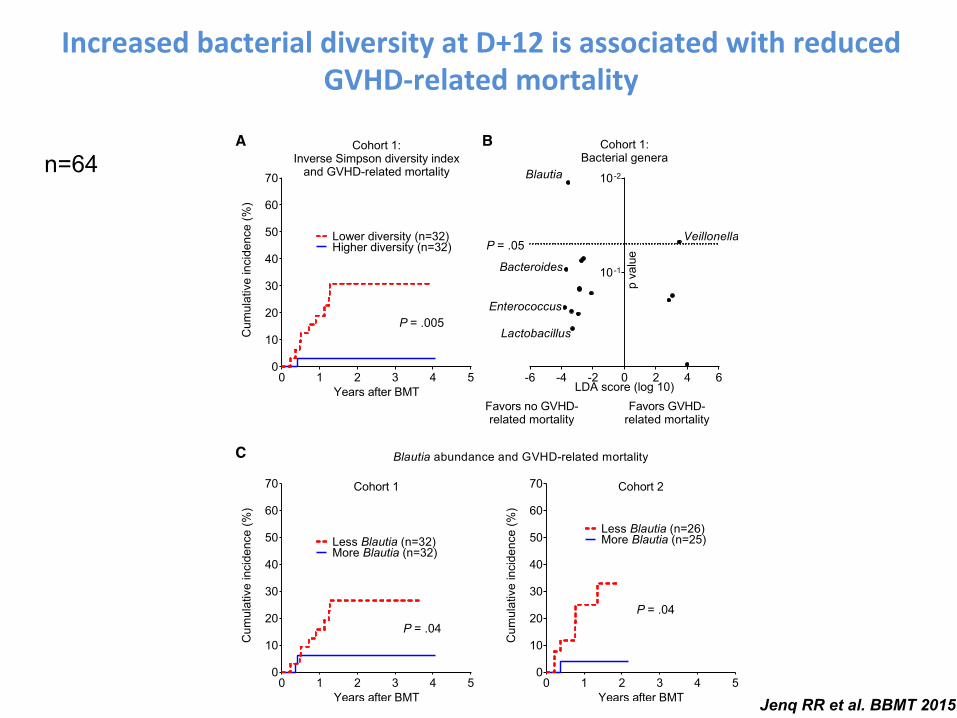
Increased bacterial diversity at D+12 is associated with reduced GVHD-‐related mortality
of patients and then confirmed in a second cohort. Overall survival proba-bilities were estimated using Kaplan-Meier methodology and comparedusing the log rank test. Incidence and overall survival data are presentedrelative to the time of BMT, but patient cohorts were analyzed relative to the
landmark of day 12, the median time of stool collection. We note that nopatients in the study died or developed GVHD before day 16. Comparison ofthe risk of acute GVHD and GVHD-related mortality after adjusting forclinical factors was performed using Cox regression. A receiver operating
Table 1Clinical Characteristics of Allo-BMT Patients Transplanted at Memorial Sloan Kettering Cancer Center with Stool Samples Collected Day 12 after BMT Included inan Identification and Validation Cohort
Cohort 1 Cohort 2
Dates of transplant September 2009 to October 2012 August 2011 to August 2013Age, yr 25-70, median 53 26-75, median 50Gender Female 38%, male 62% Female 32%, male 69%Primary malignancy NHL 38%, AML 38%, ALL 9.4%, Hodgkin disease 6.3%,
CLL 6.3%, MDS 3.1%NHL 35%, AML 37%, ALL 12%, Hodgkin disease 3.9%,CLL 7.8%, MDS 3.9%
Disease risk High 45%, intermediate 36%, low 19% High 35%, intermediate 27%, low 37%Graft source Peripheral blood 55%, cord blood 42%, bone marrow 3.1% Peripheral blood 57%, cord blood 39%, bone marrow 3.9%Donor relationship and HLA Sibling identical (29%), unrelated identical (22%),
unrelated nonidentical (48%)Sibling identical (24%), unrelated identical (29%),unrelated nonidentical (47%)
Conditioning intensity Standard intensity myeloablative 23%, reduced-intensitymyeloablative 44%, nonmyeloablative 33%
Standard intensity myeloablative 14%, reduced-intensitymyeloablative 57%, nonmyeloablative 29%
Stool sample collection day þ8 to þ16, median þ12 þ8 to þ16, median þ12
NHL indicates non-Hodgkin lymphoma; AML, acute myelogenous leukemia; ALL, acute lymphoblastic leukemia; CLL, chronic lymphoblastic leukemia; MDS,myelodysplastic syndrome.
A B
C
P = .05
P = .005
P = .04P = .04
Figure 1. Changes in the intestinal flora are associated with differences in GVHD-related mortality. (A) Bacterial diversity was quantified using the inverse Simpsonindex after composition analysis of stool samples from cohort 1 performed by 16S gene sequencing. Patients were stratified by the median diversity index value andanalyzed for cumulative incidence of GVHD-related mortality. (B) Associations of bacterial genera with GVHD-related mortality outcomes were quantified by lineardiscriminant analysis effect size analysis. Position along the vertical axis indicates statistical significance. (C) Patients from cohorts 1 and 2 were stratified by medianBlautia abundance (.05% in both) and analyzed for incidence of GVHD-related mortality.
R.R. Jenq et al. / Biol Blood Marrow Transplant 21 (2015) 1373e1383 1375
Jenq RR et al. BBMT 2015
n=64
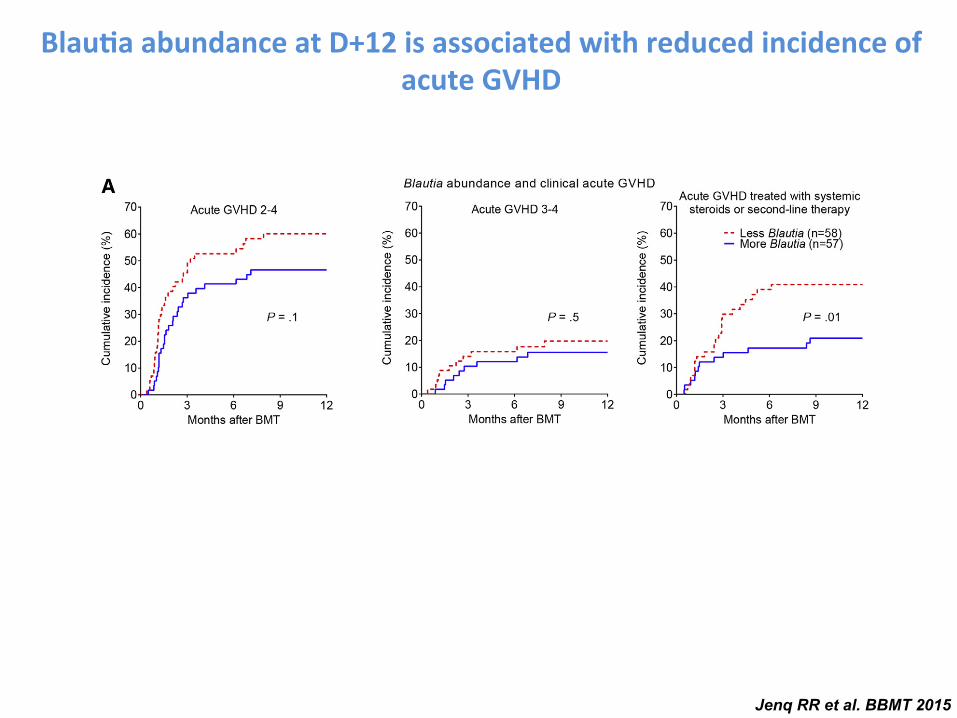
Abundance of Bacteria from the Genus Blautia Near Day12 Is Associated with Reduced Acute GVHD RequiringSystemic Immune Suppression
To identify bacterial subsets associated with GVHD-related mortality, we focused on bacterial phylogeny at thegenus level, which is generally the most specific level atwhich 16S deep sequencing still provides reliable classifica-tion. Our approach involved first identifying bacterial generapotentially associated with GVHD-related mortality using ataxonomic discovery analysis, then evaluating candidategenera for their association with the incidence of GVHD-related mortality, and finally evaluating for reproducibilityof observed associations in an additional independent cohortof patients from the same institution. Beginning with taxo-nomic discovery analysis of bacterial genera, we found thatbacteria belonging to the genus Blautia were most signifi-cantly associated with reduced GVHD-related mortality(Figure 1B, P ¼ .01). The Blautia genus notably includesanaerobic intestinal commensal organisms within the bac-terial class Clostridia [38,39]. The genus Veillonella, inturn, was associated with increased GVHD-related mortality(P ¼ .047).
We then evaluated the association of Blautia and Veillo-nella abundance with GVHD-related mortality, stratifyingpatients by the median abundance (.05% and .04%, respec-tively). We found that patients with higher Blautia abun-dance had reduced GVHD-related mortality (Figure 1C,
Figure 3. Association of Blautia abundance with clinical acute GVHD. (A) Patients were stratified by Blautia abundance below or above .05% and evaluated fordevelopment of the indicated severity grades of acute GVHD as well as acute GVHD that required systemic therapy with corticosteroids. (B) Patients were evaluatedfor development of acute GVHD in typical target organs.
Table 3Subgroup Analysis of Patients from the Cohorts Combined Examining theRelationship Between Blautia Abundance and GVHD-Related Mortality
Subgroup No. of Cases(Blautia Low)
No. of Cases(Blautia High)
GVHD-RelatedMortalityLog Rank P
Myeloablativeconditioning
13 9 .1
Reduced-intensityconditioning
27 30 .3
Nonmyeloablativeconditioning
18 18 .02
PBSC graft 31 33 .006Cord blood graft 24 23 .2
PBSC indicates peripheral blood stem cell.P < .05 are depicted in bold.
R.R. Jenq et al. / Biol Blood Marrow Transplant 21 (2015) 1373e1383 1377
Blau-a abundance at D+12 is associated with reduced incidence of acute GVHD
Jenq RR et al. BBMT 2015
E
A
B
Gra
des
2– 4
GV
HD
(%)
C
F Aztreonam or cefepimePiperacillin-tazobactam
0 20 40 600
5
10
15
20
25
0 20 40 600
5
10
15
20
25*P = 0.02 **P = 0.007
0 20 40 600
5
10
15
20
25
Months after HSCT
Aztreonam
No ABX (n = 793)ABX (n = 64)
P = 0.78
0 20 40 600
5
10
15
20
25
Months after HSCT
Cefepime
No ABX (n = 705)ABX (n = 152)
P = 0.98
D
Imipenem-cilastatin
Imipenem-cilastatin
0 1 2 3 40
10
20
30
40
50
Months after HSCT
Upp
er G
I GV
HD
( g
rade
1) (
%)
Imipenem-cilastatin
NoABX (n = 303)ABX (n = 144)
*P = 0.045
0 1 2 3 40
10
20
30
40
50
Months after HSCT
Piperacillin-tazobactam
No ABX (n = 166)ABX (n = 281)
**P = 0.002
0 1 2 3 40
10
20
30
Months after HSCT
Low
er G
I GV
HD
(g
rade
s 1–
4) (
%)
Imipenem-cilastatin
No ABX (n = 303)ABX (n = 144)
*P = 0.036
0 1 2 3 40
10
20
30
Months after HSCT
Piperacillin-tazobactam
No ABX (n = 166) ABX (n = 281)
*P = 0.019
0 1 2 3 40
20
40
60
Months after HSCT
No ABX (n = 303)ABX (n = 144)
*P = 0.0165
0 1 2 3 40
20
40
60
Months after HSCT
Piperacillin-tazobactam
NoABX (n = 166)ABX (n = 281)
*P = 0.0167
0 20 40 600
10
20
30
40
Months after HSCT
Treatment-related mortality(non-GVHD)
Received imipenem-cilastatin or piperacillin-tazobactam first-line (n = 306)
Received aztreonam or cefepime first-line (n = 77)
Not treated for neutropenic fever (n = 474)
P = 0.48
0 20 40 600
5
10
15
20
25
Months after HSCT
GVHD-related mortality
*P = 0.029
0 20 40 600
25
50
75
100
Months after HSCT
Per
cent
age
Overall survival
P = 0.87
0 20 40 600
20
40
60
80
Months after HSCT
Relapse-related mortality
P = 0.12
Received imipenem-cilastatin orpiperarr cillin-tazobactam fiff rsrr t-line (n = 306)
Received aztreonrr am orcefeff pime fiff rsrr t-line (n = 77)
Not trerr ated foff r neutroperr nic feff ver (n = 474)
GV
HD
-rela
ted
mor
tality
(%)
Lacto
bacil
lus
Clostrid
ia
Bacter
oidete
s
Erysipe
lotric
hia
Actino
bacte
ria
Entero
cocc
us
Akker
mansia
0.000010.0001
0.0010.01
0.11
10100
100010,000
Fold
cha
nge
**
No ABX (n = 709)ABX (n = 148)
No ABX (n = 557)ABX (n = 300)
Months after HSCT Months after HSCT
Piperacillin-tazobactam
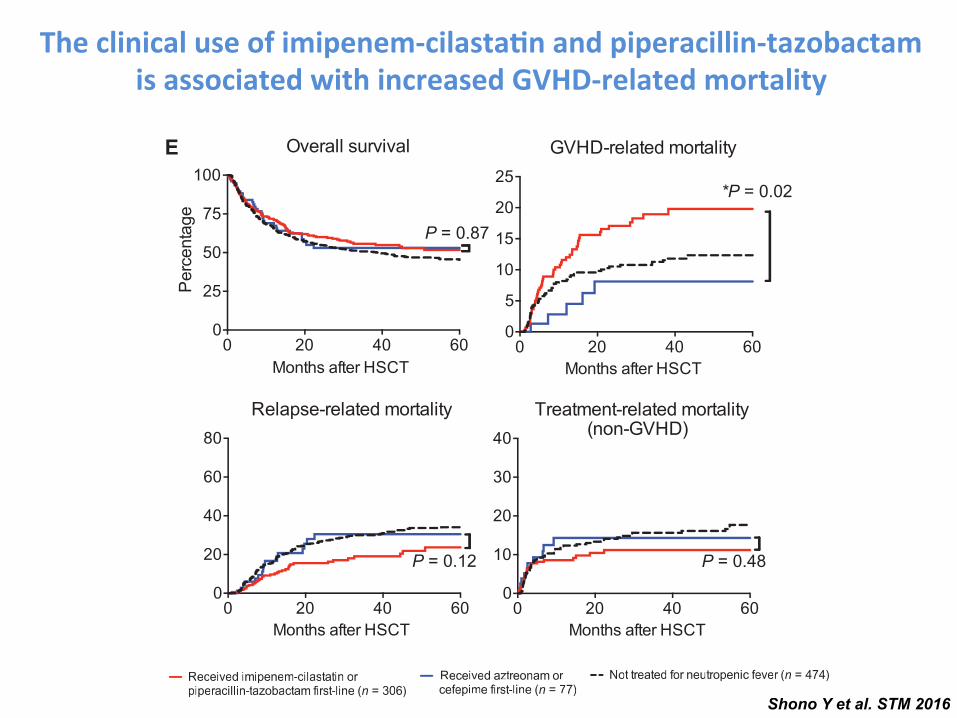
Fig. 1. The clinical use of imipenem-cilastatin and piperacillin-tazobactam is as-sociated with increased GVHD-related mortality. (A to D) A retrospective cohortof 857 adult patients was identified as recipients of non–T cell–depleted allo-HSCT atour center from 1992 to 2015. (A) GVHD-related mortality in patients exposed to az-treonam, cefepime, imipenem-cilastatin, or piperacillin-tazobactam. ABX, antibiotics.(B) Analyses of overall grades 2 to 4 GVHD are shown. (C) Analyses of upper GI grade1 GVHD are shown. (D) Analyses of lower GI grades 1 to 4 GVHD are shown. (E) A subsetof patients who had been treated for neutropenic fever was stratified according towhether they received first-line treatment with imipenem-cilastatin or piperacillin-tazobactam, versus aztreonam or cefepime. Outcomes indicated were depicted byKaplan-Meier plots and curves compared by the log-rank test. *P < 0.05, **P < 0.01in (A) to (E). (F) Intestinal microbiota composition analysis using 16S rRNA sequen-cing before and after beginning treatment with the indicated antibiotics in allo-HSCT recipients. *P < 0.05 after multiple comparisons with Holm-Sidak correction.
R E S EARCH ART I C L E
www.ScienceTranslationalMedicine.org 18 May 2016 Vol 8 Issue 339 339ra71 4
on September 25, 2016
http://stm.sciencem
ag.org/D
ownloaded from
E
A
B
Gra
des
2– 4
GV
HD
(%)
C
F Aztreonam or cefepimePiperacillin-tazobactam
0 20 40 600
5
10
15
20
25
0 20 40 600
5
10
15
20
25*P = 0.02 **P = 0.007
0 20 40 600
5
10
15
20
25
Months after HSCT
Aztreonam
No ABX (n = 793)ABX (n = 64)
P = 0.78
0 20 40 600
5
10
15
20
25
Months after HSCT
Cefepime
No ABX (n = 705)ABX (n = 152)
P = 0.98
D
Imipenem-cilastatin
Imipenem-cilastatin
0 1 2 3 40
10
20
30
40
50
Months after HSCT
Upp
er G
I GV
HD
( g
rade
1) (
%)
Imipenem-cilastatin
NoABX (n = 303)ABX (n = 144)
*P = 0.045
0 1 2 3 40
10
20
30
40
50
Months after HSCT
Piperacillin-tazobactam
No ABX (n = 166)ABX (n = 281)
**P = 0.002
0 1 2 3 40
10
20
30
Months after HSCT
Low
er G
I GV
HD
(g
rade
s 1–
4) (
%)
Imipenem-cilastatin
No ABX (n = 303)ABX (n = 144)
*P = 0.036
0 1 2 3 40
10
20
30
Months after HSCT
Piperacillin-tazobactam
No ABX (n = 166) ABX (n = 281)
*P = 0.019
0 1 2 3 40
20
40
60
Months after HSCT
No ABX (n = 303)ABX (n = 144)
*P = 0.0165
0 1 2 3 40
20
40
60
Months after HSCT
Piperacillin-tazobactam
NoABX (n = 166)ABX (n = 281)
*P = 0.0167
0 20 40 600
10
20
30
40
Months after HSCT
Treatment-related mortality(non-GVHD)
Received imipenem-cilastatin or piperacillin-tazobactam first-line (n = 306)
Received aztreonam or cefepime first-line (n = 77)
Not treated for neutropenic fever (n = 474)
P = 0.48
0 20 40 600
5
10
15
20
25
Months after HSCT
GVHD-related mortality
*P = 0.029
0 20 40 600
25
50
75
100
Months after HSCT
Per
cent
age
Overall survival
P = 0.87
0 20 40 600
20
40
60
80
Months after HSCT
Relapse-related mortality
P = 0.12
Received imipenem-cilastatin orpiperarr cillin-tazobactam fiff rsrr t-line (n = 306)
Received aztreonrr am orcefeff pime fiff rsrr t-line (n = 77)
Not trerr ated foff r neutroperr nic feff ver (n = 474)
GV
HD
-rela
ted
mor
tality
(%)
Lacto
bacil
lus
Clostrid
ia
Bacter
oidete
s
Erysipe
lotric
hia
Actino
bacte
ria
Entero
cocc
us
Akker
mansia
0.000010.0001
0.0010.01
0.11
10100
100010,000
Fold
cha
nge
**
No ABX (n = 709)ABX (n = 148)
No ABX (n = 557)ABX (n = 300)
Months after HSCT Months after HSCT
Piperacillin-tazobactam
Fig. 1. The clinical use of imipenem-cilastatin and piperacillin-tazobactam is as-sociated with increased GVHD-related mortality. (A to D) A retrospective cohortof 857 adult patients was identified as recipients of non–T cell–depleted allo-HSCT atour center from 1992 to 2015. (A) GVHD-related mortality in patients exposed to az-treonam, cefepime, imipenem-cilastatin, or piperacillin-tazobactam. ABX, antibiotics.(B) Analyses of overall grades 2 to 4 GVHD are shown. (C) Analyses of upper GI grade1 GVHD are shown. (D) Analyses of lower GI grades 1 to 4 GVHD are shown. (E) A subsetof patients who had been treated for neutropenic fever was stratified according towhether they received first-line treatment with imipenem-cilastatin or piperacillin-tazobactam, versus aztreonam or cefepime. Outcomes indicated were depicted byKaplan-Meier plots and curves compared by the log-rank test. *P < 0.05, **P < 0.01in (A) to (E). (F) Intestinal microbiota composition analysis using 16S rRNA sequen-cing before and after beginning treatment with the indicated antibiotics in allo-HSCT recipients. *P < 0.05 after multiple comparisons with Holm-Sidak correction.
R E S EARCH ART I C L E
www.ScienceTranslationalMedicine.org 18 May 2016 Vol 8 Issue 339 339ra71 4
on September 25, 2016
http://stm.sciencem
ag.org/D
ownloaded from
The clinical use of imipenem-‐cilasta-n and piperacillin-‐tazobactam is associated with increased GVHD-‐related mortality
Shono Y et al. STM 2016
E
A
B
Gra
des
2– 4
GV
HD
(%
)
C
F Aztreonam or cefepimePiperacillin-tazobactam
0 20 40 600
5
10
15
20
25
0 20 40 600
5
10
15
20
25*P = 0.02 **P = 0.007
0 20 40 600
5
10
15
20
25
Months after HSCT
Aztreonam
No ABX (n = 793)ABX (n = 64)
P = 0.78
0 20 40 600
5
10
15
20
25
Months after HSCT
Cefepime
No ABX (n = 705)ABX (n = 152)
P = 0.98
D
Imipenem-cilastatin
Imipenem-cilastatin
0 1 2 3 40
10
20
30
40
50
Months after HSCT
Upp
er G
I GV
HD
( g
rade
1) (
%)
Imipenem-cilastatin
NoABX (n = 303)ABX (n = 144)
*P = 0.045
0 1 2 3 40
10
20
30
40
50
Months after HSCT
Piperacillin-tazobactam
No ABX (n = 166)ABX (n = 281)
**P = 0.002
0 1 2 3 40
10
20
30
Months after HSCT
Low
er G
I GV
HD
(g
rade
s 1–
4) (
%)
Imipenem-cilastatin
No ABX (n = 303)ABX (n = 144)
*P = 0.036
0 1 2 3 40
10
20
30
Months after HSCT
Piperacillin-tazobactam
No ABX (n = 166) ABX (n = 281)
*P = 0.019
0 1 2 3 40
20
40
60
Months after HSCT
No ABX (n = 303)ABX (n = 144)
*P = 0.0165
0 1 2 3 40
20
40
60
Months after HSCT
Piperacillin-tazobactam
NoABX (n = 166)ABX (n = 281)
*P = 0.0167
0 20 40 600
10
20
30
40
Months after HSCT
Treatment-related mortality(non-GVHD)
Received imipenem-cilastatin or piperacillin-tazobactam first-line (n = 306)
Received aztreonam or cefepime first-line (n = 77)
Not treated for neutropenic fever (n = 474)
P = 0.48
0 20 40 600
5
10
15
20
25
Months after HSCT
GVHD-related mortality
*P = 0.029
0 20 40 600
25
50
75
100
Months after HSCT
Per
cent
age
Overall survival
P = 0.87
0 20 40 600
20
40
60
80
Months after HSCT
Relapse-related mortality
P = 0.12
Received imipenem-cilastatin orpiperarr cillin-tazobactam fiff rsrr t-line (n = 306)
Received aztreonrr am orcefeff pime fiff rsrr t-line (n = 77)
Not trerr ated foff r neutroperr nic feff ver (n = 474)
GV
HD
-rela
ted
mor
tality
(%)
Lacto
bacil
lus
Clostrid
ia
Bacter
oidete
s
Erysipe
lotric
hia
Actino
bacte
ria
Entero
cocc
us
Akker
mansia
0.000010.0001
0.0010.01
0.11
10100
100010,000
Fol
d ch
ange
**
No ABX (n = 709)ABX (n = 148)
No ABX (n = 557)ABX (n = 300)
Months after HSCT Months after HSCT
Piperacillin-tazobactam
Fig. 1. The clinical use of imipenem-cilastatin and piperacillin-tazobactam is as-sociated with increased GVHD-related mortality. (A to D) A retrospective cohortof 857 adult patients was identified as recipients of non–T cell–depleted allo-HSCT atour center from 1992 to 2015. (A) GVHD-related mortality in patients exposed to az-treonam, cefepime, imipenem-cilastatin, or piperacillin-tazobactam. ABX, antibiotics.(B) Analyses of overall grades 2 to 4 GVHD are shown. (C) Analyses of upper GI grade1 GVHD are shown. (D) Analyses of lower GI grades 1 to 4 GVHD are shown. (E) A subsetof patients who had been treated for neutropenic fever was stratified according towhether they received first-line treatment with imipenem-cilastatin or piperacillin-tazobactam, versus aztreonam or cefepime. Outcomes indicated were depicted byKaplan-Meier plots and curves compared by the log-rank test. *P < 0.05, **P < 0.01in (A) to (E). (F) Intestinal microbiota composition analysis using 16S rRNA sequen-cing before and after beginning treatment with the indicated antibiotics in allo-HSCT recipients. *P < 0.05 after multiple comparisons with Holm-Sidak correction.
R E S EARCH ART I C L E
www.ScienceTranslationalMedicine.org 18 May 2016 Vol 8 Issue 339 339ra71 4
on September 25, 2016
http://stm.sciencem
ag.org/D
ownloaded from
maintaining colonic homeostasis and health (25, 26). Despite large dif-ferences in the abundance of Clostridiales, we observed no significantchanges in the amounts of SCFAs in the colon comparing specimensfrom recipients treated with aztreonam or imipenem-cilastatin (fig. S6).
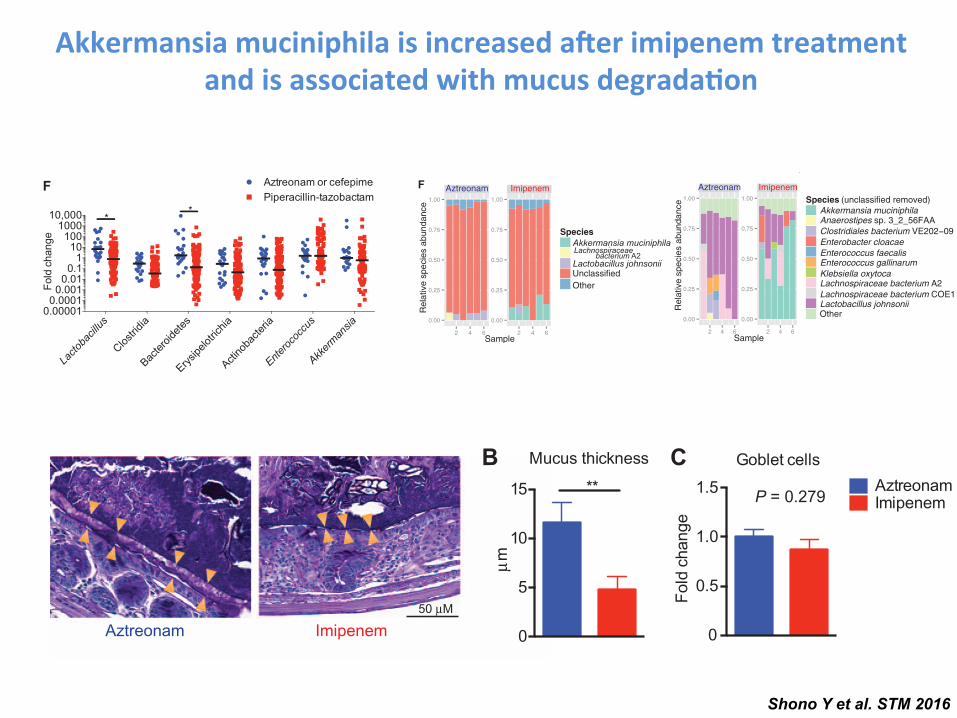
To acquire greater resolution of the bacterial composition betweenaztreonam- and imipenem-cilastatin–treated murine specimens, weperformed metagenomic shotgun sequencing with stool collected onday 21 after allo-HSCT. We found that, concordant with the 16S se-quencing results, imipenem-cilastatin but not aztreonam treatmentresulted in an increased abundance of A. muciniphila (Fig. 4F). How-ever, as the largest percentage of reads from the analysis were determinedto be unclassified, it is possible that additional significant differences inbacterial species composition exist between the two antibiotic treat-ment types. Metagenomic shotgun sequencing analysis also revealeddifferences in gene content between microbiota specimens from micetreated with aztreonam and imipenem-cilastatin, depicted by prin-cipal component analysis of gene orthologs (Fig. 4G). LEfSe analysisof gene pathways indicated that the microbiota genes in mice treatedwith imipenem-cilastatin were enriched for processes including lipo-polysaccharide synthesis, and relatively depleted in several processesincluding D-alanine metabolism (fig. S7). Lipopolysaccharide is wellknown for inducing a proinflammatory cascade in many disease pro-cesses including GVHD (27), whereas reductions in D-alanine contentof lipoteichoic acid can enhance the anti-inflammatory properties of lactobacilli(28, 29).
As mentioned above, we detected anincrease in A. muciniphila in the flora ofimipenem-cilastatin–treated mice using16S rRNA deep sequencing (Fig. 4E). Thisbacterium has the ability to degrade mucusas a carbohydrate source (30, 31). Usingour metagenomic shotgun sequencingresults, we determined whether genes pre-dicted to encode secretory mucolytic en-zymes were differentially present in micetreated with each antibiotic. The identifica-tion and characterization of bacterial mu-colytic enzymes are still a young field, but arecent study examined the whole genomicsequence of A. muciniphila (ATCC BAA-835), isolated from human feces (31). Theauthors identified two strong candidatesfor mucus degradation: Amuc_0953 (a sul-fatase) and Amuc_2164 (a glycosyl hydro-lase), which both contained predictedsecretory signal peptide cleavage sites aswell as predicted mucin-binding domains.We quantified the presence of sequenceswith homology to these two genes andfound that both were markedly enrichedin specimens from imipenem-cilastatin–treated mice (Fig. 4H). We then soughtto characterize the mucus layer of the co-lon in antibiotic-treated transplanted mice.Using periodic acid–Schiff staining, we ob-served a marked reduction in the thick-ness of the mucus layer in recipients
treated with imipenem-cilastatin on day 21 compared to aztreonam-treated recipients (Fig. 5, A and B). No differences in the numbers ofmucus-producing goblet cells between aztreonam- and imipenem-cilastatin–treated recipients were seen, suggesting that mucus production was notimpaired (Fig. 5C). Moreover, by using a general bacterial 16S rRNAprobe (EUB338) (32) coupled with MUC2 staining, we directly visualizedthe inner mucus layer in the colon of antibiotic-treated recipients andconfirmed a marked thinning of the mucus layer of mice treated withimipenem-cilastatin. Markedly, we also observed dissemination of bac-teria past the colonic epithelial barrier in histopathology specimens fromimipenem-cilastatin–treated mice (Fig. 5D), whereas this was not seenin aztreonam-treated mice. We further assessed epithelial barrier func-tion in recipients by performing oral administration of fluorescein isothio-cyanate (FITC)–dextran, a poorly absorbed carbohydrate that can enterthe bloodstream if the epithelial barrier has been compromised.Consistent with the pathological findings mentioned above, we detecteda greater amount FITC in the serum of imipenem-cilastatin–treated miceas early as 5 days after initiation of antibiotics (Fig. 5E), indicatinggreater loss of gut integrity in these recipients. Together, these resultsdemonstrate that imipenem-cilastatin treatment can exacerbate GVHDthrough a combination of factors including compromised barrier func-tion with thinning of the protective mucus layer and reduced numbersof colonic B cells, increased infiltration of granulocytes, elevated
0
5
10
15µm
AztreonamImipenem
**
Goblet cells
0
0.5
1.0
1.5
Fold
cha
nge
P = 0.279
B CMucus thickness
D
Aztreonam Imipenem
EUBMUC2DAPI
10 µm
0
500
1000
1500
2000
FITC
-dex
tran
(ng/
ml)
AztreonamImipenem
*E
A
ImipenemAztreonam50 µM
Fig. 5. Mice treated with imipenem-cilastatin in the setting of GVHD result in the loss of the colonicmucus layer and impaired intestinal barrier function. (A to C) Colon tissues from mouse recipientswere fixed by water-free methanol-Carnoy’s fixative on day 21, stained with periodic acid–Schiff stain,and visualized by light microscopy. Orange triangles in (A) indicate the location of the inner mucuslayer. Quantification of mucus layer thickness is shown in (B). Number of goblet cells are shown in (C).Data are representative of two independent experiments. Values represent means ± SEM (n = 10). **P < 0.01by Mann-Whitney U test. (D) Immunostaining of colon sections for MUC2 (green) with general bacterial16S rRNA gene in situ hybridization (FISH) probe EUB338 (EUB) (red) counterstained with Hoechst(blue). Data are representative of two independent experiments (n = 10). Orange arrowheads indicateinner mucus layer; red arrowheads indicate bacteria penetrating beyond the mucus layer and colonicepithelium. (E) Allo-HSCT recipients of bone marrow and T cells treated with aztreonam or imipenen-cilastatin were challenged with oral gavage of FITC-dextran on day 15 after transplant. The graph showsplasma FITC-dextran concentrations. Data are representative of two independent experiments. Values rep-resent means ± SEM (n = 6 to 8). *P < 0.05 by Mann-Whitney U test.
R E S EARCH ART I C L E
www.ScienceTranslationalMedicine.org 18 May 2016 Vol 8 Issue 339 339ra71 9
on September 25, 2016
http://stm.sciencem
ag.org/D
ownloaded from
E
A
B
Gra
des
2– 4
GV
HD
(%)
C
F Aztreonam or cefepimePiperacillin-tazobactam
0 20 40 600
5
10
15
20
25
0 20 40 600
5
10
15
20
25*P = 0.02 **P = 0.007
0 20 40 600
5
10
15
20
25
Months after HSCT
Aztreonam
No ABX (n = 793)ABX (n = 64)
P = 0.78
0 20 40 600
5
10
15
20
25
Months after HSCT
Cefepime
No ABX (n = 705)ABX (n = 152)
P = 0.98
D
Imipenem-cilastatin
Imipenem-cilastatin
0 1 2 3 40
10
20
30
40
50
Months after HSCT
Upp
er G
I GV
HD
( g
rade
1) (
%)
Imipenem-cilastatin
NoABX (n = 303)ABX (n = 144)
*P = 0.045
0 1 2 3 40
10
20
30
40
50
Months after HSCT
Piperacillin-tazobactam
No ABX (n = 166)ABX (n = 281)
**P = 0.002
0 1 2 3 40
10
20
30
Months after HSCT
Low
er G
I GV
HD
(g
rade
s 1–
4) (
%)
Imipenem-cilastatin
No ABX (n = 303)ABX (n = 144)
*P = 0.036
0 1 2 3 40
10
20
30
Months after HSCT
Piperacillin-tazobactam
No ABX (n = 166) ABX (n = 281)
*P = 0.019
0 1 2 3 40
20
40
60
Months after HSCT
No ABX (n = 303)ABX (n = 144)
*P = 0.0165
0 1 2 3 40
20
40
60
Months after HSCT
Piperacillin-tazobactam
NoABX (n = 166)ABX (n = 281)
*P = 0.0167
0 20 40 600
10
20
30
40
Months after HSCT
Treatment-related mortality(non-GVHD)
Received imipenem-cilastatin or piperacillin-tazobactam first-line (n = 306)
Received aztreonam or cefepime first-line (n = 77)
Not treated for neutropenic fever (n = 474)
P = 0.48
0 20 40 600
5
10
15
20
25
Months after HSCT
GVHD-related mortality
*P = 0.029
0 20 40 600
25
50
75
100
Months after HSCT
Per
cent
age
Overall survival
P = 0.87
0 20 40 600
20
40
60
80
Months after HSCT
Relapse-related mortality
P = 0.12
Received imipenem-cilastatin orpiperarr cillin-tazobactam fiff rsrr t-line (n = 306)
Received aztreonrr am orcefeff pime fiff rsrr t-line (n = 77)
Not trerr ated foff r neutroperr nic feff ver (n = 474)
GV
HD
-rela
ted
mor
tality
(%)
Lacto
bacil
lus
Clostrid
ia
Bacter
oidete
s
Erysipe
lotric
hia
Actino
bacte
ria
Entero
cocc
us
Akker
mansia
0.000010.0001
0.0010.01
0.11
10100
100010,000
Fold
cha
nge
**
No ABX (n = 709)ABX (n = 148)
No ABX (n = 557)ABX (n = 300)
Months after HSCT Months after HSCT
Piperacillin-tazobactam
Fig. 1. The clinical use of imipenem-cilastatin and piperacillin-tazobactam is as-sociated with increased GVHD-related mortality. (A to D) A retrospective cohortof 857 adult patients was identified as recipients of non–T cell–depleted allo-HSCT atour center from 1992 to 2015. (A) GVHD-related mortality in patients exposed to az-treonam, cefepime, imipenem-cilastatin, or piperacillin-tazobactam. ABX, antibiotics.(B) Analyses of overall grades 2 to 4 GVHD are shown. (C) Analyses of upper GI grade1 GVHD are shown. (D) Analyses of lower GI grades 1 to 4 GVHD are shown. (E) A subsetof patients who had been treated for neutropenic fever was stratified according towhether they received first-line treatment with imipenem-cilastatin or piperacillin-tazobactam, versus aztreonam or cefepime. Outcomes indicated were depicted byKaplan-Meier plots and curves compared by the log-rank test. *P < 0.05, **P < 0.01in (A) to (E). (F) Intestinal microbiota composition analysis using 16S rRNA sequen-cing before and after beginning treatment with the indicated antibiotics in allo-HSCT recipients. *P < 0.05 after multiple comparisons with Holm-Sidak correction.
R E S EARCH ART I C L E
www.ScienceTranslationalMedicine.org 18 May 2016 Vol 8 Issue 339 339ra71 4
on September 25, 2016
http://stm.sciencem
ag.org/D
ownloaded from
Akkermansia muciniphila is increased a.er imipenem treatment and is associated with mucus degrada-on
Shono Y et al. STM 2016
D
E
F
0
25
50
75
Abu
ndan
ce (%
)
***
***
0
25
50
75
Abu
ndan
ce (%
)
***
Aztreonam Imipenem
Aztreonam Imipenem
A B
−1
0
1
2
−2 −1 0 1 2PC1 (60.4%)
PC
2 (3
0.1%
)
Aztreonam
Imipenem
–6 –4 –2 0 2 4 6
10–3
10–2
10–1
LDA score (log10)
Order
P = 0.05
Favors imipenemtreatment
Favors aztreonamtreatment
Verrucomicrobiales
Enterobacteriales
Clostridiales
P value
G
Aztreonam Imipenem
0.00
0.25
0.50
0.75
1.00
0.00
0.25
0.50
0.75
1.00
2 4 6 2 4 6Sample
Rel
ativ
e sp
ecie
s ab
unda
nce Species (unclassified removed)
Akkermansia muciniphila Anaerostipes sp. 3_2_56FAA Clostridiales bacterium VE202−09 Enterobacter cloacae Enterococcus faecalis Enterococcus gallinarum Klebsiella oxytoca Lachnospiraceae bacterium A2 Lachnospiraceae bacterium COE1 Lactobacillus johnsoniiOther
−0.01
0.00
0.01
0.02
−0.04 0.00 0.04
PC
2 (1
3.4%
)
PC1 (69.2%)
Imipenem
Aztreonam
–6 –4 –2 0 2 4 6
10–3
10–2
10–1
LDA score (log10)
Genus
P = 0.05
Favors imipenemtreatment
Favors aztreonamtreatment
AkkermansiaAnaerotruncus
Klebsiella
P value
Order
Genus
Weighted UniFrac distance
KEGG orthology euclidean distance
Aztreonam Imipenem
0.00
0.25
0.50
0.75
1.00
0.00
0.25
0.50
0.75
1.00
2 4 6 2 4 6
Species Akkermansia muciniphila
Lactobacillus johnsoniiUnclassifiedOther
Sample
AztreonamImipenem
H
0.0000
0.0002
0.0004
0.0006
% o
f map
ped
read
s
Amuc_0953**
0.0000
0.0001
0.0002
0.0003
0.0004
0.0005Amuc_2164
**
C
Clostrid
iales
Entero
bacte
riales
Lacto
bacil
lales
Bacter
oidale
s
Lacto
bacil
lus
Entero
cocc
us
Akker
mansia
Verru
comicr
obial
es
Rel
ativ
e sp
ecie
s ab
unda
nce
Lachnospiraceae bacterium A2
ImipenemAztreonam
V V
Actinobacteria (c)
(p), phylum(c), class(o), order(f), family(g), genus
(p), phylum(c), class(o), order(f), family(g), genus
(g)(o)
(o)
(o)
(g)
(g)(f)
(f)Firmicu
tes (p
)
Clostri
dia (c
)
Gammaproteobacteria (c)Proteobacte
ria (p
)
errucomicrobiae (c)
errucomicrobia (p)
Fig. 4. Mice treated withimipenem-cilastatin in the set-ting of GVHD show increasedabundance of Akkermansia.(A) Stool specimens obtained frommice treated with imipenem-cilastatin or aztreonamwere col-lected on day 21 and analyzedby 16S rRNA gene sequencing(as in Fig. 2), followed by prin-cipal components (PC) analysisof weighted and normalizedUniFrac distances. Proportion ofvariance accounted for by eachprincipal component is indicated.(B and C) Differential taxonomicabundance between aztreonam-and imipenem-cilastatin–treatedrecipients was analyzed by lineardiscriminant analysis (LDA) cou-pled with effect size measure-ments (LEfSe) (B) and by LEfSeprojected as a cladogram (C).Data are representative of morethan five independent experi-ments in (A) to (C). (D and E)Comparisons of bacterial abun-dance at the phylogenetic lev-els of order (D) and genus (E).Data are combined from six in-dependent experiments (n =32 to 36). ***P < 0.001 bymulti-ple comparisons, corrected byHolm-Sidak test. (F to H) Stoolspecimens collected from micewith GVHD treated with antibio-tics were collected on day 21and evaluated by metagenomicshotgun sequence analysis. (F)Comparison of bacterial speciesabundance determined by taxo-nomy. Numbers 1 through 6along the x axis represent theindividual subjects. (G) Princi-pal component analysis ofquantification of sequencereads from KEGG (Kyoto Ency-clopedia of Genes andGenomes)gene orthologs comparingspecimens from mice treatedwith aztreonam and imipenem-cilastatin. (H) Quantification ofgene sequences by homologywas performed on stool spe-cimens collected on day 21.Amuc_0953 (a sulfatase) andAmuc_2164 (a glycosyl hydro-lase) are two predicted secretedmucolytic genes found in thegenome of A. muciniphila ATCCBAA-835, isolated from humanfeces. **P<0.01byMann-WhitneyU test.
R E S EARCH ART I C L E
www.ScienceTranslationalMedicine.org 18 May 2016 Vol 8 Issue 339 339ra71 8
on September 25, 2016
http://stm.sciencem
ag.org/D
ownloaded from
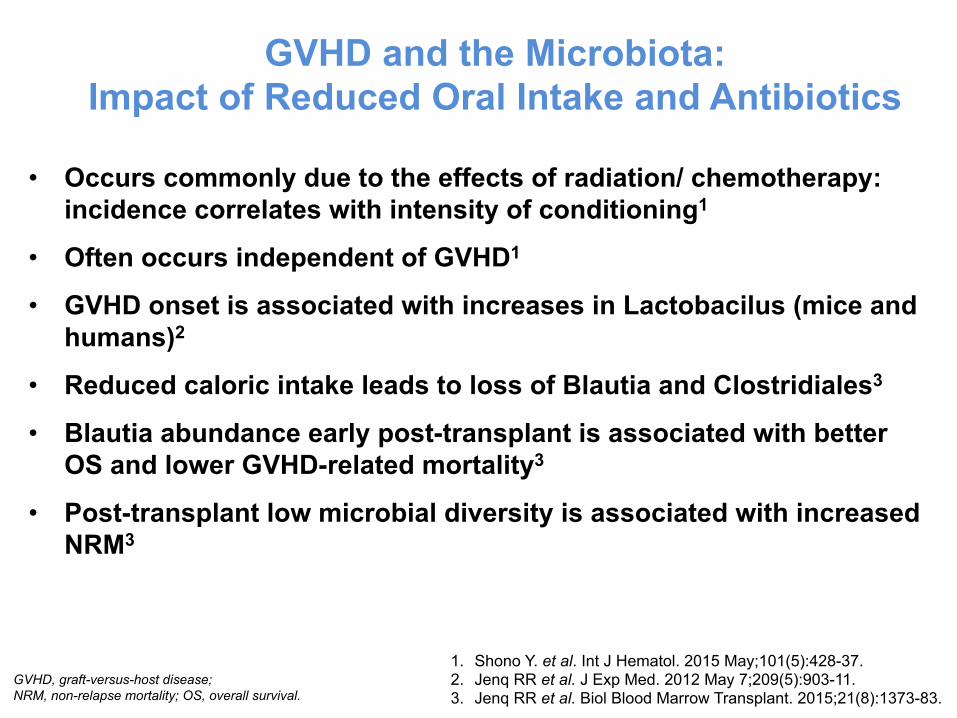
• Occurs commonly due to the effects of radiation/ chemotherapy: incidence correlates with intensity of conditioning1
• Often occurs independent of GVHD1
• GVHD onset is associated with increases in Lactobacilus (mice and humans)2
• Reduced caloric intake leads to loss of Blautia and Clostridiales3
• Blautia abundance early post-transplant is associated with better OS and lower GVHD-related mortality3
• Post-transplant low microbial diversity is associated with increased NRM3
GVHD and the Microbiota: Impact of Reduced Oral Intake and Antibiotics
GVHD, graft-versus-host disease; NRM, non-relapse mortality; OS, overall survival.
1. Shono Y. et al. Int J Hematol. 2015 May;101(5):428-37. 2. Jenq RR et al. J Exp Med. 2012 May 7;209(5):903-11. 3. Jenq RR et al. Biol Blood Marrow Transplant. 2015;21(8):1373-83.
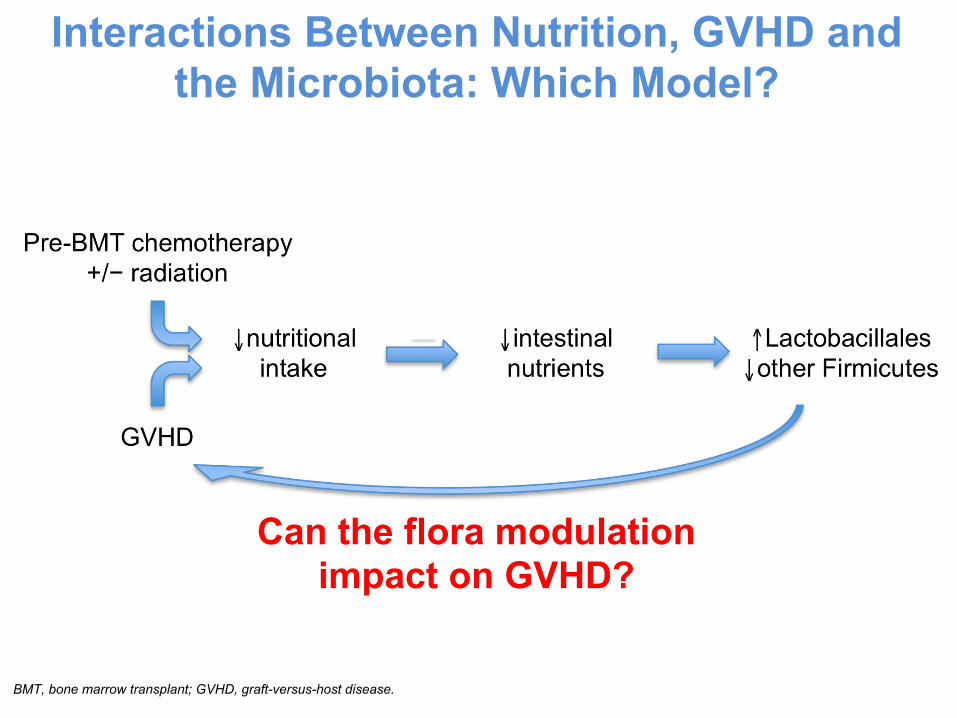
Interactions Between Nutrition, GVHD and the Microbiota: Which Model?
Can the flora modulation impact on GVHD?
BMT, bone marrow transplant; GVHD, graft-versus-host disease.
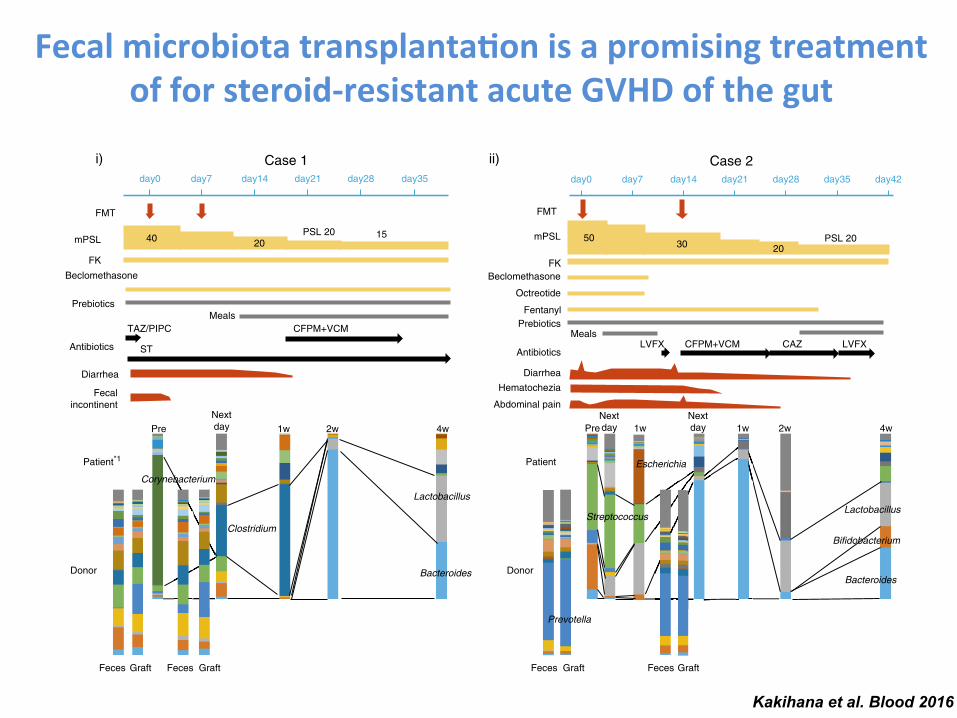
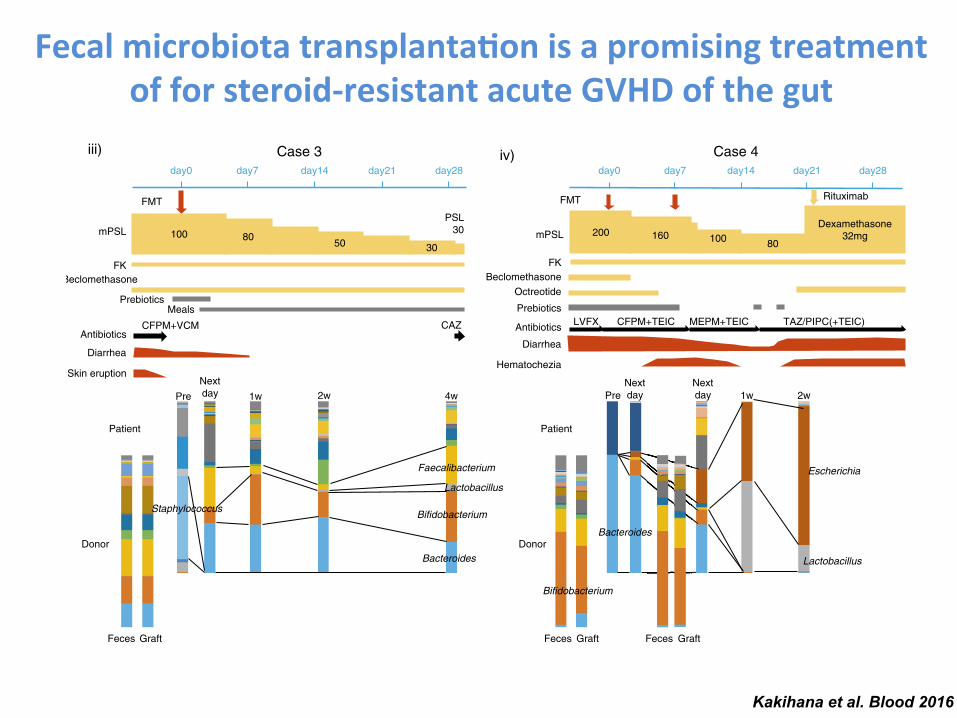
Fecal microbiota transplanta-on is a promising treatment of for steroid-‐resistant acute GVHD of the gut
Kakihana et al. Blood 2016
40
Beclomethasone
FK
mPSLPSL 20 15
TAZ/PIPC CFPM+VCM
Diarrhea
Fecal incontinent
FMT
PrebioticsMeals
Case 1
20
FMT
BeclomethasoneFK
Octreotide
FentanylPrebiotics
MealsLVFX CFPM+VCM
mPSL PSL 20
DiarrheaHematochezia
Case 2
30
CAZ LVFX
Abdominal pain
PSL30
BeclomethasoneFK
FMT
CFPM+VCM CAZ
Diarrhea
Skin eruption
Case 3
PrebioticsMeals
100 8050 30
mPSL
Case 4
i) ii)
iii) iv)
ST
Feces Graft Feces Graft
Donor
Patient*1
PreNext day 1w 2w 4w
Corynebacterium
Clostridium
Lactobacillus
Bacteroides
Feces Graft Feces Graft
Donor
Patient
PreNext day 1w
Next day 1w 2w 4w
Lactobacillus
Bacteroides
Streptococcus
Prevotella
Bifidobacterium
Feces Graft
Donor
Patient
PreNext day 1w 2w 4w
Lactobacillus
Bacteroides
Bifidobacterium
Faecalibacterium
Staphylococcus
Feces Graft Feces Graft
Donor
Patient
PreNext day 1w 2w
Next day
Bifidobacterium
Bacteroides
Lactobacillus
Escherichia
Escherichia
day0 day7 day14 day21 day28 day35 day0 day7 day14 day21 day28 day35 day42
day0 day7 day14 day21 day28
FMT
FK
Octreotide
PrebioticsLVFX CFPM+TEIC
mPSL
Rituximab
Diarrhea
Hematochezia
200 16080100
Dexamethasone32mg
MEPM+TEIC TAZ/PIPC(+TEIC)
day0 day7 day14 day21 day28
Antibiotics Antibiotics
AntibioticsAntibiotics
5020
Beclomethasone
A
BacteroidesStreptococcusEnterococcusFusobacteriumGranulicatellaPhascolarctobacteriumMegasphaeraSubdoligranulumTannerellaBarnesiellaCoprobacillusPseudoflavonifractorGemellaAkkermansiaAllisonellaTM7AnaerotruncusParvimonasDelftiaPseudomonas
BifidobacteriumClostridiumCorynebacteriumAnaerostipesAlistipesParasutterellaAcidam inococcusArthrobacterTuricibacterLachnospiraDesulfovibrioDyellaShuttleworthiaLactococcusRhodanobacterAcinetobacterFinegoldiaPropionibacteriumDesulfotomaculumRobinsoniella
PrevotellaRuminococcusVeillonellaCatenibacteriumKlebsiellaDialisterFlavonifractorOlsenellaAtopobiumShigellaAcidovoraxScardoviaRalstoniaStenotrophomonasAdlercreutziaAnaerococcusPantoeaDechloromonasPeptostreptococcus
FaecalibacteriumParabacteroidesEubacteriumActinomycesCoriobacteriumDoreaRothiaSutterellaEggerthellaCoprococcusOscillibacterLachnobacteriumCampylobacterLachnoanaerobaculumSphingomonasOxalobacterOribacteriumButyricimonasMicrobacteriumUndefined
LactobacillusEscherichiaStaphylococcusBlautiaCollinsellaRoseburiaMitsuokellaSlackiaAlloscardoviaOdoribacterTerrahaemophilusParaprevotellaBilophilaBrevundimonasSolobacteriumBradyrhizobiumNocardiaActinobaculumJanthinobacteriumSynergistes
Figure 1.
2086 KAKIHANA et al BLOOD, 20 OCTOBER 2016 x VOLUME 128, NUMBER 16
For personal use only.on July 18, 2017. by guest www.bloodjournal.orgFrom
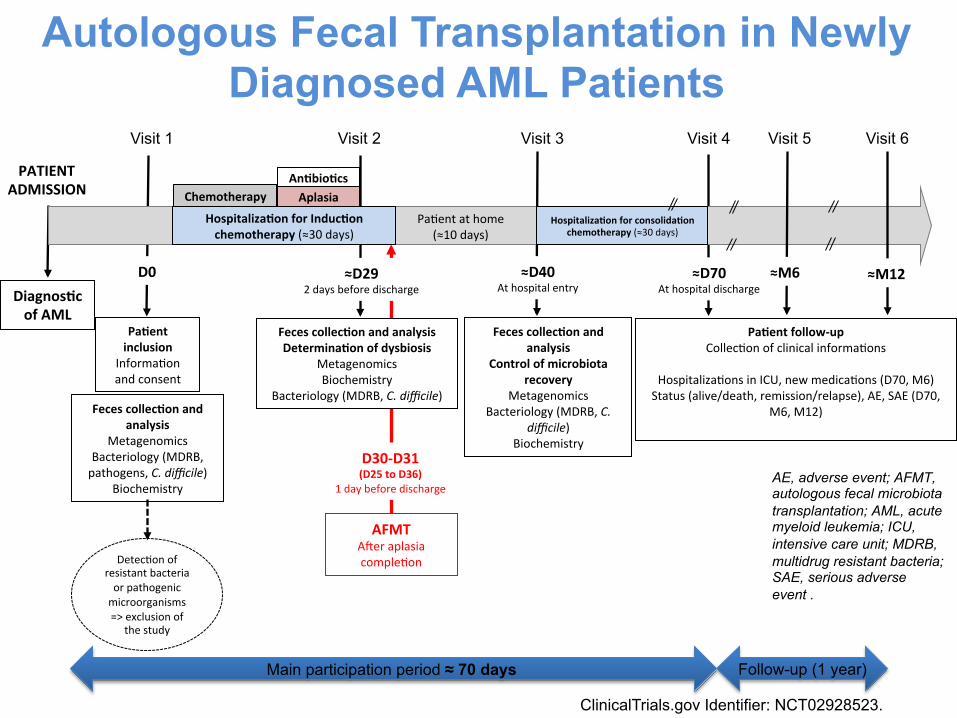
PATIENT ADMISSION
Feces collec-on and analysis
Metagenomics Bacteriology (MDRB, pathogens, C. difficile)
Biochemistry
Pa-ent inclusion
Informa:on and consent
Detec:on of resistant bacteria or pathogenic microorganisms => exclusion of
the study
Diagnos-c of AML
D0
Feces collec-on and analysis
Control of microbiota recovery
Metagenomics Bacteriology (MDRB, C.
difficile) Biochemistry
Feces collec-on and analysis Determina-on of dysbiosis
Metagenomics Biochemistry
Bacteriology (MDRB, C. difficile)
AFMT ABer aplasia comple:on
≈D29 2 days before discharge
D30-‐D31 (D25 to D36)
1 day before discharge
≈D40 At hospital entry
Hospitaliza-on for Induc-on chemotherapy (≈30 days)
Hospitaliza-on for consolida-on chemotherapy (≈30 days)
Pa:ent at home (≈10 days)
Visit 1 Visit 2 Visit 3 Visit 4 Visit 5 Visit 6
Chemotherapy Aplasia An-bio-cs
≈D70 At hospital discharge
≈M6 ≈M12
Pa-ent follow-‐up Collec:on of clinical informa:ons
Hospitaliza:ons in ICU, new medica:ons (D70, M6) Status (alive/death, remission/relapse), AE, SAE (D70,
M6, M12)
Main participation period ≈ 70 days Follow-up (1 year)
Autologous Fecal Transplantation in Newly Diagnosed AML Patients
AE, adverse event; AFMT, autologous fecal microbiota transplantation; AML, acute myeloid leukemia; ICU, intensive care unit; MDRB, multidrug resistant bacteria; SAE, serious adverse event .
ClinicalTrials.gov Identifier: NCT02928523.
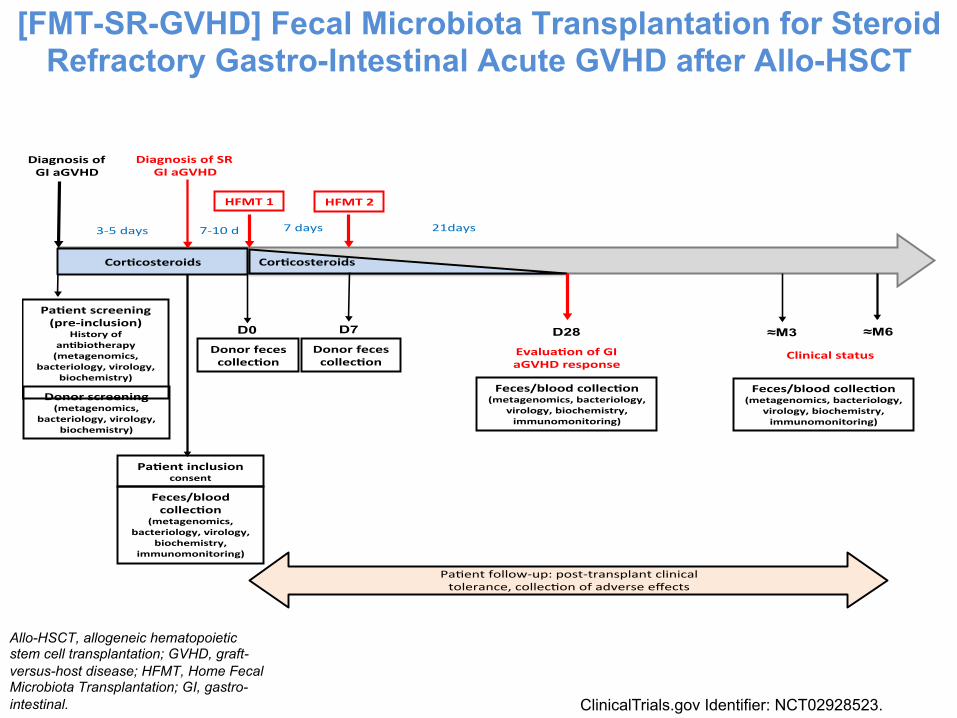
[FMT-SR-GVHD] Fecal Microbiota Transplantation for Steroid Refractory Gastro-Intestinal Acute GVHD after Allo-HSCT
Diagnosis(of(((GI(aGVHD(
Donor(screening((metagenomics,(
bacteriology,(virology,(biochemistry)!
Cor<costeroids(
Feces/blood(collec<on((metagenomics,(bacteriology,(
virology,(biochemistry,(immunomonitoring)!
Donor(feces(collec<on(
HFMT(1!
Pa<ent(screening((preFinclusion)!
History(of(an<biotherapy((metagenomics,(
bacteriology,(virology,(biochemistry)!
!
Pa$ent!follow,up:!post,transplant!clinical!tolerance,!collec$on!of!adverse!effects!
!
3,5!days! 21days!
Cor<costeroids!
7!days!
Evalua<on(of(GI(aGVHD(response((
((
Donor(feces(collec<on(
Diagnosis(of(SR(GI(aGVHD(
7,10!d!
HFMT(2!
≈M3 ≈M6 D28
Pa<ent(inclusion(consent!
D0 D7
Feces/blood(collec<on(
(metagenomics,(bacteriology,(virology,(
biochemistry,(immunomonitoring)!
Feces/blood(collec<on((metagenomics,(bacteriology,(
virology,(biochemistry,(immunomonitoring)!
Clinical(status(
Allo-HSCT, allogeneic hematopoietic stem cell transplantation; GVHD, graft-versus-host disease; HFMT, Home Fecal Microbiota Transplantation; GI, gastro-intestinal. ClinicalTrials.gov Identifier: NCT02928523.
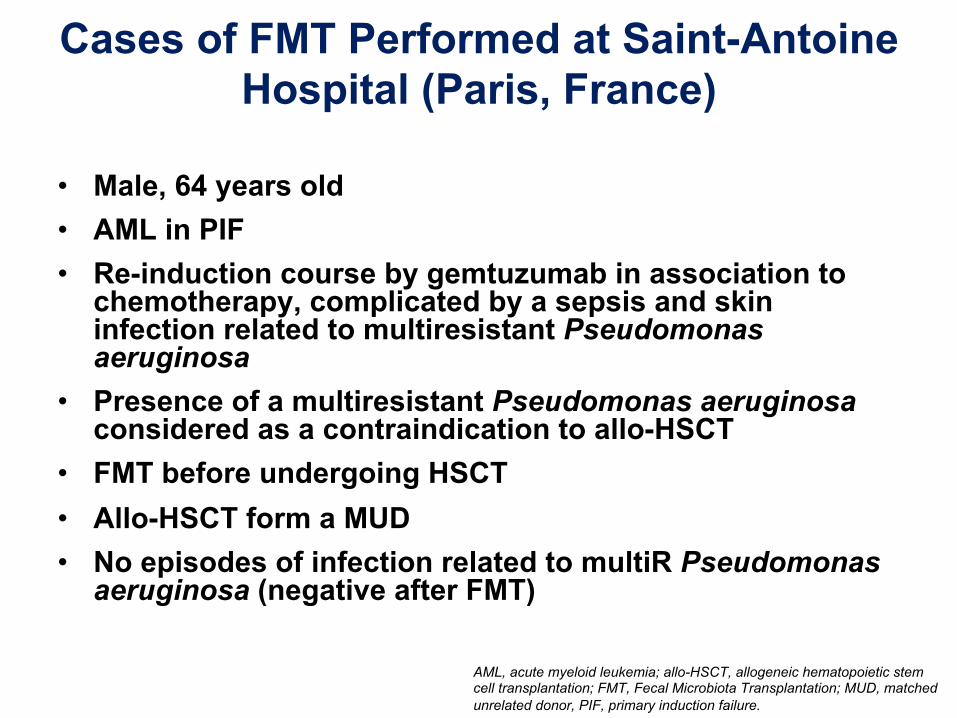
Cases of FMT Performed at Saint-Antoine Hospital (Paris, France)
• Male, 64 years old • AML in PIF • Re-induction course by gemtuzumab in association to
chemotherapy, complicated by a sepsis and skin infection related to multiresistant Pseudomonas aeruginosa
• Presence of a multiresistant Pseudomonas aeruginosa considered as a contraindication to allo-HSCT
• FMT before undergoing HSCT • Allo-HSCT form a MUD • No episodes of infection related to multiR Pseudomonas
aeruginosa (negative after FMT)
AML, acute myeloid leukemia; allo-HSCT, allogeneic hematopoietic stem cell transplantation; FMT, Fecal Microbiota Transplantation; MUD, matched unrelated donor, PIF, primary induction failure.
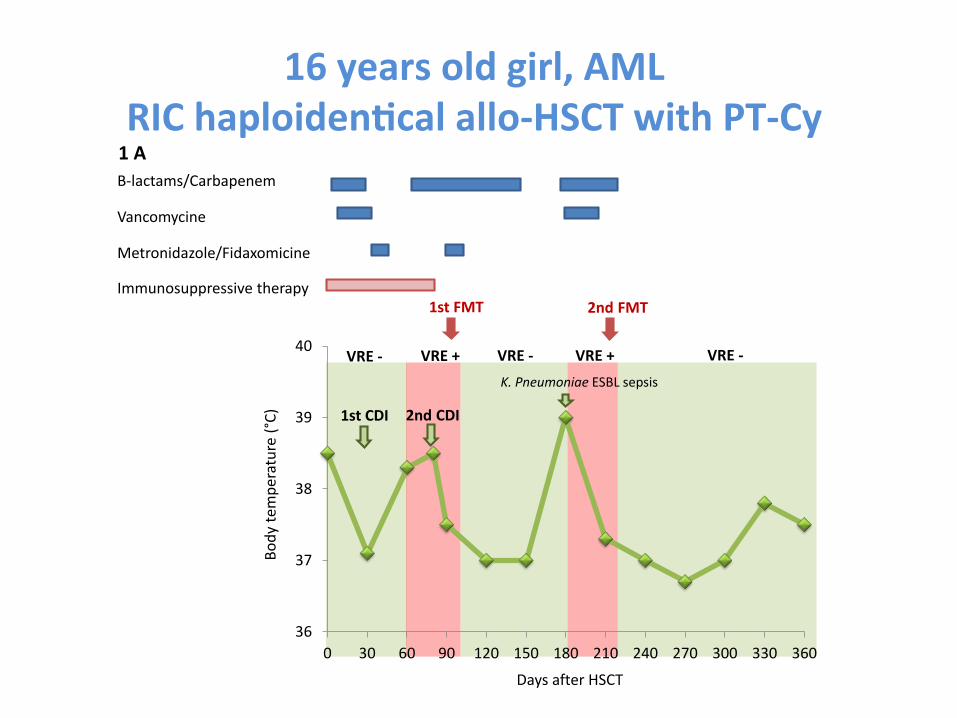
16 years old girl, AML RIC haploiden-cal allo-‐HSCT with PT-‐Cy
Β-‐lactams/Carbapenem
Vancomycine
Metronidazole/Fidaxomicine
Immunosuppressive therapy
1 A
1st FMT 2nd FMT
VRE -‐VRE + VRE +
36
37
38
39
40
0 30 60 90 120 150 180 210 240 270 300 330 360
VRE -‐VRE -‐
Body te
mpe
rature
(°C)
Days after HSCT
1st CDI 2nd CDI
K. Pneumoniae ESBL sepsis
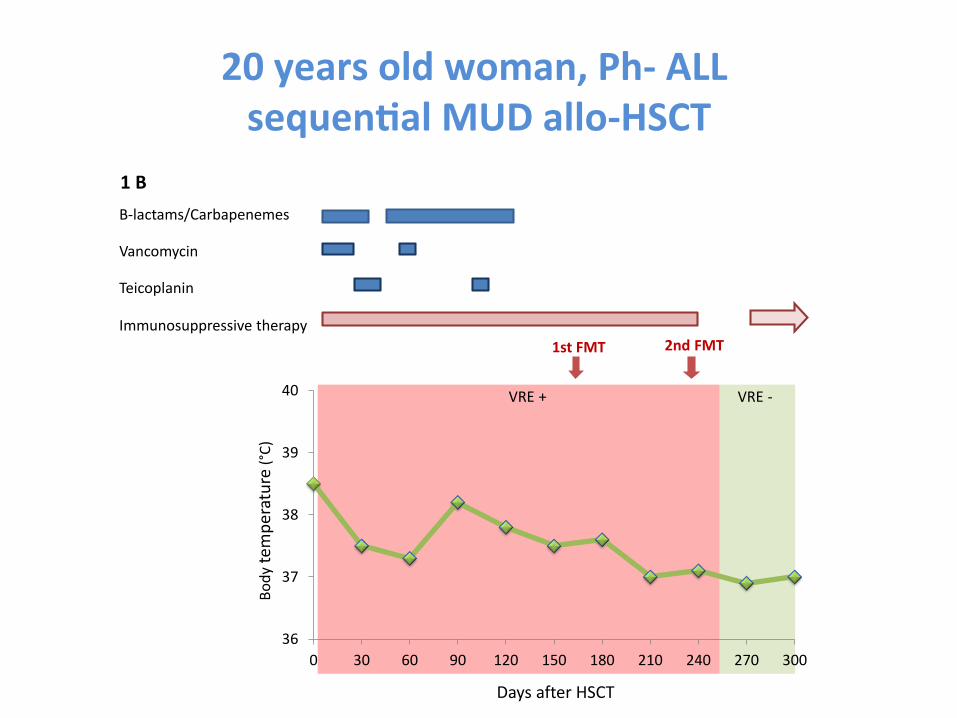
20 years old woman, Ph-‐ ALL sequen-al MUD allo-‐HSCT
Β-‐lactams/Carbapenemes
Vancomycin
Teicoplanin
Immunosuppressive therapy
Body te
mpe
rature
(°C)
Days after HSCT
36
37
38
39
40
0 30 60 90 120 150 180 210 240 270 300
1st FMT 2nd FMT
VRE + VRE -‐
1 B
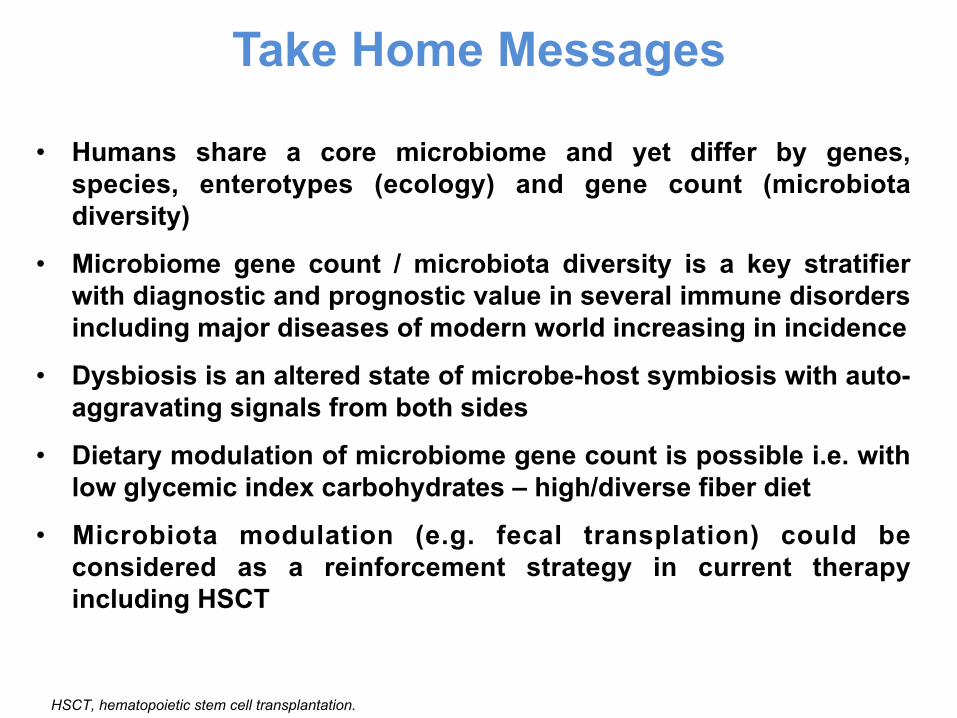
Take Home Messages
• Humans share a core microbiome and yet differ by genes, species, enterotypes (ecology) and gene count (microbiota diversity)
• Microbiome gene count / microbiota diversity is a key stratifier with diagnostic and prognostic value in several immune disorders including major diseases of modern world increasing in incidence
• Dysbiosis is an altered state of microbe-host symbiosis with auto-aggravating signals from both sides
• Dietary modulation of microbiome gene count is possible i.e. with low glycemic index carbohydrates – high/diverse fiber diet
• Microbiota modulation (e.g. fecal transplation) could be considered as a reinforcement strategy in current therapy including HSCT
HSCT, hematopoietic stem cell transplantation.
The Future of Hematopoietic Stem Cell Transplantation
• INSERM U938, team Mohty • Mohamad Mohty • Beatrice Gaugler • Florent Malard • Eolia Brissot • Agathe Farge • Vincent Jachiet • Myriam Labopin • Arsène Mekinian • Nicolas Stocker • Yishan Ye
• Bone Marrow Transplant Group -‐ Hematology department -‐ Saint-‐Antoine Hospital: • Mohamad Mohty • Georgia Babpaglia • Ramdane Belhocine • Eolia Brissot • Remy Dulery • Florent Malard • Clemence Mediavilla
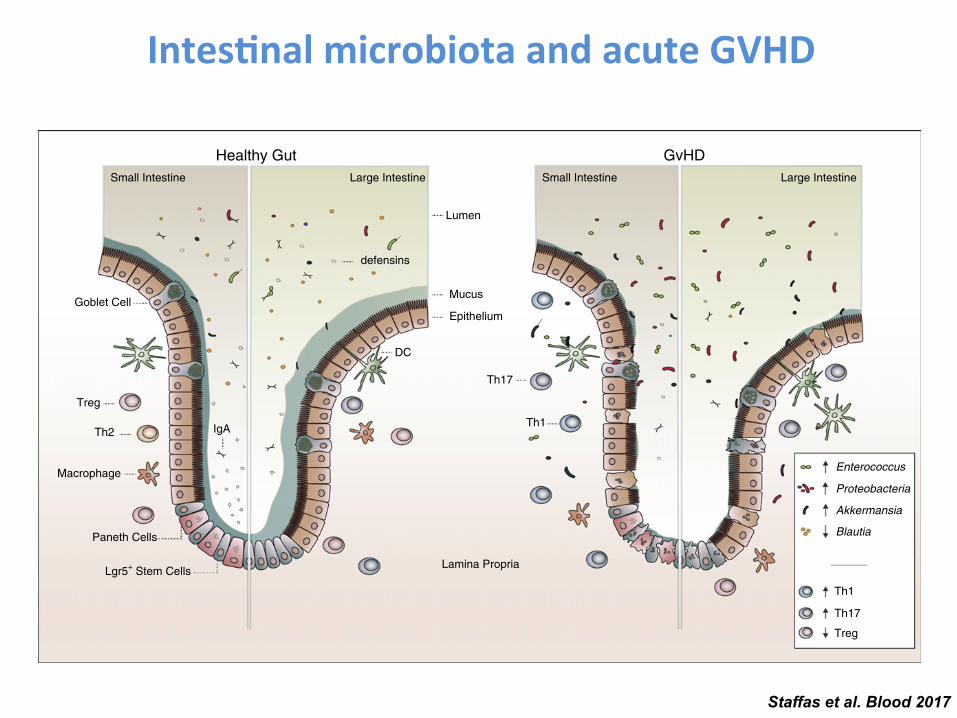
and reduced levels of Firmicutes including Blautia species afterchemotherapy.52 However, the causal relationship between thechemotherapy and microbiota is hard to delineate because manyof these patients received prophylactic antibiotics concurrentlywith the chemotherapy.
The intestinal microbiota and GVHD
A normal and healthy intestinal microbiota is diverse and dominatedby obligate anaerobic bacteria.16,19 From the time of admission todischarge from the hospital, many HCT patients lose this diversity,and the changes that occur are influenced by antibiotic treatmentas well as development of GVHD.53-55 An impact of the microbiotaon GVHD development was first proposed in the 1970s when it wasdemonstrated that mice kept under germ-free conditions developedless gutGVHD.56,57 These resultswere followed up by clinical studiesthat initially showed promising results for intestinal decontamina-tion in HCT patients,58,59 though later studies have not reproducedthese benefits,60-62 possibly due to varying success of the decontami-nating regimens. In addition, a large prospective study targetinganaerobic bacteria in HCT patients showed decreased GVHDdevelopment, indicating that selective decontamination may havebeneficial effects.63
The loss of intestinal diversity seen in HCT patients is generallyassociated with loss of Clostridia species known to produce SCFAsfrom dietary fiber.64 Butyrate is preferred as an energy source ofintestinal epithelial cells and a recent article suggests that reducedamounts of butyrate are found in intestinal epithelial cells after allo-
HCT in mice, while the addition of these SCFAs reduced gutdamage and GVHD.65 Interestingly, this effect was also mimickedby the administration of a mix of bacteria, known to be highproducers of butyrate, belonging to the Clostridia class. Althoughthis is so far the only experimental evidence of efficacy of SCFAs ina GVHD model, a clinical study from our group also showedthat high intestinal abundance of Blautia, a genus belonging tothe Clostridia class, correlates with reduced risk of death fromGVHD.66 Antibiotic treatment is probably the main factor thatinfluences the microbiota changes observed during the course oftransplant andwe recently showed that the choice of antibiotic regimenused to treat neutropenic fever influences the incidence of GVHD.Administration of the broad-spectrum antibiotics imipenem-cilastatinand piperacillin-tazobactam was associated with increased GVHD-relatedmortality at 5 years.67 This retrospective study did not findan association between metronidazole and reduced GVHD asreported by Beelen et al,63 which could be due to multiple factorsincluding the use of different antibiotic combinations in theretrospective study, aswell as geographic and cultural differences in theintestinal flora. Fecal microbiota transplant (FMT) can be used torestore a disrupted intestinalflora and a recent pilot studywith the aim toevaluate the safety of FMT in HCT patients with steroid-refractory orsteroid-dependent GVHD showed promising results; the treatment waswell received and 3 of 4 patients showed resolution of signs andsymptoms of GVHD 28 days after FMT.68 However, this very smallstudy did not address long-term efficacy and larger studies with thecapacity to control for confounding factors will be necessary todetermine the efficacy of FMT as a novel treatment of GVHD.Together, these results indicate that the microbiota present in the gutmay not only mirror GVHD host pathology but that the reverse may
Healthy Gut GvHDSmall Intestine Small IntestineLarge Intestine Large Intestine
Lumen
Mucus
Epithelium
Th17
Th1
Lamina Propria
Enterococcus
Proteobacteria
Akkermansia
Blautia
Th1
Th17
Treg
defensins
DC
IgA
Goblet Cell
Treg
Th2
Macrophage
Paneth Cells
Lgr5+ Stem Cells
Figure 1. Intestinal damage and dysbiosis linked to GVHD. Upon HCT, multiple factors such as conditioning toxicity, antibiotic treatment, and immune activation mediateGVHD. GVHD progression associates with injury to stem cell compartments along with Paneth cells (small intestine) and goblet cells. This leads to increased intestinal
permeability, inflammation, and reduction of the mucus layer and antimicrobial products (eg, defensins). Antibiotic treatment and a limited amount of nutrients in the gut alsopromote gut dysbiosis, furthering gastrointestinal damage and disease. DC, dendritic cell; IgA, immunoglobulin A.
BLOOD, 23 FEBRUARY 2017 x VOLUME 129, NUMBER 8 GVHD AND INTESTINAL MICROBIOTA 929
For personal use only.on October 27, 2017. by guest www.bloodjournal.orgFrom
Staffas et al. Blood 2017
Intes-nal microbiota and acute GVHD