microbial production of volatile organic compounds in soil microcosms
TRANSCRIPT
Microbial Production of Volatile Organic Compounds in Soil MicrocosmsPeter D. Stahl* and Timothy B. Parkin
ABSTRACTA study was conducted to evaluate the. use of volatile organic
microbial metabolites, particularly geosmin and 2-methylisoborneol,as indicators of activity of specific groups of microorganisms (actinomy-cetes, bacteria, or fungi) in soil. Substrates and selective antibioticswere added to soil microcosms to establish different soil microbialcommunities; volatile organic compounds (VOCs) in the headspaceatmosphere of the microcosms were collected by purge-and-trap meth-,ods and analyzed by gas chromatography-mass spectrometry. Treat-ments differed in total amount of VOCs produced, numbers and kindsof VOCs detected, and in temporal patterns of VOC production. Thegreatest total amount of VOCs and largest number of different VOCswere produced in the treatment with greatest actinomycetal and bacte-rial activity, followed by the treatment dominated by fungal activity.Geosmin was occasionally detected in small amounts but only in micro-cosms with substantial activity of all three groups of microorganisms(actinomycetes, bacteria, and fungi). 2-MethylisoborneoI was regularlydetected in significant.amounts but only in the treatment dominatedby actinomycetes and bacteria. Terpenes were the VOCs produced ingreatest quantity in the treatment with the most fungal activity. Resultsindicate that VOCs from soil may provide information as to the natureof the soil microbial community; however, relating the structure ofthe microbial community to soil VOC emissions is complicated becauseVOCs present in natural soils may be derived from a variety ofsources and their production is strongly influenced by environmental .conditions.
To BETTER UNDERSTAND the structure and functioningof microbial communities in soil and their response
to soil management practices or perturbations, it is neces-sary to differentiate the activities of the major groups ofsoil microorganisms, e.g. fungi, bacteria, and actinomy-cetes. Two techniques have been used to separate theactivities of fungi and bacteria in soil. These methodsare designed to estimate the relative contributions offungi and bacteria to soil respiration through the use of ^selective microbial biocides (Anderson and Domsch,1973) or selective metabolizable dyes (Stamatiadis etal., 1990). However, application of selective microbialbiocides to soil may cause changes in microbial commu-nity structure and allow indirect or nontarget effects tooccur (Ingham and Coleman, 1984). The direct micro-scopic counting procedure involved in enumerating selec-tively stained microorganisms is subject to a high degreeof observer-associated variability and, for this reason,comparisons of values obtained by different labs aretenuous (Stahl et al., 1995). Therefore, additional tech-niques to aid in the differentiation of activities of groupsof microbes in soil would be very useful. Soil is a majorsource of VOCs, most of which are formed as the resultof the metabolic activity of microorganisms (Stotzky andSchenck,1 1976). Fungi, bacteria, and actinomycetes in
P.O. Stahl, Dep. of Plant, Soil and Insect Sciences, Univ. of Wyoming,P.O. Box 3354, Laramie, WY 82071-3354; and T.B. Parkin, USDA-ARS,National Soil Tilth Lab., 2150 Pammel Drive, Ames, IA 50011. Received14 Dec. 1994. *Corresponding author ([email protected]).
Published in Soil Sci. Soc. Am. J. 60:821-828 (1996).
soil produce a wide variety of VOCs including alcohols,aliphatic and aromatic aldehydes, esters, amines, methyl-ated halogens, terpenoids, and volatile fatty acids (Lintonand Wright, 1993). Studies have shown that differentspecies of microorganisms produce different volatile or-ganic metabolites (Grametbauer et al., 1988; Borjessonet al., 1992). Thus, the amount and kinds of organicvolatiles produced, in a; soil is controlled by, amongother things, the structure and activity of the microbialcommunity.
Geosmin and 2-methylisoborneol are VOCs producedas metabolites of microorganisms and are important con-tributors to the earthy/musty odor of soil (Gerber andLechevalier, 1965; Buttery and Garibaldi, 1976). Bothcompounds are produced by certain actinomycetes(Gerber and Lechevalier, 1965; Gerber, 1979) and fungi(Karahadian et al., 1985; Mattheis and Roberts, 1992).These two compounds are unique in that they can bedetected by the human nose in air at concentrations inthe low parts per billion range (Buttery et al., 1969).In a study of purge-and-trap methods for extraction ofgeosmin and 2-methylisoborneol from soil, Stahl andParkin (1994) compared two soils and found that theone with highest extraetable levels of these two com-pounds also had the most fungal hyphae and actinomycetefilaments, supporting their hypothesis that these com-pounds may be good indicators of activity of filamentousorganisms.
The objectives of this'study were to determine if soilsinhabited by different communities of microorganismsproduce different kinds and amounts of VOCs, and if theVOCs produced reveal information about the structureof the microbial community. To accomplish this goal,substrates and selective antibiotics were added to soilmicrocosms to establish different soil microbial commu-nities; VOCs produced in the microcosms were collectedby purge-and-trap methods and analyzed by gas chroma-tography-mass spectrometry, with special regard givento geosmin and 2-methylisoborneol. Patterns of VOCproduction were then related to the structure of themicrobial community.
MATERIALS AND METHODSSoil used in this experiment was collected from the Doolittle
Native Prairie Preserve in Story County, Iowa (Kossuth siltyclay loam, a Typic Endoaquoll). Approximately 7 kg of soilwere returned to the lab, allowed to air dry slightly, and passedthrough a 4-mm sieve. Two hundred grams of this soil werethen placed in 500-mL Erlenmeyer flasks with a 24/40 jointneck to accommodate the VOC sampling apparatus.
Soil in the flasks was amended as follows to produce fivetreatments. Treatment 1 (control): 1.0 g talc was added andthoroughly mixed into the soil in each of five flasks. Treatment2: 1.0 g talc and 5.0 g dried, finely ground alfalfa (Medicagosaliva L.) leaves. Treatment 3: 1.0 g talc and 5.0 g dried,finely ground wheat (Triticum aestivum L.) straw. Treatment4: 0.4 g streptomycin (bactericide) diluted in 1.0 g talc and
821
822 SOIL SCI. SOC. AM. J., VOL. 60, MAY-JUNE 1996
Tovacuumpumpmanifold
Air inCharcoal trap
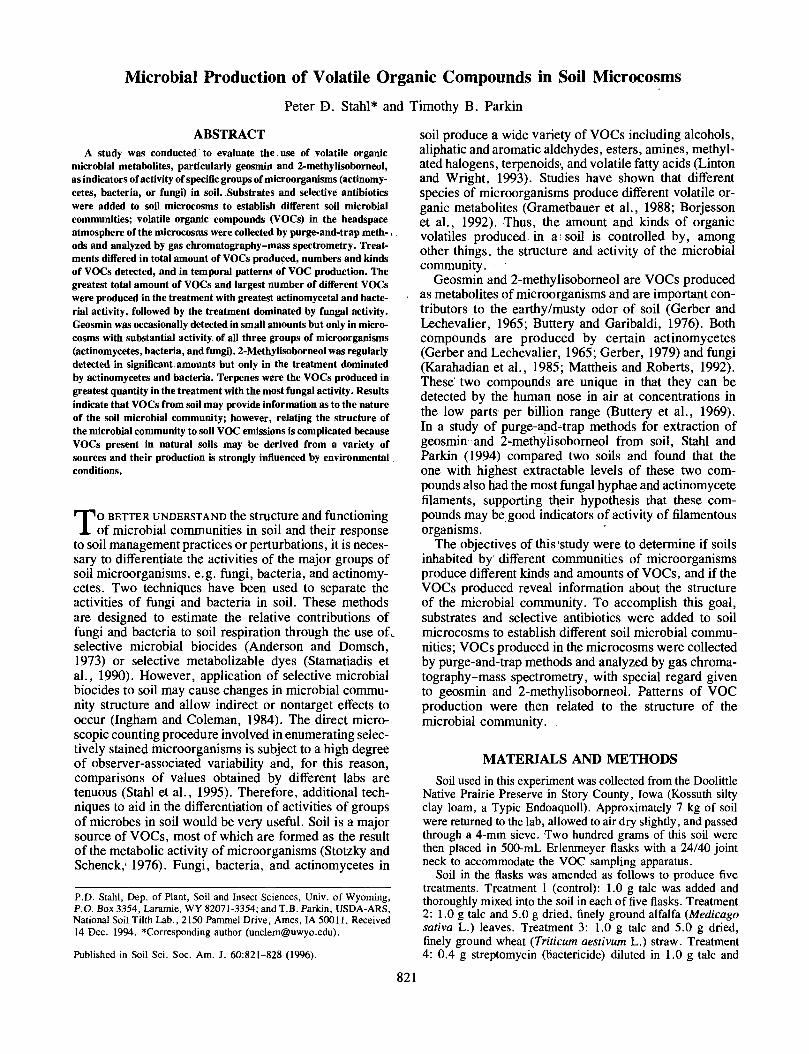
Fig. 1. Diagrammatic representation of purge-and-trap apparatus forcollection of volatile organic compounds produced in soil micro-cosms.
5.0 g dried, finely ground alfalfa leaves. Treatment 5: 0.4 gcycloheximide (fungicide) diluted in 1.0 g talc and 5.0 g dried,finely ground alfalfa leaves. Wheat straw and alfalfa leavesused in this experiment were harvested and air-dried 7 moprior to use. Talc was used as a diluent for even distributionof antibiotics in soil (Anderson and Domsch, 1978) and thefinal concentration of antibiotics in Treatments 4 and 5 was2 g kg-' soil. Sterile distilled water (13.0 mL) was added toall flasks after substrate and antibiotic additions to bring thegravimetric soil water content to 25%. The top of each flaskwas covered with an aluminum foil cap and the microcosmswere incubated at room temperature (23-24°C). This studywas designed as a completely randomized experiment witheach of the treatments replicated five times for a total of 25microcosms.
Every 3 d for the first 18 d of the experiment, and then onDay 24, headspaces of the microcosms were analyzed for bothVOC and CC>2. Soil was sampled for estimation of populationsof bacteria, actinomycetes, and fungi every 3 d for the first12 d of the experiment, and then on Days 18 and 24. Todetermine the COi concentration in the headspace of the micro-cosms, a 5.0-mL sample was withdrawn from the flask, throughthe foil cover, using a gas-tight syringe. Analysis of VOCswas accomplished by purge-and-trap methods as follows (Fig.1). The foil cover was removed from the top of the flask andquickly replaced with the inner glassware of a vacuum trap(with a 24/40 joint to fit the flask). The VOCs were purgedfrom the microcosms with a flow of air and collected on anin-line trap consisting of silanized glass tubes (11.5 cm by4 mm i.d.) loosely packed with Tenax TA (a porous polymersorbent, Alltech Associates, Deerfield, IL)1 attached directlyto the outlet of the apparatus (Stahl and Parkin, 1994). Thevacuum line was connected to the outlet end of the trap tocreate an air flow through the system, flushing VOCs fromthe microcosm and drawing them into the trap. Air enteringthe system was passed through an activated charcoal filter toprevent contamination of the sample. Microcosms were purgedfor 2 h at a flow rate of 25 mL min"1.
1 Mention of trademark or proprietary product is necessary to reportfactually on available data; however, the USDA neither guarantees norwarrants the standard of the product to the exclusion of others that mayalso be suitable.
Volatile organic compounds were desorbed from Tenaxtraps using a Supelco thermal tube desorber (Model 850),separated and quantified with a Hewlett Packard gas chromato-graph (Model 5890) and mass spectra of compounds wereobtained using a Hewlett Packard mass spectrometer (Model5989). Compounds were desorbed at 250°C for 5 min witha gas flow of 12 mL min""1 and carried directly to the columnof the gas chromatograph by a heated (170°C) transfer line.The gas chromatograph was equipped with a fused silica (DB-5)megabore column (30 m by 0.552 mm) and a flame ionizationdetector. The oven temperature program started at an initialtemperature of 40°C for 10 min and then increased at a rateof 10 C min~' to a final temperature of 255°C for 15 min.The mass spectrometer was operated in the electron ionizationmode with the source temperature at 250°C, ionization energyof 70 eV, and an electron multiplier voltage of 2200. Theinstrument was autotuned with perfluorotributylamine usingmass 69, 219, and 502. The VOCs in the headspace atmo-spheres of microcosms were identified by computer matchingof mass spectra of unknown compounds to known mass spectraof compounds in the Hewlett Packard computerized Wylie/NBS registry of mass spectral data (McLafFerty, 1989).
Direct microscopic examination of fungal hyphae and actino-mycete filaments in soil was conducted using the membranefilter method (Hanssen et al., 1974), with calcofluor M2Rwhite as stain for slide preparation, and the gridline intersectmethod (Olson, 1950) for measuring hyphal lengths. For eachslide made, 1 g soil (wet weight) was dispersed in 500 mLnanopure filtered water in a blender for 1.5 min. One milliliterof the suspension was passed through a 25-mm-diam. 0.4-u,mmesh polycarbonate membrane filter. The material remainingon the filter was then stained for 15 to 20 s with 1 mL of a2.3 ug mL'1 aqueous solution of calcofluor white dispensedwith a syringe equipped with a 0.2-u,m filter. Stain was removedby vacuum followed by rinsing with nanopure filtered water.The stained filter was placed on a glass microscope slide,allowed to air dry for a few seconds to remove excess moisture,mounted with two drops of immersion oil, and covered witha glass cover slip. The number of bacteria cells in a soil wasalso estimated using direct microscopic methods similar tothose used for fungi and actinomycetes except that soil sampleswere diluted in a buffer solution (10 mM Na2HPO4) to a finalconcentration of 1:250000 and stained with acridine orange(0.01%). Slides were examined with a Nikon Microphot-SAepifluorescent microscope equipped with a high-intensity mer-cury light source and a Nikon UV-1A filter cube. Observationsof fungi and actinomycetes were made using a dry 40 X objec-tive, 10 X oculars, and 1.5 X light path magnifier (total magni-fication 600x). Bacteria were observed using a lOOx oilobjective, 10 X oculars, and a Nikon B-2H filter cube. Twenty-five randomly chosen fields of view were counted on eachslide.
RESULTSCharacterization of microbial communities in the five
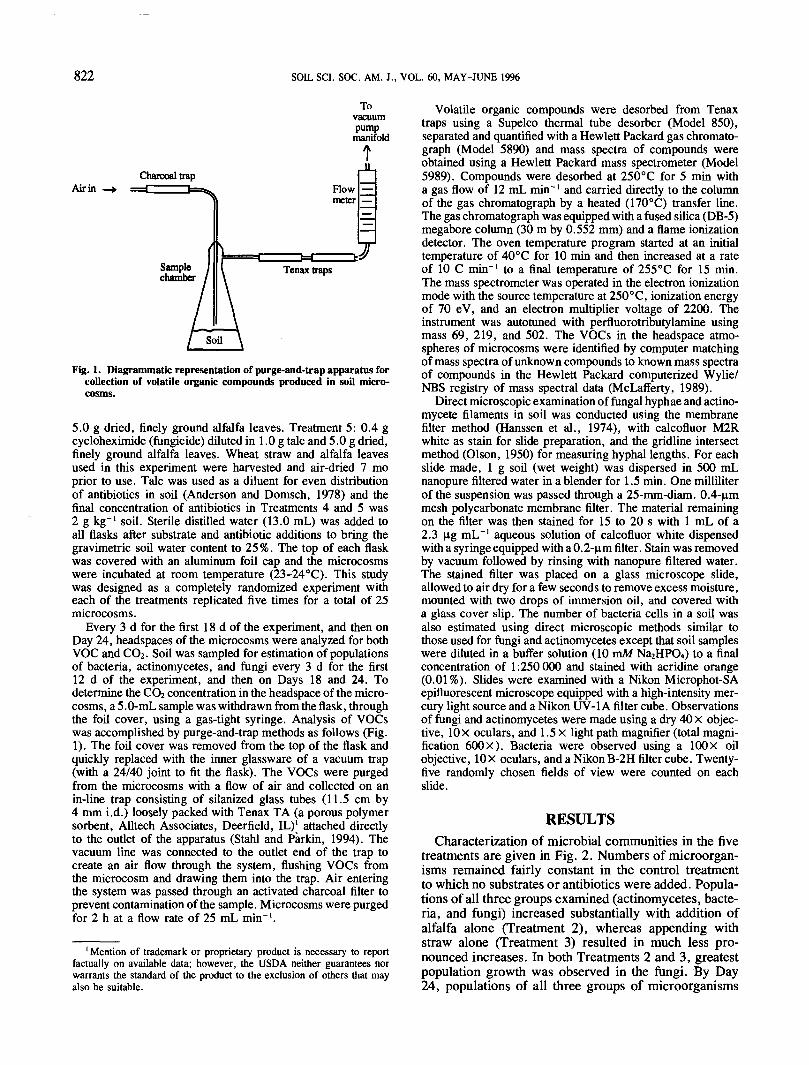
treatments are given in Fig. 2. Numbers of microorgan-isms remained fairly constant in the control treatmentto which no substrates or antibiotics were added. Popula-tions of all three groups examined (actinomycetes, bacte-ria, and fungi) increased substantially with addition ofalfalfa alone (Treatment 2), whereas appending withstraw alone (Treatment 3) resulted in much less pro-nounced increases. In both Treatments 2 and 3, greatestpopulation growth was observed in the fungi. By Day24, populations of all three groups of microorganisms
STAHL & PARKIN: MICROBIAL PRODUCTION OF VOLATILE ORGANIC COMPOUNDS 823
TREATMENT 1Control
TREATMENT 2Alfalfa
TREATMENTSStraw
TREATMENT 4Alfalfa + Streptomycin
TREATMENT 5Alfalfa + Cycloheiumide
FungiO BacteriaQ Actinomycetes
6 12 18 24 6 12 18 24 6 12 18 24 6 12 18 24INCUBATION TIME (DAYS)
6 12 18 24
Fig. 2. Populations of actinomycetes, bacteria, and fungi in soil microcosms for the five experimental treatments during the course of theexperiment. Each data point represents the mean of five observations. Error bars = ±1 standard error.
in all five treatments had returned to levels similar tothose at the beginning of the experiment. Fungal activitywas greatest in microcosms to which alfalfa and strepto-mycin were added (Treatment 4) but smaller increasesin actinomycete and bacteria populations were also ob-served. Growth of actinomycetes and bacteria was great-est with addition of alfalfa and cycloheximide but arelatively small, slow expansion of the fungal populationwas also detected. Appending Treatments 4 and 5 withantibiotics did not completely inhibit growth of targetorganisms but resulted in greater activity of nontargetorganisms compared with Treatment 2.
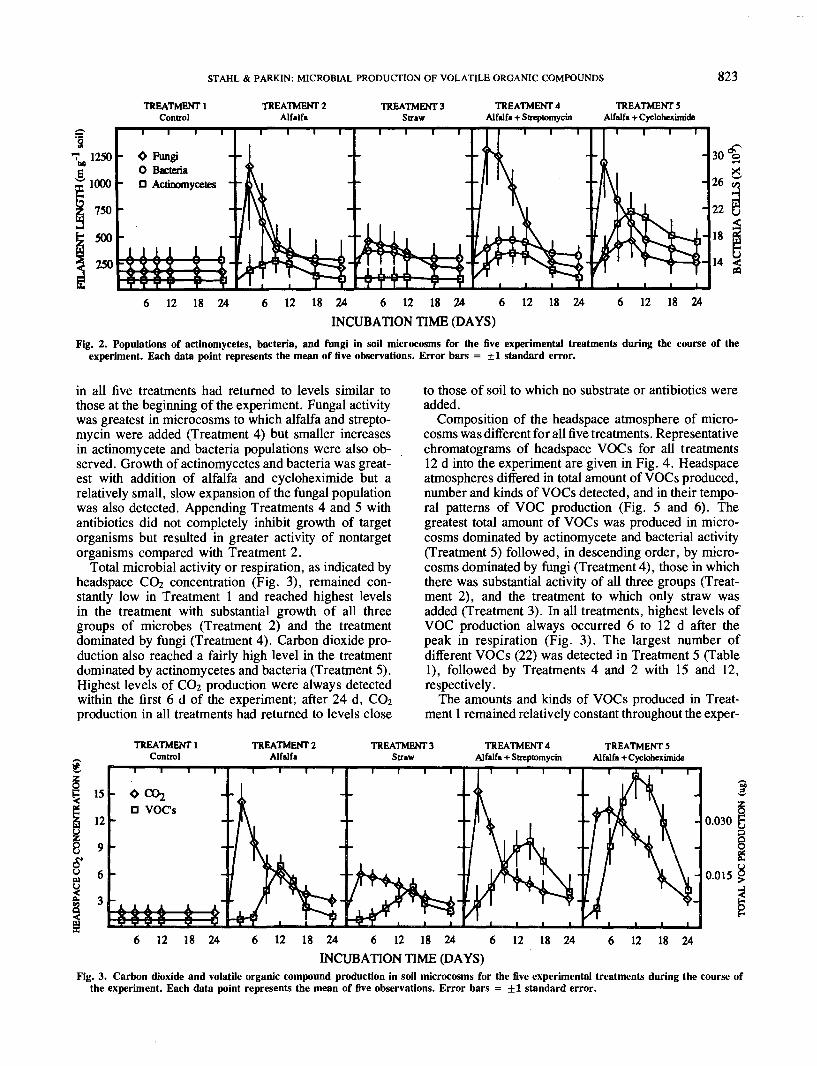
Total microbial activity or respiration, as indicated byheadspace CO2 concentration (Fig. 3), remained con-stantly low in Treatment 1 and reached highest levelsin the treatment with substantial growth of all threegroups of microbes (Treatment 2) and the treatmentdominated by fungi (Treatment 4). Carbon dioxide pro-duction also reached a fairly high level in the treatmentdominated by actinomycetes and bacteria (Treatment 5).Highest levels of CCh production were always detectedwithin the first 6 d of the experiment; after 24 d, CO2production in all treatments had returned to levels close
to those of soil to which no substrate or antibiotics wereadded.
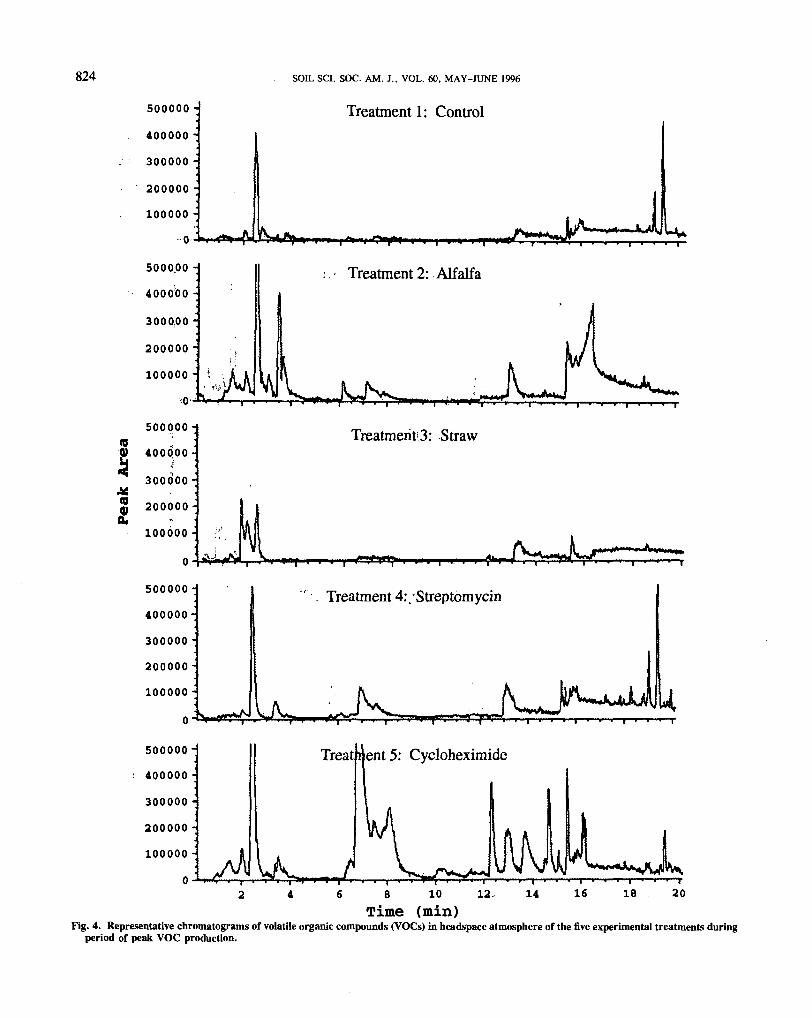
Composition of the headspace atmosphere of micro-cosms was different for all five treatments. Representativechromatograms of headspace VOCs for all treatments12 d into the experiment are given in Fig. 4. Headspaceatmospheres differed in total amount of VOCs produced,number and kinds of VOCs detected, and in their tempo-ral patterns of VOC production (Fig. 5 and 6). Thegreatest total amount of VOCs was produced in micro-cosms dominated by actinomycete and bacterial activity(Treatment 5) followed, in descending order, by micro-cosms dominated by fungi (Treatment 4), those in whichthere was substantial activity of all three groups (Treat-ment 2), and the treatment to which only straw wasadded (Treatment 3). In all treatments, highest levels ofVOC production always occurred 6 to 12 d after thepeak in respiration (Fig. 3). The largest number ofdifferent VOCs (22) was detected in Treatment 5 (Table1), followed by Treatments 4 and 2 with 15 and 12,respectively.
The amounts and kinds of VOCs produced in Treat-ment 1 remained relatively constant throughout the exper-
TREATMENTlControl
TREATMENT?Alfalfa
TREATMENTSStraw
TREATMENT4Alfalfa + Streptomycin
TREATMENT 5Alfalfa + Cycloheximide
- 0.030
- 0.015
18 24 12 18 24 6 12 18 24 6INCUBATION TIME (DAYS)
12 18 24 6 12 18 24
Fig. 3.the
Carbon dioxide and volatile organic compound production in soil microcosms for the five experimental treatments during the course ofexperiment. Each data point represents the mean of five observations. Error bars = ±1 standard error.
824
IB
2
500000 -
400000 •
300000 -
200000 -
100000 -
0
5000,00 -
400000 -
3000,00 "
200000 -
100000 -
,0-- i500000 -
400000 -
300000-
200000-*r
100000-
0
SOIL SCI. SOC. AM. J., VOL. 60, MAY-JUNE 1996
Treatment 1: Control
I * '•r^lftl I I I I I I I
Treatment 2: Alfalfa
Treatment'3: Straw
Treatment 4: ,* Streptomycin
-xAJLu
nt 5: Cycloheximide
8 10Time (min)
Fig. 4. Representative chromatograms of volatile organic compounds (VOCs) in headspace atmosphere of the five experimental treatments duringperiod of peak VOC production.
STAHL & PARKIN: MICROBIAL PRODUCTION OF VOLATILE ORGANIC COMPOUNDS 825
500000 *
400000 •;
300000 '
200000
looooo r
Early
(0500000 ;•
400000 '
300000 •
200000 -
100000 *
0 •
500000 I
400000 ;*
300000 :<
200000 it
100000 *
Middle
Late
»"T"12 14 16 18 202 4 6 8 1 0
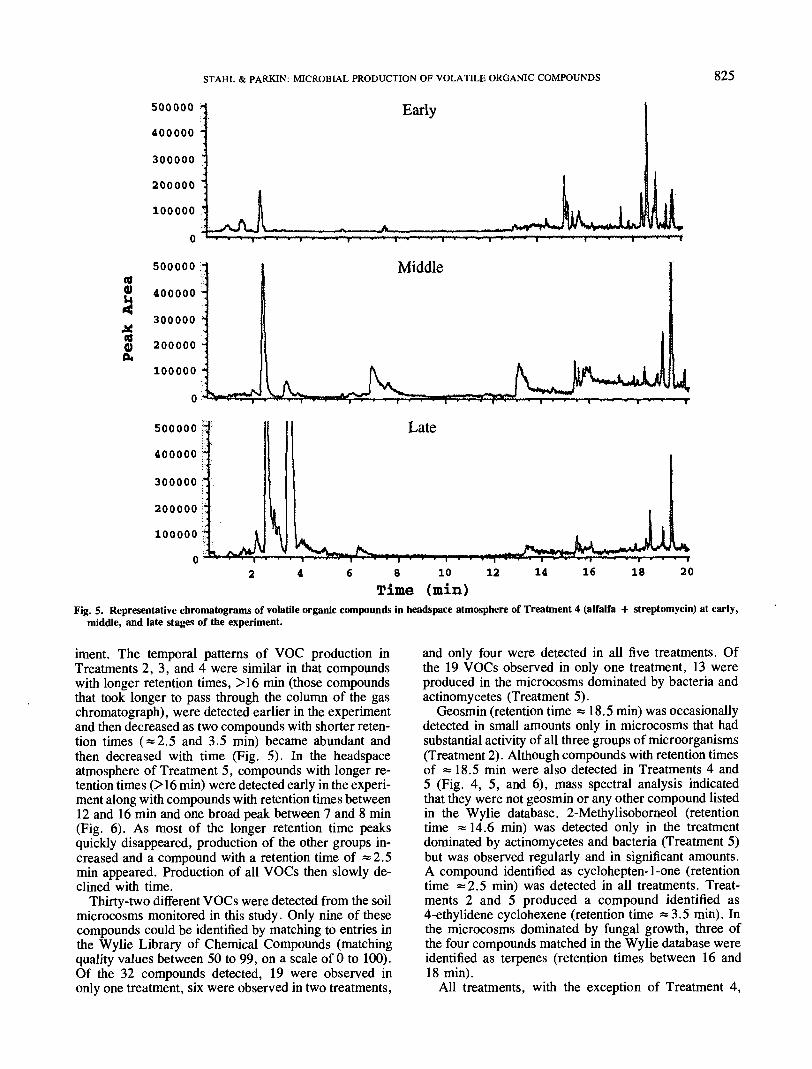
Time (min)Fig. 5. Representative chromatograms of volatile organic compounds in headspace atmosphere of Treatment 4 (alfalfa + streptomycin) at early,
middle, and late stages of the experiment.
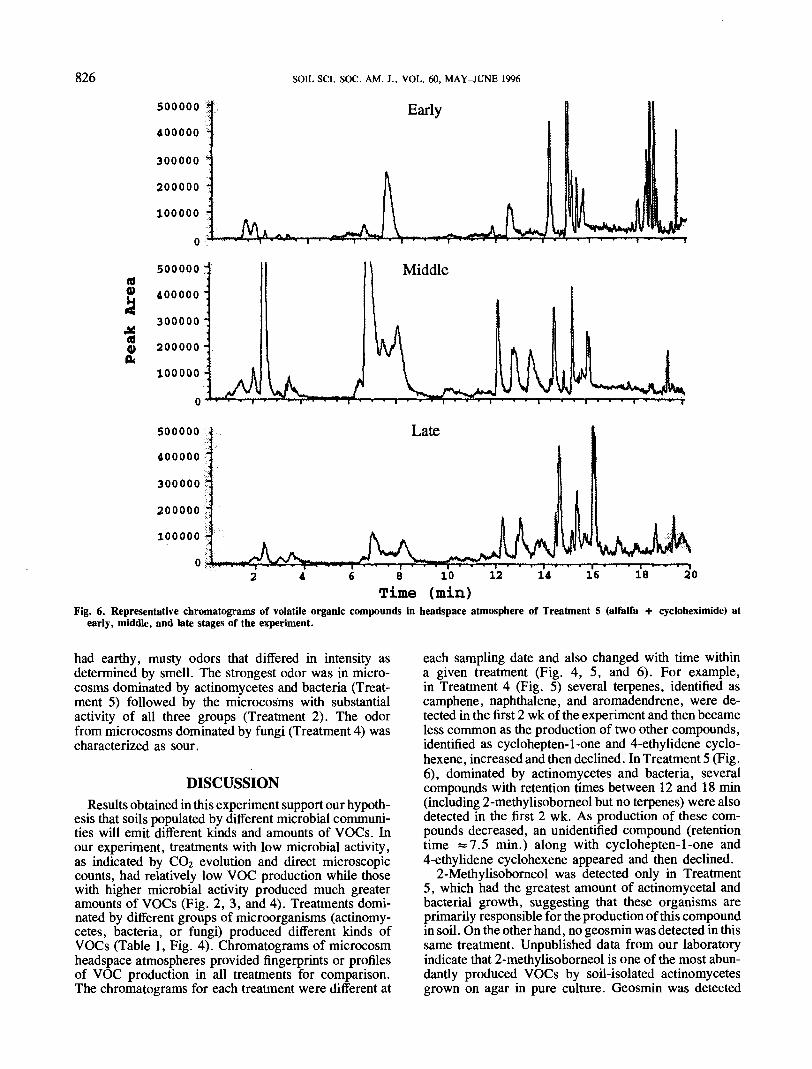
iment. The temporal patterns of VOC production inTreatments 2, 3, and 4 were similar in that compoundswith longer retention times, >16 min (those compoundsthat took longer to pass through the column of the gaschromatograph), were detected earlier in the experimentand then decreased as two compounds with shorter reten-tion times ( = 2.5 and 3.5 min) became abundant andthen decreased with time (Fig. 5). In the headspaceatmosphere of Treatment 5, compounds with longer re-tention times (>16 min) were detected early in the experi-ment along with compounds with retention times between12 and 16 min and one broad peak between 7 and 8 min(Fig. 6). As most of the longer retention time peaksquickly disappeared, production of the other groups in-creased and a compound with a retention time of =2.5min appeared. Production of all VOCs then slowly de-clined with time.
Thirty-two different VOCs were detected from the soilmicrocosms monitored in this study. Only nine of thesecompounds could be identified by matching to entries inthe Wylie Library of Chemical Compounds (matchingquality values between 50 to 99, on a scale of 0 to 100).Of the 32 compounds detected, 19 were observed inonly one treatment, six were observed in two treatments,
and only four were detected in all five treatments. Ofthe 19 VOCs observed in only one treatment, 13 wereproduced in the microcosms dominated by bacteria andactinomycetes (Treatment 5).
Geosmin (retention time =18.5 min) was occasionallydetected in small amounts only in microcosms that hadsubstantial activity of all three groups of microorganisms(Treatment 2). Although compounds with retention timesof «18.5 min were also detected in Treatments 4 and5 (Fig. 4, 5, and 6), mass spectral analysis indicatedthat they were not geosmin or any other compound listedin the Wylie database. 2-Methylisoborneol (retentiontime as14.6 min) was detected only in the treatmentdominated by actinomycetes and bacteria (Treatment 5)but was observed regularly and in significant amounts.A compound identified as cyclohepten-1-one (retentiontime =2.5 min) was detected in all treatments. Treat-ments 2 and 5 produced a compound identified as4-ethylidene cyclohexene (retention time =3.5 min). Inthe microcosms dominated by fungal growth, three ofthe four compounds matched in the Wylie database wereidentified as terpenes (retention tunes between 16 and18 min).
All treatments, with the exception of Treatment 4,
826 SOIL SCI. SOC. AM. J., VOL. 60, MAY-JUNE 1996
Early
6 8 10 12Time (min)
Fig. 6. Representative chromatograms of volatile organic compounds in headspace atmosphere of Treatment 5 (alfalfa + cycloheximide) atearly, middle, and late stages of the experiment.
had earthy, musty odors that differed in intensity asdetermined by smell. The strongest odor was in micro-cosms dominated by actinomycetes and bacteria (Treat-ment 5) followed by the microcosms with substantialactivity of all three groups (Treatment 2). The odorfrom microcosms dominated by fungi (Treatment 4) wascharacterized as sour.
DISCUSSIONResults obtained in this experiment support our hypoth-
esis that soils populated by different microbial communi-ties will emit different kinds and amounts of VOCs. Inour experiment, treatments with low microbial activity,as indicated by CO2 evolution and direct microscopiccounts, had relatively low VOC production while thosewith higher microbial activity produced much greateramounts of VOCs (Fig. 2, 3, and 4). Treatments domi-nated by different groups of microorganisms (actinomy-cetes, bacteria, or fungi) produced different kinds ofVOCs (Table 1, Fig. 4). Chromatograms of microcosmheadspace atmospheres provided fingerprints or profilesof VOC production in all treatments for comparison.The chromatograms for each treatment were different at
each sampling date and also changed with time withina given treatment (Fig. 4, 5, and 6). For example,in Treatment 4 (Fig. 5) several terpenes, identified ascamphene, naphthalene, and aromadendrene, were de-tected in the first 2 wk of the experiment and then becameless common as the production of two other compounds,identified as cyclohepten-1-one and 4-ethylidene cyclo-hexene, increased and then declined. In Treatment 5 (Fig.6), dominated by actinomycetes and bacteria, severalcompounds with retention times between 12 and 18 min(including 2-methylisoborneol but no terpenes) were alsodetected in the first 2 wk. As production of these com-pounds decreased, an unidentified compound (retentiontime «7.5 min.) along with cyclohepten-1-one and4-ethylidene cyclohexene appeared and then declined.
2-Methylisoborneol was detected only in Treatment5, which had the greatest amount of actinomycetal andbacterial growth, suggesting that these organisms areprimarily responsible for the production of this compoundin soil. On the other hand, no geosmin was detected in thissame treatment. Unpublished data from our laboratoryindicate that 2-methylisoborneol is one of the most abun-dantly produced VOCs by soil-isolated actinomycetesgrown on agar in pure culture. Geosmin was detected

STAHL & PARKIN: MICROBIAL PRODUCTION OF VOLATILE ORGANIC COMPOUNDS 827
Table 1. Production of volatile organic compounds (VOCs) in soilmicrocosms throughout the course of the experiment.
TreatmentNumber of different
VOCs detected VOCs identified
1 (control) 42 (alfalfa) 12
3 (straw) 64 (alfalfa + streptomycin) 15
5 (alfalfa + cycloheximide) 22
Cyclohepten-1-oneCampheneCyclohepten-1-oneGeosmint4-ethylidene cyclohexene2-methyl-2-borneneCyclohepten-1-oneCampheneNaphthaleneCyclohepten-1-oneAromadendrene2-methyl-2-bornene2-methylisoborneol4-ethylidene cyclohexeneCyclohepten-1-one
t Compounds in italics were found in one treatment only.
only in microcosms in which there was substantial activityof all three groups of microorganisms (Treatment 2),making it difficult to determine its source because itwas not detected in any of the treatments in which themicrobial community was dominated by a particulargroup. Additionally, results of a previous study fromour lab (Stahl and Parkin, 1994) indicate that geosminmay be strongly sorbed to surfaces in soil. This suggeststhat geosmin production may be more common than ourresults indicate but because this compound does notreadily escape from soil, it may, at times, be absentfrom the headspace atmosphere.
Mass spectral analyses of compounds collected fromTreatment 4, dominated by fungi, indicate that terpeneswere the type of VOC produced in greatest quantity bythese organisms in our study. The particular compoundproduced in largest amounts in Treatment 4 was matchedto camphene in the Wylie database. Two additional com-pounds commonly produced in microcosms dominated byfungi were matched to naphthalene and aromadendrenewhile a number of other VOCs collected were matchedto other terpenes in the database. In a number of otherstudies, terpenes have been found to be one of the mostabundantly produced groups of volatiles by fungi growingon agar and cereal grains (Borjesson et al., 1990, 1992)and naphthalene has previously been identified as a vola-tile metabolite of certain fungi (Karahadian et al., 1985).In an examination of VOCs emitted from forest floors,Hanson and Hoffman (1994) found that terpenes com-prised virtually all of the non-methane organic com-pounds escaping from these soils. The soil cores exam-ined by Hanson and Hoffman, however, contained plantroots that probably contributed to the production ofVOCs. Terpenes are among the most frequently reportedvolatiles from plants so it is likely that these compoundsin soil are of both plant and fungal origin.
The high number of different VOCs detected in Treat-ment 5 suggests that actinomycetes and bacteria havethe potential to produce more different kinds of VOCsin soil than do fungi. Only one compound produced inTreatment 5 was matched to a substance in the Wyliedatabase, 4-ethylidene cyclohexene. Because of the lackof information on the VOCs produced in Treatment 5,
little can be said as to their nature; however, none ofthese compounds were matched to terpenes in the Wyliedatabase.
The total amounts of VOCs produced in Treatments4 and 5 were more than double the amount produced inTreatment 2; however, differences in microbial biomass,as indicated by direct microscopic counts, were not nearlyas great. This observation suggests that the disturbance,or effect, created by antibiotics in soil resulted in greatermicrobial production of VOCs. Another possible expla-nation is that there is more concurrent microbial degrada-tion of the VOCs produced in Treatment 2 because noantibiotics were added.
Although peak VOC production always occurred 6 to12 d after the highest level of headspace CO2 concentra-tion in all treatments, there appeared to be little correla-tion between VOC and CO2 production. Highest head-space CO2 concentrations were observed in Treatment4, yet VOC production was much greater in Treatment5 (Fig. 3). This indicates that VOCs and CO2 are indica-tors of different kinds of activity. A lack of correlationbetween VOC and CO2 production was also reported byBorjesson et al. (1992) in their studies of fungi growingon cereal grains.
In conclusion, the results of this experiment indicatethat soils with different microbial communities will pro-duce different kinds and amounts of VOCs. Relating thenature of the microbial community to soil VOC emissionsis complicated, however, because VOCs present in natu-ral soils may be derived from a variety of sources, bothinternal and external to the soil. Types of substrates andmetabolic condition of soil microorganisms also playan important role in determining the VOCs produced(Stotzky and Schenck, 1976). Our data, from this andother studies, indicate that the earthy/musty odor of soilcannot be attributed solely to geosmin production byactinomycetes, but instead, there are numerous VOCsproduced by different microorganisms that contribute tothe unique odor of soil. The results of this study supportthe hypothesis that 2-methylisoborneol may be a goodindicator of metabolic activity of actinomycetes or actino-mycetes and bacteria in soil; however, the use of geosminas an indicator of microbial activity in soil was notsupported. Terpenes appear to be the VOCs most abun-dantly produced by fungi, but their usefulness as indica-tors of fungal activity in soil may be limited by the factthat they are also commonly produced by plant roots.
ACKNOWLEDGMENTSThe authors thank R.L. Pfeiffer for advice on gas chromatog-
raphy and mass spectrometry.
828 SOIL SCI. SOC. AM. J., VOL. 60, MAY-JUNE 1996
lites produced by six fungal species compared with other indicatorsof fungal growth on cereal grains. Appl. Environ. Microbiol. 58:2599-2605.
Buttery, R.G., and J.A. Garibaldi. 1976. Geosminand methylisobor-neol in garden soil. J. Agric. Food Chem. 24:1246-1247.
Buttery, R.G., R.M. Seifert, D.G. Guadagni, and L.C. Ling. 1969.Characterization of some volatile constituents of bell peppers. J.Agric. Food Chem. 17:1322-1327.
Gerber, N.N. 1979. Odorous compounds from actinomycetes. Dev.Ind. Microbiol. 20:225-238.
Gerber, N.N., and H.A. Lechevalier. 1965. Geosmin, an earthy-smelling substance from actinomycetes. Appl. Microbiol. 13:935-938.
Grametbauer, P., S. Kartusek, and D. Hausner. 1988. Contributionto the diagnosis of aerobic Gram-negative bacteria using detectionof volatile metabolites by gas chromatography. Cesk. Epidemiol.Mikrobiol. Imunol. 37:216-223.
Hanson, P.J., and W.A. Hoffman. 1994. Emissions of non-methaneorganic compounds and carbon dioxide from forest floor cores.Soil Sci. Soc. Am. J. 58:552-555.
Hanssen, J.F., T.F. Thingstad, and J. Goksoyr. 1974. Evaluation ofhyphal lengths and fungal biomass in soil by a membrane filtertechnique. Oikos 25:102-107.
Ingham, E.R., and D.C. Coleman. 1984. Effects of streptomycin,
cycloheximide, fungizone, captan, carbofuran, cygon, and PCNBon soil microorganisms. Microb. Ecol. 10:345-358.
Karahadian, C., D.B. Josephson, and R.C. Lindsay. 1985. Volatilecompounds from Penidllium sp. contributing musty-earthy notesto brie and camembert cheese flavours. J. Agric. Food Chem. 33:339-343.
Linton, C.J., and S.J.L. Wright. 1993. Volatile organic compounds:Microbiological aspects and some technological implications. J.Appl. Bacteriol. 75:1-12.
Mattheis, J.P., and R.G. Roberts. 1992. Identification of geosmin asa volatile metabolite of Penidllium expansion. Appl. Environ.Microbiol. 58:3170-3172.
McLafferty, F.W. 1989. The Wylie/NBS registry of mass spectraldata. John Wiley & Sons, New York.
Olson, F.C.W. 1950. Quantitative estimates of filamentous algae.Trans. Am. Microsc. Soc. 69:272-279.
Stahl, P.p., and T.B. Parkin. 1994. Purge-and-trap extraction ofgeosmin and 2-methylisoborneol from soil. Soil Sci. Soc. Am. J.58:1163-1167.
Stahl, P.D., T.B. Parkin, and N.S. Eash. 1995. Sources of error indirect microscopic methods for estimation of fungal biomass insoil. Soil Biol. Biochem. 27:1091-1097.
Stamatiadis, S., J.W. Doran, and E.R. Ingham. 1990. Use of stainingand inhibitors to separate fungal and bacterial activity in soil. SoilBiol. Biochem. 22:81-88.
Stotzky, G., and S. Schenck. 1976. Volatile organic compounds andmicroorganisms. Crit. Rev. Microbiol. 4:333-382.