microbial growth and transport in porous media under denitrification conditions: experiments and...
TRANSCRIPT
JOURNAL OF
Contaminant Hydrology
E L S E V I E R Journal of Contaminant Hydrology 24 (1997) 269-285
Microbial growth and transport in porous media under denitrification conditions: experiments and
simulations
T.P. Clement a, B.M. Peyton a,*, R.S. Skeen a, D.A. Jennings b, J.N. Petersen b
a Pacific Northwest Laborato~, Richland, WA 99337, USA b . . • Department of Chemtcal Engmeermg, Washington State Unit,ersi~, Pullman, WA 99164, USA
Received 1 August 1995; accepted 18 March 1996
A b s t r a c t
Soil column experiments were conducted to study bacterial growth and transport in porous media under denitrifying conditions. The study used a denitrifying microbial consortium isolated from aquifer sediments sampled at the U.S. Department of Energy's Hanford site. One-dimen- sional, packed-column transport studies were conducted under two substrate loading conditions. A detailed numerical model was developed to predict the measured effluent cell and substrate concentration profiles. First-order attachment and detachment models described the interphase exchange processes between suspended and attached biomass. Insignificantly different detachment coefficient values of 0.32 and 0.43 day ~, respectively, were estimated for the high and low nitrate loading conditions (48 and 5 mg 1 ~ NO 3, respectively). Comparison of these values with those calculated from published data for aerobically growing organisms shows that the denitri- fying consortium had lower detachment rate coefficients. This suggests that, similar to detachment rates in reactor-grown biofilms, detachment in porous media may increase with microbial growth rate. However, available literature data are not sufficient to confirm a specific analytical model for predicting this growth dependence.
Keywords: biofilm; porous media; bacteria transport; denitrification; detachment; model; in situ bioremedia- tion
* Corresponding author.
0169-7722/97/$17.00 Copyright © 1997 Elsevier Science B.V. All rights reserved. PH S0169-7722(96)00014-9
270 T.P. Clement et aL / Journal of Contaminant Hydrology 24 (1997) 269-285
1. Introduction
Indigenous subsurface microbes have the capacity to remediate contaminated soils and associated groundwater (Barker et al., 1987; MacIntyre et al., 1993; Borden, 1994). Additionally, active in situ bioremediation can accelerate microbially-mediated natural clean-up processes (Semprini et al., 1991; USNRC, 1992). However, developing an effective design for an in situ bioremediation system is difficult. One reason is a lack of understanding of biologically-mediated transport processes in porous media. These processes can have a large effect on in situ bioremediation because, parameters such as contaminant transformation rates, and the location and size of the bioactive region, depend on bacterial concentration and the spatial distribution of active biomass.
Investigators have used theoretical modeling and laboratory scale experiments to identify the principal processes that affect microbial transport in porous media (Corapcioglu and Haridas, 1985; Molz et al., 1986; Baveye and Valocchi, 1989; Taylor and Jaff'e, 1990a; Taylor et al., 1990; Hornberger et al., 1992; Cunningham and Wanner, 1993; Tan et al., 1994; Peyton et al., 1995). Those studies show that, in addition to advection and dispersion, microbial transport is affected by attachment and detachment processes that exchange bacterial cells between the suspended and attached biomass phases. Attachment processes include adsorption and physical straining from the ground- water. The colloid filtration theories of Tien et al. (1979) have been widely used to describe attachment (Taylor and Jaft?, 1990b; Martin et al., 1992; Hornberger et al., 1992). Detachment is the removal of attached-phase biomass and subsequent re-entrain- ment in the groundwater. Detachment processes in porous media include removal by erosion or sloughing. Erosion is the continuous removal of small particles of biomass and is presumed to be the result of shear forces exerted by the moving fluid in contact with the biomass surface. By contrast, sloughing is the detachment of large portions of biomass and is an apparently random and discrete process. Sloughing often occurs in older thicker biofilms or when environmental conditions change rapidly. No simple analytical expressions have been found to accurately model the underlying phenomena that cause detachment; hence, it is difficult to compute detachment rates a priori. Factors that have been suggested in various combinations to affect detachment rates include shear stress, growth rate, substrate loading rate, biofilm thickness, and biofilm density (Peyton and Characklis, 1993).
Few experimental studies of biofilm detachment have been performed in porous media systems. However, several investigations have provided some understanding of detachment processes in porous media. Fontes et al. (1991) and Hornberger et al. (1992) determined detachment rates for two Gram-negative strains. Tan et al. (1994) examined the effects of changes in flow velocities, cell concentrations, and ionic strengths on microbial transport. In these studies, a pulse of bacteria was fed into porous media columns under non-growth and non-decay conditions. The detachment coefficient was determined by calibrating an advection-dispersion model to describe bacterial concen- tration breakthrough data. All three studies indicate that detachment will occur at a baseline level even under nongrowth conditions and that detachment expressions which are strictly proportional to growth rate may not be appropriate.
Under growth conditions, which are more representative of active bioremediation scenarios, Taylor and Jafre (1990a) studied transport and growth of an aerobic culture in
T.P. Clement et al . / Journal of Contaminant Hydrology 24 (1997) 269-285 271
soil columns fed with different nutrient concentrations. They described the attachment coefficient with a filtration model developed for porous media beds (Corapcioglu and Haridas, 1985) and estimated the detachment coefficient from empirical models devel- oped for biofilm reactors and granular activated carbon columns (Rittmann, 1982; Speitel and DiGiano, 1987). Taylor and Jaff'e (1990b) developed useful models that can account for changes in porous medium properties due to biofilm accumulation. Through model simulations they demonstrated the importance of modeling attachment and detachment in porous media; however, their models did not improve the state of understanding of these processes. In addition, Taylor and Jaffa's work did not report or analyze effluent cell concentration data.
Lundman (1992) obtained experimental data from short columns (5 cm long by 3.1-cm diameter) filled with glass beads with an average diameter of 1 mm. He performed four aerobic experiments at influent glucose concentrations of 26.0, 19.7, 2.9, and 2.7 rag/1 at a high flow velocity of 7745 cm/day. Peyton et al. (1995) evaluated detachment coefficients for two of these tests by fitting the model-derived substrate profiles to experimental data. An attachment coefficient of 43.2 day 1 was used in this work, although short column residence time made the predicted results relatively insensitive to the attachment rate coefficient. Detachment coefficients were evaluated by fitting a numerical transport model to measured temporal substrate profiles at the column effluent. The model accounted for biomass growth, substrate and biomass transport, and substrate utilization. The conclusion was that simple first-order models in attached biomass can be used to describe detachment processes in porous media, although the first-order detachment coefficient was affected by substrate loading rate.
Many in situ bioremediation systems use anaerobic processes (Semprini et al., 1991; Hooker et al., 1994b), but no one has reported microbial transport data under anoxic conditions. Most microbial transport studies in the literature were performed under non-growth conditions, and only a few investigated actively growing populations under aerobic conditions. Hence, our objective was to investigate bacterial transport with actively growing bacteria in anoxic porous media. To accomplish this objective, we studied nutrient and microbial transport in one-dimensional porous media columns under denitrifying conditions (anoxic). A detailed mathematical model was developed, which included not only advection and dispersion, but also microbial transport and accumula- tion phenomena, to describe the experimental observations. The model determined detachment coefficients by using a nonlinear least-squares procedure to fit the effluent suspended-cell and substrate concentration profiles. These detachment coefficient values are compared with other published values corresponding to a variety of nutrient loading and growth conditions.
2. Materials and methods
2.1. Bacterial culture
The bacterial consortium used in these experiments was grown from a soil sample that was aseptically removed from a test well at the U.S. Department of Energy's
272 T.P. Clement et al. / Journal of Contaminant Hydrology 24 (1997) 269 285
Hanford Site in southeastern Washington state. To help ensure a reproducible inoculum, separate vials of stock culture are maintained in liquid nitrogen. The consortium contains Pseudomonas sp. that can grow under denitrifying conditions and the growth kinetics were established by Peyton (1994). The biomass used in each experiment was grown by adding 100 Ixl of microbial stock to a sterile 250-ml flask containing 200 ml of simulated groundwater medium amended with 1500 mg/ l nitrate and 2000 mg/ l acetate (Jennings, 1994). This culture was incubated aerobically at 27°C on a 125-rpm orbital shaker for 3 days. Aerobic conditions were used to quickly generate biomass for sand column experiments because the microbial species of interest are facultative (Skeen et al., 1994).
2.2. Sand column experiments
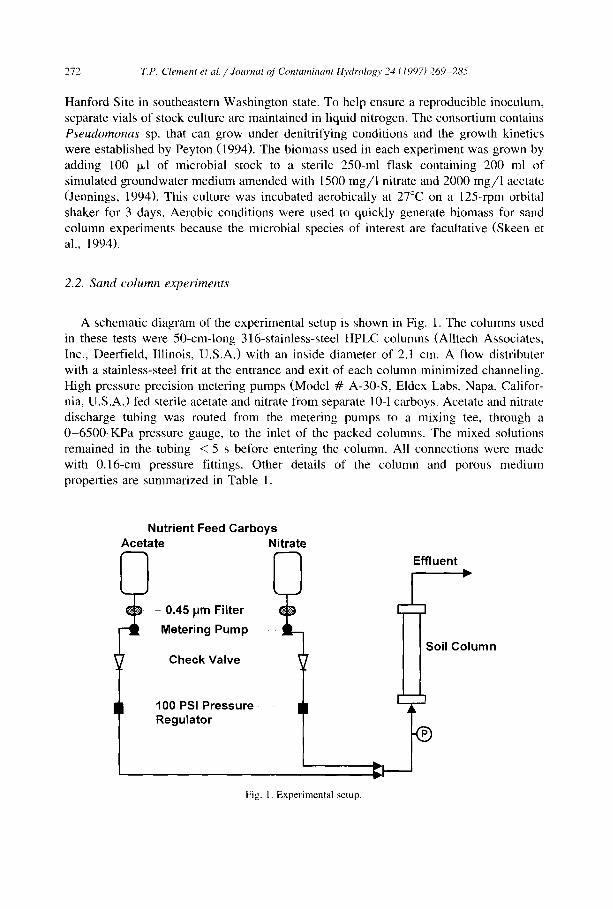
A schematic diagram of the experimental setup is shown in Fig. 1. The columns used in these tests were 50-cm-long 316-stainless-steel HPLC columns (Alltech Associates, Inc., Deerfield, Illinois, U.S.A.) with an inside diameter of 2.1 cm. A flow distributer with a stainless-steel frit at the entrance and exit of each column minimized channeling. High pressure precision metering pumps (Model # A-30-S, Eldex Labs, Napa, Califor- nia, U.S.A.) fed sterile acetate and nitrate from separate 10-1 carboys. Acetate and nitrate discharge tubing was routed from the metering pumps to a mixing tee, through a 0-6500-KPa pressure gauge, to the inlet of the packed columns. The mixed solutions remained in the tubing < 5 s before entering the column. All connections were made with 0.16-cm pressure fittings. Other details of the column and porous medium properties are summarized in Table 1.
Nutrient Feed Carboys Acetate ~
- 0.45 Hm Filter
- Metering Pump
Nitrate
Check Valve
I 100 PSI Pressure Regulator
Fig. 1. Experimental setup.
I Effluent
Soil Column
T.P. Clement et al./ Journal of Contaminant Hydrology 24 (1997) 269-285
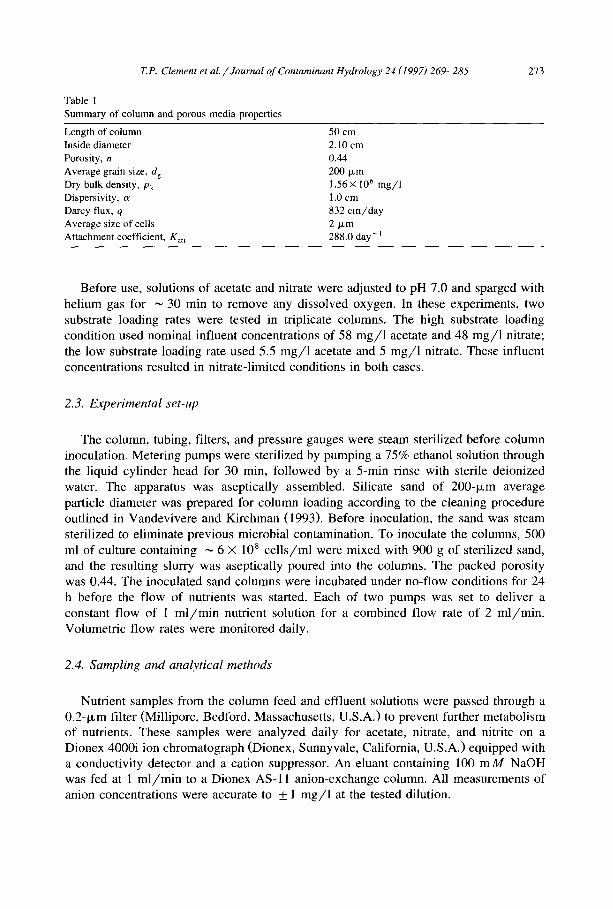
Table 1 Summary of column and porous media properties
273
Length of column 50 cm Inside diameter 2.10 cm Porosity, n 0.44 Average grain size, dg 200 Ixm Dry bulk density, Pk 1.56 X 10 6 mg/l Dispersivity, a 1.0 cm Darcy flux, q 832 cm/day Average size of cells 2 Ixm Attachment coefficient, Kat t 288.0 day- I
Before use, solutions of acetate and nitrate were adjusted to pH 7.0 and sparged with helium gas for ~ 30 rain to remove any dissolved oxygen. In these experiments, two substrate loading rates were tested in triplicate columns. The high substrate loading condition used nominal influent concentrations of 58 m g / 1 acetate and 48 m g / 1 nitrate; the low substrate loading rate used 5.5 m g / l acetate and 5 mg /1 nitrate. These influent concentrations resulted in nitrate-l imited conditions in both cases.
2.3. Experimental set-up
The column, tubing, filters, and pressure gauges were steam sterilized before column inoculation. Metering pumps were sterilized by pumping a 75% ethanol solution through the liquid cylinder head for 30 min, fol lowed by a 5-min rinse with sterile deionized water. The apparatus was aseptically assembled. Silicate sand of 200-1xm average particle diameter was prepared for column loading according to the cleaning procedure outlined in Vandevivere and Kirchman (1993). Before inoculation, the sand was steam sterilized to eliminate previous microbial contamination. To inoculate the columns, 500 ml of culture containing ~ 6 × 10⁸ c e l l s / m l were mixed with 900 g of sterilized sand, and the resulting slurry was aseptically poured into the columns. The packed porosity was 0.44. The inoculated sand columns were incubated under no-flow conditions for 24 h before the flow of nutrients was started. Each of two pumps was set to deliver a constant flow of 1 m l / m i n nutrient solution for a combined flow rate of 2 m l / m i n . Volumetric flow rates were monitored daily.
2.4. Sampling and analytical methods
Nutrient samples from the column feed and effluent solutions were passed through a 0.2-1xm filter (Millipore, Bedford, Massachusetts, U.S.A.) to prevent further metabolism of nutrients. These samples were analyzed daily for acetate, nitrate, and nitrite on a Dionex 4000i ion chromatograph (Dionex, Sunnyvale, California, U.S.A.) equipped with a conductivity detector and a cation suppressor. An eluant containing 100 m M NaOH was fed at 1 m l / m i n to a Dionex AS-11 anion-exchange column. All measurements of anion concentrations were accurate to _+ l m g / 1 at the tested dilution.
274 T.P. Clement et al. / Journal of Contaminant Hydrology 24 (1997) 269-285
The number of colony forming units (CFU) in the liquid effluent was measured daily to quantify the amount of biomass leaving the columns. CFU determination consisted of serial dilutions that were subsequently plated on sterile tryptic soy agar spread plates (Gerhardt, 1981). Colonies formed on the agar were counted after two days. Effluent cell concentrations in CFU were converted to m g / l units using an experimentally deter- mined conversion factor for the microbial consortium (6.2 × 10 9 C F U / m g biomass).
3. Model development
3.1. Modeling ,flow and transport in porous media
In a one-dimensional soil column with constant flow, the mass balance equation for a transported species is written as:
where c is the aqueous-phase macroscopic averaged concentration of the transported species [M L-3]; n is the porosity; o~ is the dispersivity [L]; q is the Darcy flux [M T - 1 ]; and R is the reaction rate that describes the mass of the species reacted per unit bulk volume per unit time [M L -3 T-~]. Assuming constant porosity and dispersivity values, Eq. (1) can be rewritten as:
0c 02c 0c - - = O - t , - - + r (2 ) 3t ~ Oz
where t , = q / n is the pore-liquid velocity [L T-L]; D = e e q / n is the dispersion coefficient [L 2 T i]; and r is the reaction rate that describes the mass of the species reacted per unit liquid volume per unit time [M L -3 T 1]. Variations in porosity values are ignored in this work because numerical simulations which used a variable porosity model presented by Clement et al. (1995a) of column data reported by Zysset et al. (1994) indicated that accounting for porosity changes had little effect on nutrient and biomass profiles in one-dimensional constant flow systems. The simulation experiments of Taylor and Jaff~ (1990b) also show similar results, especially under low substrate loading conditions.
In this study, since nitrite accumulation was experimentally measured to be negligi- ble, we were interested only in modeling the transport of primary electron donor (acetate) and acceptor (nitrate). Transport equations with appropriate rate expressions for nitrate and acetate are written as:
0CN 02CN 0CN ?NXs Pk - - = D O ~ - - V - - - - ? N X " (3)
3t z- 3z ' n
CA ;A = D 0 " - v --?aXe, (4)
Ot z- Oz n
where C N is nitrate concentration [M L 3]; CA is acetate concentration [M L 3]; ?N is the specific utilization rate of nitrate (amount of nitrate consumed per unit biomass per
T.P. Clement et al. / Journal of Contaminant Hydrology 24 (1997) 269-285 275
day [M N Mx 1 T- l ] ) ; ?A is the specific utilization rate of acetate [M A Mx I T - l ] ; Xa is the concentration of biomass in the aqueous phase [M L -3 ]; X, is the mass of microbial cells per unit mass of porous medium solids [M M - 1 ]; and Pk is the bulk density of the porous medium [M L-3 ].
In addition to nutrient concentrations, we are also interested in predicting the growth and accumulation of biomass in the columns. Mass-balance expressions that describe growth and transport of aqueous-phase biomass, and growth and accumulation of solid-phase biomass are expressed as:
OX~ O2X~ OX~ rd~t Pk = D-77T-_2 - u "k Px Xa -- ratt + - - (5)
Ot Oz az n
d X s nGu - - ----- rx Xs -- rdet + - - (6)
dt Pk
where ?x is the specific growth rate, assumed to be the same for both suspended and attached cells IT- l ] ; rat t is the rate at which suspended cells attach to the solid phase (mass of attached cells per unit liquid volume per unit time [M L -3 T-1]); and rue t is the rate at which cells detach from the solid phase (mass of detached cells per unit bulk mass of porous medium solids per unit time [M M - i T - J ]).
Transport model Eqs. (3)-(6) assume a macroscopic approach for modeling biomass in porous media (Corapcioglu and Haridas, 1985; "option A " of Baveye and Valocchi, 1989). This approach is consistent with the macroscopic Darcy-scale analysis used for modeling solute transport in porous media. Moreover, macroscopic estimates of biomass can be experimentally determined; other biomass models, such as the microcolony (Molz et al., 1986) and biofilm approaches (Taylor and Jaff'e, 1990b; Cunningham et al., 1991), require microscale data that are difficult to measure accurately. The present model formulation also assumes that the concentration of nutrients in the solid-phase biomass is equal to the aqueous-phase nutrient concentration. This is equivalent to the fully penetrated biofilm assumption, which ignores mass transfer limitations across attached biomass. Other researchers have found this to be a reasonable approximation for porous media (Taylor and Jaffa, 1990b; Rittmann, 1993).
3.2. M o d e l i n g a t t a c h m e n t a n d d e t a c h m e n t p r o c e s s e s in p o r o u s m e d i a
Attachment and detachment processes that exchange biomass between solid and aqueous phases can be modeled by first-order rate expressions (Peyton et al., 1995):
rat t = Kat t X a (7)
r d e t = K d e t X s (8)
where K~t t is the attachment coefficient [T-I l; and Kde t is the detachment coefficient [T-l] . In this study, the value of the detachment coefficient was estimated through a model-calibration process, as described in Section 3.4.
Attachment coefficients were computed in accordance with the filtration theory for deep bed filters proposed by Tien et al. (1979). Hornberger et al. (1992) and Martin et
276 7".P. Clement et al. / Journal of Contaminant Hydrology 24 (1997) 269-285
al. (1992) found this model to be a reasonable approximation for describing bacterial attachment processes in porous media. Thus, an expression for the attachment coeffi- cient can be written as (Hornberger et al., 1992; Tien et al., 1979):
3(1 - n ) q r I Kat t ~--" (9)
2dg
where q is the Darcy velocity [L T ~ ]; n is the porosity; dg is the porous medium grain diameter [L]; and ~ is the collector efficiency. For the soil columns used in this study, a value of 0.008 for ~7 was computed from the analytical expression given in Tien et al. (1979); the density difference between bacteria and water was neglected. At the derived 7, the calculated value of the attachment coefficient from Eq. (9) is 288.0 day- 1
3.3. Modeling microbial growth kinetics
The kinetics of growth and denitrification by the microbial consortium used in these tests were previously determined (Peyton, 1994). The specific rate of nitrate utilization is described by a Monod-type kinetic relationship:
~N ~ qmax KN + CN KA -~ CA (10)
where qm~x is the maximum specific nitrate utilization rate [M N Mx I T-1]; K N is the half saturation constant for nitrate [M L-3]; and K A is the half saturation constant for acetate [M L 3 ]. The specific rate of acetate utilization and the specific rate of biomass production are described as:
~A = YA/N~N (11)
?x = YX/N?N -- Ka (12)
where YA/N is the yield coefficient for acetate; YX/N is the yield coefficient for cells; and K d is cell decay rate [T ~]. The reaction rates and yield coefficients for the denitrifying consortium are summarized in Table 2. These coefficients were estimated by Hooker et al. (1994a) and Peyton (1994) from batch kinetic data, and the values are consistent the with other reported values (Odencrantz et al., 1990; Semprini et al., 1991; USEPA, 1993).
3.4. Numerical solution procedure
Transport equations (3)-(5) were solved by a fully-implicit, finite-difference proce- dure. The nonlinear terms in the reaction equations were linearized by the Picard iteration procedure, similar to methods reported in Molz et al. (1986) and Widdowson et al. (1988). The resulting tridiagonal system of linear equations was solved by the Thomas algorithm (Press et al., 1992). At each iteration level, the differential equation for attached biomass (Eq. (6)) was solved explicitly by the fourth-order Runge-Kutta method (Press et al., 1992). The nonlinear iterations between the four equations (Eqs.
T.P. Clement et al. / Journal of Contaminant Hydrology 24 (1997) 269-285 277
(3)-(6)) were repeated until, at every node, all the computed concentrations converged within one percent of the previous concentration value. The algorithm typically con- verged within 3 -4 iterations. The accuracy of the solution procedure was tested against an analytical solution and against the results of a reactive transport problem presented in Zysset et al. (1994). The validation procedure was similar to that presented in Clement et al. (1995b). In addition, mass-balance checks for the transported species were performed at every time step to verify the internal consistency of the model results.
During the model calibration process, model simulations were performed for various detachment coefficient and initial biomass values. Calibrated model results were accom- plished by first fitting the nitrate profile by adjusting the initial biomass level, and later fitting the effluent breakthrough cell profile by adjusting the detachment coefficient. The procedure was repeated until best-fit concentration profiles were attained. This sequen- tial, iterative, fitting procedure worked efficiently because the predicted nitrate profiles were not so sensitive to changes in detachment values explored in this study. Model fitting was accomplished by reducing the relative error between calculated and observed profiles using a nonlinear least-squares program NL2SOL (Dennis et al., 1981). All the simulations used constant spatial and temporal steps of 0.5 cm and 0.0001 day, respectively. Selection of these grid sizes was based on P~clet and Courant number constraints (Widdowson et al., 1988). Computations were also done with twice as fine discretization (both space and time) to ensure the influence of discretization on the fitted profiles was negligible.
4. Results and discussions
As shown in Table 2, the estimated value of initial attached biomass concentration was 3 x 10 7 m g / m g soil (corresponding to 1.9 X 10⁶ C F U / g soil). This fitted estimate was based on the observed lag period in the effluent nutrient profiles and represents an initial attached biomass concentration of ~ 0.5% of the total inoculated cells. Experimental data and model calculations of effluent cell concentration profiles were used to evaluate detachment coefficients for both substrate loading conditions. The nonlinear optimization procedure gave detachment coefficients of 0.32 and 0.43 day-1 for the high and low substrate loading cases, respectively.
4.1. High substrate loading columns
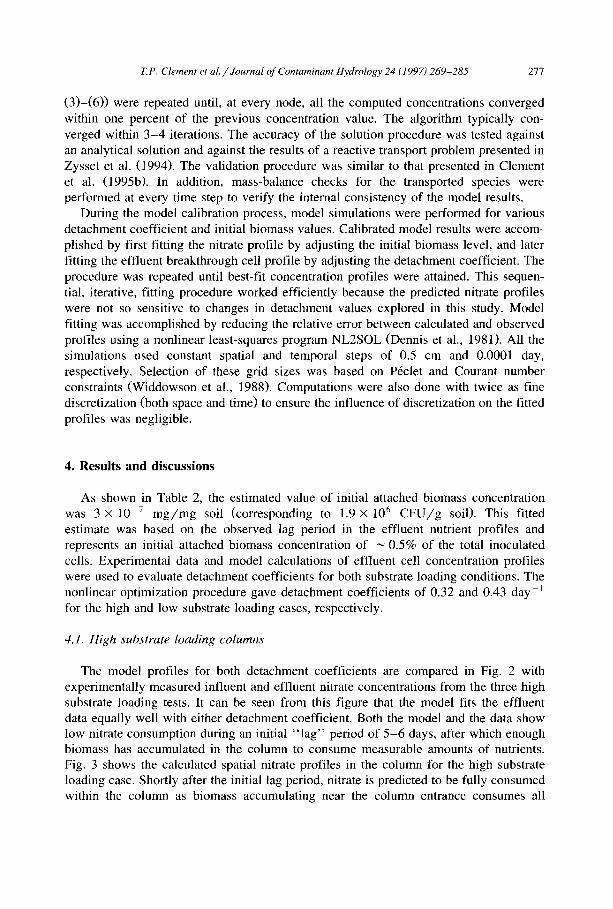
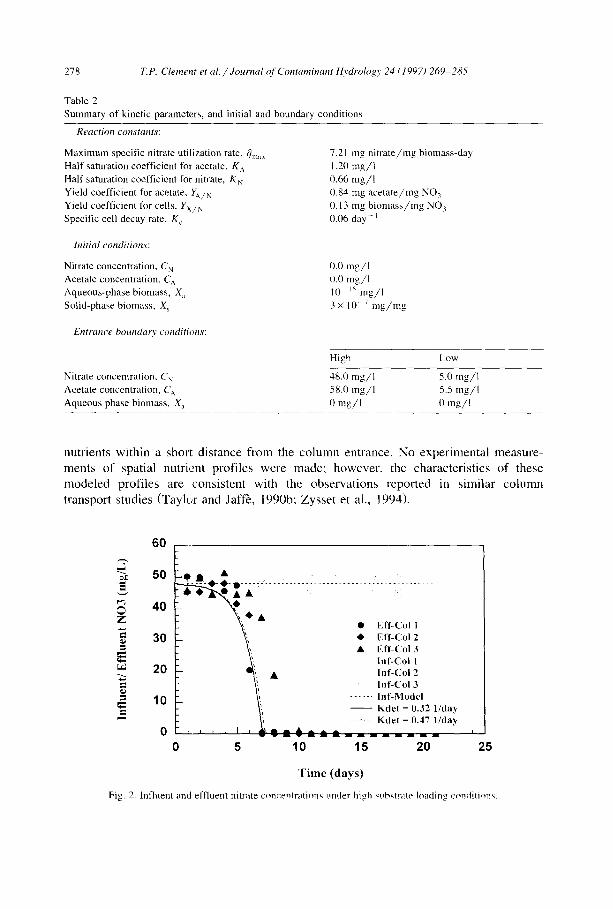
The model profiles for both detachment coefficients are compared in Fig. 2 with experimentally measured influent and effluent nitrate concentrations from the three high substrate loading tests. It can be seen from this figure that the model fits the effluent data equally well with either detachment coefficient. Both the model and the data show low nitrate consumption during an initial " l ag" period of 5 - 6 days, after which enough biomass has accumulated in the column to consume measurable amounts of nutrients. Fig. 3 shows the calculated spatial nitrate profiles in the column for the high substrate loading case. Shortly after the initial lag period, nitrate is predicted to be fully consumed within the column as biomass accumulating near the column entrance consumes all
278 T.P. Clement et al. / Journal of Contaminant Itvdrology 24 (1997) 269 285
Table 2 Summary of kinetic parameters, and initial and boundary conditions
Reaction constants:
Maximum specific nitrate utilization rate, C~m,~ Half saturation coefficient for acetate, K A
Half saturation coefficient for nitrate, K N Yield coefficient for acetate, YA/N Yield coefficient for cells, Yx/N Specific cell decay rate, K d
Initial conditions:
Nitrate concentration, C N Acetate concentration, C A Aqueous-phase biomass, X,~ Solid-phase biomass, X~
Entrance boundary conditions:
Nitrate concentration, C N Acetate concentration, C A Aqueous phase biomass, X a
7.21 mg nitrate/mg biomass-day 1.20 mg/I (/.66 mg/l 0.84 nag acetate/rag NO~ 0.13 mg biomass/mg NO 3 0.06 day - i
0.0 mg/I 0.0 mg/1 10 =5 mg/ I 3×10 v mg/mg
High Low
48.0 mg/l 5.0 mg/l 58.0 lng/l 5.5 mg/I 0 mg/l 0 mg/I
nutrients within a short distance f rom the co lumn entrance. No exper imenta l measure-
ments of spatial nutrient profi les were made; however , the characterist ics o f these
mode led profi les are consis tent with the observat ions reported in s imilar co lumn
transport studies (Taylc>r and Jaff'e, 1990b; Zysse t et al., 1994).
60
. . . . .,W~- . V . D . . . . . . ~ . . . . . . . . . . . . . . . . . . . . . . . . . . . . . . . . . . . . . . . . .
-- -- - * &'\\~'lt • Eff o l l
= 30 -- * Eft-Col 2 - • Eff-Col 3
Inf-Col I 20 • Inf-Col 2
I n f - C o l 3
10 . . . . . . I n f - M o d e l - - K d e t = 0 . 3 2 l/day . . . . . K d e t = 0 . 4 7 I / d a y
0 5 10 15 20 25
T i m e ( d a y s )
Fig. 2. lnfluent and effluent nitrate concentrations under high substrate loading condition'~
T.P. Clement et al. / Journal of Contaminant 14ydrology 24 (1997) 269-285 279
5 0
.-, 40
30 0
20 ¢J
== 0
1 0
T - I ~ - . . . . . . . . .
- . . . . . 5 days %.% ", "-. . . . . . 7 days
• , " - . ........ 10 days I I ' " - - 15 days
\ - . , , , I , '-, . . . . I . . . . . . . I , , , . "
0 10 20 30 40 50
%.
C o l u m n D i s t a n c e ( c m )
Fig. 3. Transient nitrate profiles predicted by the model under high substrate loading conditions
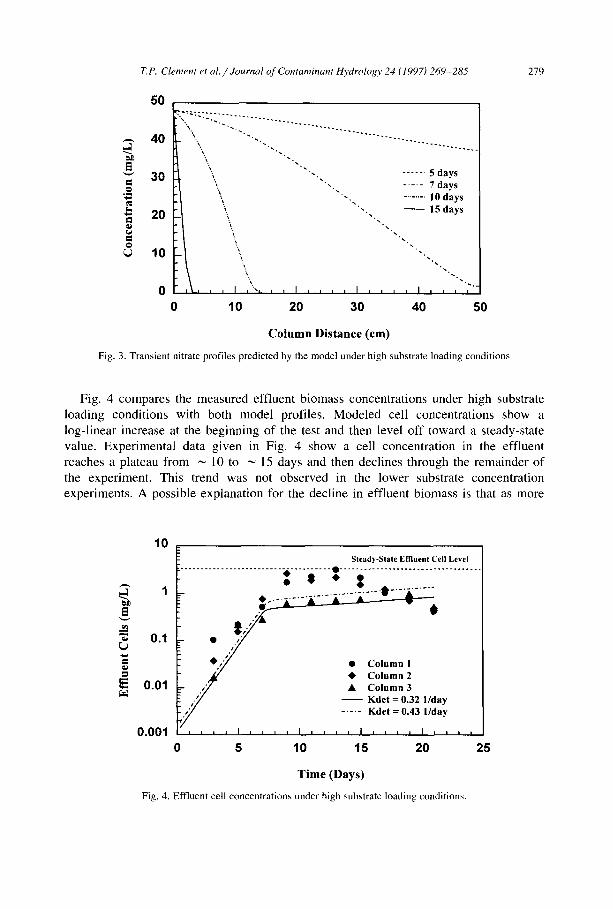
Fig. 4 compares the measured eff luent b iomass concentra t ions under high substrate
loading condi t ions with both mode l profiles. Mode l ed cell concentra t ions show a
log- l inear increase at the beg inn ing of the test and then level o f f toward a steady-state
value. Exper imenta l data g iven in Fig. 4 show a cell concentra t ion in the eff luent
reaches a plateau f rom ~ 10 to ~ 15 days and then decl ines through the remainder o f
the exper iment . This trend was not observed in the lower substrate concentra t ion
exper iments . A possible explanat ion for the decl ine in eff luent b iomass is that as more
1 0
N
"~ 0.1
E OOl
0.001
Steady-State Effluent Cell Level . . . . . . . . . . . . . . . . . . . . . . . . . ~ . . . . . . . . . . • . . . . . . . . . . . . . . . . . . . . . . . . . . . . . . . . . . .
• .... , . . . . ' , . ...
O . , ~ • C o l u m n 1 • C o l u m n 2
. , j / • C o l u m n 3 . / / - - K d e t = 0 .32 1 / d a y
/ - - - K d e t = 0 .43 1 / d a y
, , , , I , , , , I , , , , I . . . . I . . . .
0 5 10 15 20 25
T i m e ( D a y s )
Fig. 4. Effluent cell concentrations under high substrate loading conditions.
280 7".P. Clement et al. / Journal of Contaminant I~vdrology 24 (1997) 269-285
~C
5
0 Z 4
= 3 =.
1 = =.
0
- - i i - O . . . . . . . . . . ? . . . . . . . . . . . . . . . . . . . . . . . . . . . . . . . . . . . . . . .
F " ~ , • Eft-Coil " "\ l~ • Eft- Col2 - "'.~, • Eff Col 3
' \ Inf- Col 1 '.~ Inf- Col 2 ' t Inf- Col 3 ' \ ...... Inf- Model ",~ - - Kdet = 0.43 1/day
l/day . . . . . Kdet = 0.32
0 5 10 15 20 25
Time (day)
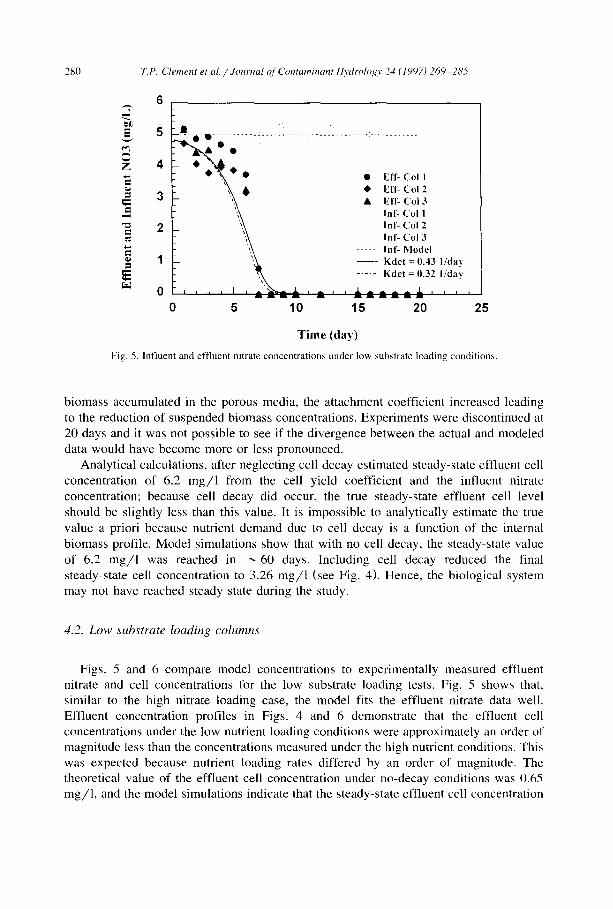
Fig. 5. lnfluent and effluent nitrate concentrations under low substrate loading conditions.
biomass accumulated in the porous media, the attachment coefficient increased leading to the reduction of suspended biomass concentrations. Experiments were discontinued at 20 days and it was not possible to see if the divergence between the actual and modeled data would have become more or less pronounced.
Analyt ical calculations, after neglecting cell decay estimated steady-state effluent cell concentration of 6.2 mg /1 from the cell yield coefficient and the influent nitrate concentration; because cell decay did occur, the true steady-state effluent cell level should be slightly less than this value. It is impossible to analytically estimate the true value a priori because nutrient demand due to cell decay is a function of the internal biomass profile. Model simulations show that with no cell decay, the steady-state value of 6.2 mg /1 was reached in ~ 60 days. Including cell decay reduced the final steady-state cell concentration to 3.26 mg/1 (see Fig. 4). Hence, the biological system may not have reached steady state during the study.
4.2. Low substrate loading columns
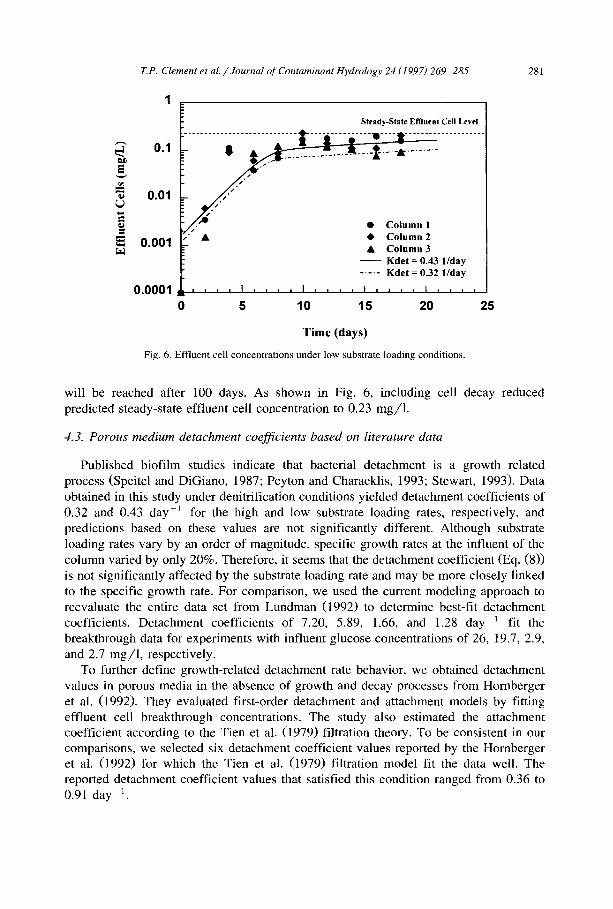
Figs. 5 and 6 compare model concentrations to experimentally measured effiuent nitrate and cell concentrations for the low substrate loading tests. Fig. 5 shows that, similar to the high nitrate loading case, the model fits the effluent nitrate data well. Effluent concentration profiles in Figs. 4 and 6 demonstrate that the effluent cell concentrations under the low nutrient loading conditions were approximately an order of magnitude less than the concentrations measured under the high nutrient conditions. This was expected because nutrient loading rates differed by an order of magnitude. The theoretical value of the effluent cell concentration under no-decay conditions was 0.65 mg/1, and the model simulations indicate that the steady-state effluent cell concentration
T.P. Clement et al. / Journal of Contaminant Hydrology 24 (1997) 269 285 281
0.1
rll "~ 0.01
N 0 . 0 0 1
0.0001
Steady-State Effluent Cell Level
s ° ~ " / !
• Column I • • Column 2
• Column 3 - - Kdet = 0.43 I/day ..... Kdet = 0.32 I/day
m 0 5 10 15 20 25
T i m e ( d a y s )
Fig. 6. Effluent cell concentrations under low substrate loading conditions.
will be reached after 100 days. As shown in Fig. 6, including cell decay reduced predicted steady-state effluent cell concentration to 0.23 mg/1.
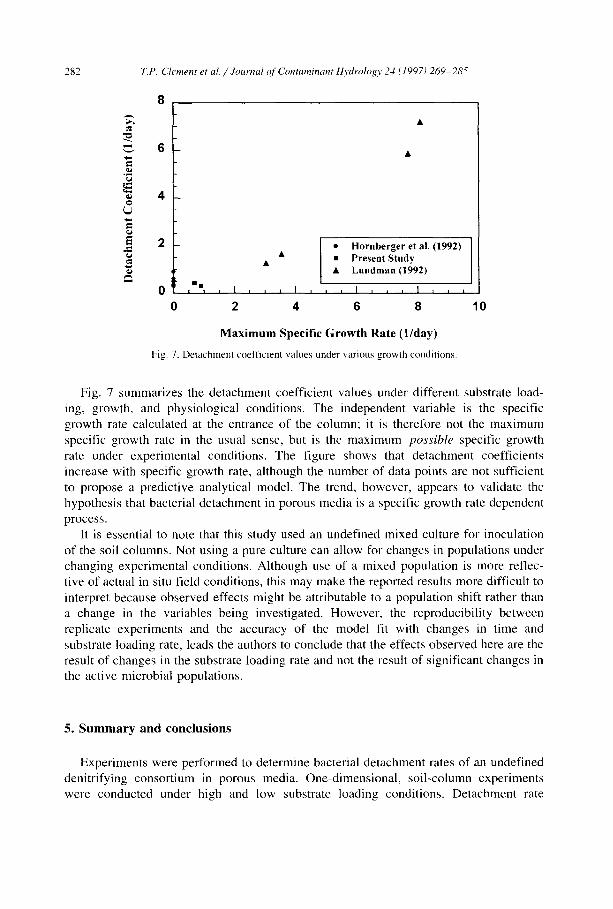
4.3. Porous medium detachment coefficients based on literature data
Published biofilm studies indicate that bacterial detachment is a growth related process (Speitel and DiGiano, 1987; Peyton and Characklis, 1993; Stewart, 1993). Data obtained in this study under denitrification conditions yielded detachment coefficients of 0.32 and 0.43 day 1 for the high and low substrate loading rates, respectively, and predictions based on these values are not significantly different. Although substrate loading rates vary by an order of magnitude, specific growth rates at the influent of the column varied by only 20%. Therefore, it seems that the detachment coefficient (Eq. (8)) is not significantly affected by the substrate loading rate and may be more closely linked to the specific growth rate. For comparison, we used the current modeling approach to reevaluate the entire data set from Lundman (1992) to determine best-fit detachment coefficients. Detachment coefficients of 7.20, 5.89, 1.66, and 1.28 day 1 fit the breakthrough data for experiments with influent glucose concentrations of 26, 19.7, 2.9, and 2.7 mg/1, respectively.
To further define growth-related detachment rate behavior, we obtained detachment values in porous media in the absence of growth and decay processes from Hornberger et al. (1992). They evaluated first-order detachment and attachment models by fitting effluent cell breakthrough concentrations. The study also estimated the attachment coefficient according to the Tien et al. (1979) filtration theory. To be consistent in our comparisons, we selected six detachment coefficient values reported by the Hornberger et al. (1992) for which the Tien et al. (1979) filtration model fit the data well. The reported detachment coefficient values that satisfied this condition ranged from 0.36 to 0.91 day 1.
2 8 2 T.P. Clement et al. / Journal (~[' Contaminant 14vdrology 24 (1997) 269 285
-& 8
6
4
Hornberger et a l . ( 1 9 9 2 )
Present Study • L u n d m a n ( 1 9 9 2 )
i i , , , I , , , I , , , I , , , I , , ,
0 2 4 6 8 10
Maximum Specific Growth Rate (1/day)
Fig. 7. Detachment coefficient values under various growth conditions.
Fig. 7 summarizes the detachment coefficient values under different substrate load- ing, growth, and physiological conditions. The independent variable is the specific growth rate calculated at the entrance of the column; it is therefore not the maximum specific growth rate in the usual sense, but is the maximum possible specific growth rate under experimental conditions. The figure shows that detachment coefficients increase with specific growth rate, although the number of data points are not sufficient to propose a predictive analytical model. The trend, however, appears to validate the hypothesis that bacterial detachment in porous media is a specific growth rate dependent process.
It is essential to note that this study used an undefined mixed culture for inoculation of the soil columns. Not using a pure culture can allow for changes in populations under changing experimental conditions. Although use of a mixed population is more reflec- tive of actual in situ field conditions, this may make the reported results more difficult to interpret because observed effects might be attributable to a population shift rather than a change in the variables being investigated. However, the reproducibility between replicate experiments and the accuracy of the model fit with changes in time and substrate loading rate, leads the authors to conclude that the effects observed here are the result of changes in the substrate loading rate and not the result of significant changes in the active microbial populations.
5. Summary and conclusions
Experiments were performed to determine bacterial detachment rates of an undefined denitrifying consortium in porous media. One-dimensional, soil-column experiments were conducted under high and low substrate loading conditions. Detachment rate
T.P. Clement et al. / Journal of Contaminant ttydrology 24 (1997) 269-285 283
coefficients were est imated by minimizing the differences between measured and model-calculated values for the temporal change in the effluent biomass concentrations. Calculated values were obtained from a numerical transport model that accounted for advection, dispersion, growth, attachment, and detachment processes. Attachment rates were computed by a previously reported analytical expression, and a first-order model successfully described detachment. Detachment coefficient values of 0.32 and 0.43 d a y - l were estimated for the high and low substrate loading experiments, respectively. These values were found to be insignificantly different from one another in fitting experimental data. Comparison of these values with those estimated from published data for aerobically growing organisms shows that the denitrifying consort ium had much lower detachment rate coefficients. In addition, the comparisons reveal a proportionali ty relationship between the first-order detachment rate coefficient and the characteristic growth rate in a given system. These results supports the hypothesis that, similar to reactor-grown biofilms, detachment in porous media is growth dependent. However, reliable predictive models for detachment in porous media require more data. Presently, detachment coefficients can only be determined, case by case, through experimental studies and modeling efforts. Our current research efforts focus on further elucidation of growth-dependent detachment behavior based on the integration of bulk liquid substrate and biomass measurements with direct micro-scale biomass observations.
Acknowledgements
Special thanks to Michael J. Truex and Brian S. Hooker for their invaluable input and review of the experiments and modell ing research. Pacific Northwest Laboratory is operated for the U.S. Department of Energy by Battelle Memorial Institute under Contract DE-AC06-76RLO 1830. This work was supported by the U.S. Department of Energy Office of Technology Development from the Plumes Focus Area. Dr. Clement was supported by the Associated Western Universities, Inc., Northwest Division under grant DE-FG06-89ER-7522 with the U.S. Department of Energy. The portion of this work conducted at Washington State University was supported by a contract from the Pacific Northwest Laboratory.
References
Barker, J.F., Patrick, G.C. and Major, D., 1987. Natural attenuation of aromatic hydrocarbons in a shallow sand aquifer. Ground Water Monit. Rev., 7(1): 64-71.
Baveye, P. and Valocchi, V.A., 1989. An evaluation of mathematical models of the transport of biologically reacting solutes in saturated soils and aquifers. Water Resour. Res., 25: 1413-1421.
Borden, R.C., 1994. Natural bioremediation of hydrocarbon-contaminated ground water. In: Handbook of Bioremediation. CRC Press, Boca Raton, FL, pp. 177-199.
Clement, T.P., Hooker, B.S. and Skeen, R.S., 1995a. Macroscopic models for predicting changes in saturated porous media properties caused by microbial growth. Ground Water (in press).
Clement, T.P., Hooker, B.S. and Skeen, R.S., 1995b. Modeling biologically reactive transport in porous media. Proc. Int. Conf. on Mathematics and Computations, Reactor Physics, and Environmental Analyses, Portland, OR, 1: 192-201.
284 T.P. Clement et a l . / Journal of Contaminant Hydrology 24 (1997) 269-285
Corapcioglu, M.Y. and Haridas, A., 1985. Microbial transport in soils and groundwater: A numerical model. Adv. Water Resour., 8:188 200.
Cunningham, A.B. and Wanner, O., 1993. Modeling microbial processes in porous media with application to biotransformation. Proc. Int. Symp. on Hydrological, Chemical and Biological Processes of Transformation and Transport of Contaminants in Aquatic Environments, Rostov-on-Don.
Cunningham, A.B., Characklis, W.G., Abedeen, R., and Crawtord, D., 1991. Influence of biofilm accumula- tion on porous media hydrodynamics. Environ. Sci. Technol., 25: 1305-1310.
Dennis, J.E., Gay, D.M. and Welsh, R.E., 1981. NL2SOL An adaptive nonlinear least-square algorithm. ACM Trans. Math. Software, 7: 369-383.
Fontes, D., Mills, A.L., Hornberger, G.M. and Herman, J.S., 1991. Physical and chemical factors influencing transport of microorganisms through porous media. Appl. Environ. Microbiol., 57:2473 2481.
Gerhardt, P., 1981. Manual of Methods for General Bacteriology. Am. Soc. Microbiol., Washington, DC. Hooker, B.S., Skeen, R.S. and Petersen, J.N., 1994a. Biological destruction of CCI 4, Part 2: Kinetic modeling.
Biotechnol. Bioeng., 44:211-218. Hooker, B.S., Skeen, R.S., Truex, M.J. and Peyton, B.M., 1994b. A demonstration of in situ bioremediation of
CCI 4 at the Hanford site. Proc. 33rd Hanford Symp. on Health and the Environment, Richtand, WA. Hornberger, G., Mills, A.L. and Herman, J.S., 1992. Bacterial transport in porous media: Evaluation of a
model using laboratory observations. Water Resour. Res., 28(3): 915-938. Jennings, D.A., 1994. Microbial transport in porous media. M.S. Thesis, Washington State University,
Pullman, WA. Lundman, R.S., 1992. Transport of substrate and biomass in a packed bed reactor. M.S. Thesis, Montana State
University, Bozeman, MT. MacIntyre, W.G., Boggs, M., Antworth, C.P. and Stauffer, T.B., 1993. Degradation kinetics of aromatic
organic solutes introduced into a heterogeneous aquifer. Water Resour. Res., 29(12): 4045 4051. Martin, R.E., Bouwer, E.J. and Hanna, L.M., 1992. Application of clean-bed filtration theory to bacterial
deposition in porous media. Environ. Sci. Eng., 26:1053 1058. Molz, F.J., Widdowson, M.A. and L. Benefield, L., 1986. Simulation of microbial growth dynamics coupled to
nutrient and oxygen transport in porous media. Water Resour. Res., 22: 1207-1216. Odencrantz, J.E., Bae, W., Valocchi, A.J. and Rittmann, B.E., 1990. Stimulation of biologically active zones
(BAZ's) in porous media by electron-acceptor injection. J. Contam. Hydrol., 6: 37-52. Peyton, B.M., 1994. 100 Area groundwater biodenitrification bench scale treatability study - - Final report.
Westinghouse Hanford Co., Richland, WA, Rep. WHC-SD-EN-ES-043. Peyton, B.M. and Characklis, W.G., 1993. A statistical analysis of the effects of substrate utilization and shear
stress on the kinetics of biofilm detachment. Biotechnol. Bioeng., 41: 728-735. Peyton, B.M., Skeen, R.S., Hooker, B.S., Lundman, R.W. and Cunningham, A.B., 1995. Evaluation of
bacterial detachment rates in porous media. Appl. Biochem. Biotechnol., 51: 785-797. Press, W.H., Teukolsky, S.A., Vetterling, W.T. and Flannery, B.P., 1992. Numerical Recipes in FORTRAN.
Cambridge University Press, Cambridge. Rittmann, B.E., 1982. The effect of shear stress on biofihn loss rate. Biotechnol. Bioeng., 24: 501. Rittmann, B.E., 1993. The significance of biofilms in porous media. Water Resour. Res.. 29: 2195-22(12. Semprini, L., Hopkins, G.D., Janssen, D.B., Lang, M., Roberts, P.V. and McCarty, P.L., 1991. In-situ
biotransfurmation of carbon tetrachloride under anoxic conditions. Environ. Prof. Agency, Wasghington, DC, Rep. EPA/2-90/060.
Skeen, R.S., Amos, K.S. and Petersen, J.N., 1994. Influence of nitrate concentration on carbon tetrachloride transformation by a denitrifying microbial consortium. Water Res., 28(12): 2433 2438.
Speitel, G.E. and DiGiano, F.A., 1987. Biofilm shearing under dynamic conditions. Proc. Am. Soc. Civ. Eng., J. Environ. Eng. Div., 113(3): 464 475.
Stewart, P.S., 1993. A model of biofilm detachment. Biotechol. Bioeng., 41: 111-117. Tan, Y., Gannon, J.T., Baveye, P. and Alexander, M., 1994. Transport of bacteria in an aquiter sand:
Experimental and model simulations. Water Resour. Res., 30(12): 3243 3252. Taylor, S.W. and JafFe, P.R., 1990a. Biofilm growth and the related changes in the physical properties of a
porous medium, 1. Experimental investigations. Water Resour. Res., 26: 2153-2159. Taylor, S.W. and JaflO, P.R., 1990b. Substrate and biomass transport in a porous medium. Water Resour. Res.,
26:2181 2194.
T.P. Clement et al . / Journal of Contaminant Itydrology 24 (1997) 269-285 285
Taylor, S.W., Milly, P.C.D. and Jaff, P.R., 1990. Biofilm growth and the related changes in the physical properties of a porous medium, 2. Permeability. Water Resour. Res., 26: 2161-2169.
Tien, C., Turian, R.M. and Pandse, H., 1979. Simulation of the dynamics of deep bed filters. AIChE (Am. Inst. Chem. Eng.) J., 25: 385-395.
USEPA (U.S. Environmental Protection Agency), 1993. Manual - - Nitrogen control. U.S. Environ. Prot. Agency, Washington, D.C., E P A / 6 2 5 / R - 9 3 / 0 1 0 .
USNRC (U.S. National Research Council), 1992. In situ remediation - - When does it work? U.S. Natl. Res. Counc., Washington, DC.
Vandevivere, P. and Kirchman, D., 1993. Attachment stimulates exopolysaccharide synthesis by a bacterium. Appl. Environ. Microbiol., 59: 3280-3286.
Widdowson, M.A., Molz, F.J. and Benefield, L.D., 1988. A numerical transport model lbr oxygen- and nitrate-based respiration linked to substrate and nutrient availability in porous media. Water Resour. Res., 24(9): 1553-1565.
Zysset, A., Stauffer, F. and Dracos, T., 1994. Modeling reactive groundwater transport governed by biodegradation. Water Resour. Res., 30(8): 2433-2434.