microbial biomass, n mineralization and nitrification, enzyme activities, and microbial community...
TRANSCRIPT
Abstract Understanding the chronological
changes in soil microbial and biochemical prop-
erties of tea orchard ecosystems after wasteland
has been reclaimed is important from ecological,
environmental, and management perspectives. In
this study, we determined microbial biomass, net
N mineralization, and nitrification, enzyme
(invertase, urease, proteinase, and acid phospha-
tase) activities, microbial community diversity
assessed by denaturing gradient gel electropho-
resis (DGGE) of 16S rDNA polymerase chain
reaction (PCR) products, and related ecological
factors in three tea orchard systems (8-, 50-, and
90-year-old tea orchards), adjacent wasteland and
90-year-old forest. Soil microbial biomass C
(Cmic) and activity, i.e., soil basal respiration
(Rmic), microbial biomass C as a percent of soil
organic C (Cmic/Corg), N mineralization, invert-
ase, urease, proteinase, and acid phosphatase,
significantly increased after wasteland was re-
claimed; however, with the succeeding develop-
ment of tea orchard ecosystems, a decreasing
trend from the 50- to 90-year-old tea orchard
became apparent. Soil net nitrification showed an
increasing trend from the 8- to 50-year-old tea
orchard and then a decreasing trend from the 50-
to 90-year-old tea orchard, and was significantly
higher in the tea orchards compared to the
wasteland and forest. Urea application signifi-
cantly stimulated soil net nitrification, indicating
nitrogen fertilizer application may be an impor-
tant factor leading to high-nitrification rates in tea
orchard soils. The Shannon’s diversity index (H)
and richness (S) based on DGGE profiles of 16S
rRNA genes were obviously lower in all three tea
orchards than those in the wasteland; neverthe-
less, they were significantly higher in all three tea
orchards than those in the forest. As for the three
tea orchard soils, comparatively higher commu-
nity diversity was found in the 50-year-old tea
orchard.
Keywords Microbial biomass Æ Mineralization ÆNitrification Æ Enzyme activities Æ 16S rDNA-
DGGE Æ Tea orchard soil
Introduction
Tea (Camellia sinensis) is an important economic
crop and is planted widely on acid red soils in the
tropical and subtropical zones in China. To im-
prove yield and quality of tea leaves, nitrogen
fertilizer was applied to tea orchards and its use
has increased year after year. However, heavy
D. Xue Æ H. Yao (&) Æ C. HuangDepartment of Soil Science, College ofEnvironmental and Resource Sciences, ZhejiangUniversity, Huajiachi Campus, Hangzhou 310029,Chinae-mail: [email protected]
Plant Soil (2006) 288:319–331
DOI 10.1007/s11104-006-9123-2
123
ORIGINAL PAPER
Microbial Biomass, N Mineralization and Nitrification,Enzyme Activities, and Microbial Community Diversityin Tea Orchard Soils
Dong Xue Æ Huaiying Yao Æ Changyong Huang
Received: 27 February 2006 / Accepted: 1 September 2006 / Published online: 27 September 2006� Springer Science+Business Media B.V. 2006
nitrogen fertilizer application stimulates primary
productivity of tea orchards and, at the same
time, also causes tea orchard soil acidification
(Konishi 1991; Chenery 1955; Tachibana et al.
1995) and affects nitrification rates (Chantigny
et al. 1996) with subsequent environmental im-
pacts such as nitrate leaching to groundwater and
release of greenhouse gases into the atmosphere
(Tokuda and Hayatsu 2001, 2004). In addition,
long-term tea cultivation practices can result in
Al, hydroxybenzene accumulation in soil ecosys-
tems due to the input of tea leaf litter, root exu-
dates and pH decrease (Nioh et al. 1993; Yao
et al. 2006).
Soil microorganisms play a crucial role in the
cycling of almost all major plant nutrients and
the energy flow of either natural or anthropo-
genically altered soils (Smith and Paul 1990).
Population size and community structure of soil
microorganisms are sensitive to changes in soil
chemical properties (Bauhus and Khanna 1994;
Pansombat et al. 1997; Tokuda and Hayatsu
2002). Soil microbial biomass (Cmic) is both a
labile nutrient pool and an agent of transfor-
mation and cycling of organic matter and plant
nutrients in soils; so, it is one of the most
important microbiological properties. Several
studies indicated Cmic responds more rapidly to
changes resulting from forest management
activities than soil organic matter and, conse-
quently, may be an early and sensitive indicator
of soil quality change (Wolters and Joergensen
1991; Sparling 1992; Bosatta and Agren 1993).
The proportion of microbial biomass C relative
to soil organic C (Cmic/Corg ) has been used as
an indicator for C availability (Anderson and
Domsch 1986b; Insam and Domsch 1988; Yan
et al. 2003) and can provide an effective early
warning of the deterioration of soil quality
(Powlson et al. 1987; Wardle 1992). Soil basal
respiration mainly comes from microbial respi-
ration, which is the major product of aerobic
catabolic processes in the C cycle, and is used as
an indicator of total soil microbial activity. The
metabolic quotient (qCO2), which is the ratio of
basal respiration to microbial biomass, was used
in several investigations as an ecophysiological
measure for ecosystem succession or acid stress
(Insam 1990; Anderson and Domsch 1993).
Several studies (Anderson and Domsch 1993;
Wardle and Ghani 1995) demonstrated higher
values of qCO2 under unfavorable conditions
rather than favorable conditions.
Soil enzymes are present in important cycles,
such as carbon (invertase), nitrogen (urease
and protease), and phosphorus (phosphatase)
cycles. Soil enzyme activities are used as indi-
ces of microbial activity (Bergstrom et al. 1998)
and react quickly to environment change
(Sparling 1997). Net N mineralization and net
nitrification have frequently been used to assess
the ability of soils to supply N in forest eco-
systems and are increasingly being used as
indicators of other important ecosystem pro-
cesses and ecosystem susceptibility to degrada-
tion (Aber et al. 1989).
Soil microbial diversity is a crucial measure
of sustainable soil ecosystems. Tea orchard soils
are usually managed as a monoculture, which
may result in reduced soil microbial diversity.
However, little information is available about
the microbial diversity in tea orchard soil eco-
systems. New molecular techniques, targeting
small subunit rRNA sequences by PCR ampli-
fication, coupled with the rDNA-fragment
analyses by denaturing gradient gel electro-
phoresis (DGGE) (Krave et al. 2002; Rønn
et al. 2002), have recently been developed for
rapidly studying soil microbial diversity. DNA
from the community of soil microorganisms is
amplified using polymerase chain reaction
(PCR), and the fragments are separated in a
gel matrix based on length or sequence poly-
morphism to produce a visual fingerprint of the
microbial community.
Tea orchard ecosystems of different ages rep-
resent a practical system, which can evaluate
temporal changes in soil microbiological and
biochemical properties. Inclusion of adjacent
wasteland, from which tea orchards and forests
were constructed, would facilitate assessing eco-
logical sustainability of the tea orchard ecosystem
and the relative importance of tea orchard man-
agement versus land-use changes in soil microbial
community structure. Our objective was to eval-
uate the changes in soil microbial biomass,
activity, and community diversity given tea orch-
ard age and land-use history.
320 Plant Soil (2006) 288:319–331
123
Materials And Methods
Site description
Soil samples for the study were collected from the
Meijiawu tea area (30�11¢N, 120�05¢E), one of the
original regions of Longjing Tea production, lo-
cated in the West Lake district of Hangzhou,
Zhejiang Province in Southeast China, which is
famous for its Longjing Tea. The area is charac-
terized by a subtropical wet monsoon climate with
mean annual temperatures of 15�C and mean an-
nual rainfall of about 1,500 mm. To assess the
effect of tea orchard age on soil biochemistry and
microbial properties, three tea orchards were se-
lected as study sites. The tea orchards were con-
structed on wasteland in 1914, 1954, and 1996 and
were 90, 50, and 8 years old, respectively, when
soil samples were taken. Each tea orchard was
made up of many plots separated by a foot path.
All tea orchard soils received two or three appli-
cations of N per year, averaging ~450 kg N ha–1
year–1. To evaluate soil biochemistry and micro-
bial properties as a function of land-use change
and management practice, neighboring wasteland
and forest were also chosen as study sites. The
wasteland in this red soil area was covered with
sparse grasses. The 90-year-old forest, established
on wasteland in 1914, was a mixed-conifer forest.
All soils investigated were classified as red soils by
the China Classification System (Ultisols in US
soil taxonomy) and were derived from the same
parent material, namely quartzose sandstone int-
erbedded with shale.
Sample collection and preparation
Soils were collected from three sampling plots
randomly chosen within the 8-year-old tea orch-
ard, 50-year-old tea orchard, 90-year-old tea
orchard, wasteland, and 90-year-old forest in
September 2004. Twenty cores (5 cm diame-
ter · 20 cm length) were taken from each sam-
pling plot and mixed.
The 15 bulked samples were transported on ice
to the laboratory where they were sieved through
a 2-mm mesh to remove plant debris and soil
fauna. Each of the 15 bulked samples was sepa-
rated into three portions. The first portion was air
dried for chemical analysis except that mineral-N
was immediately analyzed. The second portion
was stored at 4�C for microbiological analyses.
The third portion was stored at –20�C until DNA
extractions could be performed.
Soil chemical analysis
Soil pH was measured by a combination glass
electrode (soil : water, 1:2.5). Total nitrogen was
determined by Kjeldahl digestion (Keeney and
Nelson 1982) and quantified using a continuous
flow analyzer (Skalar, Delft, The Netherlands);
and the total Organic C was determined by di-
chromate oxidation (Nelson and Sommers 1982).
Available phosphorus analysis was undertaken by
the method used by Olsen and Sommers (1982).
Inorganic N (NH4+–N and NO3
- –N) was extracted
with 2 M KCl by shaking (1 h, 200 rpm) and fil-
tering through a 0.45 lm polysulfone membrane.
The KCl-extracted N was determined colorimet-
rically in a continuous flow analyzer (Skalar).
Microbial biomass and basal respiration
Microbial biomass C (Cmic) was determined by
the chloroform fumigation–extraction method
(Vance et al. 1987). The K2SO4-extracted C of
both fumigated and unfumigated samples was
analyzed using a total organic C analyzer (Shim-
azu, TOC–500, Chiba, Japan), and a KEC value of
0.45 was used to convert the measured flush of C
to Cmic (Yao et al. 2003). Basal respiration (Rmic)
was determined by measuring CO2 evolution.
Twenty gram (oven-dry basis) of field-moist soil
was incubated in 250 ml airtight glass vessels at
25�C for 1 day. The CO2 produced from the soil
was absorbed in NaOH and determined by titra-
tion with HCl.
The metabolic quotient (qCO2) is defined as
the ratio of basal respiration (Rmic) to microbial
biomass (Cmic), i.e., the amount of CO2–C pro-
duced per unit of microbial biomass carbon
(Anderson and Domsch 1986a).
Net N mineralization and nitrification
A 45-day incubation experiment was carried out
to determine net N mineralization and nitrifica-
Plant Soil (2006) 288:319–331 321
123
tion. Soil samples pre-incubated at room tem-
perature for 1 week were put in sterile polyeth-
yleneglycol bottles (500 ml) and adjusted to the
moisture content of 45% water holding capacity,
and incubated under constant temperature of
25�C and relative humidity of 95%. To avoid loss
of water, all bottles were tightly closed with caps,
but briefly opened once every three days to en-
sure aerobic conditions. Three replicate samples
were extracted with 2 M KCl at day 0, 5, 15, 35,
and 45 of the incubation period. The KCl extracts
were used directly in chemical analysis for inor-
ganic N (NH4+–N and NO3
- –N). Soil inorganic N
on day 0 was determined on pre-incubated soils.
Net soil N mineralization was calculated by sub-
tracting day 0 inorganic N from that measured at
the end of the incubation period. Net nitrification
was calculated in the same manner. At the same
time, fertilizer (400 mg urea-N kg–1 soil) was ap-
plied to assess the effects of nitrogen fertilizer
application on N mineralization and nitrification.
Enzyme activities
Most enzymes are also contained in plant roots.
Therefore, all visible plant fragments were care-
fully removed from the soil sample prior to the
enzyme assays. Enzyme activities were deter-
mined in triplicate field moist samples and are
reported on a dry weight basis.
Invertase activity was determined with sucrose
as substrate; reducing sugars were analyzed as
described by Schinner and von Mersi (1990).
Urease activity was determined according to
Gianfreda et al. (1994) where the product, NH4+,
was measured colorimetrically using the indo-
phenol blue method (Keeney and Nelson 1982).
Protease activity (casein-protease) was assayed
according to the method used by Hamm and Fe-
ger (1996). The calibration was done according to
tyrosine standards. Acid phosphatase activity was
assayed by Hoffman’s method (Alef and Nanni-
pieri 1995).
DNA Extraction, PCR, and DGGE
DNA extraction was based on the method of
Zhou et al. (1996) by bead-beating with slight
modifications. The crude DNA was dissolved in
100 ll of TE (10 mM Tris–HCl; 1 mM EDTA;
pH 8.0) and purified by using Sephadex G–200
(New Haven, CT, USA), as described previously
by Cahyani et al. (2003), based on the method
used by Jackson et al. (1997). To assess DNA
yield and quality (average molecular size), the
soil DNA was run on 0.8% (w/v) agarose gels
with a molecular size marker (1-kb ladder) as the
reference. DNA purity was assessed using ampl-
ifiability by PCR as the criterion.
The universal bacterial primers, PRBA338f
and PRUN518r, located at the V3 region of the
16S rRNA genes of bacterioplankton (Øvreas
et al. 1997), were used to amplify the variable V3
region of 16S rDNA. A GC-rich clamp attached
to the forward primer prevented the complete
melting of the PCR products during subsequent
separation in DGGE. PCR mixtures were pre-
pared with 1 ll purified DNA template (10 ng),
5 ll 10 · PCR buffer, 2.25 mM MgCl2, 0.8 mM
dNTPs, 0.5 lM of each primer, and 2.5 U Taq
DNA polymerase, and sterile filtered milliQ wa-
ter to a final volume of 50 ll. The PCR cycles
included a 4 min initial denaturation at 94�C,
30 cycles at 94�C for 1 min, 55�C for 30 s, 72�C
for 1 min, followed by 7 min at 72�C for final
extension, and, finally, the PCR samples were
held at 4�C until removal from the thermal cycler.
Denaturing gradient gel electrophoresis was
performed with the DcodeTM
Universal Mutation
Detection System (Bio-Rad Laboratories, Her-
cules, CA, USA). PCR products were loaded
onto a 10% (w/v) polyacrylamide gel with a 35–
60% denaturing gradient, where 100% denatur-
ant contains 7.0 M urea and 40% deionized
formamide. The electrophoresis was run at 70 V
for 16 h at 60�C in 1 · TAE buffer (40 mM Tris
[pH 7.4], 20 mM sodium acetate, 1 mM EDTA).
After electrophoresis, the gel was stained using a
silver staining procedure (Bassam et al. 1991) and
visualized with a Bio-Rad Gel Doc documenta-
tion system.
Statistics
All values reported are the arithmetic means of the
three determinations expressed on an oven-dried
soil basis (105�C). Statistical procedures, except
DGGE gel imaging, were carried out with the
322 Plant Soil (2006) 288:319–331
123
software package SPSS for Windows. Means, least
significant differences (LSD) of 5% level, were
calculated by a one-way ANOVA. Clustering
analysis was performed by hierarchical cluster.
Bio-Rad’s Quantity One� software, used for
DGGE gel image acquisition, was also employed
for analysis. Following removal of background
intensity from lanes, the software performs a
density profile through lanes, detects individual
bands, and matches bands occupying the same
position in different lanes. The genetic diversity
of soil microbial communities was analyzed by
Richness (S), Shannon indices (H), and Evenness
(EH) methods according to the following equa-
tions (Zak et al. 1994).
H ¼ �Xs
i¼1
pi ln pi
EH ¼ H=Hmax ¼ H= ln S
Here pi is the ratio between specific band
intensity and total intensity of all bands in a lane
sample and S is the total number of bands in each
lane sample.
Results
Soil chemical properties
The pH of the tea orchard soils decreased grad-
ually with increasing age after wasteland was re-
claimed as tea orchard (Table 1). The pH in the
90-year-old tea orchard was even lower than that
in the 90-year-old forest.
Soil C and N in the 8-year-old tea orchard were
1.88 and 1.59 times higher than those of the
wasteland, respectively. Both soil C and N accu-
mulation increased with increasing tea orchard
age. Soil N in the 90-year-old tea orchard was
significantly (p < 0.05) higher than that in the 90-
year-old forest. Although no significant difference
concerning soil organic C was observed between
the 90-year-old tea orchard and the 90-year-old
forest, the soil C to N ratio in the 90-year-old tea
orchard was lower than that in the 90-year-old
forest.
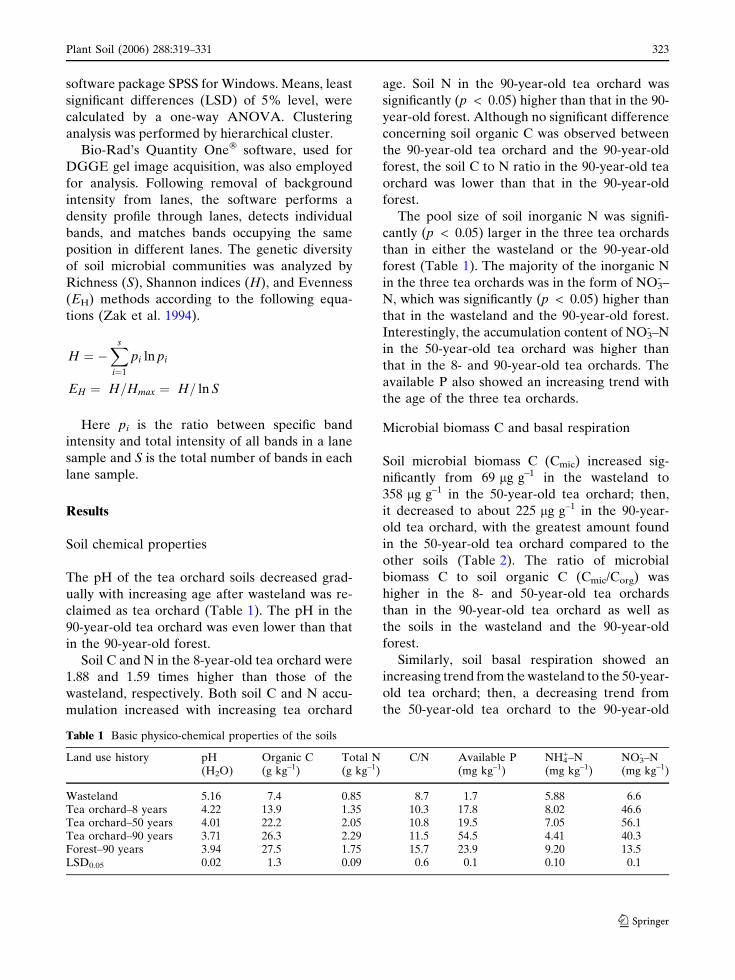
The pool size of soil inorganic N was signifi-
cantly (p < 0.05) larger in the three tea orchards
than in either the wasteland or the 90-year-old
forest (Table 1). The majority of the inorganic N
in the three tea orchards was in the form of NO3- –
N, which was significantly (p < 0.05) higher than
that in the wasteland and the 90-year-old forest.
Interestingly, the accumulation content of NO3- –N
in the 50-year-old tea orchard was higher than
that in the 8- and 90-year-old tea orchards. The
available P also showed an increasing trend with
the age of the three tea orchards.
Microbial biomass C and basal respiration
Soil microbial biomass C (Cmic) increased sig-
nificantly from 69 lg g–1 in the wasteland to
358 lg g–1 in the 50-year-old tea orchard; then,
it decreased to about 225 lg g–1 in the 90-year-
old tea orchard, with the greatest amount found
in the 50-year-old tea orchard compared to the
other soils (Table 2). The ratio of microbial
biomass C to soil organic C (Cmic/Corg) was
higher in the 8- and 50-year-old tea orchards
than in the 90-year-old tea orchard as well as
the soils in the wasteland and the 90-year-old
forest.
Similarly, soil basal respiration showed an
increasing trend from the wasteland to the 50-year-
old tea orchard; then, a decreasing trend from
the 50-year-old tea orchard to the 90-year-old
Table 1 Basic physico-chemical properties of the soils
Land use history pH(H2O)
Organic C(g kg–1)
Total N(g kg–1)
C/N Available P(mg kg–1)
NH4+–N
(mg kg–1)NO3
- –N(mg kg–1)
Wasteland 5.16 7.4 0.85 8.7 1.7 5.88 6.6Tea orchard–8 years 4.22 13.9 1.35 10.3 17.8 8.02 46.6Tea orchard–50 years 4.01 22.2 2.05 10.8 19.5 7.05 56.1Tea orchard–90 years 3.71 26.3 2.29 11.5 54.5 4.41 40.3Forest–90 years 3.94 27.5 1.75 15.7 23.9 9.20 13.5LSD0.05 0.02 1.3 0.09 0.6 0.1 0.10 0.1
Plant Soil (2006) 288:319–331 323
123
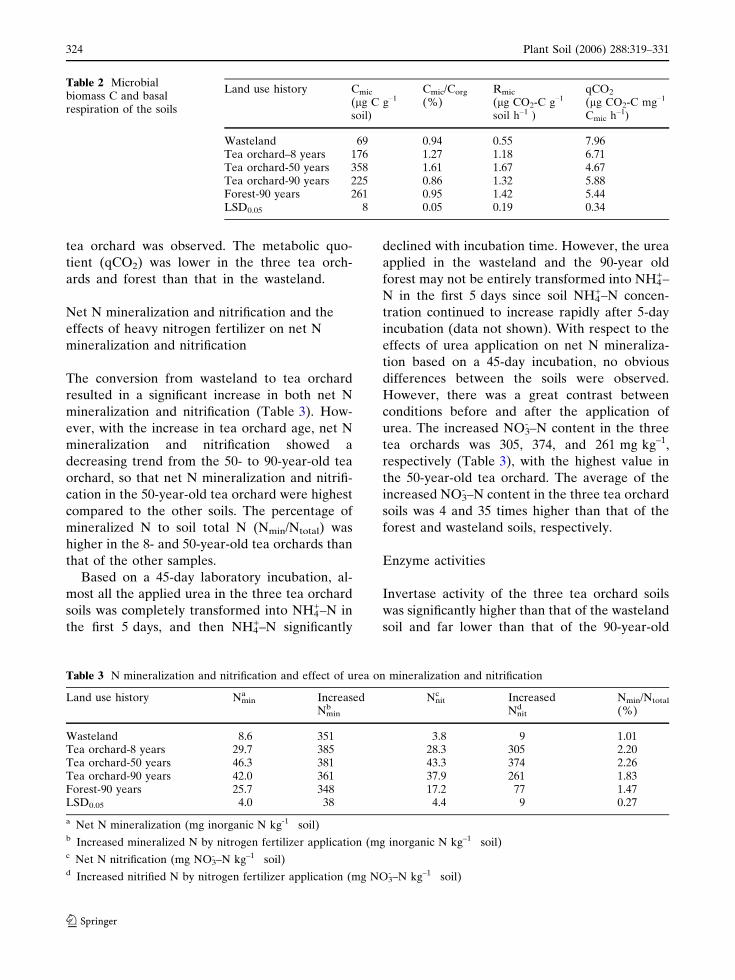
tea orchard was observed. The metabolic quo-
tient (qCO2) was lower in the three tea orch-
ards and forest than that in the wasteland.
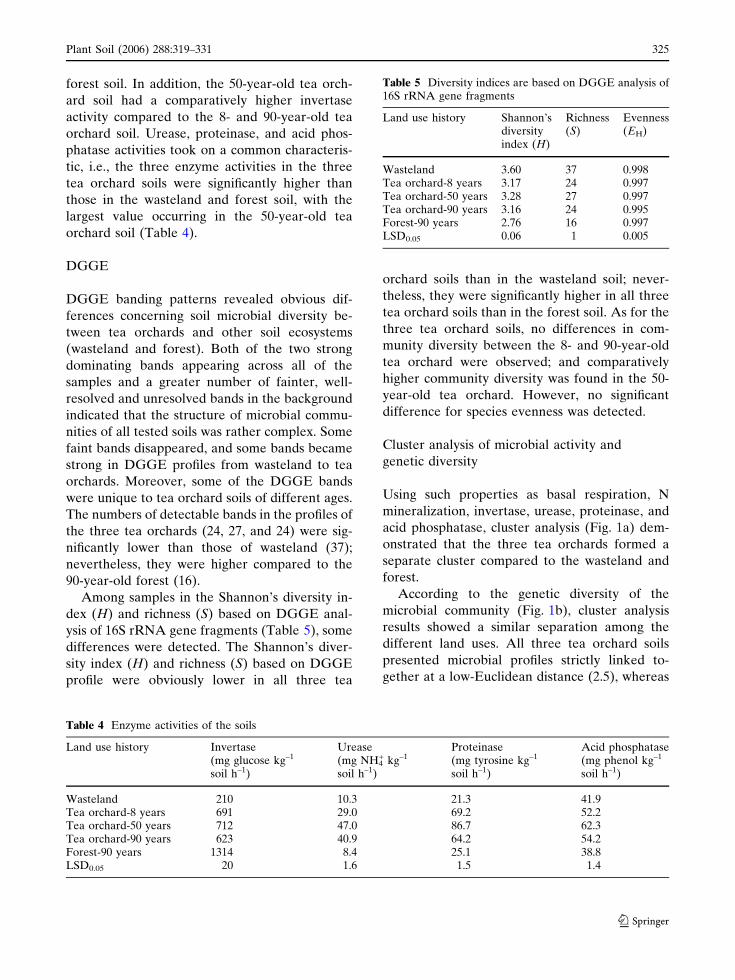
Net N mineralization and nitrification and the
effects of heavy nitrogen fertilizer on net N
mineralization and nitrification
The conversion from wasteland to tea orchard
resulted in a significant increase in both net N
mineralization and nitrification (Table 3). How-
ever, with the increase in tea orchard age, net N
mineralization and nitrification showed a
decreasing trend from the 50- to 90-year-old tea
orchard, so that net N mineralization and nitrifi-
cation in the 50-year-old tea orchard were highest
compared to the other soils. The percentage of
mineralized N to soil total N (Nmin/Ntotal) was
higher in the 8- and 50-year-old tea orchards than
that of the other samples.
Based on a 45-day laboratory incubation, al-
most all the applied urea in the three tea orchard
soils was completely transformed into NH4+–N in
the first 5 days, and then NH4+–N significantly
declined with incubation time. However, the urea
applied in the wasteland and the 90-year old
forest may not be entirely transformed into NH4+–
N in the first 5 days since soil NH4+–N concen-
tration continued to increase rapidly after 5-day
incubation (data not shown). With respect to the
effects of urea application on net N mineraliza-
tion based on a 45-day incubation, no obvious
differences between the soils were observed.
However, there was a great contrast between
conditions before and after the application of
urea. The increased NO3- –N content in the three
tea orchards was 305, 374, and 261 mg kg–1,
respectively (Table 3), with the highest value in
the 50-year-old tea orchard. The average of the
increased NO3- –N content in the three tea orchard
soils was 4 and 35 times higher than that of the
forest and wasteland soils, respectively.
Enzyme activities
Invertase activity of the three tea orchard soils
was significantly higher than that of the wasteland
soil and far lower than that of the 90-year-old
Table 2 Microbialbiomass C and basalrespiration of the soils
Land use history Cmic
(lg C g–1
soil)
Cmic/Corg
(%)Rmic
(lg CO2-C g–1
soil h–1 )
qCO2
(lg CO2-C mg–1
Cmic h–1)
Wasteland 69 0.94 0.55 7.96Tea orchard–8 years 176 1.27 1.18 6.71Tea orchard-50 years 358 1.61 1.67 4.67Tea orchard-90 years 225 0.86 1.32 5.88Forest-90 years 261 0.95 1.42 5.44LSD0.05 8 0.05 0.19 0.34
Table 3 N mineralization and nitrification and effect of urea on mineralization and nitrification
Land use history Nmina Increased
Nminb
Nnitc Increased
Nnitd
Nmin/Ntotal
(%)
Wasteland 8.6 351 3.8 9 1.01Tea orchard-8 years 29.7 385 28.3 305 2.20Tea orchard-50 years 46.3 381 43.3 374 2.26Tea orchard-90 years 42.0 361 37.9 261 1.83Forest-90 years 25.7 348 17.2 77 1.47LSD0.05 4.0 38 4.4 9 0.27
a Net N mineralization (mg inorganic N kg-1 soil)b Increased mineralized N by nitrogen fertilizer application (mg inorganic N kg–1 soil)c Net N nitrification (mg NO3
- –N kg–1 soil)d Increased nitrified N by nitrogen fertilizer application (mg NO3
- –N kg–1 soil)
324 Plant Soil (2006) 288:319–331
123
forest soil. In addition, the 50-year-old tea orch-
ard soil had a comparatively higher invertase
activity compared to the 8- and 90-year-old tea
orchard soil. Urease, proteinase, and acid phos-
phatase activities took on a common characteris-
tic, i.e., the three enzyme activities in the three
tea orchard soils were significantly higher than
those in the wasteland and forest soil, with the
largest value occurring in the 50-year-old tea
orchard soil (Table 4).
DGGE
DGGE banding patterns revealed obvious dif-
ferences concerning soil microbial diversity be-
tween tea orchards and other soil ecosystems
(wasteland and forest). Both of the two strong
dominating bands appearing across all of the
samples and a greater number of fainter, well-
resolved and unresolved bands in the background
indicated that the structure of microbial commu-
nities of all tested soils was rather complex. Some
faint bands disappeared, and some bands became
strong in DGGE profiles from wasteland to tea
orchards. Moreover, some of the DGGE bands
were unique to tea orchard soils of different ages.
The numbers of detectable bands in the profiles of
the three tea orchards (24, 27, and 24) were sig-
nificantly lower than those of wasteland (37);
nevertheless, they were higher compared to the
90-year-old forest (16).
Among samples in the Shannon’s diversity in-
dex (H) and richness (S) based on DGGE anal-
ysis of 16S rRNA gene fragments (Table 5), some
differences were detected. The Shannon’s diver-
sity index (H) and richness (S) based on DGGE
profile were obviously lower in all three tea
orchard soils than in the wasteland soil; never-
theless, they were significantly higher in all three
tea orchard soils than in the forest soil. As for the
three tea orchard soils, no differences in com-
munity diversity between the 8- and 90-year-old
tea orchard were observed; and comparatively
higher community diversity was found in the 50-
year-old tea orchard. However, no significant
difference for species evenness was detected.
Cluster analysis of microbial activity and
genetic diversity
Using such properties as basal respiration, N
mineralization, invertase, urease, proteinase, and
acid phosphatase, cluster analysis (Fig. 1a) dem-
onstrated that the three tea orchards formed a
separate cluster compared to the wasteland and
forest.
According to the genetic diversity of the
microbial community (Fig. 1b), cluster analysis
results showed a similar separation among the
different land uses. All three tea orchard soils
presented microbial profiles strictly linked to-
gether at a low-Euclidean distance (2.5), whereas
Table 4 Enzyme activities of the soils
Land use history Invertase(mg glucose kg–1
soil h–1)
Urease(mg NH4
+ kg–1
soil h–1)
Proteinase(mg tyrosine kg–1
soil h–1)
Acid phosphatase(mg phenol kg–1
soil h–1)
Wasteland 210 10.3 21.3 41.9Tea orchard-8 years 691 29.0 69.2 52.2Tea orchard-50 years 712 47.0 86.7 62.3Tea orchard-90 years 623 40.9 64.2 54.2Forest-90 years 1314 8.4 25.1 38.8LSD0.05 20 1.6 1.5 1.4
Table 5 Diversity indices are based on DGGE analysis of16S rRNA gene fragments
Land use history Shannon’sdiversityindex (H)
Richness(S)
Evenness(EH)
Wasteland 3.60 37 0.998Tea orchard-8 years 3.17 24 0.997Tea orchard-50 years 3.28 27 0.997Tea orchard-90 years 3.16 24 0.995Forest-90 years 2.76 16 0.997LSD0.05 0.06 1 0.005
Plant Soil (2006) 288:319–331 325
123
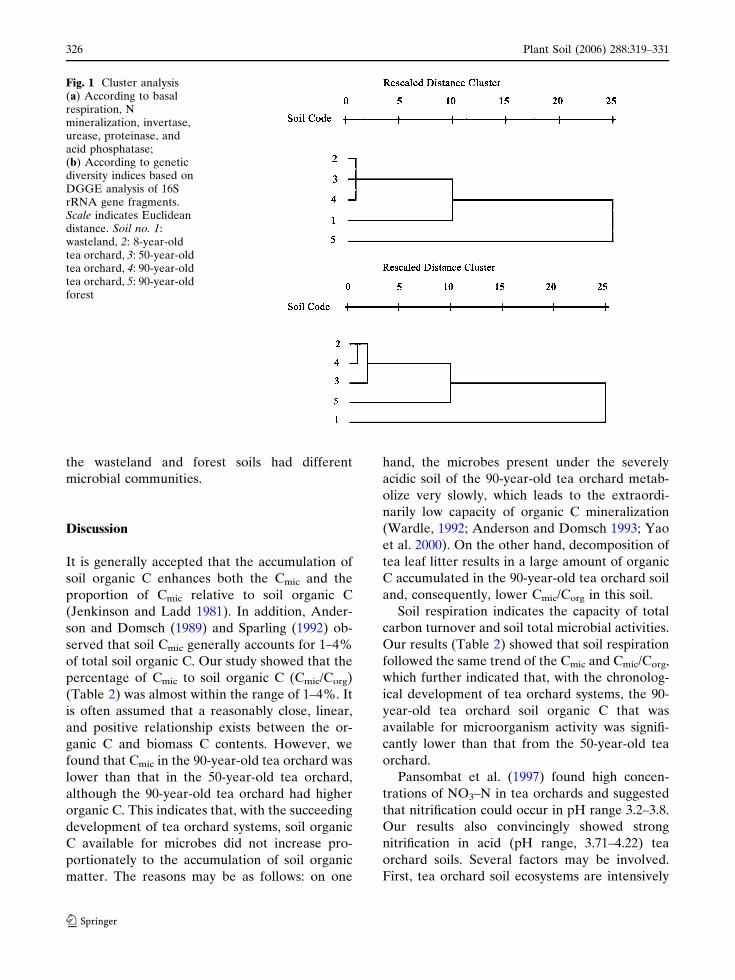
the wasteland and forest soils had different
microbial communities.
Discussion
It is generally accepted that the accumulation of
soil organic C enhances both the Cmic and the
proportion of Cmic relative to soil organic C
(Jenkinson and Ladd 1981). In addition, Ander-
son and Domsch (1989) and Sparling (1992) ob-
served that soil Cmic generally accounts for 1–4%
of total soil organic C. Our study showed that the
percentage of Cmic to soil organic C (Cmic/Corg)
(Table 2) was almost within the range of 1–4%. It
is often assumed that a reasonably close, linear,
and positive relationship exists between the or-
ganic C and biomass C contents. However, we
found that Cmic in the 90-year-old tea orchard was
lower than that in the 50-year-old tea orchard,
although the 90-year-old tea orchard had higher
organic C. This indicates that, with the succeeding
development of tea orchard systems, soil organic
C available for microbes did not increase pro-
portionately to the accumulation of soil organic
matter. The reasons may be as follows: on one
hand, the microbes present under the severely
acidic soil of the 90-year-old tea orchard metab-
olize very slowly, which leads to the extraordi-
narily low capacity of organic C mineralization
(Wardle, 1992; Anderson and Domsch 1993; Yao
et al. 2000). On the other hand, decomposition of
tea leaf litter results in a large amount of organic
C accumulated in the 90-year-old tea orchard soil
and, consequently, lower Cmic/Corg in this soil.
Soil respiration indicates the capacity of total
carbon turnover and soil total microbial activities.
Our results (Table 2) showed that soil respiration
followed the same trend of the Cmic and Cmic/Corg,
which further indicated that, with the chronolog-
ical development of tea orchard systems, the 90-
year-old tea orchard soil organic C that was
available for microorganism activity was signifi-
cantly lower than that from the 50-year-old tea
orchard.
Pansombat et al. (1997) found high concen-
trations of NO3–N in tea orchards and suggested
that nitrification could occur in pH range 3.2–3.8.
Our results also convincingly showed strong
nitrification in acid (pH range, 3.71–4.22) tea
orchard soils. Several factors may be involved.
First, tea orchard soil ecosystems are intensively
Fig. 1 Cluster analysis(a) According to basalrespiration, Nmineralization, invertase,urease, proteinase, andacid phosphatase;(b) According to geneticdiversity indices based onDGGE analysis of 16SrRNA gene fragments.Scale indicates Euclideandistance. Soil no. 1:wasteland, 2: 8-year-oldtea orchard, 3: 50-year-oldtea orchard, 4: 90-year-oldtea orchard, 5: 90-year-oldforest
326 Plant Soil (2006) 288:319–331
123
managed. In particular, frequent nitrogen
fertilizer application stimulated soil nitrification.
Previous studies showed nitrifiers and nitrification
rates are limited by the supply of ammonium
(Robertson and Vitousek 1981; Wedin and Til-
man 1990), and fertilized soils commonly display
higher nitrifying activity due to stimulation of
nitrification by fertilizer ammonium (Martikainen
1985; Aarnio and Martikainen 1996; Mendum
et al. 1999). Our results also showed that urea
application is stimulatory to soil nitrification.
Second, there are probably some acid-tolerant
nitrifiers present in acid tea orchard soils. For
example, Walker and Wickramasinghe (1979)
isolated in pure culture acid-tolerant strains of
Nitrosospira spp from acid tea orchard soils (pH
range, 4.0–4.5) in Bangladesh. As for the mecha-
nism of nitrifiers present at low pH, it is not clear
at present whether acid-tolerant nitrifiers are
comprised of different species or if they are acid-
sensitive strains that have adapted to low-pH
conditions. Lastly, perhaps the soil environment
provides pH-neutral micro-sites for nitrifiers (De
Boer and Kowalchuk 2001).
Tea orchard soils are very particular soil eco-
systems compared to other soils. Long-term hea-
vy nitrogen application, root exudates and leaf
litter have positive and negative effects on nitri-
fier and nitrification rate. On one hand, they can
increase organic matter content and N supplying
capacity. On the other hand, they also can result
in the decline of pH and the accumulation of Al
toxicity and antimicrobial substances (Pandey and
Palni 1996). The higher nitrification in the 50-
year-old tea orchard soil than that in the 8- and
90-year-old tea orchard soil was possibly a result
of a combination reflection of positive and nega-
tive aspects in tea orchard soil ecosystems.
Both tea orchard soils and forest soils are
typical acid soils with similar soil pH. However,
the data showed that soil nitrification in tea
orchards was significantly (p < 0.05) higher than
that in forests. Except for long-term N fertilizer
application in the tea orchard soils, the difference
in soil microbial community between the tea
orchard and the forest soils also likely affects
nitrifier activity and nitrification rate. In addition,
microbial assimilation of nitrate may be one of
the factors resulting in lower net nitrification rates
in forest soil. Many studies (Vitousek and
Andariese 1986; Zak et al. 1990; Davidson et al.
1992; Stark and Hart 1997) showed that a sub-
stantive part of the nitrate that is transformed
from ammonium by nitrification is assimilated by
microorganisms in forest ecosystems.
In natural soil, all kinds of enzyme activities
are positively related to organic matter content
(Guan 1986). However, our results indicated that
only invertase and organic matter are positively
related, and no correlations between urease,
proteinase and organic matter were observed.
This suggests that an aggregate of multi-enzyme
activity may be better correlated with soil fertility
than a single enzyme (Dick and Tabatabai 1992).
Particularly, urease and proteinase activities in
three tea orchards were markedly higher than
those in the wasteland and the 90-year-old forest.
It is well known that urease and proteinase are
mainly involved in the transformation of soil N.
Therefore, our work further demonstrates that
long-term heavy nitrogen fertilizer application
with continuous development of tea orchard soil
ecosystems results in high-enzyme activities in-
volved in soil N cycles (such as urease and pro-
teinase). In three tea orchards, urease, and
proteinase showed the same trend as other
microbial activity properties (such as Rmic, Cmic/
Corg), i.e., urease and proteinase in the 90-year-
old tea orchard were lower than that in the 50-
year-old tea orchard. This may be due to low-
microbial biomass, low pH and high content of
antimicrobial substances in the 90-year-old tea
orchard. These results also indicated that enzyme
activities can be used as indices of microbial
activity (Bergstrom et al. 1998).
According to the banding number and the
varying distances that the PCR products migrated
in the gradient gel, the combined application of
PCR amplification of 16S rDNA sequences and
DGGE could be used to distinguish differences in
microbial community diversity among wasteland,
tea orchards and forest. These differences in
microbial community diversity may be due to the
soils being covered with different plant types
(Waid 1999; Grayston et al. 2001; Marschner et al.
2001). In the present experiment, some faint
bands disappeared, and some bands became
strong in DGGE profile from wasteland to tea
Plant Soil (2006) 288:319–331 327
123
orchards. Additionally, some of the DGGE bands
were unique to tea orchard soils of different ages,
indicating with the tea orchard ecosystems
established after wasteland was reclaimed, a
remarkable finding of change in the soil microbial
community diversity. As some microbial species
can not adapt to the unfavourable stresses of tea
orchard soils and therefore disappeared, never-
theless, some unique microbial species can adapt
to the changed environment and do exist in the
stressed habitat. Some bands with common dis-
tances that migrated in the DGGE profile from
different soils may result from the same micro-
organisms in different soils. Of course, these
bands may also consist of several different
microbial species having the same GC content in
the amplified region.
Many studies have documented that soil
microbial community structure responds to soil
management practices as well as several envi-
ronmental factors. The studies of Bossio et al.
(2005) demonstrated that DGGE analysis of
amplified 16S rDNA fragments revealed differ-
ences in the microbial community structure in
relation to differing soil management practices.
Yang et al. (2000) observed that the application of
NH4HCO3 resulted in a decrease in DNA se-
quence diversity of the soil microbial community.
Waid (1999) pointed out that vegetation type,
quantity and chemical composing may be impor-
tant factors in determining soil microbial com-
munity diversity. Pandey and Palni (1996)
observed that the roots of tea bushes are able to
restrain microorganisms. In addition, the tea bush
leaf litter can also contain antimicrobial sub-
stances, and the low pH can result in Al toxicity,
as a result, leading to a decrease in microbial
species. Low-soil pH has been identified as the
major constraint on soil microorganisms within
study sites of oak, acidophilous beech and spruce–
fir–beech forests (Hackl et al. 2000). Based on the
studies mentioned above, it is possible that per-
sistent input of leaf litter, root exudates and se-
vere acidification lead to a decrease in soil
microbial community diversity in tea orchards
and forests. In addition, the application of long-
term heavy nitrogen fertilizer may partly induce
the change in soil microbial community diversity
in tea orchards.
The cluster analysis figures (Fig. 1) took on a
common characteristic: namely, tea orchards and
wasteland had significant differences in microbial
biomass, activity and genetic diversity. This may
be attributed to the positive relationship between
microbial biomass and organic matter content
(Vance and Nadkarni 1990; Sparling 1992; Spar-
ling et al. 1994). Large amounts of organic matter
that accumulated due to the planting of tea bu-
shes after wasteland was reclaimed resulted in
markedly larger microbial biomass in tea orch-
ards than in wasteland. This was consistent with
higher microbial activity in tea orchards than in
wasteland. However, tea orchard soils exist
amidst so many potentially inhibitory factors,
such as severe acidification, Al toxicity, root ex-
udates and heavy nitrogen fertilizer application.
As a result, obviously lower microbial genetic
diversity was detected in tea orchards than in
wasteland.
Our cluster analysis indicated that land use
type could considerably affect the soil microbial
community. All of the three tea orchard soils
presented microbial profiles strictly linked to-
gether at a low-Euclidean distance, although the
three tea orchard soils seemed to have a sig-
nificant difference in soil organic C or microbial
biomass. The result suggested that a change in
the microbial biomass is not always accompa-
nied by a change in the microbial community
diversity and activity. Most studies demon-
strated that vegetation type is an important
factor in determining soil microbial community
diversity (Grayston et al. 2001; Marschner et al.
2001). Consequently, shifts in soil microbial
community diversity were attributed primarily to
the change in plant type rather than organic
matter content.
Conclusions
With the chronological development of tea orch-
ard ecosystems, soil C and N gradually increased;
however, Cmic, microbial activity properties, and
microbial community diversity showed a common
characteristic: namely, they showed an increasing
trend from the 8- to 50-year-old tea orchard and
then a decreasing trend from the 50- to 90-year-old
328 Plant Soil (2006) 288:319–331
123
tea orchard. These results suggested that fertiliza-
tion, root exudates and leaf litter in tea orchard
ecosystems have positive and negative effects on
the microbial community. They may increase
organic matter content and N supplying capacity;
therefore, the conversion from wasteland to tea
orchard may afford increased microbial biomass
and activity accordingly. However, they may also
result in the decline of pH, increased Al toxicity
and increased production of antimicrobial
substances, which consequently lead to the decline
of microbial biomass and activity from the 50- to
90-year-old tea orchard.
Higher net N nitrification in the tea orchards
compared to the wasteland and the forest sug-
gested that nitrogen fertilizer application can af-
fect nitrifiers and nitrification rates. In addition,
our results demonstrated that microbial commu-
nity diversity was distinctly different in the three
different soil ecosystems, indicating that the shifts
in soil microbial community diversity were
attributed primarily to the change in vegetation
type rather than in organic matter content.
Acknowledgments This work was financially supportedby the National Science Foundation of China (No.30671207 and 40371063). The authors greatly appreciatethe field support provided by Professor Wenyan Han.
References
Aarnio T, Martikainen PJ (1996) Mineralization of carbonand nitrogen, and nitrification in Scots pine forest soiltreated with fast- and slow-release nitrogen fertilizers.Biol Fertil Soils 22:214–220
Aber JD, Nadlehoffer KJ, Steudler PJ, Melillo JM (1989)Nitrogen saturation in northern forest ecosystems.BioScience 39:378–393
Alef K, Nannipieri P (1995) Methods in applied soilmicrobiology and biochemistry. Academic Press, NewYork, pp335–337
Anderson TH, Domsch KH (1986a) Carbon assimilationand microbial activity in soil. Z PflanzenernahrBodenkd 149:457–486
Anderson TH, Domsch KH (1986b) Carbon link betweenmicrobial biomass and soil organic matter. In: Megu-sar F, Gantar M (eds) Perspectives in microbialecology. Slovene Society for Microbiology, Ljubljana,pp467–471
Anderson TH, Domsch KH (1989) Ratios of microbialbiomass carbon to total organic carbon in arable soils.Soil Biol Biochem 21:471–479
Anderson TH, Domsch KH (1993) The metabolic quotientfor CO2 (qCO2) as a specific activity parameter toassess the effects of environmental conditions, such aspH, on the microbial biomass of forest soils. Soil BiolBiochem 25:393–395
Bassam BJ, Caetano-Anolles G, Gresshoff PM (1991) Fastand sensitive silver staining of DNA in polyacryl-amide gels. Anal Biochem 196:80–83
Bauhus J, Khanna PK (1994) Carbon and nitrogen turn-over in two acid forest soils of southeast Australia asaffected by phosphorus addition and drying and rew-etting. Biol Fertil Soils 17:212–218
Bergstrom DW, Monreal CM, King DJ (1998) Sensitivityof soil enzyme activities to conservation practices. SoilSci Soc Am J 62:1286–1295
Bosatta E, Agren G (1993) Theoretical analysis ofmicrobial biomass dynamics in soils. Soil Biol Bio-chem 26:143–148
Bossio DA, Girvan MS, Verchot L, Bullimore J, Borelli T,Albrecht A, Scow KM, Ball AS, Pretty JN, OsbornAM (2005) Soil microbial community response toland use change in an agricultural landscape of wes-tern Kenya. Microbial Ecol 49:50–62
Cahyani VR, Matsuya K, Asakawa S, Kimura M (2003)Succession and phylogenetic composition of bacterialcommunities responsible for the composting processof rice straw estimated by PCR-DGGE analysis. SoilSci Plant Nutr 49:619–630
Chantigny MH, Prevost D, Angers DA, Vezina LP,Chalifour FP (1996) Microbial biomass and N trans-formations in two soils cropped with annual andperennial species. Biol Fertil Soils 21:239–244
Chenery EM (1955) A preliminary study of aluminium andthe tea bush. Plant Soil 6:174–200
Davidson EA, Hart CS, Firestone MK (1992) Internalcycling of nitrate in soils of a mature coniferous forest.Ecology 73:1148–1156
De Boer W, Kowalchuk GA (2001) Nitrification in acidsoils: micro-organisms and mechanisms. Soil BiolBiochem 33:853–866
Dick WA, Tabatabai MA (1992) Significance and potentialuses of soil enzymes. In: Metting FJB (ed) Soilmicrobial ecology: applications in agriculture andenvironmental management. Marcel Dekker, NewYork, pp95–125
Gianfreda L, Sannino F, Ortefa N, Nannipieri P (1994)Activity of free and immobilized urease in soil: effectsof pesticides. Soil Biol Biochem 26:777–784
Grayston SJ, Griffith GS, Mawdsley CD, Campbell CD,Bardgett RD (2001) Accounting for variability in soilmicrobial communities of temperate upland grasslandecosystems. Soil Biol Biochem 33:533–551
Guan Y (1986) Soil enzyme and research methods. ChinaAgricultural Press, Beijing, pp206–239
Hackl E, Bachmann G, Zechmeister-Boltenstern S (2000)Soil microbial biomass and rhizosphere effects innatural forest stands. Phyton 40:83–90
Hamm D, Feger KH (1996) An optimized method for thedetermination of protease activity in acid forest soils.Z Pflanzenernahr Bodenkd 159:37–39
Plant Soil (2006) 288:319–331 329
123
Insam H (1990) Are the soil microbial biomass and basalrespiration governed by the climate regime? Soil BiolBiochem 22:525–532
Insam H, Domsch KH (1988) Relationship between soilorganic carbon and microbial biomass on chronose-quences of reclamation sites. Microbial Ecol 15:177–188
Jackson CR, Harper JP, Willoughby D, Roden EE,Churchill PF (1997) A simple, efficient method for theseparation of humic substances and DNA from envi-ronmental samples. Appl Environ Microb 63:4993–4995
Jenkinson DS, Ladd JN (1981) Microbial biomass in soil:measurement and turnover. In: Paul EA, Ladd JN(eds) Soil biochemistry. Marcel Dekker, New York,pp415–471
Keeney DR, Nelson DW (1982) Nitrogen-inorganic forms.In: Page AL, Miller RH, Keeney DR (eds) Methodsof soil analysis. American Society of Agronomy,Madison, pp643–698
Konishi S (1991) Chemistry of tea. In: Muramatsu K (eds.),Tea science. Asakura-Shoten, Tokyo, pp21–32
Krave AS, Lin B, Braster M, Laverman AM, Van StraalenNM, Roling WFM, Van Verseveld HW (2002) Strat-ification and seasonal stability of diverse bacterialcommunities in a Pinus merkusii (pine) forest soil incentral Java, Indonesia. Environ Microb 4:361–373
Marschner P, Yang CH, Lieberei R, Crowley DE (2001)Soil and plant specific effects on bacterial communitycomposition in the rhizosphere. Soil Biol Biochem33:1437–1445
Martikainen PJ (1985) Numbers of autotrophic nitrifiersand nitrification in fertilized forest soil. Soil BiolBiochem 17:245–248
Mendum TA, Sockett RE, Hirsch PR (1999) Use ofmolecular and isotopic techniques to monitor the re-sponse of autotrophic ammonia-oxidizing populationsof the b subdivision of the class Proteobacteria inarable soils to nitrogen fertilizer. Appl Environ Mic-rob 66:4155–4162
Nelson DW, Sommers LE (1982) Total carbon, organiccarbon and organic matter. In: Page AL, Miller RH,Keeney DR (eds) Methods of soil analysis. AmericanSociety of Agronomy, Madison, pp539–580
Nioh I, Isobe T, Osada M (1993) Microbial biomass andsome biochemical characteristics of a strongly acid teafield soil. Soil Sci Plant Nutr 39:617–626
Olsen SR, Sommers LE (1982) Phosphorus. In: Page AL,Miller RH, Keeney DR (eds) Methods of soil analysis.American Society of Agronomy, Madison, pp539–580
Øvreas L, Forney L, Daae FL, Torsvik T (1997) Distri-bution of bacterioplankton in meromictic Lake Sae-lenvannet, as determined by denaturing gradient gelelectrophoresis of PCR-amplified gene fragmentscoding for 16S rRNA. Appl Environ Microb 63:3367–3373
Pandey A, Palni LMS (1996) The rhizosphere effect of teaon soil microbes in a Himalayan monsoonal location.Biol Fertil Soils 21:131–137
Pansombat K, Kanazawa S, Horiguchi T (1997) Micro-bial ecology in tea soils I. Soil properties andmicrobial populations. Soil Sci Plant Nutr 43:317–327
Powlson DS, Brookes PC, Jenkinson DS (1987) Mea-surement of soil microbial biomass provides an earlyindication of changes in total soil organic matter dueto straw incorporation. Soil Biol Biochem 19:159–164
Robertson GP, Vitousek PM (1981) Nitrification poten-tials in primary and secondary succession. Ecology62:376–386
Rønn R, McCaig AE, Griffiths BS, Prosser JI (2002) Im-pact of protozoan grazing on bacterial communitystructure in soil microcosms. Appl Environ Microb68:6094–6105
Schinner F, Von Mersi W (1990) Xylanase-, CM-cellulase-and invertase activity in soil: an improved method.Soil Biol Biochem 22:511–515
Smith JL, Paul EA (1990) The significance of soil micro-bial biomass estimations. In: Stotzky G, Bollag JM(eds) Soil biochemistry. Marcel Dekker, New York,pp357–396
Sparling GP (1992) Ratios of microbial biomass carbon tosoil organic carbon as a indicator of changes in soilorganic matter. Aust J Soil Res 30:195–207
Sparling GP (1997) Soil microbial biomass, activity andnutrient cycling as indicators of soil health. In: Pank-hurst CE, Doube BM, Gupta VVSR (eds) Biologicalindicators of soil health. CAB International, NewYork, pp97–119
Sparling GP, Hart PBS, August JA, Leslie DM (1994) Acomparison of soil and microbial carbon, nitrogen,and phosphorus contents, and macro-aggregate sta-bility of a soil under native forest and after clearancefor pastures and plantation forest. Biol Fertil Soils17:91–100
Stark JM, Hart SC (1997) High rates of nitrification andnitrate turnover in undisturbed coniferous forests.Nature 385:61–64
Tachibana N, Yoshikawa S, Ikeda K (1995) Influences ofheavy application of nitrogen on soil acidificationand root growth in tea fields. Jpn J Crop Sci 64:516–522
Tokuda S, Hayatsu M (2001) Nitrous oxide emission po-tential of 21 acidic tea field soils in Japan. Soil SciPlant Nutr 47:637–642
Tokuda S, Hayatsu M (2002) Soil microbial biomass andfluorescein diacetate hydrolytic activity in Japaneseacidic tea field soils. Soil Sci Plant Nutr 47:865–869
Tokuda S, Hayatsu M (2004) Nitrous oxide flux from a teafield amended with a large amount of nitrogen fertil-izer and soil environmental factors controlling theflux. Soil Sci Plant Nutr 50:365–374
Vance ED, Brookes PC, Jenkinson DC (1987) Anextraction method for measuring soil microbial bio-mass-C. Soil Biol Biochem 19:703–707
Vance ED, Nadkarni NM (1990) Microbial biomass andactivity in canopy organic matter and the forest floor ofa tropical cloud forest. Soil Biol Biochem 22:677–684
330 Plant Soil (2006) 288:319–331
123
Vitousek PM, Andariese SW (1986) Microbial transfor-mations of labelled nitrogen in a clear-cut pine plan-tation. Oecologia 68:601–605
Waid JS (1999) Does soil biodiversity depend uponmetabiotic activity and influences? Appl Soil Ecol13:151–158
Walker N, Wickramasinghe KN (1979) Nitrification andautotrophic nitrifying bacteria in acid tea soils. SoilBiol Biochem 11:231–236
Wardle DA (1992) A comparative assessment of factorswhich influence microbial biomass carbon and nitro-gen levels in soils. Biol Rev 67:321–358
Wardle DA, Ghani A (1995) A critique of the microbialmetabolic quotient (qCO2) as a bioindicator of dis-turbance and ecosystem development. Soil Biol Bio-chem 27:1601–1610
Wedin DA, Tilman D (1990) Species effects on nitrogencycling: a test with perennial grasses. Oecologia84:433–441
Wolters V, Joergensen RG (1991) Microbial carbonturnover in beach forest soils at different stages ofacidification. Soil Biol Biochem 23:897–902
Yan T, Yang L, Campbell CD (2003) Microbial biomassand metabolic quotient of soils under different landuse in the three Gorges reservoir area. Geoderma115:129–138
Yang YH, Yao J, Hu S, Qi Y (2000) Effects of agriculturalchemicals on DNA sequence diversity of soil micro-bial community: a study with RAPD marker. Micro-bial Ecol. 39:72–79
Yao H, He Z, Wilson MJ, Campbell CD (2000) Microbialbiomass and community structure in a sequence ofsoils with increasing fertility and changing land use.Microbial Ecol 40:223–237
Yao H, Liu Y, Xue D (2006) Influence of tea cultivation onsoil microbial biomass and substrate utilization pat-tern. Commun Soil Sci Plan 37:641–651
Yao H, Xu J, Huang C (2003) Substrate utilization pattern,biomass and activity of microbial communities in asequence of heavy metal—polluted paddy soils.Geoderma 115:139–148
Zak DR, Groffman PM, Pregitzer KS, Christensen S,Tiedje JM (1990) The vernal dam: plant-microbecompetition for nitrogen in northern hardwood for-ests. Ecology 71:651–656
Zak JC, Willig MR, Moorhead DL, Wildman HG (1994)Functional diversity of microbial communities: aquantitative approach. Soil Biol Biochem 26:1101–1108
Zhou J, Bruns MA, Tiedje JM (1996) DNA recovery fromsoils of diverse composition. Appl Environ Microb62:316–322
Plant Soil (2006) 288:319–331 331
123