michigan’s offshore wind potential represent significant electric power generation potential from...
TRANSCRIPT

Michigan’s Offshore Wind Potential
By
Soji Adelaja John A. Hannah Distinguished Professor in Land Policy and Institute Director
Charles McKeown
Manager of Land Use Informatics, Hannah Professor Research Program
The Hannah Professor Research Program Land Policy Institute
Michigan State University
September 30, 2008

Acknowledgements
This study was funded in part by a grant from the W.K. Kellogg Foundation as part of the People and Land initiative. Additional funding and the support of the Michigan Economic Development Corporation (MEDC) was invaluable.
The insights of John Sarver, Michigan Department of Labor and Economic Growth (Energy Office); Eric Shreffler, Michigan Economic Development Corporation; and Michael Klepinger, Mikenetics Consulting; are appreciated.
Data and mapping support by Benjamin Calnin, Informatics Analyst at the Hannah Professor Research Program, is greatly appreciated.
General support provided by the Hannah Professor Research Program at the Land Policy Institute is also appreciated.
Michigan’s Offshore Wind Potential
Prepared by the Hannah Professor Research Program at the Land Policy Institute.
Table Of Contents
A. Background 1
B. Study Rationale and Objectives 3
C. Study Methods 6
D. Findings 12
E. Conclusions 13
F. References 15
Tables
Table 1: Wind Power Curve Values from Siemens SWT 3.6 Turbine Used for 7 Simulation
Table 2: Full Build-out Results by Depth 12
Table 3: Resource Estimates by Depth and Distance from Shore Restrictions 13
Figures
Figure 1: NREL/AWS Truewind 2004 Onshore Wind Resource Map for Michigan 2
Figure 2: NREL/AWS Truewind 2008 Offshore Wind Speed Map for the 4 Great Lakes Basin
Figure 3: Process Flow for Power Assessment 8
Figure 4: Examples of the Three Different Classes of Turbine Support 9 Structures. Recreated From Dvorak, 2007
Figure 5: 30 m, and 60 m, Bathymetry Map 10
Figure 6: Shoreline Distance Restrictions Map 11
i

Michigan’s Offshore Wind Potential
ii Prepared by the Hannah Professor Research Program at the Land Policy Institute.
Summary Based on the data released in 2008 by AWS Truewind on Great Lakes wind resources, this study projects Michigan's potential offshore wind energy resource capacity. The analysis used a geospatial framework to combine Great Lakes depth (bathymetry) information, with the wind resource information while considering selected possible shoreline restrictions. Wind turbine build-out scenarios were developed for the offshore areas within Michigan’s Great Lakes boundaries, based on the assumption of the use of the Siemens STW 3.6 Wind Turbine. The projected number of turbines was used to project power output's under various depth scenarios. Our projections suggest the following offshore wind power potential for Michigan at various installation depth considerations:
• Assuming that wind towers can be located at all depths without restrictions, Michigan could potentially generate 321,936 Megawatts (Mw) of electricity from offshore wind.
• Assuming that wind towers can be located up to a depth of 60 m without restrictions, Michigan could potentially generate 102,592 Mw of electricity.
• Assuming that wind towers can be located up to a depth of 30 m without restrictions, Michigan could potentially generate 55,250 Mw of electricity.
These represent significant electric power generation potential from offshore application of wind energy technology. The analysis further adjusts the above numbers for shoreline distance considerations. The adjusted projections for Michigan are as follows:
• At up to 60 m of depth, the projected generation capacity drops off from 102,592 Mw to 94,274 Mw if a shoreline distance of 1 km is maintained, further drops to 62,205 Mw if a shoreline distance of 5 km is maintained, further drops to 36,337 Mw if a shoreline distance of 10 km is maintained, and further to 9,602 Mw if a shoreline distance of 15 km is maintained.
• At up to 30 m of depth, the projected generation capacity drops off from 55,250 Mw to 47,360 Mw if a shoreline distance of 1 km is maintained, further drops to 22,247 Mw if a shoreline distance of 5 km is maintained, further drops to 9,481 Mw if a shoreline distance of 10 km is maintained, and further drops to 926 Mw if a shoreline distance of 15 km is maintained.
These results suggest significantly greater wind generation capacity for Michigan if Great Lakes wind assets offshore are taken into consideration along with previous estimates of wind assets onshore. These projections do not account for potential areas of concern such as shipping lanes, sensitive aquatic habitat, historic sites (such as shipwrecks and others), recreational fishing needs, commercial fishing needs, transportation corridors, migratory bird routes, and potential areas subject to tribal and other treaty concerns, and other natural resource management concerns. To account for these areas, much more significant data than is currently available will be needed. The authors are currently working to develop such data. A full accounting of Michigan’s wind resources, onshore and offshore, could very well elevate the state’s profile among U.S. states with wind potential.

A. Background
In the year 2004, the National Renewable Energy Laboratory (NREL) of the U.S. Department of Energy (DOE) published (in partnership with AWS Truewind) a state wind resource map and estimates of onshore wind resource capacity for the State of Michigan (see Figure 1). The NREL estimates spatially identified Michigan’s onshore wind resources by wind intensity class. The report, which has served as the primary basis for much of the discussion about Michigan’s wind energy potential, estimated a total onshore wind power potential of 16,560 megawatts (Mw) for the state (Flowers, 2007). That estimate was based on a series of assumptions about potential areas of exclusion.
The estimated 16,560 Mw of wind generating capacity represents a substantial potential increase in Michigan’s power generating capacity. Michigan currently consumes retail electricity in the amount of 108,018,000 Megawatt hours (equivalent to 12,331 Mw of continuous generating capacity) annually and is capable of generating 30,189 Mw at peak times (EIA, 2007). Since the release of the 2004 NREL report, under the leadership of the executive branch and the legislature, the State of Michigan has had significant discourse about optimal approaches for realizing Michigan’s domestic energy production potential, especially via renewable energy. This debate has actively involved various interest groups within the private sector and the general public. The 21st Century Energy Plan, published in 2006 (Lark, 2006), also relied heavily on NREL’s onshore wind estimates. So did the recently passed Clean, Renewable, and Efficient Energy Act of 2008 (Enrolled Senate Bill 213) which set a 2015 goal of 10% renewable energy. Michigan recently tested its offshore wind siting regulatory process in both shallow and deepwater settings (Klepinger, 2008).
While Michigan is well endowed in onshore wind resources, ranked 14th nationwide (Elliot, 1991), it is perhaps even better endowed in offshore wind. Offshore wind has several potential advantages over onshore wind, which are as follows:
1. Michigan is one of eight states and two provinces with Great Lakes resources under their control.
2. Michigan alone has, within its jurisdiction, approximately 40% of the Great Lakes water surface area.
3. Much of the Great Lakes bottomland that is within the jurisdiction of Michigan is essentially owned and operated by the state, in trust for the public (Illinois Central Railway Commission v. Illinois, 1892).
4. The degree of difficulty in implementing wind projects offshore in the Great Lakes is significantly less than in ocean or saltwater applications.
5. Project implementation costs for Great Lakes application will likely be lower than in marine applications.
6. State marine coastal management zones only extend 18 miles, while Great Lakes states zones are not subject to such restrictions.
7. Saltwater is much more corrosive than freshwater, making salt water offshore projects less durable.
8. Ocean floor topography makes it difficult to address viewshed issues, as ocean based projects involve greater depths closer to shore (Pryor, 2004).
The application of wind to freshwater areas, particularly in the Great Lakes, therefore, appears more feasible from some political, economic and social perspectives. However, the environmental implications are perhaps less clear, and icing conditions could present engineering challenges.
Michigan’s Offshore Wind Potential
Prepared by the Hannah Professor Research Program at the Land Policy Institute. 1

Michigan’s Offshore Wind Potential
Prepared by the Hannah Professor Research Program at the Land Policy Institute.
Figure 1: NREL/AWS Truewind 2004 Wind Resource Map for Michigan
2
Michigan’s Offshore Wind Potential
Prepared by the Hannah Professor Research Program at the Land Policy Institute.
B. Study Rationale and Objectives
The absence of data on Great Lakes offshore wind resource potential has been a major bottleneck to the quantification of Michigan’s total renewable energy potential and the state’s potential competitiveness in wind energy. The ability to quantify this resource was greatly enhanced when AWS Truewind (in partnership with the Michigan Energy Office, NREL, the Ontario Ministry of Natural Resources, New York State Energy Research and Development Authority, State of Indiana, the U.S. Department of Energy, the U.S. Department of Defense, and the Ohio Department of Development) released the first comprehensive wind resource results and maps for all of the Great Lakes. The 2008 AWS Truewind information and maps provide data at much greater heights than what was previously provided in 2004. The results suggest significant wind resources offshore (see Figure 2). Perhaps more importantly, it defines the availability of wind resources where each state, more than its local units of government and their constituents, is better positioned to define and implement a vision of what it can offer in renewable energy.
With this new data now in hand, one major bottleneck that remains is to identify what this resource translates into in terms of wind energy generating capacity. Given the unique resource of offshore wind power, it is possible for Michigan to uniquely define itself as a premier wind energy state. Most states have land based wind resources, the development of which faces a number of limitations. First, the acquisition of land for wind generation costs money, which may or may not be the case with offshore projects. Second, the assembly of land through leases and purchases with individual landowners is cumbersome at best. Third, “Not In My Backyard” (NIMBYism) offshore can perhaps be better mitigated through adequate distancing of installations from the viewshed of communities than onshore. To the extent to which energy self-sufficiency becomes a central vision and/or goal of a state, the state is likely better empowered to take leadership in implementing and facilitating wind projects offshore by using some of the same economic development tools and strategies that are used onshore. The current challenge for Michigan is to quantify this resource in relevant terms, such as potential power generation and potential economic impacts in Michigan.
The overall objective of the study is to quantify Michigan’s offshore wind generation potential. Specific objectives are as follows:
1. To determine the areas of the Great Lakes wind resource that are within the boundary and ownership of the State of Michigan.
2. To correlate wind speed data for areas within Michigan’s boundary with depth (bathymetry) data to identify alternative scenarios with respect to feasible wind equipment applications.
3. To estimate the total offshore wind generating capacity of Michigan at various depths and shoreline distance restrictions by applying the parameters associated with optimal wind generating equipment and appropriate wind turbine spacing.
4. To present, in tabular and map form, the results in order to inform future policy decisions about Michigan’s offshore wind potential.
In the event that Great Lakes deployment of wind farms are deemed to be politically, socially, and economically feasible, this study can be useful in arming Michigan policymakers with information to support their efforts to attract wind energy developers from in and out of the state to participate in building Michigan’s renewable energy industry.
3

Michigan’s Offshore Wind Potential
Prepared by the Hannah Professor Research Program at the Land Policy Institute. 4
Figure 2: NREL/AWS Truewind 2008 Offshore
(N

Michigan’s Offshore Wind Potential
Prepared by the Hannah Professor Research Program at the Land Policy Institute. 5
Wind Speed Map for the Great Lakes Basin
Note: Legend Reprocessed for display clarity.)

Michigan’s Offshore Wind Potential
Prepared by the Hannah Professor Research Program at the Land Policy Institute.
Renewable energy will receive significant attention in the U.S. in coming years. With the expected gradual growth in energy demand, the growing global competition for conventional energy and the raw materials and fuel to produce such energy, energy costs are expected to increase dramatically (Mobil Oil Co, 2007). The implications are likely to be significant, with the potential outcomes of changing the way Americans use energy and the industrial dominance that the U.S. has enjoyed globally (Shell, 2008). A number of national initiatives have highlighted the importance of managing this problem intelligently. The Energy Independence and Security Act (110th Congress, 2007), the recently unveiled renewable energy plan by the T. Boone Pickens group, the recent plan revealed by Nobel Laureate and former U.S. Vice President Al Gore (We Can Solve It, 2008), and recent moves by traditional energy companies to redefine themselves in the renewable energy space illustrate the challenges and complications that U.S. states and the nation will face in attempting to internalize their energy sources in the face of rising global demand, potentially shrinking global supply and the limited short-term options to address possible gaps.
This initial assessment was conducted as the first estimate of the power production potential for Michigan’s offshore management area.
C. Study Methodology The strategy in this study was to keep the analysis simple, tractable and expeditious. We see development of estimates of offshore wind power production potential to be an ongoing process that will be informed with new data. Supplementary analysis will be released, in due course, as more detailed information is available on optimal exclusionary zones, such as shipping lanes, sensitive aquatic habitat, historic sites (such as shipwrecks and others), recreational fishing needs, commercial fishing needs, transportation corridors, migratory bird routes and potential areas subject to tribal and other treaty concerns.
The Basic AWS Truewind Wind Information The starting point in our analysis was to acquire the AWS Truewind sampling data for the Great Lakes. AWS Truewind sampling data was obtained using satellite based downward looking light detection and ranging (LiDAR). A summary of this information is provided in Figure 2. It shows mean wind speed for one year at 150m above the lake surface in miles per hour (Mph) and meters per second (m/s). This data was provided in tabular form to the Land Policy Institute by AWS Truewind, in cooperation with the Michigan State Energy Office and the Michigan Department of Labor and Economic Growth.
As shown in Figure 2, the vast majority of the Great Lakes exhibit wind speeds of over 19 Mph or 8.4 m/s. Even the near shore locations, which represent a very small proportion of Great Lakes surface area, typically exhibit wind speeds between 17.9 and 19.0 Mph or 8.0 to 8.5 m/s. The resource offshore is generally much greater and is more broadly distributed offshore than onshore.
Translating the AWS Truewind Data into Resource Maps The tabular sampling data for wind speed, direction and density were used to construct a 200 m grid of wind speed at a height of 150 m in the Great Lakes region. The wind speed map was resampled to 1 km cells in an Earth Science Research Institute (ESRI) Grid format to simulate a tower in the center of each cell, giving a simulated inter -tower spacing of 1 km or 0.62 mi. To model only Michigan’s potential, the Great Lakes grids were then truncated to the
6
Michigan’s Offshore Wind Potential
Prepared by the Hannah Professor Research Program at the Land Policy Institute.
boundaries of Michigan’s coastal management area. Given the resolution of the sampling grid, there is a +/- 100 m error along the boundary, resulting in a total area error rate of 0.68%. This provided an estimate of Michigan’s offshore average wind speed.
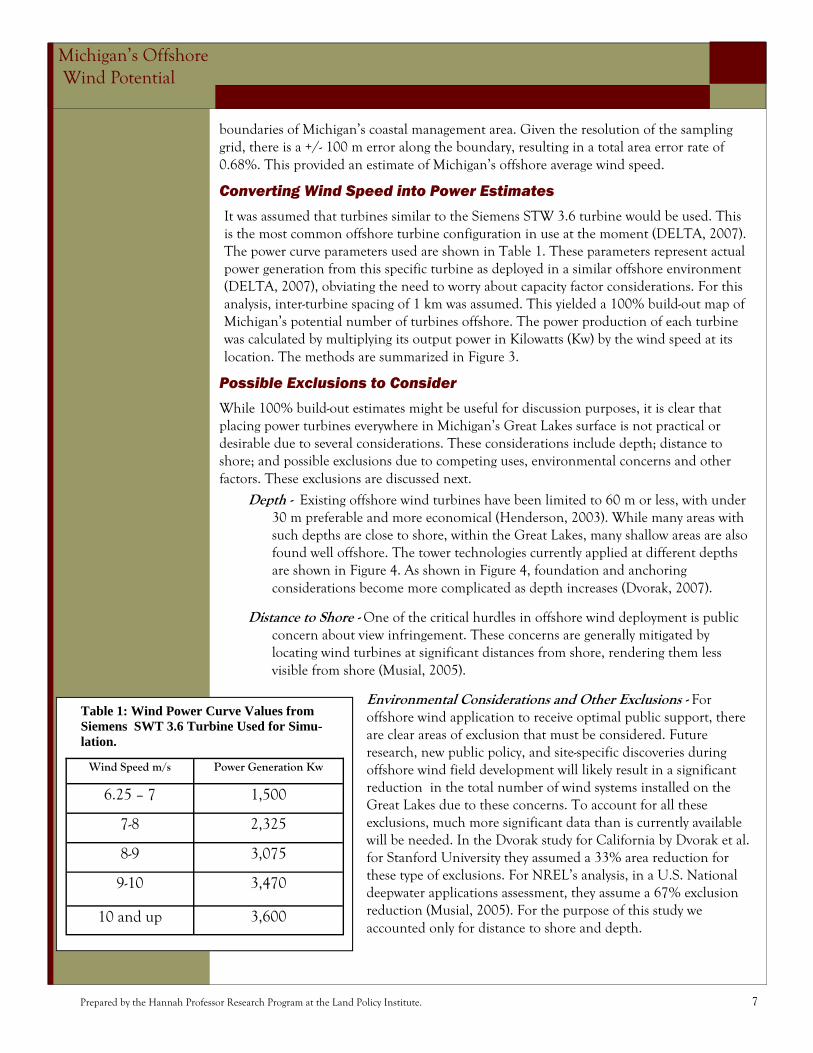
Converting Wind Speed into Power Estimates It was assumed that turbines similar to the Siemens STW 3.6 turbine would be used. This is the most common offshore turbine configuration in use at the moment (DELTA, 2007). The power curve parameters used are shown in Table 1. These parameters represent actual power generation from this specific turbine as deployed in a similar offshore environment (DELTA, 2007), obviating the need to worry about capacity factor considerations. For this analysis, inter-turbine spacing of 1 km was assumed. This yielded a 100% build-out map of Michigan’s potential number of turbines offshore. The power production of each turbine was calculated by multiplying its output power in Kilowatts (Kw) by the wind speed at its location. The methods are summarized in Figure 3.
Possible Exclusions to Consider
While 100% build-out estimates might be useful for discussion purposes, it is clear that placing power turbines everywhere in Michigan’s Great Lakes surface is not practical or desirable due to several considerations. These considerations include depth; distance to shore; and possible exclusions due to competing uses, environmental concerns and other factors. These exclusions are discussed next.
Depth - Existing offshore wind turbines have been limited to 60 m or less, with under 30 m preferable and more economical (Henderson, 2003). While many areas with such depths are close to shore, within the Great Lakes, many shallow areas are also found well offshore. The tower technologies currently applied at different depths are shown in Figure 4. As shown in Figure 4, foundation and anchoring considerations become more complicated as depth increases (Dvorak, 2007).
Distance to Shore - One of the critical hurdles in offshore wind deployment is public concern about view infringement. These concerns are generally mitigated by locating wind turbines at significant distances from shore, rendering them less visible from shore (Musial, 2005).
Environmental Considerations and Other Exclusions - For offshore wind application to receive optimal public support, there are clear areas of exclusion that must be considered. Future research, new public policy, and site-specific discoveries during offshore wind field development will likely result in a significant reduction in the total number of wind systems installed on the Great Lakes due to these concerns. To account for all these exclusions, much more significant data than is currently available will be needed. In the Dvorak study for California by Dvorak et al. for Stanford University they assumed a 33% area reduction for these type of exclusions. For NREL’s analysis, in a U.S. National deepwater applications assessment, they assume a 67% exclusion reduction (Musial, 2005). For the purpose of this study we accounted only for distance to shore and depth.
Wind Speed m/s Power Generation Kw
6.25 – 7 1,500
7-8 2,325
8-9 3,075
9-10 3,470
10 and up 3,600
Table 1: Wind Power Curve Values from Siemens SWT 3.6 Turbine Used for Simu-lation.
7
Michigan’s Offshore Wind Potential
Prepared by the Hannah Professor Research Program at the Land Policy Institute.
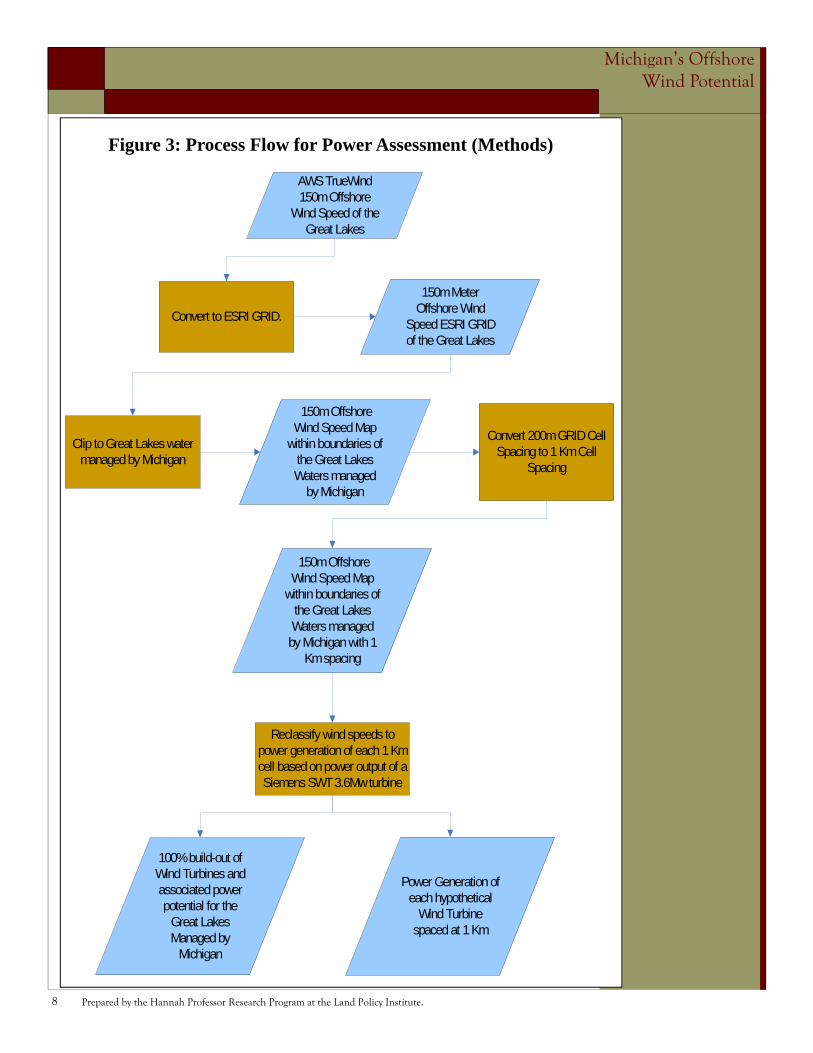
Figure 3: Process Flow for Power Assessment (Methods)
Convert 200m GRID Cell Spacing to 1 Km Cell
Spacing
Clip to Great Lakes water managed by Michigan
Convert to ESRI GRID.
AWS TrueWind 150m Offshore
Wind Speed of the Great Lakes
150m Meter Offshore Wind
Speed ESRI GRID of the Great Lakes
150m Offshore Wind Speed Map
within boundaries of the Great Lakes Waters managed
by Michigan
150m Offshore Wind Speed Map
within boundaries of the Great Lakes Waters managed by Michigan with 1
Km spacing
Reclassify wind speeds to power generation of each 1 Km cell based on power output of a Siemens SWT 3.6Mw turbine
100% build-out of Wind Turbines and associated power potential for the
Great Lakes Managed by
Michigan
Power Generation of each hypothetical
Wind Turbine spaced at 1 Km
8

Michigan’s Offshore Wind Potential
Prepared by the Hannah Professor Research Program at the Land Policy Institute.
Shallow Water Adjustment
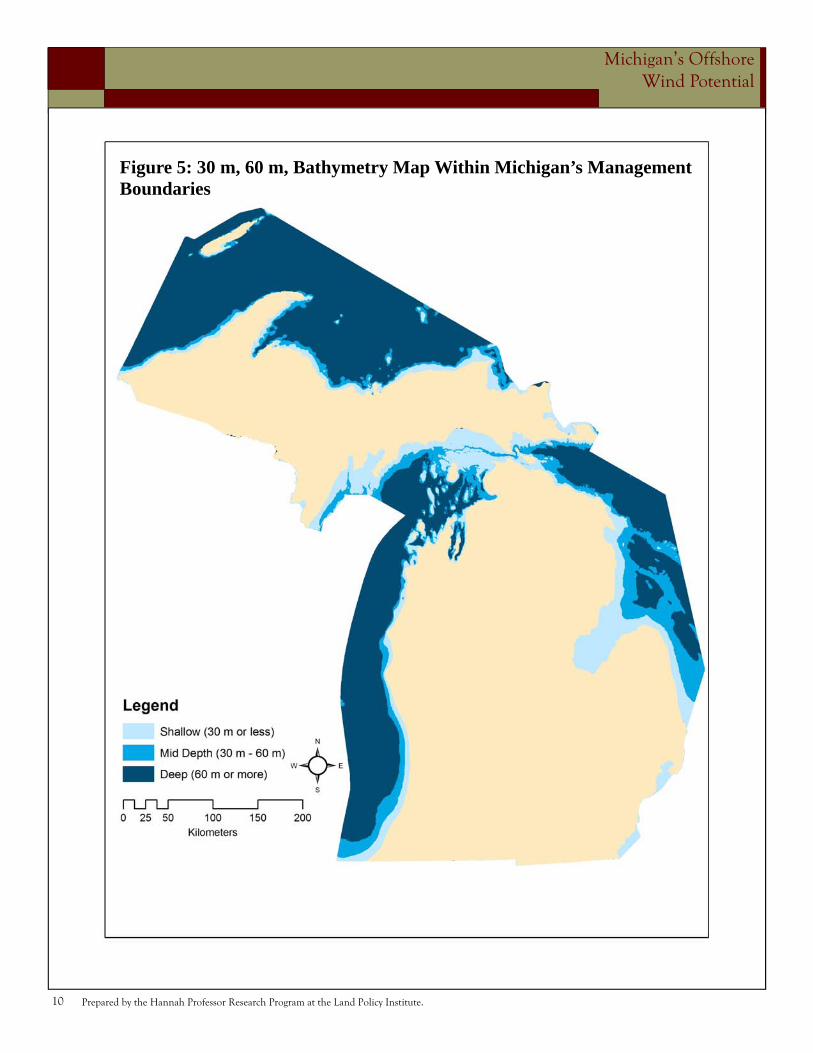
For the shallow water adjustment, we restricted the potential application of wind to lake areas with 30 m or less in depth. Since this depth in the Great Lakes is largely close to shore depth restrictions are clearly related to shoreline restrictions. Figure 5 presents a map of Michigan’s Great Lakes areas at different depths. Most of the shallow areas being so close to shore, this adjustment reduces the total area available by about 90%.
Shallow and Mid Depth Adjustment
This analysis is identical to the shallow water scenario, with the exception that the maximum depth was increased to 60 m reflecting more advanced wind turbine tower support structures (Dvorak, 2007). As shown in Figure 5, extending wind turbines to areas up to 60 m in depth increases Michigan’s potential by almost double. Although this depth may present cost challenges due to more complicated foundation technologies, it can be implemented with current technology.
Deep Advanced Technology Adjustment
This scenario applies no depth restriction. Advances in floating platform technology in the future will allow placement in almost all depths. Currently this is largely untested in practical applications, so turbine placement at these depth will be a future application.
Shoreline Distance Adjustments
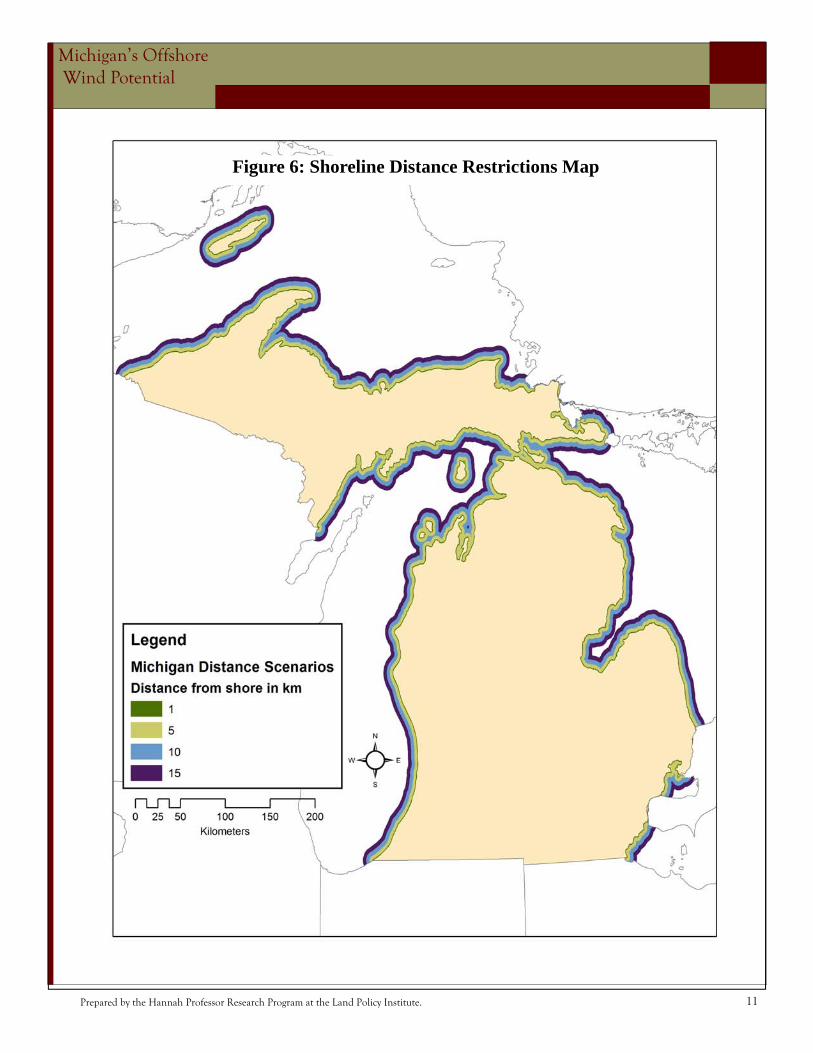
Future research, new public policy, and site-specific discoveries during offshore wind field development will likely result in a significant reduction in the total number of wind systems installed on the Great Lakes. Michigan recently tested its offshore wind siting regulatory process in both shallow and deepwater settings, but the scope of potential regulatory and other exclusion areas is presently unknown (Klepinger, 2008). Therefore, a review of offshore distances allowed elsewhere and used in previous analysis was conducted. Based on this review, distances of: 1 km (Finfacts, 2007), 5 km (Owen, 2004), and 10 km offshore (Musial, 2005), and 15 km were selected to illustrate the impact these adjustments have on available wind power generation. These adjustments are shown in Figure 6.
Figure 4: Examples of the Three Different Classes of Turbine Support Struc-tures. Recreated From Dvorak, 2007.
Monopile:0-20m Image Owen, 2007
Water Jacket Tripod: 20m-60m Image Owen, 2007
Floating: 50m-200m (future) Image NREL, 2007
9
Michigan’s Offshore Wind Potential
Prepared by the Hannah Professor Research Program at the Land Policy Institute.
Figure 5: 30 m, 60 m, Bathymetry Map Within Michigan’s Management Boundaries
10
Michigan’s Offshore Wind Potential
Prepared by the Hannah Professor Research Program at the Land Policy Institute. 11
Figure 6: Shoreline Distance Restrictions Map

Michigan’s Offshore Wind Potential
Prepared by the Hannah Professor Research Program at the Land Policy Institute.
D. Findings Initial estimates of Michigan’s offshore wind potential are shown in Table 2. The
results suggest that the offshore wind potential dwarfs that of Michigan’s onshore potential of 16,560 Mw, as calculated by NREL in their 2004 analysis. The map of projected wind power generation is presented in Figure 7. It shows the projected output from each Siemens SWT 3.6 (or similar) turbine if placed within different zones within the Great Lakes. In essence, if the Great Lakes surface area is built out, without restrictions, to maximum depth, the total power output is projected to be 321,936 Mw, or 99,932 Siemens SWT 3.6 turbines. As can be seen from Figure 7, the majority of the surface area in Michigan’s portion of the Great Lakes has outstanding or superb wind power generation capacity, according to NREL’s designation (see Figure 1).
Total Offshore Wind Power Potential
Total offshore power potential at a maximum depth is estimated to be 321,936 Mw. This translates into 99,932 potential high power Siemens STW 3.6 wind turbines. This is over almost 20 times the estimated power onshore. If maximum depth is reduced to 200 m, an estimated 269,562 Mw is possible. This is over 16 times the wind power potential onshore. This translates into 84,500 potential high power Siemens STW 3.6 wind turbines. At a maximum depth of 60 m, which is currently feasible and has been done elsewhere, the offshore power generation potential is 102,592 Mw, which translates into 33,861 high power
turbines. At a maximum depth of 30 m, the most feasible and common deployment depth worldwide, the potential is estimated at 55,250 Mw, or 18,782 turbines.
At the 30 m depth the total power available offshore in Michigan is over 3 times that available on land. As the technology for anchoring and installing wind turbines offshore matures, the move to deeper depths will allow Michigan to take advantage of even larger potential; with over 6 times the onshore power estimate available at 60 m.
Adjusted Offshore Wind Potential Based on Depth and Shoreline Distance
Separate power production potentials were calculated based on scenario modifications for depth and shoreline adjustments. The shoreline distances used are mapped in Figure 6. The resulting intersections of adequate distance from shore and desired depth are presented in Table 3.
As shown in Table 3, at Maximum Depth, Michigan’s potential drops off from 321,936 Mw zero distance to shore to 312,546 Mw at 1 km to shore then to 257,250 Mw at 5 km to shore,
12
Table 2: Full Build-out Power Estimates by Depth.
Maximum Depth Projections
60m Depth Projections
30m Depth Projections
Power (Mw) Towers Power
(Mw) Towers Power (Mw) Towers
321,936 99,932 102,592 33,861 55,250 18,782

Michigan’s Offshore Wind Potential
Prepared by the Hannah Professor Research Program at the Land Policy Institute.
13
Figure 7: Projected Power Output per Turbine in Michigan’s Great Lakes Waters (No Depth or Shoreline Restrictions Applied)

Michigan’s Offshore Wind Potential
Prepared by the Hannah Professor Research Program at the Land Policy Institute.
then to 234,175 Mw 10 km from shore, then to 197,278 Mw 15 km from shore. These numbers translate into 99,932 turbines with no shoreline restriction, 96,371 turbines (1 km minimum distance from shore), 83,748 turbines (5 km minimum distance from shore), 70,630 turbines (10 km minimum distance from shore), and 58,992 turbines (15 km minimum distance to shore).
As shown in Table 3, at 60 m depth or less, Michigan’s potential drops off from 102,592 Mw at zero distance to shore to 94,274 Mw at 1 km distance, then to 62,205 Mw at 5 km distance, then to 36,337 Mw 10 km distance, then to 9,602 Mw at 15 km distance. These numbers translate into 33,861 turbines with no shoreline restriction, 30,714 turbines (1 km minimum distance from shore), 19,813 turbines (5 km minimum distance from shore), 11,469 turbines (10 km minimum distance from shore), and 2,880 turbines (15 km minimum distance to shore).
Finally at 30 m depth or less, Michigan’s potential drops off from 55,250 Mw zero distance to shore, to 47,360 Mw at 1 km to shore, then to 22,247 Mw at 5 km to shore, then to 9,481 Mw 10 km to shore, then to 926 Mw at 15 km distance to shore. These numbers translate into 18,782 turbines with no shoreline restriction, 15,795 turbines (1 km minimum distance from shore), 7,177 turbines (5 km minimum distance from shore), 9,034 turbines (10 km minimum distance from shore), and 275 turbines (15 km minimum distance to shore).
E. Conclusions The estimates presented in this report provide a framework for preliminary examination of Michigan's offshore wind potential. With the exception of 30 m depth and a minimum distance of 10 km and 15 km from shore, and the 60m depth 15 km from shore, these estimates exceed previous estimates of Michigan’s onshore wind potential. Given the unique management framework in the Great Lakes, the potential to mitigate some of the issues that typically arise with onshore application and the potential for Michigan to be a bigger player in the national wind generation space, we recommend that greater consideration be given to state policies to guide offshore wind development.
Table 3: Resource Estimates by Depth and Distance From Shore Restrictions.
14
Maximum Depth Projections
60m Depth Projections
30m Depth Projections
Distance From Shore
Power (Mw) Towers Power
(Mw) Towers Power (Mw) Towers
0 km 321,936 99,932 102,592 33,861 55,250 18,782
1 km 312,546 96,371 94,274 30,714 47,360 15,795
5 km 275,250 83,748 62,205 19,813 22,247 7,177
10 km 234,175 70,630 36,337 11,469 9,481 3,034
15 km 197,278 58,992 9,602 2,880 926 275
F: References 110th Congress. H.R. 6., Energy Independence and Security Act of 2007. January 4, 2007.
Ackerman, T. (2002). Transmission Systems for Offshore Wind Farms. Power Engineering Review, IEEE Power and Energy Society, Piscataway, NJ.
Alberts, D.J., (2005). Delphi Inquires Into Wind Siting Issues, Report to the Michigan Energy Office, 2005, Lawrence Technical University, MI.
AWS Truewind (2008). Wind Resource of the Great Lakes, AWS Truewind Published Maps, April 2008, Albany New York..
Dvorak, M.J., Jacobson, M.Z., and Archer, C.L. (2007). California offshore wind energy potential. Proceedings from Windpower 2007. American Wind Energy Association Windpower 2007 Conference & Exhibition, June 36, 2007, Los Angeles, CA: AWEA.
Dhanju, A., P. Whitaker, and W. Kempton, (2007). Assessing offshore wind resources: An accessible methodology. Renewable Energy.
Elliot, D.L., L.L. Wendell, and G.L Gower (1991). An Assessment of the Available Windy Land Area and Wind Energy Potential in the Contiguous United States. August, 1991.
Energy Information Administration. U.S. Department of Energy (2007). State Electricity Profiles 2006. 2007. http://www.eia.doe.gov/cneaf/electricity/st_profiles/sep2006.pdf.
ExxonMobil (2007). The Outlook for Energy A View to 2030. http://www.exxonmobil.com/Corporate/Files/energy_outlook_2007.pdf.
Finfacts Ireland Business and Finance Portal (2007). UK announces 33GW of Offshore Wind Energy – Ireland Remains in Cycle of Paralysis on How to Achieve its Renewables’ Target. December 10, 2007. http://www.finfacts.com/irelandbusinessnews/publish/article_1012056.shtml..
Flowers, Larry (2007). Wind Energy Update. Presentation at the Michigan Wind Integration Forum. Lansing, MI. April 27, 2007.
Gore, A. (2008). We Can Solve It: Clean Energy Economy. http://www.wecansolveit.org/content/solution/ clean_energy_economy/.
Henderson, A. R. et al. (2003), Offshore Wind Energy in Europe - A Review of the State-of the-Art. Wind Energy 6:35-52.
Illinois Central Railway Commission V. Illinois, 146 U.S. 387, 452 (1892).
Klepinger, M., (2008). Michigan Great Lakes Offshore Wind Permitting Dry Run. A report submitted to the Michigan Economic Development Corporation (MEDC), May, 2008, Mikenetics Consulting, Portland OR.
Kotronaros, A. (2007). Offshore Wind Energy. European Commission. DG Energy & Transport Activities. http://ec.europa.eu/energy/res/sectors/doc/wind_energy/offshore_% 20presentation_alex.pdf..
Langeland K. (2006). Measurement of Noise Emission from a Siemens SWT-3.6-107 Wind Turbine Situated at Høvsøre, Denmark. November 6, 2006. http://www.langelandkommune.dk/ AcadreDownload.ashx?id=117599-1-pdf..
Lark, J. P. [Chair, Michigan Public Service Commission] (2006), Michigan’s 21st Century Electric Energy Plan. Lansing: State of Michigan.
Mills, D., Rosen, D., New Jersey Shore Opinion Study About Off Shore Wind Turbines. 2006. http://njedl.rutgers.edu/ftp/PDFs/4497.pdf.
Michigan House of Representatives (2008). Bills 5548 & 5549, Michigan Renewable Portfolio Standard, Michigan Legislature. Lansing, MI.
Michigan Senate (2008). The Clean, Renewable, and Efficient Energy Act. Michigan Legislature, Lansing, MI..
Musial, W. (2005). Offshore Wind Energy Potential for the United States. May 19, 2005. Evergreen, CO. Paper Presented to: The Wind Powering America Annual State Summit.
National Renewable Energy Laboratory (2008). Image: Floating offshore wind turbine tower supports. http://www.nrel.gov/wind/.
O’Connell, R., and R. Pletka (2007). Percent Wind Energy Penetration in the United States: A Technical Analysis of the Energy Resource. Overland Park, KS: Black and Veatch.
Offshore Wind Energy (2007). Technology of Offshore Wind Energy. 2007 http://www.offshorewindenergy.org/.
Owen, R. (2004). Final Report to Wisconsin Focus on Energy on Lake Michigan Offshore Wind Resource Assessment. http:// www.focusonenergy.com/data/common/dmsFiles/ W_RW_MKTG_LMWindAssessment.pdf]..
Pryor, S., and Stout W. (2004). Offshore Wind Energy Development in the Great Lakes: A Preliminary Briefing Paper for the Michigan Renewable Energy Program. Ann Arbor, MI, 2004.
Shell International BV (2008). Shell Energy Scenarios to 2050. Shell International BV.
Michigan’s Offshore Wind Potential
Prepared by the Hannah Professor Research Program at the Land Policy Institute. 15

Report # HPRP-2008-Renewable Energy-003