metropolitan transportation authority mission...
TRANSCRIPT
Metropolitan Transportation Authority Mission Statement, Measurements and
Performance Indicator Report Covering Fiscal Year 2011
Submitted as part of the MTA 2011 Annual Report Pursuant to New York State Public Authorities Law Section 2800(1)(a)(3) and 2824-a
Mission Statement, Measurements, and Performance Indicator Report
Covering Fiscal Year 2011
(in compliance with PAL §1269-f and §2824-a)
Metropolitan Transporation Authority
2011 Mission Statement and Performance Review
Page 1
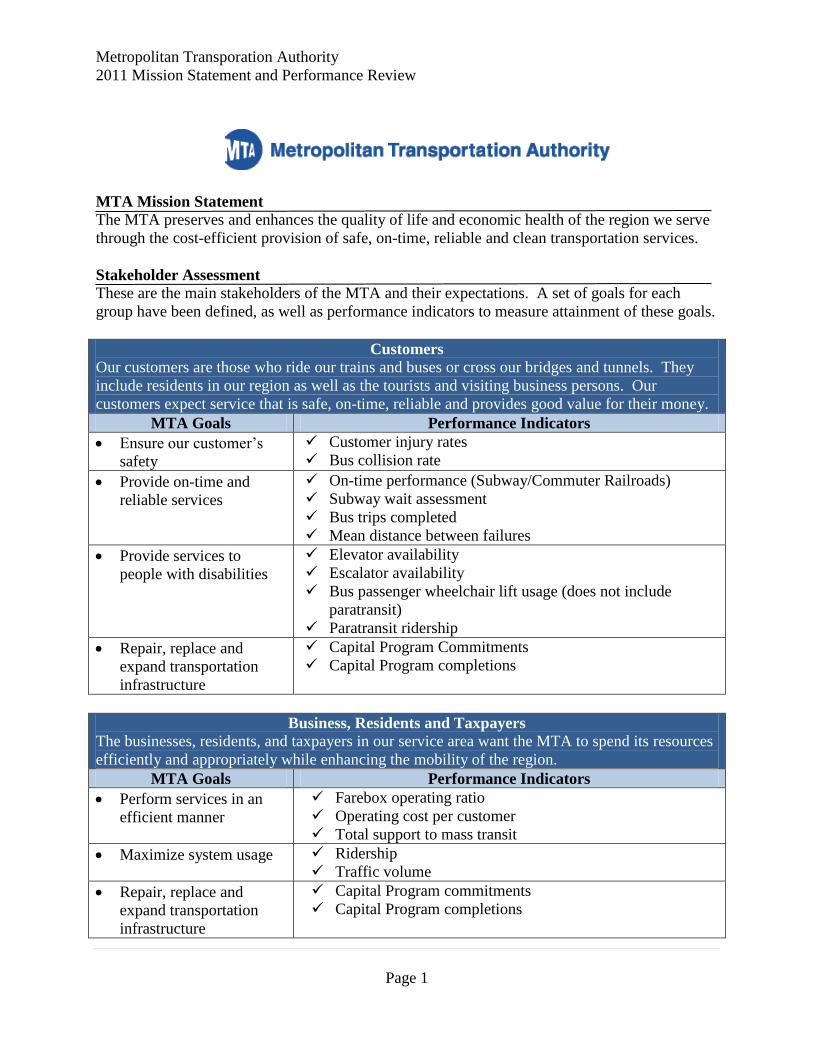
MTA Mission Statement
The MTA preserves and enhances the quality of life and economic health of the region we serve
through the cost-efficient provision of safe, on-time, reliable and clean transportation services.
Stakeholder Assessment These are the main stakeholders of the MTA and their expectations. A set of goals for each
group have been defined, as well as performance indicators to measure attainment of these goals.
Customers Our customers are those who ride our trains and buses or cross our bridges and tunnels. They
include residents in our region as well as the tourists and visiting business persons. Our
customers expect service that is safe, on-time, reliable and provides good value for their money.
MTA Goals Performance Indicators
Ensure our customer’s
safety
Customer injury rates
Bus collision rate
Provide on-time and
reliable services
On-time performance (Subway/Commuter Railroads)
Subway wait assessment
Bus trips completed
Mean distance between failures
Provide services to
people with disabilities
Elevator availability
Escalator availability
Bus passenger wheelchair lift usage (does not include
paratransit)
Paratransit ridership
Repair, replace and
expand transportation
infrastructure
Capital Program Commitments
Capital Program completions
Business, Residents and Taxpayers The businesses, residents, and taxpayers in our service area want the MTA to spend its resources
efficiently and appropriately while enhancing the mobility of the region.
MTA Goals Performance Indicators
Perform services in an
efficient manner
Farebox operating ratio
Operating cost per customer
Total support to mass transit
Maximize system usage Ridership
Traffic volume
Repair, replace and
expand transportation
infrastructure
Capital Program commitments
Capital Program completions
Metropolitan Transporation Authority
2011 Mission Statement and Performance Review
Page 2
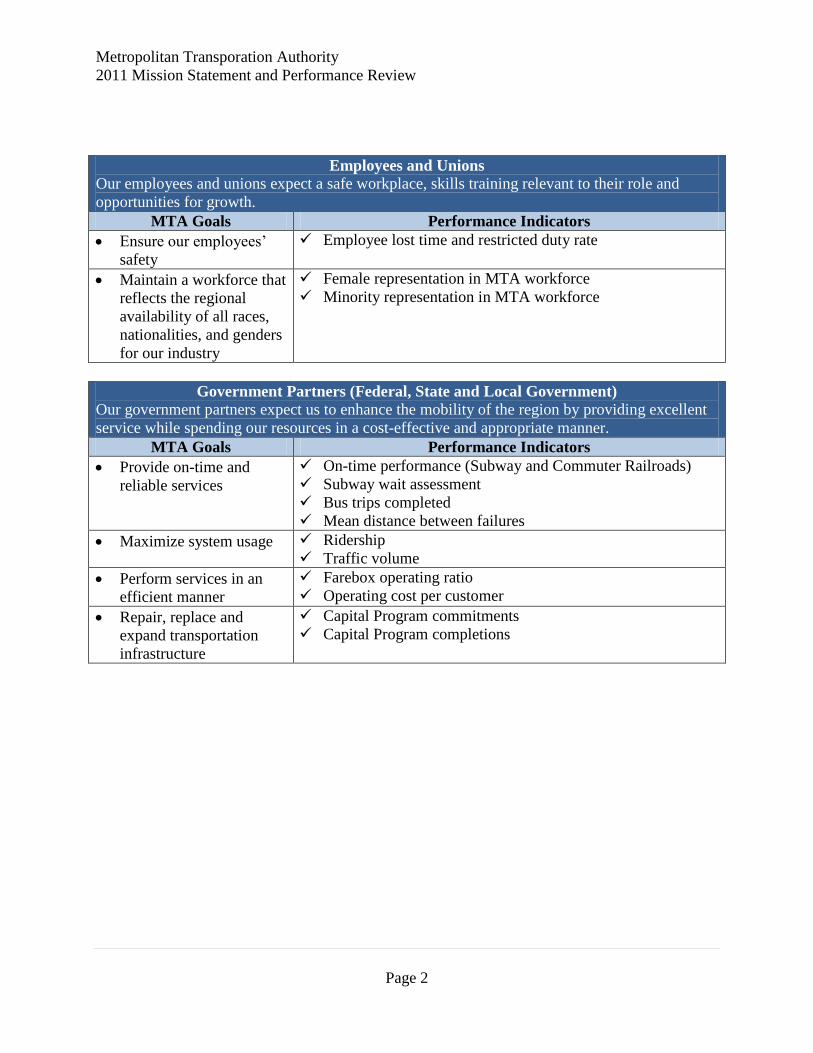
Employees and Unions Our employees and unions expect a safe workplace, skills training relevant to their role and
opportunities for growth.
MTA Goals Performance Indicators
Ensure our employees’
safety
Employee lost time and restricted duty rate
Maintain a workforce that
reflects the regional
availability of all races,
nationalities, and genders
for our industry
Female representation in MTA workforce
Minority representation in MTA workforce
Government Partners (Federal, State and Local Government) Our government partners expect us to enhance the mobility of the region by providing excellent
service while spending our resources in a cost-effective and appropriate manner.
MTA Goals Performance Indicators
Provide on-time and
reliable services
On-time performance (Subway and Commuter Railroads)
Subway wait assessment
Bus trips completed
Mean distance between failures
Maximize system usage Ridership
Traffic volume
Perform services in an
efficient manner
Farebox operating ratio
Operating cost per customer
Repair, replace and
expand transportation
infrastructure
Capital Program commitments
Capital Program completions
Metropolitan Transporation Authority
2011 Mission Statement and Performance Review
Page 3
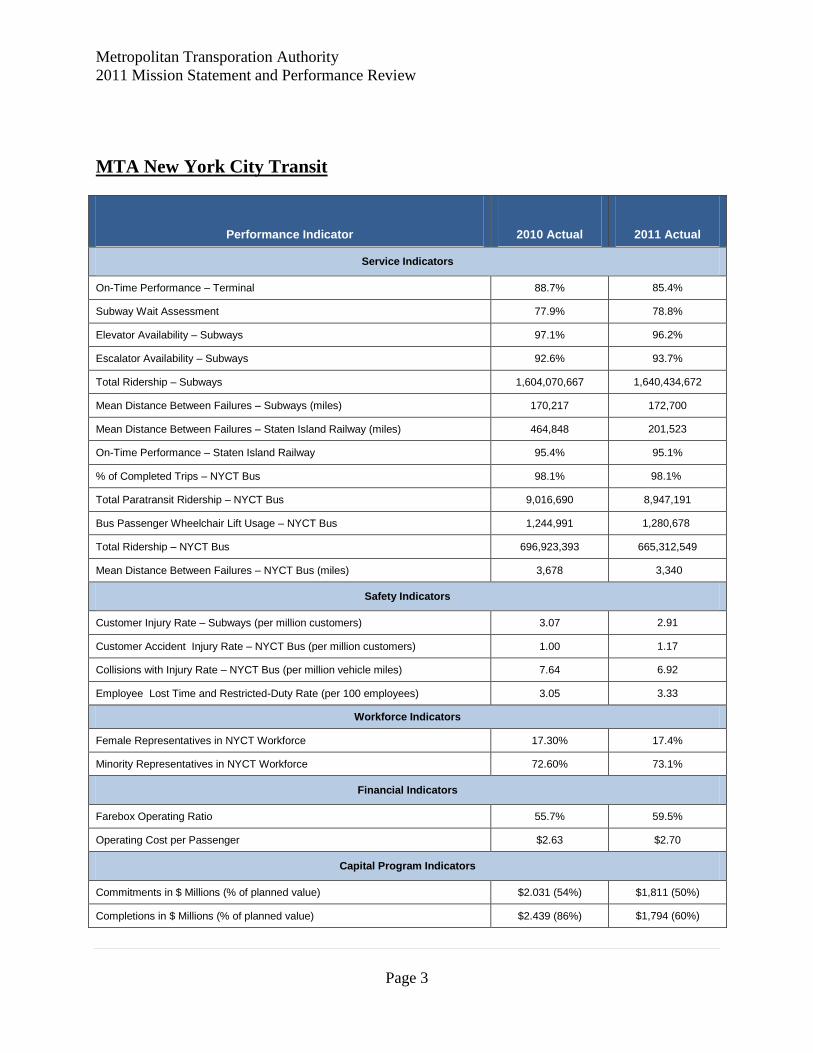
MTA New York City Transit
Performance Indicator 2010 Actual 2011 Actual
Service Indicators
On-Time Performance – Terminal 88.7% 85.4%
Subway Wait Assessment 77.9% 78.8%
Elevator Availability – Subways 97.1% 96.2%
Escalator Availability – Subways 92.6% 93.7%
Total Ridership – Subways 1,604,070,667 1,640,434,672
Mean Distance Between Failures – Subways (miles) 170,217 172,700
Mean Distance Between Failures – Staten Island Railway (miles) 464,848 201,523
On-Time Performance – Staten Island Railway 95.4% 95.1%
% of Completed Trips – NYCT Bus 98.1% 98.1%
Total Paratransit Ridership – NYCT Bus 9,016,690 8,947,191
Bus Passenger Wheelchair Lift Usage – NYCT Bus 1,244,991 1,280,678
Total Ridership – NYCT Bus 696,923,393 665,312,549
Mean Distance Between Failures – NYCT Bus (miles) 3,678 3,340
Safety Indicators
Customer Injury Rate – Subways (per million customers) 3.07 2.91
Customer Accident Injury Rate – NYCT Bus (per million customers) 1.00 1.17
Collisions with Injury Rate – NYCT Bus (per million vehicle miles) 7.64 6.92
Employee Lost Time and Restricted-Duty Rate (per 100 employees) 3.05 3.33
Workforce Indicators
Female Representatives in NYCT Workforce 17.30% 17.4%
Minority Representatives in NYCT Workforce 72.60% 73.1%
Financial Indicators
Farebox Operating Ratio 55.7% 59.5%
Operating Cost per Passenger $2.63 $2.70
Capital Program Indicators
Commitments in $ Millions (% of planned value) $2.031 (54%) $1,811 (50%)
Completions in $ Millions (% of planned value) $2.439 (86%) $1,794 (60%)
Metropolitan Transporation Authority
2011 Mission Statement and Performance Review
Page 4
MTA GOAL: Ensure Customer Safety
PERFORMANCE INDICATORS: Customer Injury Rate
The rate of Subway Customer Injuries declined for the second year in a row.
The 17 percent increase in the Bus Customer Accident Injury rate in 2011 compared to 2010 is
being addressed in several ways, including issues related to the introduction of a variety of new
bus models during the second half of 2011. Supplemental training is being provided to bus
operators, in concert with in-service safety performance observation campaigns.
Although the 9.4 percent decrease in the Collision Injury rate is an improvement, it has been
challenging to interpret performance and establish programs to further improve operations,
because Bus Operations continues to see collisions where the multiple reported injuries are not
necessarily consistent with the circumstances of the accidents. This perspective is shared by the
New York State Public Transportation Safety Board. Specifically, while the PTSB continues to
investigate and report on collisions meeting their threshold criteria of five or more injuries, they
continue to observe a frequent disconnect between the purported injuries sustained in an accident
and the physical evidence at the scene, including a lack of property damage. NYCT vigorously
defends claims that it has reason to believe are without factual basis.
NYC Transit will continue to make every effort to incorporate related findings into its safety and
training initiatives. Most recently, in 2011, it implemented a zero tolerance policy banning cell
phones and other electronic devices for bus operators, in conjunction with an agreement with all
the represented labor unions. NYC Transit has observed an improved compliance rate in
response to its zero tolerance policy.
MTA GOAL: Provide On-Time and Reliable Services
PERFORMANCE INDICATORS: On-Time Performance, Mean Distance Between Failures,
Subway Wait Assessment, Bus Trips Completed
Subway On-time Performance (OTP) declined 3.3 percent in 2011 compared to 2010. The level
of system rebuilding and maintenance work in the subways was increased, which adversely
affected OTP.
Subways Wait Assessment increased 0.9 percent in 2011 compared to 2010 for the same reasons.
The Subways 2011 Subway Mean Distance Between Failure (MDBF) of 172,700 miles
represents a 1.5 percent increase compared to 2010’s MDBF of 170,217. The main reason for
this overall improvement of fleet performance has been the delivery of very reliable R160
subway cars to replace older subway cars that had been experiencing a declining MDBF.
The Staten Island Railway 2011 Mean Distance Between Failure (MDBF) of 201,523 represents
a 56.7 percent decrease as compared to 2010’s MDBF of 464,848. The main reason for this
overall decrease in fleet performance was component failures related to converters and door
systems of the car fleet, which is more than 38 years old.
Metropolitan Transporation Authority
2011 Mission Statement and Performance Review
Page 5
The Bus Mean Distance Between Failures (MDBF) for 2011 was 3,340 miles. This represents a
decrease of 9.2 percent from the 2010 actual of 3,678. Improvements in MDBF were seen in the
fourth quarter as maintenance initiatives started in mid- or late-2011 began to show results.
The Bus Trips Completed result of 98.1 percent remained constant with the 2010 result of 98.1
percent. Trips completed depends on both bus and bus operator availability. Vacancies, coupled
with a higher than anticipated rate of absenteeism, are reflected in the number of trips completed.
MTA GOAL: Provide Services to People with Disabilities
PERFORMANCE INDICATORS: Elevator Availability, Escalator Availability, Bus Passenger
Wheelchair Lift Usage, Paratransit Ridership
Elevator availability decreased by 0.9 percent compared to 2010 due to increased breakdowns
and also because of the preventive maintenance program that was started in March 2011, which
causes increased elevator downtime. As the cycle of increased preventive maintenance reaches
all elevators, availability is expected to increase. The elevator equipment failures requiring
correction included long duration repairs not addressed as preventative maintenance, such as
control valve replacements, door overhauls, and a hydraulic cylinder replacement as well as
repairs to outdated controllers.
Escalator availability increased by 1.1 percent compared to 2010. The increase is attributable to
working continuously on machines that were out for repairs in the second half of 2011,
shortening the length of time equipment was not working. Station closings due to General Orders
(GO's) allowed for work to be done on the equipment. (When the station is out of commission,
the equipment outages do not count against availability.)
Wheelchair ridership of 1.28 million passengers shows an increase of 2.9 percent over 2010 with
monthly increases since April. In 2012, NYCT is scheduled to receive more than 300 new low-
floor buses that provide for easier boarding and more reliable service for wheelchair passengers.
For 2011, a 4.3 percent decrease in Access-A-Ride requests for service was offset by a 26.2
percent decline in No Show Customers, resulting in a 0.8 percent decrease in annual ridership.
MTA GOAL: Repair, Replace, and Expand Transportation Infrastructure
PERFORMANCE INDICATORS: Capital Program Commitments and Completions
In 2011, NYCT committed $1.8 billion, representing 50 percent of the planned 2011
commitment goal of $3.6 billion versus its 2010 performance of 54 percent. The shortfall in
2011 commitments was caused largely by delays in awarding a small number of high value
projects, including the purchase of 300 subway cars ($638 million), the purchase of 104
articulated buses ($81 million), construction of the Mulry Square vent plant ($81 million), and
the VHF Radio System Upgrade ($256 million). In terms of number of projects committed, 93 of
101 projects (92 percent) were awarded in 2011, versus 75 of 95 projects (79 percent) in 2010.
Notable 2011 commitments included the purchase of 769 express buses, providing full ADA
Metropolitan Transporation Authority
2011 Mission Statement and Performance Review
Page 6
accessibility at the Forest Hills-71st Avenue Station on the Queens Boulevard line, construction
of a CBTC Test Track on the Culver line, and the purchase of 103 A Division subway cars and
conversion of 370 R142A cars.
In terms of capital projects completed against established goals, NYCT achieved 60 percent of
the $3.0 billion 2011 completion goal, versus 86 percent in 2011. In terms of number of
projects, 68 percent of the goal of 137 projects was completed in 2011 versus 66 percent of 98
projects in 2010. Notable 2011 completions included the construction of the Charleston Annex
Bus Depot, the rehabilitation of the Columbus Circle Station Complex, rehabilitation of five (5)
stations along with line structure rehabilitation on the Brighton line, the rehabilitation of five (5)
stations on the Pelham Line, construction of ventilation facilities at eight (8) locations on the
Archer Avenue line, the rehabilitation of the East 180th Street yard signals and interlocking on
the Dyre/White Plains Road lines, and the rehabilitation of the Jay Street-Borough Hall Station
in Brooklyn. NYCT’s 2011 Capital Program completion performance was short of its goal by
$1.2 billion mainly due to the delayed completion of several major projects, including B Division
- ATM Network / 253 Stations, PA/CIS Phase 2 at 156 Stations – IRT, 2011 Track & Switch
Program and rehabilitation of five Far Rockaway Line Stations.
MTA GOAL: Perform Services in an Efficient Manner
PERFORMANCE INDICATORS: Farebox Operating Ratio, Operating Cost per Passenger
This preliminary 2011 Farebox Operating Ratio result increase was primarily due to the
December 31, 2010 fare increase.
The Operating Cost per Passenger represents an increase of 2.7 percent, which is very close to
the local inflation rate.
MTA GOAL: Maximize System Usage
PERFORMANCE INDICATORS: Ridership
Subway ridership continued to increase in 2011 and was the highest annual ridership since 1950.
The 2011 subway ridership increase was primarily attributable to the improving New York City
economy.
Bus ridership continued a trend of ridership decreases, worsened by annualization of the 2010
service reductions, severe winter weather, and Tropical Storm Irene.
MTA GOAL: Ensure Our Employees’ Safety
PERFORMANCE INDICATORS: Employee Lost Time and Restricted-Duty Rate
The rate increased in 2011 vs. 2010. Extreme weather conditions in early 2011 contributed to the
higher frequency of some types of employee accidents.
Metropolitan Transporation Authority
2011 Mission Statement and Performance Review
Page 7
MTA GOAL: Maintain a Workforce that Reflects Regional Availability of All Races,
Nationalities, and Genders
PERFORMANCE INDICATORS: Female and Minority Representation in the Workforce
Female representation agency-wide continues to be below the estimated percentage of females
available for work within NYC Transit’s recruiting area. A contributing factor is the low
percentage of females who apply for what are generally considered non-traditional jobs. NYC
Transit will continue to increase its outreach and recruitment efforts to improve female
representation. The percentage of minority representation exceeds the estimated percentage of
minorities available for work within NYC Transit’s recruiting area.
Metropolitan Transporation Authority
2011 Mission Statement and Performance Review
Page 8
MTA Long Island Rail Road
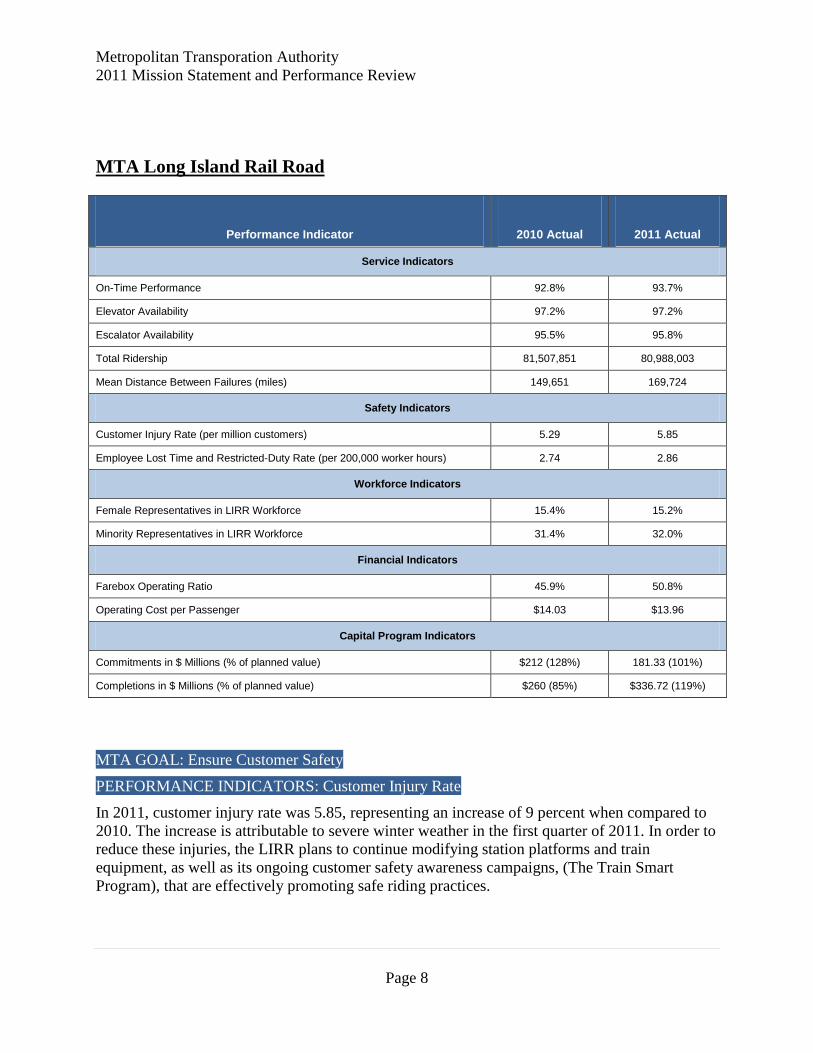
Performance Indicator 2010 Actual 2011 Actual
Service Indicators
On-Time Performance 92.8% 93.7%
Elevator Availability 97.2% 97.2%
Escalator Availability 95.5% 95.8%
Total Ridership 81,507,851 80,988,003
Mean Distance Between Failures (miles) 149,651 169,724
Safety Indicators
Customer Injury Rate (per million customers) 5.29 5.85
Employee Lost Time and Restricted-Duty Rate (per 200,000 worker hours) 2.74 2.86
Workforce Indicators
Female Representatives in LIRR Workforce 15.4% 15.2%
Minority Representatives in LIRR Workforce 31.4% 32.0%
Financial Indicators
Farebox Operating Ratio 45.9% 50.8%
Operating Cost per Passenger $14.03 $13.96
Capital Program Indicators
Commitments in $ Millions (% of planned value) $212 (128%) 181.33 (101%)
Completions in $ Millions (% of planned value) $260 (85%) $336.72 (119%)
MTA GOAL: Ensure Customer Safety
PERFORMANCE INDICATORS: Customer Injury Rate
In 2011, customer injury rate was 5.85, representing an increase of 9 percent when compared to
2010. The increase is attributable to severe winter weather in the first quarter of 2011. In order to
reduce these injuries, the LIRR plans to continue modifying station platforms and train
equipment, as well as its ongoing customer safety awareness campaigns, (The Train Smart
Program), that are effectively promoting safe riding practices.
Metropolitan Transporation Authority
2011 Mission Statement and Performance Review
Page 9
MTA GOAL: Provide On-Time and Reliable Services
PERFORMANCE INDICATORS: On-Time Performance, Mean Distance Between Failures
LIRR OTP for 2011 was 93.7 percent, an increase of 1 percent. OTP had been lower in 2010
following a fire in an important signal tower and numerous severe weather events.
The LIRR’s mean distance between failure (MDBF) performances in 2011 was record setting.
Across the entire fleet MDBF reached 169,724 miles, which was 13.4 percent better than the
2010 MDBF of 149,651 miles. This increase is largely attributable to the efforts of the M3
Performance Improvement Team (which improves performance on LIRR’s oldest fleet) and
initiatives targeting the propulsion system, and the performance of the M7 fleet, which continues
to exceed expectations.
MTA GOAL: Provide Services to People with Disabilities
PERFORMANCE INDICATORS: Elevator Availability, Escalator Availability
The LIRR has increased its focus on maintaining the operability of its elevators and escalators
and 2011 performance reflects the strength of this effort. Elevator availability remained steady at
97.2 percent in both 2010 and 2011. Escalator availability improved slightly from 95.5 percent in
2010 to 95.8 percent in 2011. The LIRR now reports on the daily service status of elevators and
escalators on its website.
MTA GOAL: Repair, Replace, and Expand Transportation Infrastructure
PERFORMANCE INDICATORS: Capital Program Commitments and Completions
The LIRR’s 2011 capital commitments totaled $183 million, $4 million greater than had been
anticipated in the original five-year plan, and 102 percent of goal. Commitments that exceeded
the anticipated plan expenditures included the new elevators for Queens Village Station, and a
design for a pocket track at Massapequa.
The LIRR’s 2011 capital completions totaled $337.7 million, or 118 percent of the planned
amount. Phase IIb of the Atlantic Avenue Viaduct, ACL Direct Fixation, and the Port
Washington Branch Walls projects were completed.
MTA GOAL: Perform Services in an Efficient Manner
PERFORMANCE INDICATORS: Farebox Operating Ratio, Operating Cost per Passenger
The LIRR’s farebox operating ratio increased from 46.1 percent in 2010 to 50.8 percent in 2011.
This increase reflects the increase in farebox revenue stemming from the December 30, 2010
fare increase, offset by a slight reduction in ridership from 2010 to 2011 of approximately 0.7
percent.
The LIRR’s operating cost per passenger in 2011 of $13.96 was essentially unchanged from the
2010 level of $13.97. Total 2011 expenses were 0.3 percent below 2010 levels. This
Metropolitan Transporation Authority
2011 Mission Statement and Performance Review
Page 10
demonstrates that the LIRR has maintained the cost reduction initiatives that were started in
2010, including reduced administrative headcount, overtime and inventory controls.
MTA GOAL: Maximize System Usage
PERFORMANCE INDICATORS: Ridership
The LIRR’s overall ridership in 2011 dipped slightly lower than 2010 adjusted ridership
(adjusted for workday differences with 2011) by 0.5 percent – going from 81.4 million riders in
2010 to 81.0 million in 2011. This decrease was due to the significant amount of severe weather
experienced all year, including snow, ice, lightning and Tropical Storm Irene. LIRR is
developing a positive trend, with four consecutive months of ridership increases at the end of
2011. Ridership during September through December increased by 2.2 percent over the same
period in the prior year – going from 27.2 million riders in 2010 to 27.8 in 2011, carrying about
600,000 more passengers.
MTA GOAL: Ensure Our Employees’ Safety
PERFORMANCE INDICATORS: Employee Lost Time and Restricted-Duty Rate
The Employee Lost Time and Restricted Duty Rate based on reported incidents per 200,000
worker hours increased from 2.74 in 2010 to 2.86 in 2011. The LIRR has initiated a multi-
faceted plan to address the increase. The plan includes: updating and re-instituting several
successful safety programs and initiatives; providing more focused analysis and reporting to all
levels of management staff; improving the roadway worker protection program, and
implementing Project FOCUS to increase awareness and reduce incidents resulting from
distracting activities.
MTA GOAL: Maintain a Workforce that Reflects Regional Availability of All Races,
Nationalities, and Genders
PERFORMANCE INDICATORS: Female and Minority Representation in the Workforce
The percentage of minority representation exceeded the estimated percentage of minorities
available in LIRR’s recruiting area. The percentage of female representation continues to be
below the estimated percentage of females available for work. Many of the vacancies that
occurred during 2011 are generally considered to be non-traditional for females; as a result, there
are a low percentage of females applying for these positions. LIRR has developed an aggressive
outreach and recruitment strategy to attract qualified females for non-traditional positions.
Metropolitan Transporation Authority
2011 Mission Statement and Performance Review
Page 11
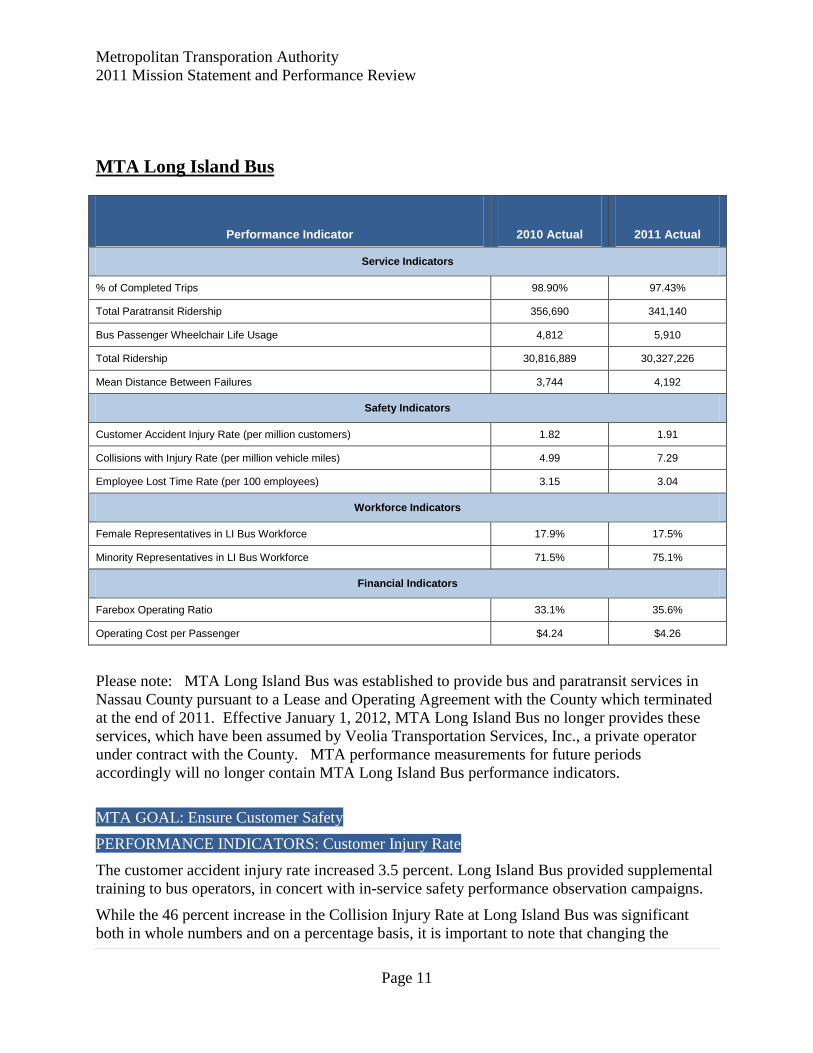
MTA Long Island Bus
Performance Indicator 2010 Actual 2011 Actual
Service Indicators
% of Completed Trips 98.90% 97.43%
Total Paratransit Ridership 356,690 341,140
Bus Passenger Wheelchair Life Usage 4,812 5,910
Total Ridership 30,816,889 30,327,226
Mean Distance Between Failures 3,744 4,192
Safety Indicators
Customer Accident Injury Rate (per million customers) 1.82 1.91
Collisions with Injury Rate (per million vehicle miles) 4.99 7.29
Employee Lost Time Rate (per 100 employees) 3.15 3.04
Workforce Indicators
Female Representatives in LI Bus Workforce 17.9% 17.5%
Minority Representatives in LI Bus Workforce 71.5% 75.1%
Financial Indicators
Farebox Operating Ratio 33.1% 35.6%
Operating Cost per Passenger $4.24 $4.26
Please note: MTA Long Island Bus was established to provide bus and paratransit services in
Nassau County pursuant to a Lease and Operating Agreement with the County which terminated
at the end of 2011. Effective January 1, 2012, MTA Long Island Bus no longer provides these
services, which have been assumed by Veolia Transportation Services, Inc., a private operator
under contract with the County. MTA performance measurements for future periods
accordingly will no longer contain MTA Long Island Bus performance indicators.
MTA GOAL: Ensure Customer Safety
PERFORMANCE INDICATORS: Customer Injury Rate
The customer accident injury rate increased 3.5 percent. Long Island Bus provided supplemental
training to bus operators, in concert with in-service safety performance observation campaigns.
While the 46 percent increase in the Collision Injury Rate at Long Island Bus was significant
both in whole numbers and on a percentage basis, it is important to note that changing the
Metropolitan Transporation Authority
2011 Mission Statement and Performance Review
Page 12
definition of a collision injury event for consistency with NYCT and MTA Bus skewed the
comparison. Moreover, as with the other two bus entities, it was challenging to interpret
performance and establish programs to further improve operations, because bus operations
continued to see collisions where the multiple injuries reported were not necessarily consistent
with the circumstances of the accidents. As noted for NYCT Bus and MTA Bus, the New York
State Public Transportation Safety Board shared this perspective concerning this disconnect, and
continued to both report on incidents that met their threshold criteria and to monitor trends. Like
NYCT and MTA Bus, Long Island Bus vigorously defends claims that it has reason to believe
are without factual basis.
Also, in 2011, Long Island Bus implemented a zero tolerance policy banning cell phones and
other electronic devices for bus operators, in conjunction with an agreement with all the
represented labor unions. The company observed an improved compliance rate in response to its
zero tolerance policy.
MTA GOAL: Provide On-Time and Reliable Services
PERFORMANCE INDICATORS: Mean Distance Between Failures, Bus Trips Completed
The 2011 Mean Distance Between Failures (MDBF) was 4,192, which is 12.0 percent better than
the 2010 actual of 3,744. New buses delivered in 2011 contributed to the improved MDBF
result.
In 2011, Trips Completed dropped slightly by 1.5 percent to 97.43, from the 2010 result of 98.9
percent. Bus Trips Completed depends on both bus and bus operator availability. Accordingly,
Trips Completed performance was adversely affected in the latter months of 2011 as both bus
and bus operator availability were hindered by the preparation for Nassau County’s transition of
the bus operation to a private operator effective January 1, 2012.
MTA GOAL: Provide Services to People with Disabilities
PERFORMANCE INDICATORS: Bus Passenger Wheelchair Lift Usage, Paratransit Ridership
Wheelchair ridership of 5,910 passengers shows a 22.8 percent increase over 2010. Except for
April, 2011 wheelchair ridership showed increases each month over 2010 levels. New bus
deliveries have provided for easier boarding and more reliable service resulting in increased
wheelchair ridership.
For 2011, a 4.5 percent decrease in Able-Ride requests for Service was offset by a 37.9 percent
decline in No Show Customers, which resulted in a 4.4 percent decrease in annual ridership. The
year-end ridership of 341,140 Able-Ride riders was down from 356,690 million riders in 2010.
Metropolitan Transporation Authority
2011 Mission Statement and Performance Review
Page 13
MTA GOAL: Maximize System Usage
PERFORMANCE INDICATORS: Ridership
Total ridership decreased by 1.6 percent (118.3 million riders in 2011, compared to 120.2 million
in 2010). Bus ridership was negatively affected by severe winter weather and Tropical Storm
Irene.
MTA GOAL: Perform Services in an Efficient Manner
PERFORMANCE INDICATORS: Farebox Operating Ratio, Operating Cost per Passenger
The farebox operating ratio was 35.6 percent in 2011, compared to 33.1 percent in 2010. The
increase of 2.5 percent is mainly due to a decrease of $3.0 million in operating expenses and an
increase of $2.2 million in farebox revenues. The decrease in operating costs is attributable to
vacancies that were not backfilled in anticipation of the transfer of Long Island Bus operations.
The increase in revenue is mainly due to an increase in the average fare that resulted from the
December 2010 fare increase.
MTA GOAL: Ensure Our Employees’ Safety
PERFORMANCE INDICATORS: Employee Lost Time and Restricted-Duty Rate
The 12-month rate for Employee On-Duty Lost-Time Accidents was 3.5 percent lower than in
2010, and overall performance in complying with on-the-job injury protocols during the
reporting period was positive. In order to improve employee accident prevention, LI Bus
informed employees of critical safety subject matter relevant to their job responsibilities,
reassessed existing safety rules and procedures, audited work tasks through direct observations
of employees in the workplace, critiqued hazards in the employee work environment, and
provided new and refresher training to ensure the workforce had the appropriate skill set.
MTA GOAL: Maintain a Workforce that Reflects Regional Availability of All Races,
Nationalities, and Genders
PERFORMANCE INDICATORS: Female and Minority Representation in the Workforce
The percentage of females and minorities in LIB’s workforce exceeded the estimated availability
of females and minorities in its recruiting area.
Metropolitan Transporation Authority
2011 Mission Statement and Performance Review
Page 14
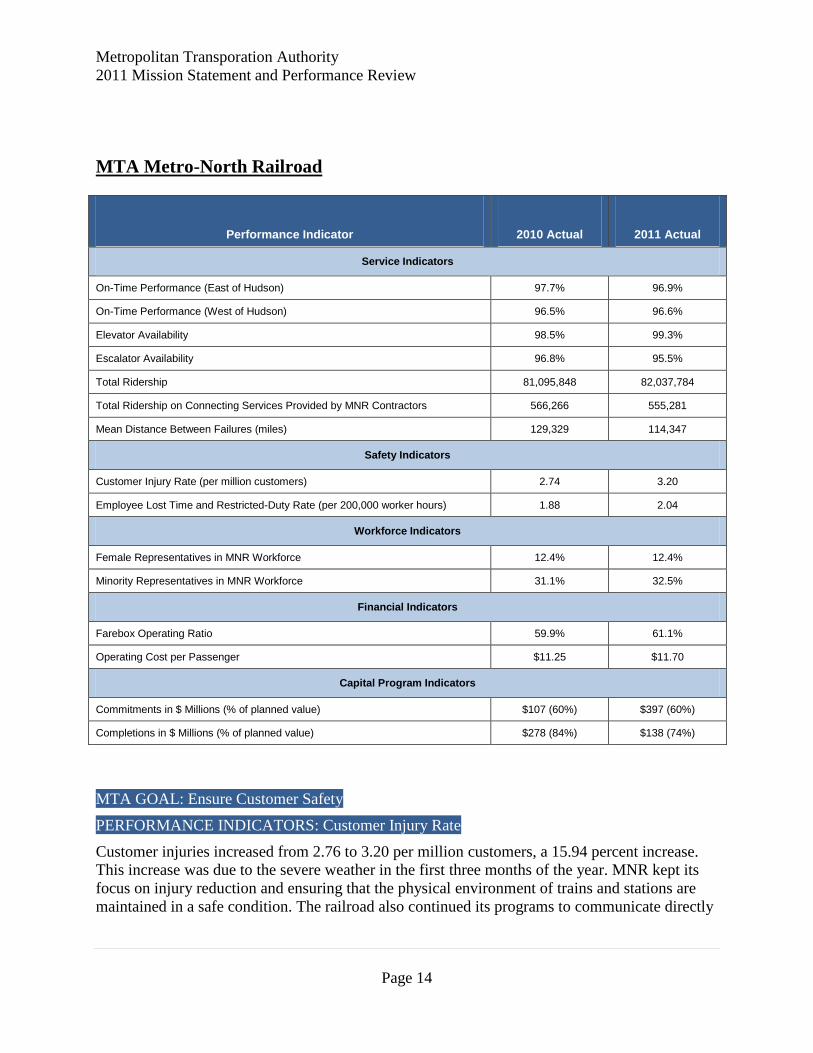
MTA Metro-North Railroad
Performance Indicator 2010 Actual 2011 Actual
Service Indicators
On-Time Performance (East of Hudson) 97.7% 96.9%
On-Time Performance (West of Hudson) 96.5% 96.6%
Elevator Availability 98.5% 99.3%
Escalator Availability 96.8% 95.5%
Total Ridership 81,095,848 82,037,784
Total Ridership on Connecting Services Provided by MNR Contractors 566,266 555,281
Mean Distance Between Failures (miles) 129,329 114,347
Safety Indicators
Customer Injury Rate (per million customers) 2.74 3.20
Employee Lost Time and Restricted-Duty Rate (per 200,000 worker hours) 1.88 2.04
Workforce Indicators
Female Representatives in MNR Workforce 12.4% 12.4%
Minority Representatives in MNR Workforce 31.1% 32.5%
Financial Indicators
Farebox Operating Ratio 59.9% 61.1%
Operating Cost per Passenger $11.25 $11.70
Capital Program Indicators
Commitments in $ Millions (% of planned value) $107 (60%) $397 (60%)
Completions in $ Millions (% of planned value) $278 (84%) $138 (74%)
MTA GOAL: Ensure Customer Safety
PERFORMANCE INDICATORS: Customer Injury Rate
Customer injuries increased from 2.76 to 3.20 per million customers, a 15.94 percent increase.
This increase was due to the severe weather in the first three months of the year. MNR kept its
focus on injury reduction and ensuring that the physical environment of trains and stations are
maintained in a safe condition. The railroad also continued its programs to communicate directly
Metropolitan Transporation Authority
2011 Mission Statement and Performance Review
Page 15
with customers by printing safety reminders in customer publications and the Internet. The
railroad’s community Safety Awareness Program also continued in 2011.
MTA GOAL: Provide On-Time and Reliable Services
PERFORMANCE INDICATORS: On-Time Performance, Mean Distance Between Failures
At 96.9 percent, systemwide on-time performance for 2011 fell below 2010’s 97.7 percent.
Performance was most affected by the effect of the harsh and snowy winter in the first part of the
year on the aging cars which make up the New Haven Line fleet. At the worst point of the
winter, half of the New Haven Line’s electric cars were out of service, resulting in overcrowded
trains and diminished on-time performance. Compounding this problem was the significant
operating constraint caused by the continued replacement of the over-age system that powers
New Haven Line trains in the state of Connecticut.
Fleet MDBF was 114,347, below 2010’s 129,329, due to the same factors that affected OTP.
Of special note, after Tropical Storm Irene washed out the Port Jervis Line in late August, Metro-
North with the aid of its partners at MTA Bus and NJ TRANSIT, developed and implemented a
multi-staged bus operation providing service to Port Jervis Line stations. By September 19,
partial train service was restored, with full service restored on the line by November 28.
MTA GOAL: Provide Services to People with Disabilities
PERFORMANCE INDICATORS: Elevator Availability, Escalator Availability
At 99.3 percent, MNR’s elevator availability improved over 2010’s already high service level.
The rehabilitation and upgrade of ten passenger elevators in Grand Central to meet current life
safety codes and ADA Requirements was also completed.
Escalator availability dropped slightly to 95.5 percent. MNR is working with its vendor for
escalator repair – in particular in Grand Central Terminal – to improve maintenance practices so
that there will be better availability in 2012. In addition to ensuring that elevators and escalators
are functioning as intended, MNR posts the current status of station elevators and escalators
online.
MTA GOAL: Repair, Replace, and Expand Transportation Infrastructure
PERFORMANCE INDICATORS: Capital Program Commitments and Completions
Numeric measures for commitments and completions came in at 60 percent and 74 percent of
goal, respectively. In addition to the significant and unanticipated work to return the Port Jervis
Line to operation, important milestones were also reached for planned projects. Various options
were exercised to purchase an additional 105 M-8 cars for service on the New Haven Line.
However, three significant signaling projects were delayed due to a combination of Positive
Train Control issues (while federally mandated, the technology that will drive this project has not

Metropolitan Transporation Authority
2011 Mission Statement and Performance Review
Page 16
been completely defined) and restoration of damage caused by Tropical Storm Irene, while
several other projects were delayed due to enhanced scope and justification reviews.
Completions included the acceptance of 60 new M-8 cars for service on the New Haven line
newly built Fairfield Metro Station (service began December 5), rehabilitation of Port Chester,
Tarrytown, Mamaroneck and Fordham, station building improvements at Poughkeepsie, the first
phase of rehabilitation at Port Chester and Rye stations and the Grand Central Terminal
Employee Facility Rehabilitation Project. The shortfall in completions, in part was caused by the
fact that one of the bridges in the Undergrade Bridge project could not be completed with in-
house forces as planned and had to be re-packaged for third party construction. The Tagging
relay project was delayed due to the incorporation of site specific modifications that were
required for several of the relays.
MTA GOAL: Perform Services in an Efficient Manner
PERFORMANCE INDICATORS: Farebox Operating Ratio, Operating Cost per Passenger
Fare Operating Ratio increased by 2.1 percent in 2011 vs. 2010. The favorable increase is due to
higher farebox revenues from the 2011 NYS fare increase (6.3 percent) and higher ridership (1.2
percent), offset by expense increases related to higher overtime for weather emergency coverage
incurred, Port Jervis Line alternate service and repair costs due to damage from Tropical Storm
Irene, rising employee benefit costs, and spiraling diesel fuel prices.
Cost per Passenger increased by $0.29 in 2011 vs. 2010. The unfavorable increase is due to
higher expenses related to overtime coverage for weather emergencies, Port Jervis Line alternate
service and repair costs due to damage from Tropical Storm Irene, rising employee benefit costs,
and spiraling diesel fuel prices. These increases are offset by ridership growth of 1.2 percent.
MTA GOAL: Maximize System Usage
PERFORMANCE INDICATORS: Ridership
Total Metro-North system ridership in 2011 was approximately 82 million rides – a 1.4 percent
increase vs. 2010, making it the busiest commuter railroad in the nation. This increase occurred
despite a series of snowstorms in January, an unprecedented three-day shutdown of service due
to Tropical Storm Irene in August, and a significant snowstorm that curtailed service in late
October. Factors contributing to the increase were the stirring of an economic recovery in the
region and the high prices of gasoline, parking, and tolls.
MTA GOAL: Ensure Our Employees’ Safety
PERFORMANCE INDICATORS: Employee Lost Time and Restricted-Duty Rate
Total injuries for 2011 were 13 percent over 2010’s totals. The results were greatly affected by
the major snowstorms in January, which led to a 400 percent increase in injuries for that month
alone. MNR continues to press forward with its Local Safety Committee structure. These groups
Metropolitan Transporation Authority
2011 Mission Statement and Performance Review
Page 17
perform yard walks and inspections in their districts and promote the “I’m a Lifesaver” concept
of peer-to-peer responsibility for identifying and eliminating unsafe behavior. District-wide
meetings held twice a year were also implemented in 2011 to promote the exchange of ideas and
best safety practices among local committees. Successful Safety Accident Prevention Programs
continued and were expanded in 2011, and all departments and districts were directed to enhance
the Job Safety Briefings that are conducted every day.
MTA GOAL: Maintain a Workforce that Reflects Regional Availability of All Races,
Nationalities, and Genders
PERFORMANCE INDICATORS: Female and Minority Representation in the Workforce
The percentage of minority representation exceeded the estimated percentage of minorities
available for work within MNR’s recruiting area. However, the percentage of female
representation remains below the estimated percentage of females available for work within
MNR’s recruitment area due to a variety of reasons. MNR will continue its outreach and
recruitment efforts to attract qualified females.
Metropolitan Transporation Authority
2011 Mission Statement and Performance Review
Page 18
MTA Bridges and Tunnels
Performance Indicator 2010 Actual 2011 Actual
Service Indicators
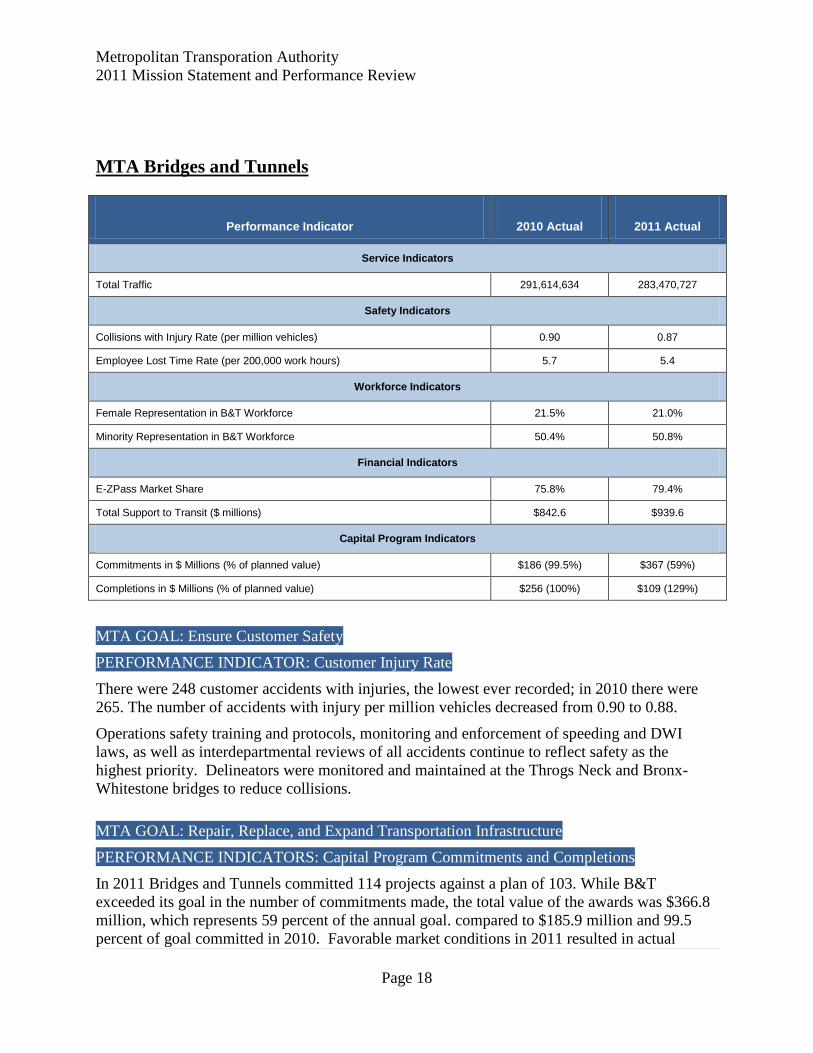
Total Traffic 291,614,634 283,470,727
Safety Indicators
Collisions with Injury Rate (per million vehicles) 0.90 0.87
Employee Lost Time Rate (per 200,000 work hours) 5.7 5.4
Workforce Indicators
Female Representation in B&T Workforce 21.5% 21.0%
Minority Representation in B&T Workforce 50.4% 50.8%
Financial Indicators
E-ZPass Market Share 75.8% 79.4%
Total Support to Transit ($ millions) $842.6 $939.6
Capital Program Indicators
Commitments in $ Millions (% of planned value) $186 (99.5%) $367 (59%)
Completions in $ Millions (% of planned value) $256 (100%) $109 (129%)
MTA GOAL: Ensure Customer Safety
PERFORMANCE INDICATOR: Customer Injury Rate
There were 248 customer accidents with injuries, the lowest ever recorded; in 2010 there were
265. The number of accidents with injury per million vehicles decreased from 0.90 to 0.88.
Operations safety training and protocols, monitoring and enforcement of speeding and DWI
laws, as well as interdepartmental reviews of all accidents continue to reflect safety as the
highest priority. Delineators were monitored and maintained at the Throgs Neck and Bronx-
Whitestone bridges to reduce collisions.
MTA GOAL: Repair, Replace, and Expand Transportation Infrastructure
PERFORMANCE INDICATORS: Capital Program Commitments and Completions
In 2011 Bridges and Tunnels committed 114 projects against a plan of 103. While B&T
exceeded its goal in the number of commitments made, the total value of the awards was $366.8
million, which represents 59 percent of the annual goal. compared to $185.9 million and 99.5
percent of goal committed in 2010. Favorable market conditions in 2011 resulted in actual
Metropolitan Transporation Authority
2011 Mission Statement and Performance Review
Page 19
awards being $254.5 million less than their planned values. Major project commitments in 2011
include: deck replacement of the Bronx-Whitestone Bridge Queens elevated and on-grade
approach; design services and utility relocation for the deck replacement of the Bronx/Manhattan
ramps and toll plaza of the Robert F. Kennedy Bridge; rehabilitation of the orthotropic deck-
phase B, and painting as well as suspended span repairs and painting at the Throgs Neck Bridge;
east- and west-bound toll plaza ramp improvements at the Verrazano-Narrows Bridge; structural
rehabilitation of the Henry Hudson Bridge; and the replacement of the RFK Harlem River Drive
Ramp, B&T’s first application of a Design/Build contract to an infrastructure project.
In 2011 a total of $108.5 million was completed, against a plan of $84.1 million, 129 percent of
the goal. In 2010 a total of $256.1 million was completed, representing 100 percent of the goal.
Major projects completed in 2011 included replacement of T-48 wearing surface on the Robert
F. Kennedy Bridge, ramp replacement at the RFK Harlem River Drive, and replacement of the
concrete deck on the Throgs Neck Bridge. Additionally, project AW52, Advanced Automated
Traffic Detection System, was completed in December for a project value of $2.9 million.
MTA GOAL: Perform Services in an Efficient Manner
PERFORMANCE INDICATORS: Total Support to Transit
A total of $939.6 million in surplus revenue was provided for transit services, the second highest
amount ever. The highest was $983.3 million in 2000, which included $340 million from the
agency's sale of the Coliseum Complex.
MTA GOAL: Maximize System Usage
PERFORMANCE INDICATORS: Traffic Volume
The total of 283.5 million trips was down from 291.7 million in 2010, and the E-ZPass market
share reached a high of 79.4 percent, compared to 75.8 percent the previous year. High gas
prices, severe weather, and a toll increase contributed to the reduction in total traffic.
MTA GOAL: Ensure Our Employees’ Safety
PERFORMANCE INDICATORS: Employee Lost Time and Restricted-Duty Rate
There were 87 lost-time injuries, a decrease from 95 in 2010; with the rate of injuries per
200,000 work hours decreasing from 5.7 to 5.4. Analysis of the injury accidents, which were
overwhelmingly slips, trips and falls, did not reveal any pattern or hazardous condition. Health
and Safety staff is working closely with facility managers and has increased safety inspections.
Employee safety programs included communicating prevention of injuries through roll call
discussions, safety meetings, safety audits, safety interactions, and incident investigations by
supervisory personnel. Bridges and Tunnels has invited unions to participate in partnership to
reduce injuries and address specific safety concerns.
Metropolitan Transporation Authority
2011 Mission Statement and Performance Review
Page 20
MTA GOAL: Maintain a Workforce that Reflects Regional Availability of All Races,
Nationalities, and Genders
PERFORMANCE INDICATORS: Female and Minority Representation in the Workforce
The percentage of minority representation exceeds the estimated percentage of minorities
available for work within B&T recruiting area. The percentage of female representation
continues to remain below the estimated percentage of females available for work due to
attrition. B&T will continue its outreach and recruitment efforts to attract qualified females.

Metropolitan Transporation Authority
2011 Mission Statement and Performance Review
Page 21
MTA Bus Company
Performance Indicator 2010 Actual 2011 Actual
Service Indicators
% of Completed Trips 97.97% 97.42%
Bus Passenger Wheelchair Life Usage 45,270 42,935
Total Ridership 120,226,876 118,281,292
Mean Distance Between Failures 3,438 3,430
Safety Indicators
Customer Accident Injury Rate (per million customers) 1.29 1.54
Collisions with Injury Rate (per million vehicle miles) 5.96 4.72
Employee Lost Time Rate (per 100 employees) 9.47 8.49
Workforce Indicators
Female Representatives in MTA Bus Workforce 12.6% 12.3%
Minority Representatives in MTA Bus Workforce 66.0% 67.0%
Financial Indicators
Farebox Operating Ratio 36.9% 36.8%
Operating Cost per Passenger $4.09 $4.42
Capital Program Indicators
Commitments in $ Millions (% of planned value) $51 (36%) $113.3 (63.6%)
Completions in $ Millions (% of planned value) $64 (80%) $7.5 (12.7%)
MTA GOAL: Ensure Customer Safety
PERFORMANCE INDICATORS: Customer Injury Rate
The 19.4 percent increase in the Customer Accident Injury rate in 2011 compared to 2010 is
being addressed. Supplemental training is being provided to bus operators, in concert with in-
service safety performance observation campaigns.
Although the 21 percent decrease in the Collision Injury rate is an improvement, it has been
challenging to both interpret performance and establish programs to further improve operations,
because (as noted also for NYCT Bus and Long Island Bus) bus operations continued to see
collisions where the multiple reported injuries are not necessarily consistent with the
circumstances of the accidents. This perspective is shared by the New York State Public
Transportation Safety Board. Specifically, while the PTSB continues to investigate and report on
Metropolitan Transporation Authority
2011 Mission Statement and Performance Review
Page 22
collisions meeting their threshold criteria of five or more injuries, they continue to observe a
frequent disconnect between purported injuries sustained and the physical evidence at the scene
of the accident, including a lack of property damage. Like NYCT and Long Island Bus, MTA
Bus vigorously defends claims that it has reason to believe are without factual basis.
MTA Bus will continue to make every effort to incorporate related findings into its safety and
training initiatives. Most recently, in 2011, MTA Bus implemented a zero tolerance policy
banning cell phones and other electronic devices for bus operators, in conjunction with an
agreement with all the represented labor unions. The company has observed an improved
compliance rate in response to its zero tolerance policy.
MTA GOAL: Provide On-Time and Reliable Services
PERFORMANCE INDICATORS: Mean Distance Between Failures, Bus Trips Completed
The Mean Distance Between Failures (MDBF) for 2011 was 3,430 miles. This represents a slight
decrease of 0.3 percent from the 2010 actual of 3,438. The year-end fleet age increased from
6.70 to 7.32 years, with buses 12 years and older increasing slightly to 26 percent of the fleet.
However, improvements in MDBF were seen in the fourth quarter of 2011 as maintenance
initiatives started in mid- to late-2011 began to show results.
Trips Operated depend on both bus and bus operator availability. In 2011, there was a slight
decline of 0.6 percent in Trips Operated. Trips completed depends on both bus and bus operator
availability. Vacancies, coupled with a higher than anticipated rate of absenteeism, are reflected
in the number of trips completed.
MTA GOAL: Provide Services to People with Disabilities
PERFORMANCE INDICATORS: Bus Passenger Wheelchair Lift Usage
Wheelchair ridership of 42,935 million passengers shows a decrease of 5.2 percent from 2010.
The decline is attributable primarily to inclement weather that caused significant drops in
wheelchair ridership in January, August, and September.
MTA GOAL: Repair, Replace, and Expand Transportation Infrastructure
PERFORMANCE INDICATORS: Capital Program Commitments and Completions
In 2011, MTA Bus committed $113.3 million in capital projects. This represents 63.6 percent of
planned commitments, compared to 36.0 percent in 2010. The planned commitments not
achieved in 2011 primarily consist of a few facility projects that were pushed from 2011 to 2012.
In terms of projects committed, 11 of 18 (61 percent) were awarded in 2011 compared to 6 of 14
(42 percent) in 2010. Notable 2011 commitments include the award of 79 CNG buses in June,
the award of 74 CNG buses in December, and the roof and ventilation project at JFK Depot.
Metropolitan Transporation Authority
2011 Mission Statement and Performance Review
Page 23
In 2011 MTA Bus completed $7.5 million in capital projects. This represents 12.7 percent of
planned completions, compared to 80.3 percent in 2010. The reduced performance in 2011 is
primarily a result of four roofing projects that were delayed until 2012.
MTA GOAL: Perform Services in an Efficient Manner
PERFORMANCE INDICATORS: Farebox Operating Ratio, Operating Cost per Passenger
The farebox operating ratio was 36.8 percent in 2011, compared to 36.9 percent in 2010. The 0.1
percent decrease is mainly due to an increase of 6.4 percent in operating expenses, offset by an
increase in revenue of 6.1 percent. The increase in operating expenses is primarily attributable to
retroactive payments for collective bargaining. Higher pension, health, and welfare costs added
to operating expenses. The increase in revenue is mainly due to an increase in the average fare
resulting from the December 2010 fare increase.
The operating cost per customer was $4.42 in 2011, compared to $4.09 in 2010. The $0.33
increase is the result of increased operating costs combined with reduced ridership.
MTA GOAL: Maximize System Usage
PERFORMANCE INDICATORS: Ridership
Total Ridership decreased by 1.6 percent (118.3 million riders in 2011, compared to 120.2
million in 2010). Bus ridership was negatively affected by severe winter weather and Tropical
Storm Irene.
MTA GOAL: Ensure Our Employees’ Safety
PERFORMANCE INDICATORS: Employee Lost Time and Restricted-Duty Rate
The annual rate for Employee On-Duty Lost-Time Accidents was 10.3 percent lower for 2011
compared to 2010, and overall performance in complying with on-the-job injury protocols during
the reporting period was positive. In order to improve employee accident performance, MTA
Bus continues to inform employees of critical safety information relevant to their job
responsibilities, reassess existing safety rules and procedures, audit work tasks through direct
observations of employees in the workplace, critique hazards in the employee work environment,
and provide new and refresher training to ensure the workforce has the appropriate skill set.
MTA GOAL: Maintain a Workforce that Reflects Regional Availability of All Races,
Nationalities, and Genders
PERFORMANCE INDICATORS: Female and Minority Representation in the Workforce
The percentage of minority representation continues to exceed the estimated percentage of
minorities available for work within MTA Bus recruitment area. The percentage of female
representation continues to be below the estimated percentage of females available for work as a
result of the low percentage of female applicants. A majority of the positions filled at MTA Bus
Metropolitan Transporation Authority
2011 Mission Statement and Performance Review
Page 24
are positions that are generally considered non-traditional for females. MTA Bus will increase its
recruitment and outreach efforts to attract qualified females.
Metropolitan Transporation Authority
2011 Mission Statement and Performance Review
Page 25
MTA Capital Construction
Performance Indicator 2010 Actual 2011 Actual
Workforce Indicators
Female Representatives in MTACC Workforce 28.6% 28.2%
Minority Representatives in MTACC Workforce 51.2% 51.6%
Capital Program Indicators
Commitments in $ Billions (% of planned value) $1.75B (75%) $1.86B (63%)
Completions in $ Millions (% of planned value) $160M (50%) $387M (83%)
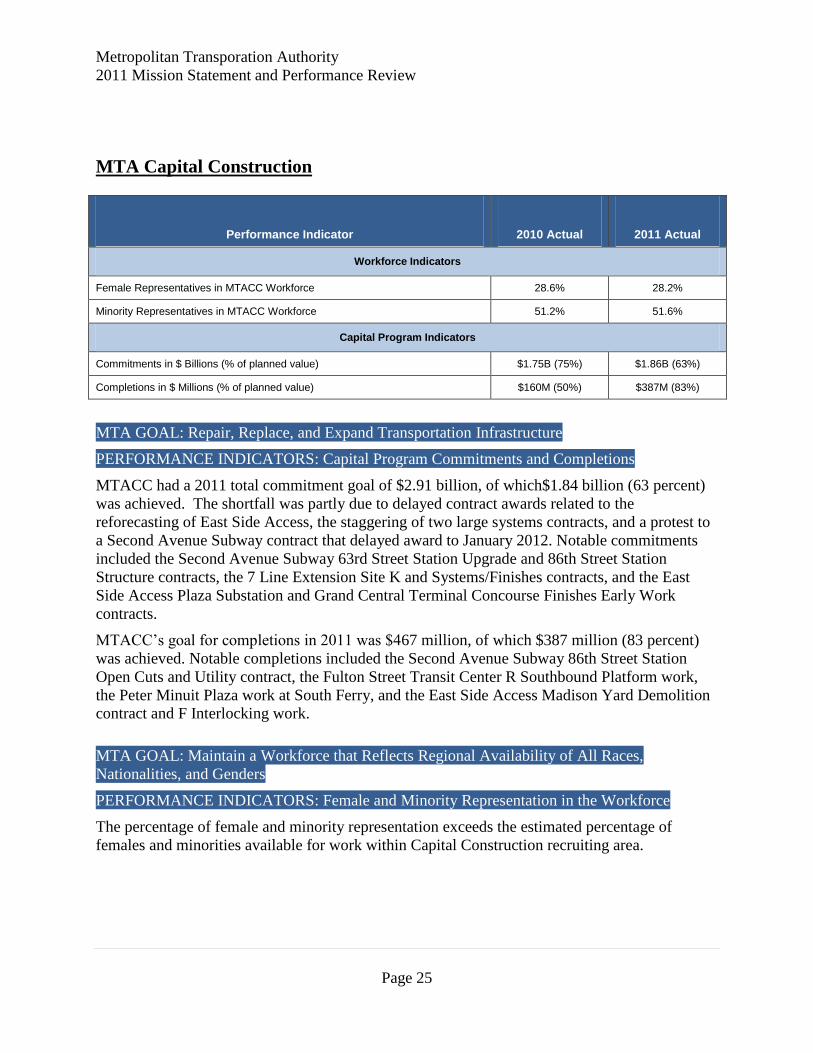
MTA GOAL: Repair, Replace, and Expand Transportation Infrastructure
PERFORMANCE INDICATORS: Capital Program Commitments and Completions
MTACC had a 2011 total commitment goal of $2.91 billion, of which$1.84 billion (63 percent)
was achieved. The shortfall was partly due to delayed contract awards related to the
reforecasting of East Side Access, the staggering of two large systems contracts, and a protest to
a Second Avenue Subway contract that delayed award to January 2012. Notable commitments
included the Second Avenue Subway 63rd Street Station Upgrade and 86th Street Station
Structure contracts, the 7 Line Extension Site K and Systems/Finishes contracts, and the East
Side Access Plaza Substation and Grand Central Terminal Concourse Finishes Early Work
contracts.
MTACC’s goal for completions in 2011 was $467 million, of which $387 million (83 percent)
was achieved. Notable completions included the Second Avenue Subway 86th Street Station
Open Cuts and Utility contract, the Fulton Street Transit Center R Southbound Platform work,
the Peter Minuit Plaza work at South Ferry, and the East Side Access Madison Yard Demolition
contract and F Interlocking work.
MTA GOAL: Maintain a Workforce that Reflects Regional Availability of All Races,
Nationalities, and Genders
PERFORMANCE INDICATORS: Female and Minority Representation in the Workforce
The percentage of female and minority representation exceeds the estimated percentage of
females and minorities available for work within Capital Construction recruiting area.