metrics reloaded: marketing's opportunity to impact strategic direction
TRANSCRIPT
Improve Your Probability for Success ™www.visionedgemarketing.com
© 1999-2006 VisionEdge Marketing. All rights reserved.
Not for reproduction or redistribution without written permission.
Metrics Reloaded: Marketing’sOpportunity to Impact Strategic Direction
Laura PattersonPresident
VisionEdge Marketing, Inc.
Improve Your Probability for Success ™www.visionedgemarketing.com
© 1999-2006 VisionEdge Marketing. All rights reserved.
Not for reproduction or redistribution without written permission.
Welcome and Agenda
By the time we wrap, we will explore
!"The State of Metrics
#"Measures of Success
$"A Framework for Quality Marketing Metrics
%"Define Outcome-Based Metrics andMarketing Metrics Categories
&"Associated Performance Indicatorsfor Each Category
'"Creating a Dashboard
Improve Your Probability for Success ™www.visionedgemarketing.com
© 1999-2006 VisionEdge Marketing. All rights reserved.
Not for reproduction or redistribution without written permission.
Metrics Discussion:What’s Meant by Metrics?
Definitions (Webster):
( Metric – Standardof Measurement
( Benchmark – Standardby which OthersMeasured
( Measurement – Processof measuring
( Progress against a Metric
Improve Your Probability for Success ™www.visionedgemarketing.com
© 1999-2006 VisionEdge Marketing. All rights reserved.
Not for reproduction or redistribution without written permission.
From CEOs, to CFOs, to CMOs Everyone’sTalking About Marketing Metrics
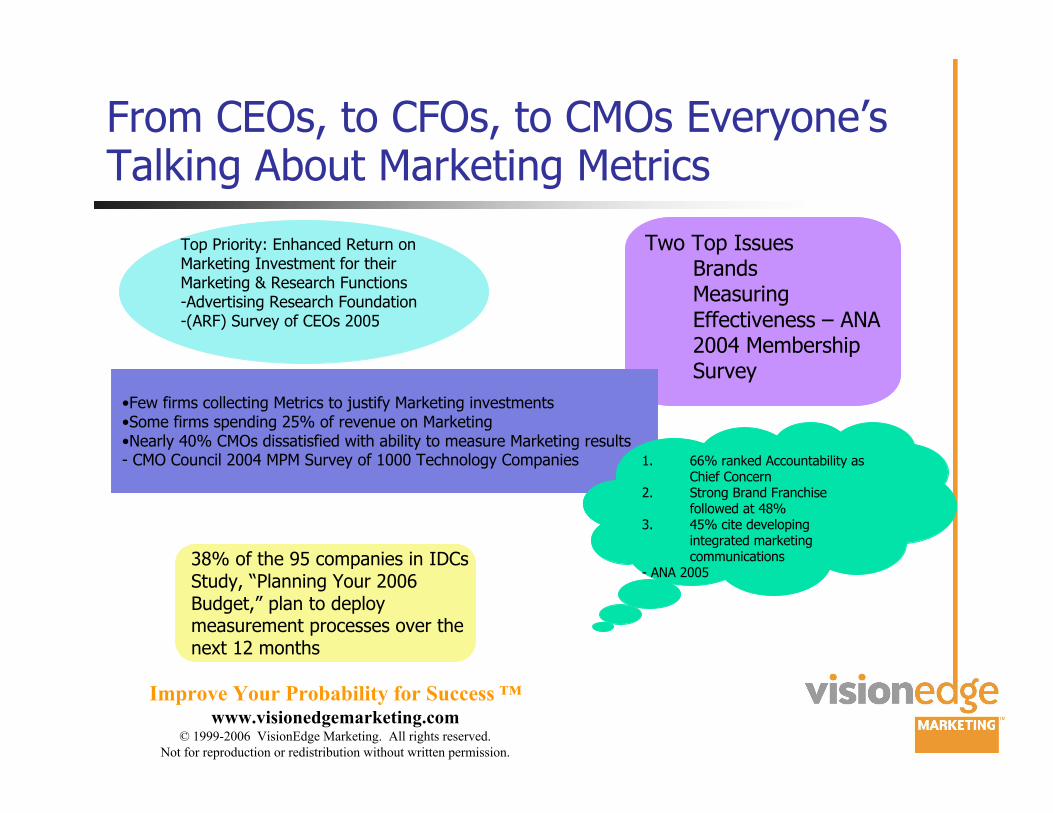
Two Top IssuesBrandsMeasuringEffectiveness – ANA2004 MembershipSurvey
•Few firms collecting Metrics to justify Marketing investments•Some firms spending 25% of revenue on Marketing•Nearly 40% CMOs dissatisfied with ability to measure Marketing results- CMO Council 2004 MPM Survey of 1000 Technology Companies 1. 66% ranked Accountability as
Chief Concern2. Strong Brand Franchise
followed at 48%3. 45% cite developing
integrated marketingcommunications
- ANA 2005
Top Priority: Enhanced Return on Marketing Investment for their Marketing & Research Functions-Advertising Research Foundation -(ARF) Survey of CEOs 2005
38% of the 95 companies in IDCsStudy, “Planning Your 2006Budget,” plan to deploy measurement processes over thenext 12 months
Improve Your Probability for Success ™www.visionedgemarketing.com
© 1999-2006 VisionEdge Marketing. All rights reserved.
Not for reproduction or redistribution without written permission.
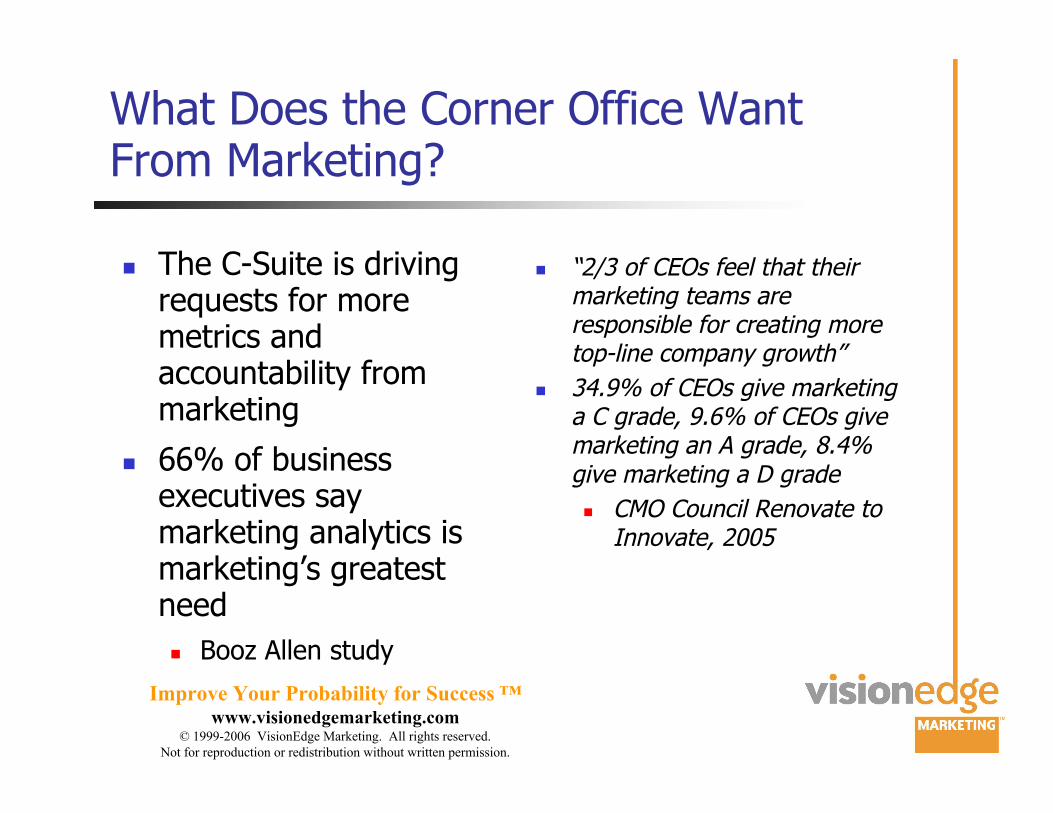
What Does the Corner Office WantFrom Marketing?
( The C-Suite is drivingrequests for moremetrics andaccountability frommarketing
( 66% of businessexecutives saymarketing analytics ismarketing’s greatestneed
( Booz Allen study
( “2/3 of CEOs feel that theirmarketing teams areresponsible for creating moretop-line company growth”
( 34.9% of CEOs give marketinga C grade, 9.6% of CEOs givemarketing an A grade, 8.4%give marketing a D grade
( CMO Council Renovate toInnovate, 2005
Improve Your Probability for Success ™www.visionedgemarketing.com
© 1999-2006 VisionEdge Marketing. All rights reserved.
Not for reproduction or redistribution without written permission.
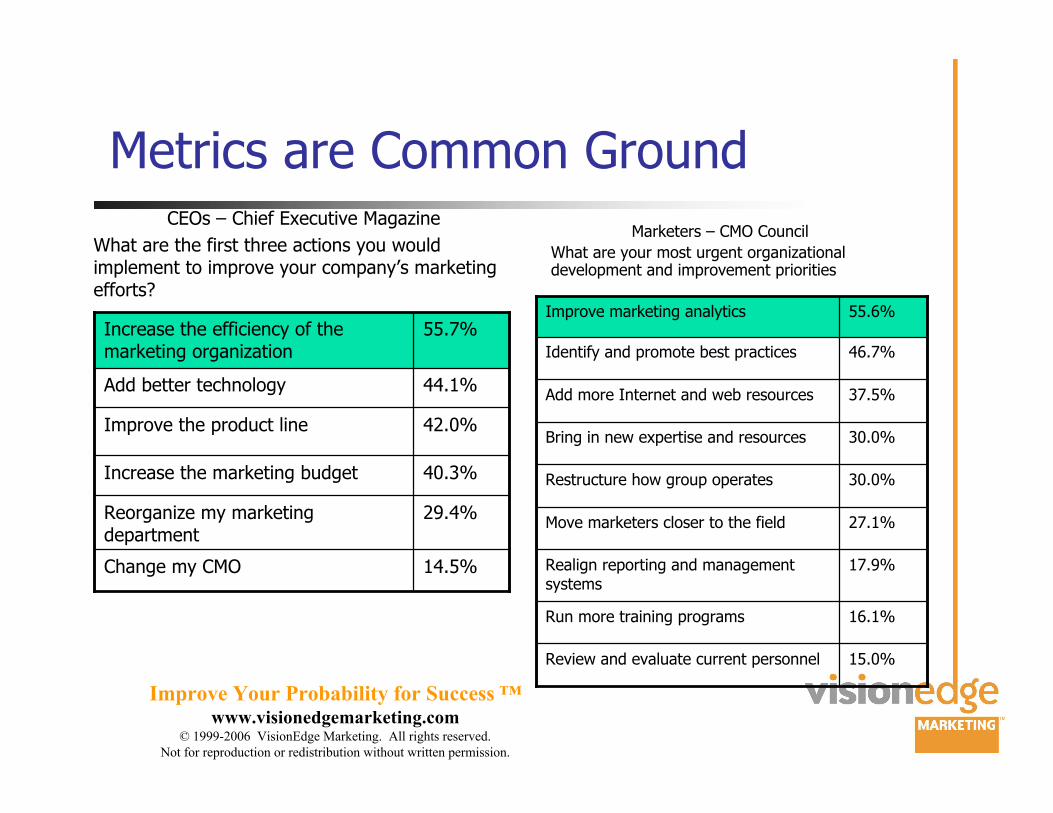
Metrics are Common Ground
Marketers – CMO Council
What are your most urgent organizationaldevelopment and improvement priorities
CEOs – Chief Executive Magazine
What are the first three actions you wouldimplement to improve your company’s marketingefforts?
15.0%Review and evaluate current personnel
16.1%Run more training programs
17.9%Realign reporting and managementsystems
27.1%Move marketers closer to the field
30.0%Restructure how group operates
30.0%Bring in new expertise and resources
37.5%Add more Internet and web resources
46.7%Identify and promote best practices
55.6%Improve marketing analytics
14.5%Change my CMO
29.4%Reorganize my marketingdepartment
40.3%Increase the marketing budget
42.0%Improve the product line
44.1%Add better technology
55.7%Increase the efficiency of themarketing organization
Improve Your Probability for Success ™www.visionedgemarketing.com
© 1999-2006 VisionEdge Marketing. All rights reserved.
Not for reproduction or redistribution without written permission.
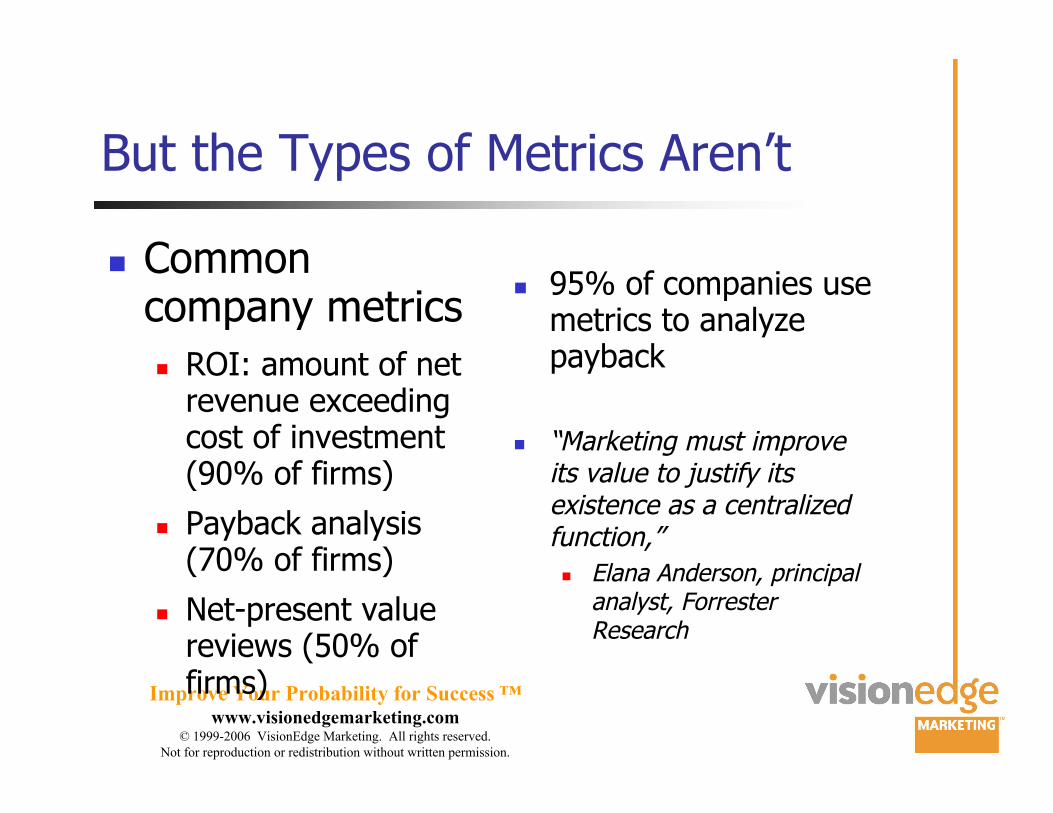
But the Types of Metrics Aren’t
( Commoncompany metrics
( ROI: amount of netrevenue exceedingcost of investment(90% of firms)
( Payback analysis(70% of firms)
( Net-present valuereviews (50% offirms)
( 95% of companies usemetrics to analyzepayback
( “Marketing must improveits value to justify itsexistence as a centralizedfunction,”
( Elana Anderson, principalanalyst, ForresterResearch
Improve Your Probability for Success ™www.visionedgemarketing.com
© 1999-2006 VisionEdge Marketing. All rights reserved.
Not for reproduction or redistribution without written permission.
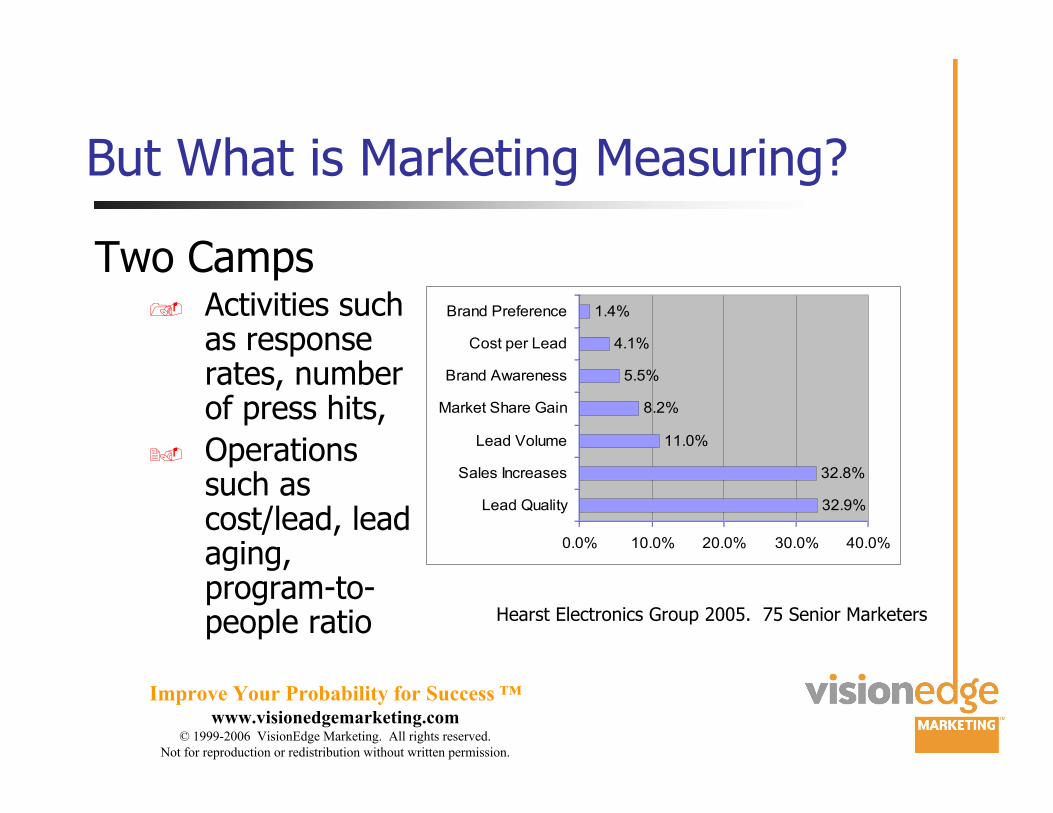
But What is Marketing Measuring?
Two Camps!" Activities such
as responserates, numberof press hits,
#" Operationssuch ascost/lead, leadaging,program-to-people ratio
32.9%
32.8%
11.0%
8.2%
5.5%
4.1%
1.4%
0.0% 10.0% 20.0% 30.0% 40.0%
Lead Quality
Sales Increases
Lead Volume
Market Share Gain
Brand Awareness
Cost per Lead
Brand Preference
Hearst Electronics Group 2005. 75 Senior Marketers
Improve Your Probability for Success ™www.visionedgemarketing.com
© 1999-2006 VisionEdge Marketing. All rights reserved.
Not for reproduction or redistribution without written permission.
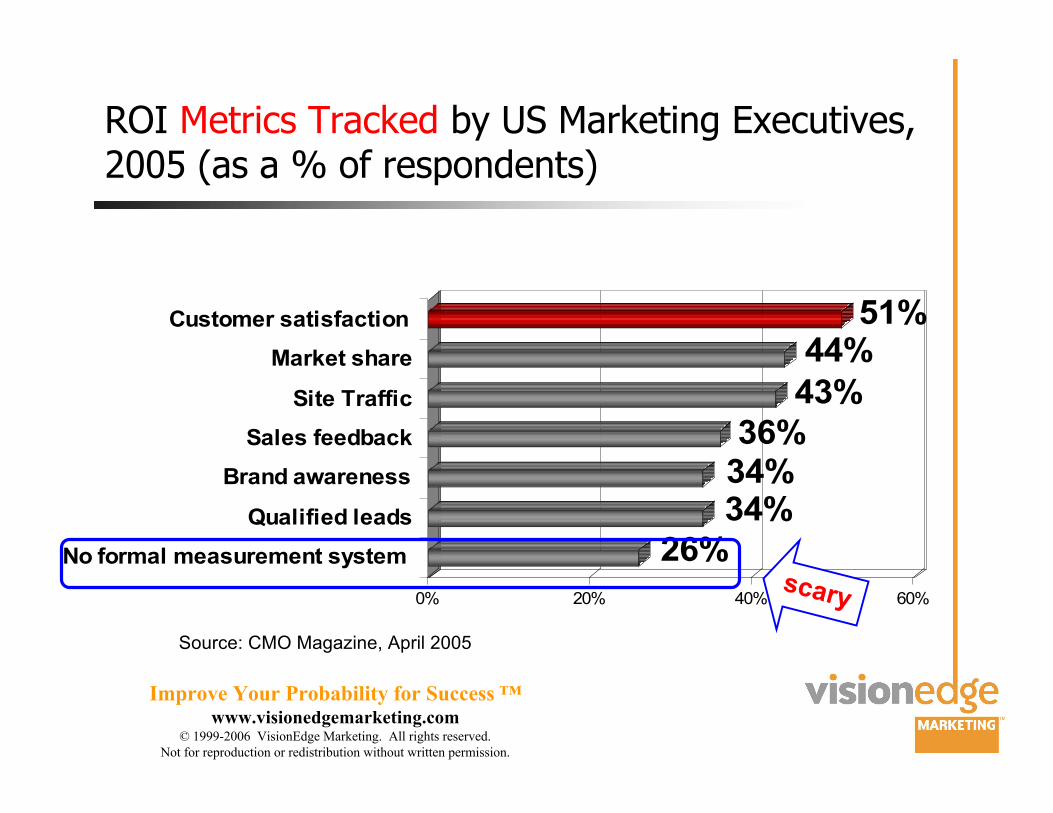
ROI Metrics Tracked by US Marketing Executives,2005 (as a % of respondents)
26%
34%34%36%
43%
44%51%
0% 20% 40% 60%
Customer satisfaction
Market share
Site Traffic
Sales feedback
Brand awareness
Qualified leads
No formal measurement system
scary
Source: CMO Magazine, April 2005
Improve Your Probability for Success ™www.visionedgemarketing.com
© 1999-2006 VisionEdge Marketing. All rights reserved.
Not for reproduction or redistribution without written permission.
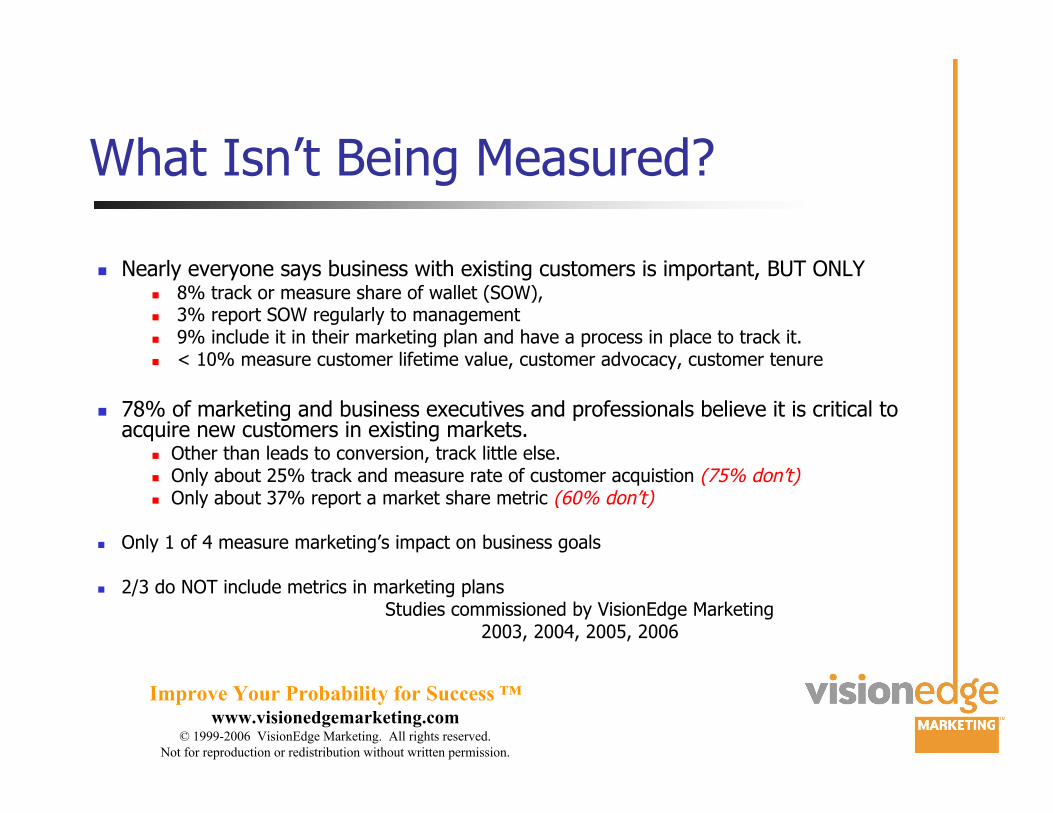
What Isn’t Being Measured?
( Nearly everyone says business with existing customers is important, BUT ONLY( 8% track or measure share of wallet (SOW),( 3% report SOW regularly to management( 9% include it in their marketing plan and have a process in place to track it.( < 10% measure customer lifetime value, customer advocacy, customer tenure
( 78% of marketing and business executives and professionals believe it is critical toacquire new customers in existing markets.
( Other than leads to conversion, track little else.( Only about 25% track and measure rate of customer acquistion (75% don’t)( Only about 37% report a market share metric (60% don’t)
( Only 1 of 4 measure marketing’s impact on business goals
( 2/3 do NOT include metrics in marketing plansStudies commissioned by VisionEdge Marketing
2003, 2004, 2005, 2006
Improve Your Probability for Success ™www.visionedgemarketing.com
© 1999-2006 VisionEdge Marketing. All rights reserved.
Not for reproduction or redistribution without written permission.
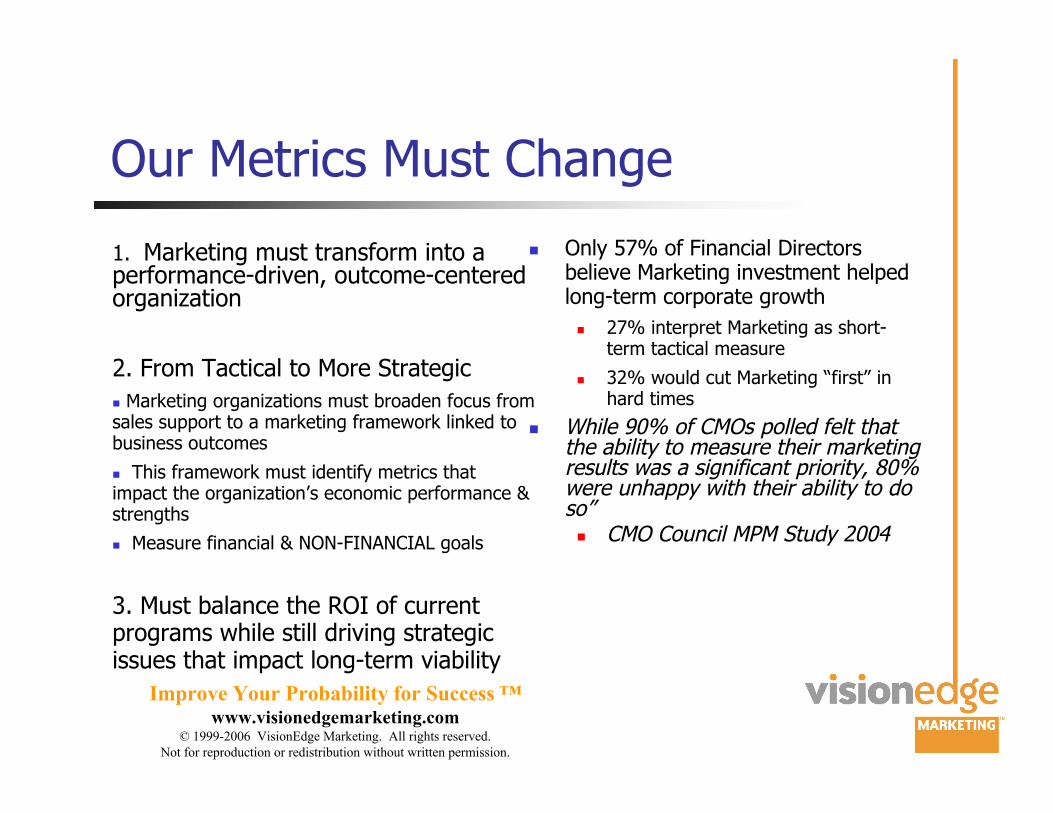
Our Metrics Must Change
1. Marketing must transform into aperformance-driven, outcome-centeredorganization
2. From Tactical to More Strategic
( Marketing organizations must broaden focus fromsales support to a marketing framework linked tobusiness outcomes
( This framework must identify metrics thatimpact the organization’s economic performance &strengths
( Measure financial & NON-FINANCIAL goals
3. Must balance the ROI of currentprograms while still driving strategicissues that impact long-term viability
( Only 57% of Financial Directorsbelieve Marketing investment helpedlong-term corporate growth
( 27% interpret Marketing as short-term tactical measure
( 32% would cut Marketing “first” inhard times
( While 90% of CMOs polled felt thatthe ability to measure their marketingresults was a significant priority, 80%were unhappy with their ability to doso”( CMO Council MPM Study 2004
Improve Your Probability for Success ™www.visionedgemarketing.com
© 1999-2006 VisionEdge Marketing. All rights reserved.
Not for reproduction or redistribution without written permission.
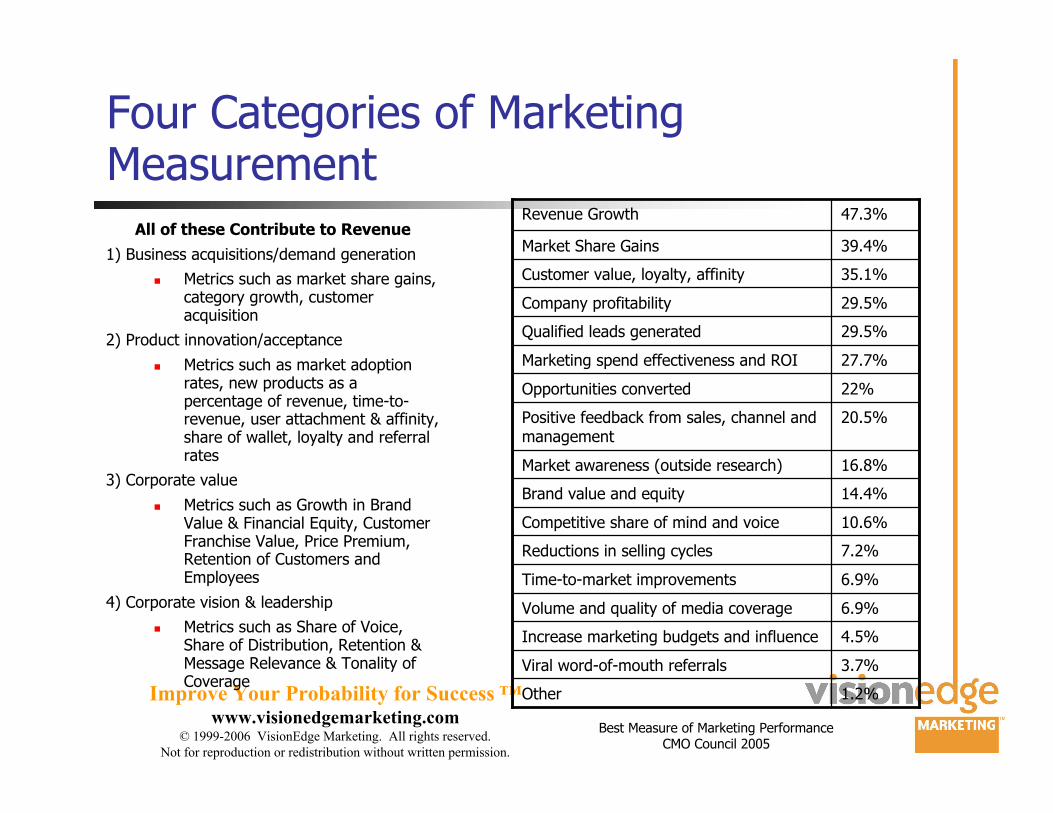
Four Categories of MarketingMeasurement
All of these Contribute to Revenue
1) Business acquisitions/demand generation
( Metrics such as market share gains,category growth, customeracquisition
2) Product innovation/acceptance
( Metrics such as market adoptionrates, new products as apercentage of revenue, time-to-revenue, user attachment & affinity,share of wallet, loyalty and referralrates
3) Corporate value
( Metrics such as Growth in BrandValue & Financial Equity, CustomerFranchise Value, Price Premium,Retention of Customers andEmployees
4) Corporate vision & leadership
( Metrics such as Share of Voice,Share of Distribution, Retention &Message Relevance & Tonality ofCoverage
Best Measure of Marketing PerformanceCMO Council 2005
1.2%Other
3.7%Viral word-of-mouth referrals
4.5%Increase marketing budgets and influence
6.9%Volume and quality of media coverage
6.9%Time-to-market improvements
7.2%Reductions in selling cycles
10.6%Competitive share of mind and voice
14.4%Brand value and equity
16.8%Market awareness (outside research)
20.5%Positive feedback from sales, channel andmanagement
22%Opportunities converted
27.7%Marketing spend effectiveness and ROI
29.5%Qualified leads generated
29.5%Company profitability
35.1%Customer value, loyalty, affinity
39.4%Market Share Gains
47.3%Revenue Growth
Improve Your Probability for Success ™www.visionedgemarketing.com
© 1999-2006 VisionEdge Marketing. All rights reserved.
Not for reproduction or redistribution without written permission.
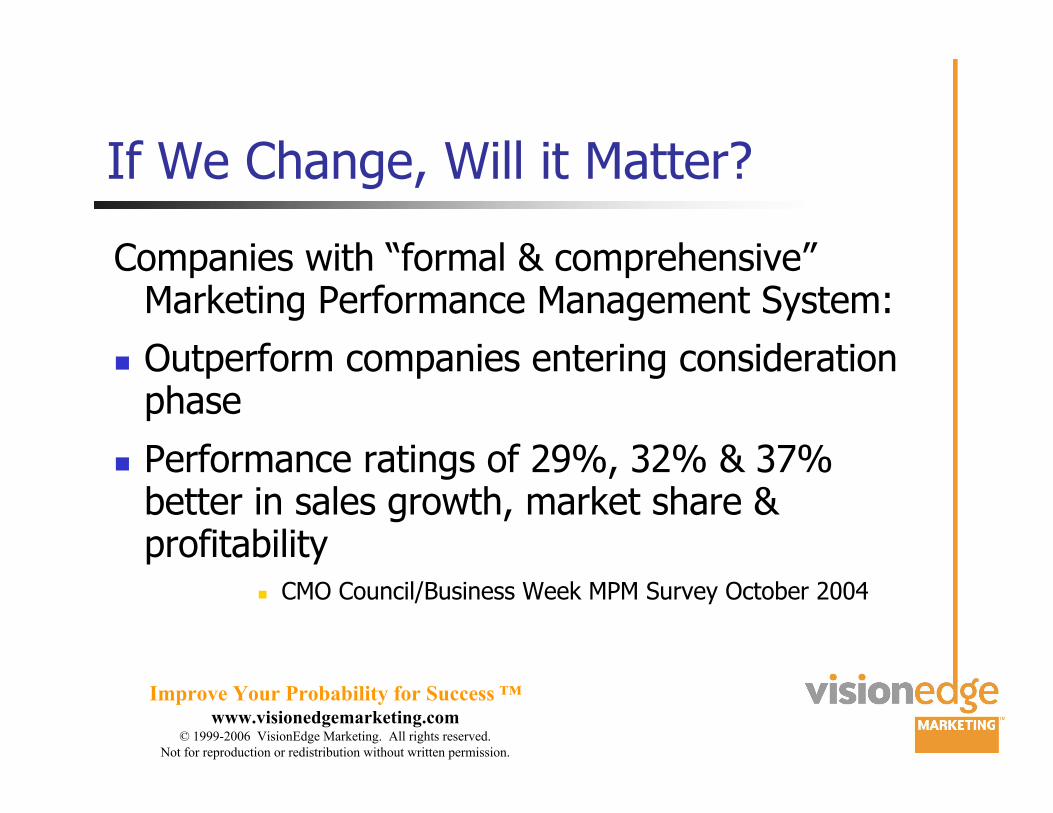
If We Change, Will it Matter?
Companies with “formal & comprehensive”Marketing Performance Management System:
( Outperform companies entering considerationphase
( Performance ratings of 29%, 32% & 37%better in sales growth, market share &profitability
( CMO Council/Business Week MPM Survey October 2004
Improve Your Probability for Success ™www.visionedgemarketing.com
© 1999-2006 VisionEdge Marketing. All rights reserved.
Not for reproduction or redistribution without written permission.
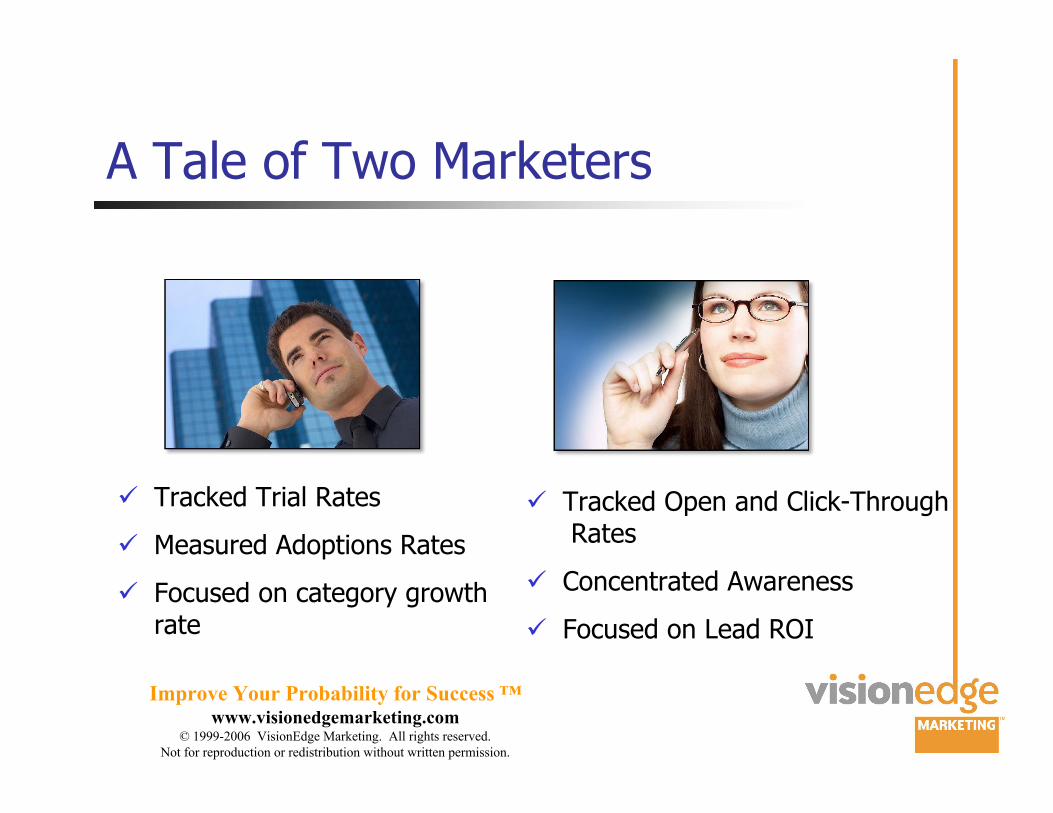
A Tale of Two Marketers
) Tracked Trial Rates
) Measured Adoptions Rates
) Focused on category growthrate
) Tracked Open and Click-Through Rates
) Concentrated Awareness
) Focused on Lead ROI
Improve Your Probability for Success ™www.visionedgemarketing.com
© 1999-2006 VisionEdge Marketing. All rights reserved.
Not for reproduction or redistribution without written permission.
To Make Progress Must Shift
!" Focus from Sales support to Marketing AuditFramework Linked to Business Outcomes
#" To Measuring Financial and Non-Financial Goals
$" Utilize a Framework that Identifies Metrics thatImpact Organization’s Economic Performance& Strengths
Improve Your Probability for Success ™www.visionedgemarketing.com
© 1999-2006 VisionEdge Marketing. All rights reserved.
Not for reproduction or redistribution without written permission.
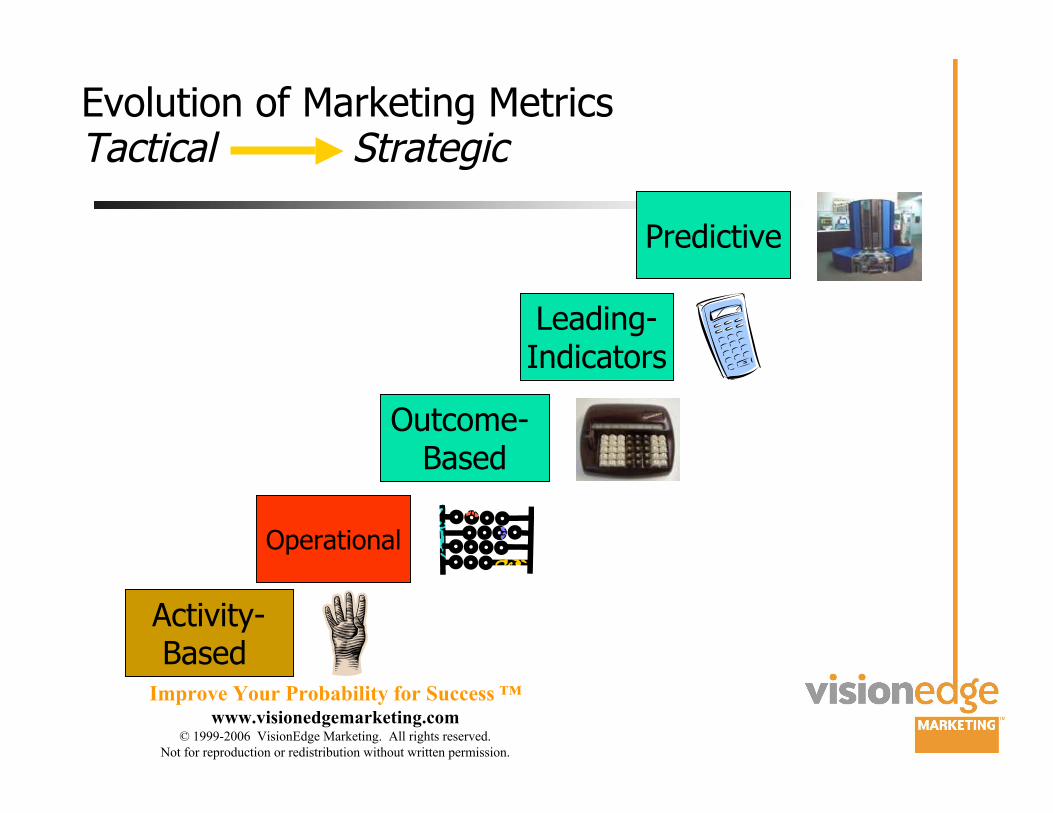
Activity-Based
Operational
Outcome- Based
Leading-Indicators
Predictive
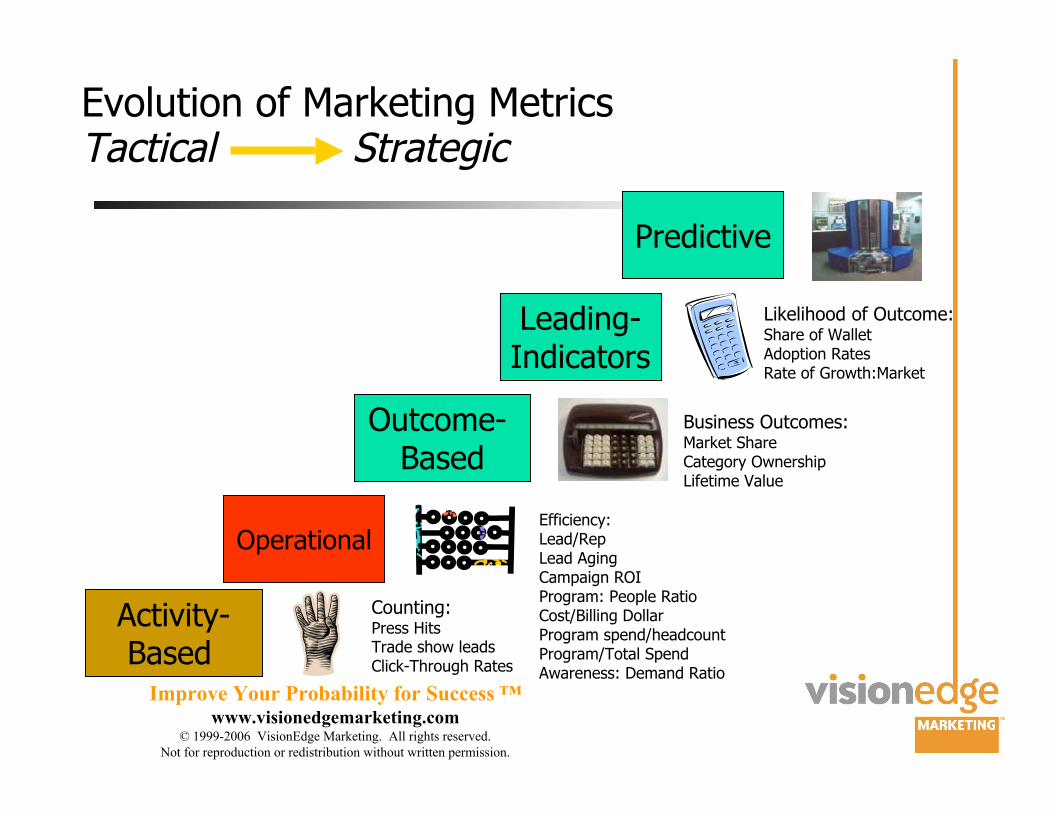
Evolution of Marketing MetricsTactical Strategic
Improve Your Probability for Success ™www.visionedgemarketing.com
© 1999-2006 VisionEdge Marketing. All rights reserved.
Not for reproduction or redistribution without written permission.
Activity-Based
Operational
Outcome- Based
Leading-Indicators
Predictive
Evolution of Marketing MetricsTactical Strategic
Counting:Press HitsTrade show leadsClick-Through Rates
Efficiency:Lead/RepLead AgingCampaign ROIProgram: People RatioCost/Billing DollarProgram spend/headcountProgram/Total SpendAwareness: Demand Ratio
Business Outcomes:Market ShareCategory OwnershipLifetime Value
Likelihood of Outcome:Share of WalletAdoption RatesRate of Growth:Market
Improve Your Probability for Success ™www.visionedgemarketing.com
© 1999-2006 VisionEdge Marketing. All rights reserved.
Not for reproduction or redistribution without written permission.
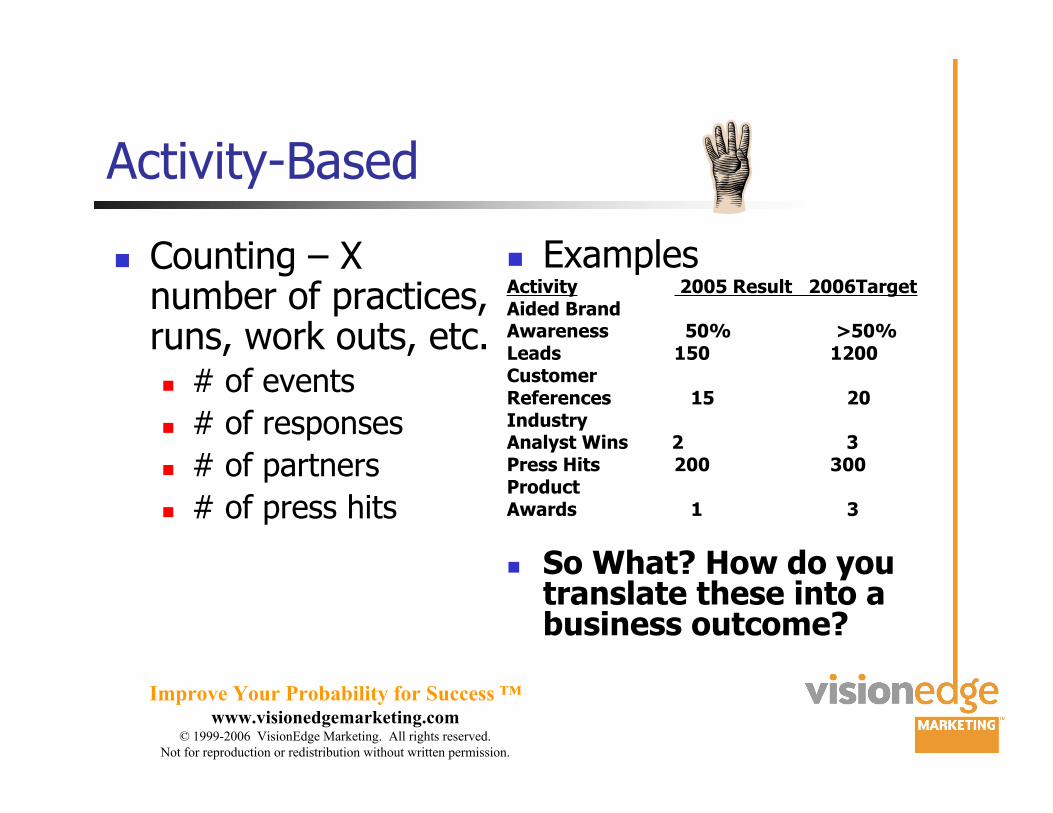
Activity-Based
( Counting – Xnumber of practices,runs, work outs, etc.( # of events
( # of responses
( # of partners
( # of press hits
( ExamplesActivity 2005 Result 2006TargetAided BrandAwareness 50% >50%Leads 150 1200CustomerReferences 15 20IndustryAnalyst Wins 2 3Press Hits 200 300ProductAwards 1 3
( So What? How do youtranslate these into abusiness outcome?
Improve Your Probability for Success ™www.visionedgemarketing.com
© 1999-2006 VisionEdge Marketing. All rights reserved.
Not for reproduction or redistribution without written permission.
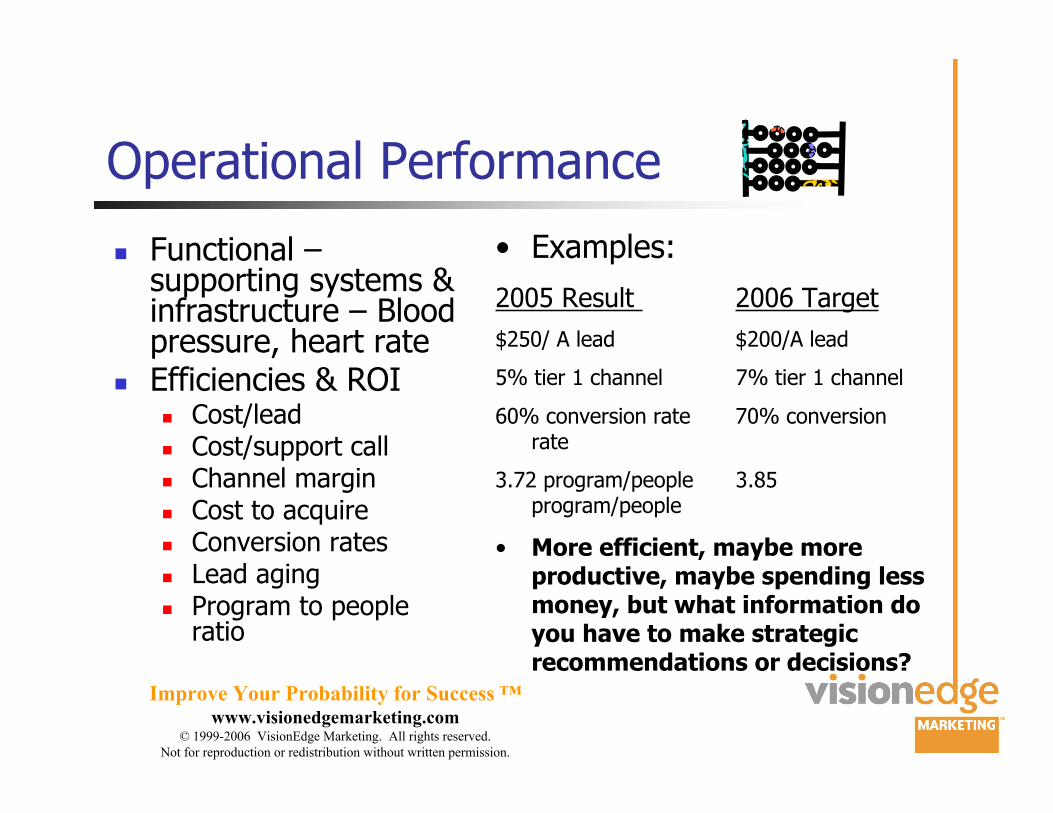
Operational Performance
( Functional –supporting systems &infrastructure – Bloodpressure, heart rate
( Efficiencies & ROI( Cost/lead( Cost/support call( Channel margin( Cost to acquire( Conversion rates( Lead aging( Program to people
ratio
• Examples:
2005 Result 2006 Target
$250/ A lead $200/A lead
5% tier 1 channel 7% tier 1 channel
60% conversion rate 70% conversionrate
3.72 program/people 3.85program/people
• More efficient, maybe moreproductive, maybe spending lessmoney, but what information doyou have to make strategicrecommendations or decisions?
Improve Your Probability for Success ™www.visionedgemarketing.com
© 1999-2006 VisionEdge Marketing. All rights reserved.
Not for reproduction or redistribution without written permission.
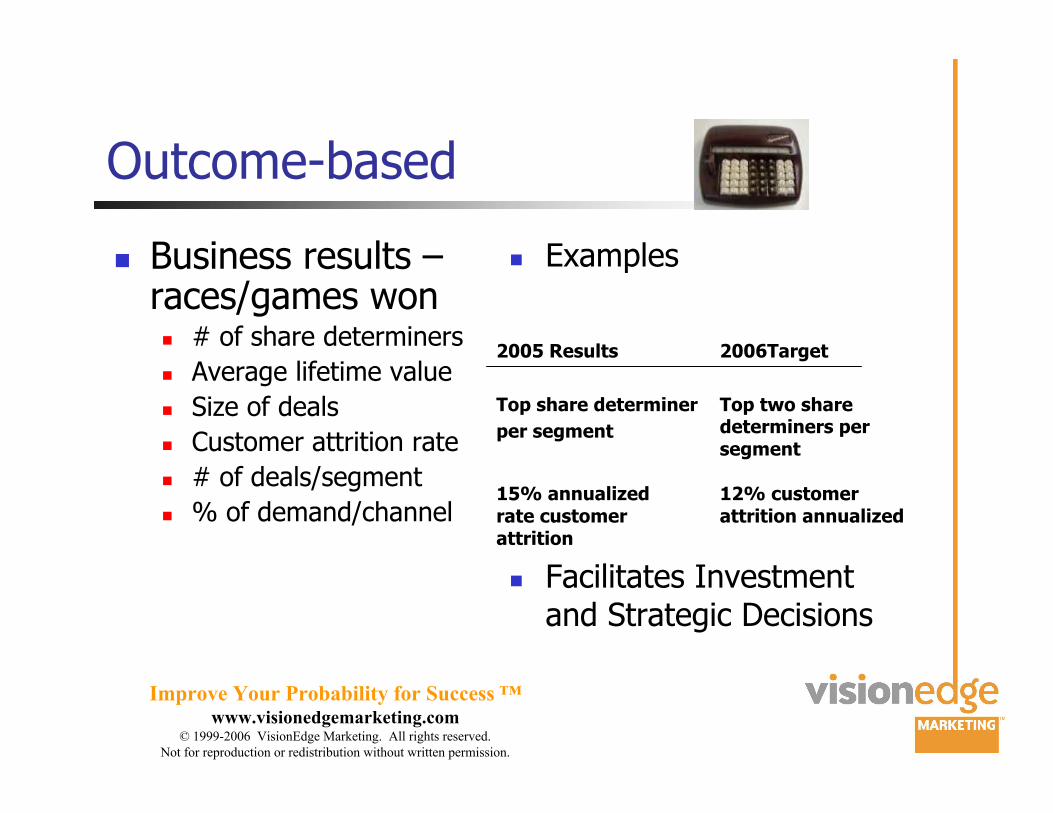
Outcome-based
( Business results –races/games won( # of share determiners
( Average lifetime value
( Size of deals
( Customer attrition rate
( # of deals/segment
( % of demand/channel
( Examples
( Facilitates Investmentand Strategic Decisions
12% customerattrition annualized
15% annualizedrate customerattrition
2006Target
Top two sharedeterminers persegment
2005 Results
Top share determiner
per segment
Improve Your Probability for Success ™www.visionedgemarketing.com
© 1999-2006 VisionEdge Marketing. All rights reserved.
Not for reproduction or redistribution without written permission.
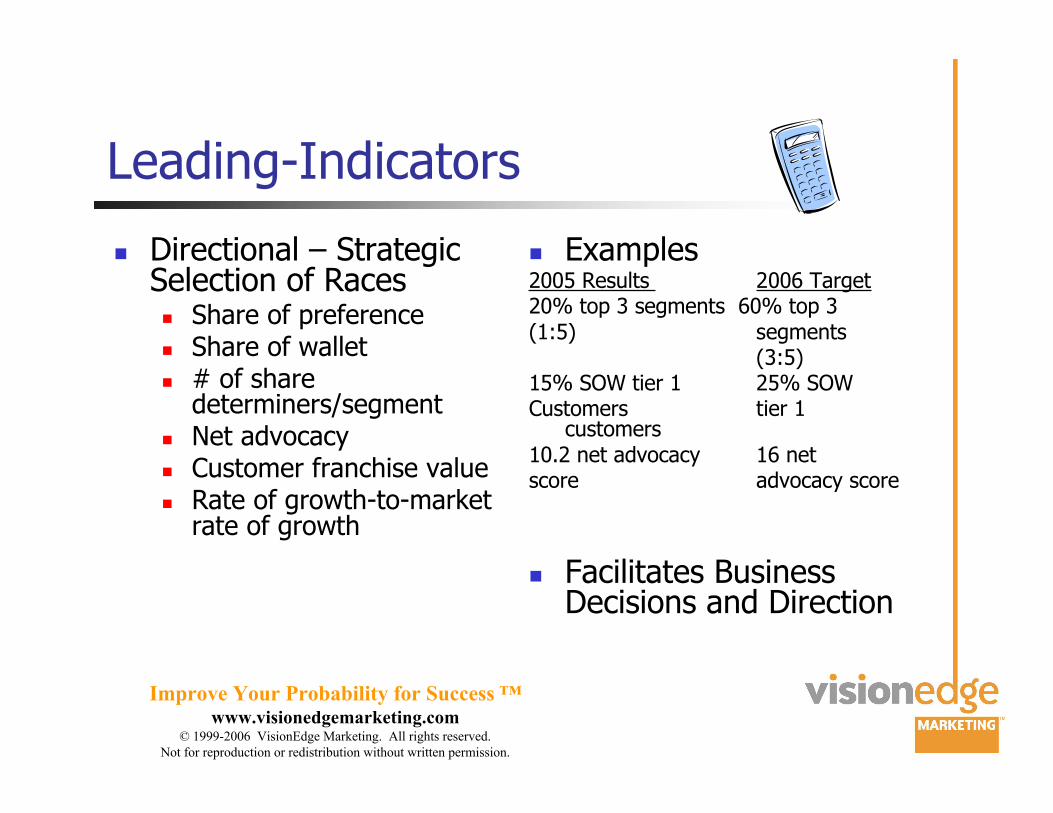
Leading-Indicators
( Directional – StrategicSelection of Races( Share of preference( Share of wallet( # of share
determiners/segment( Net advocacy( Customer franchise value( Rate of growth-to-market
rate of growth
( Examples2005 Results 2006 Target20% top 3 segments 60% top 3(1:5) segments
(3:5)15% SOW tier 1 25% SOWCustomers tier 1
customers10.2 net advocacy 16 netscore advocacy score
( Facilitates BusinessDecisions and Direction
Improve Your Probability for Success ™www.visionedgemarketing.com
© 1999-2006 VisionEdge Marketing. All rights reserved.
Not for reproduction or redistribution without written permission.
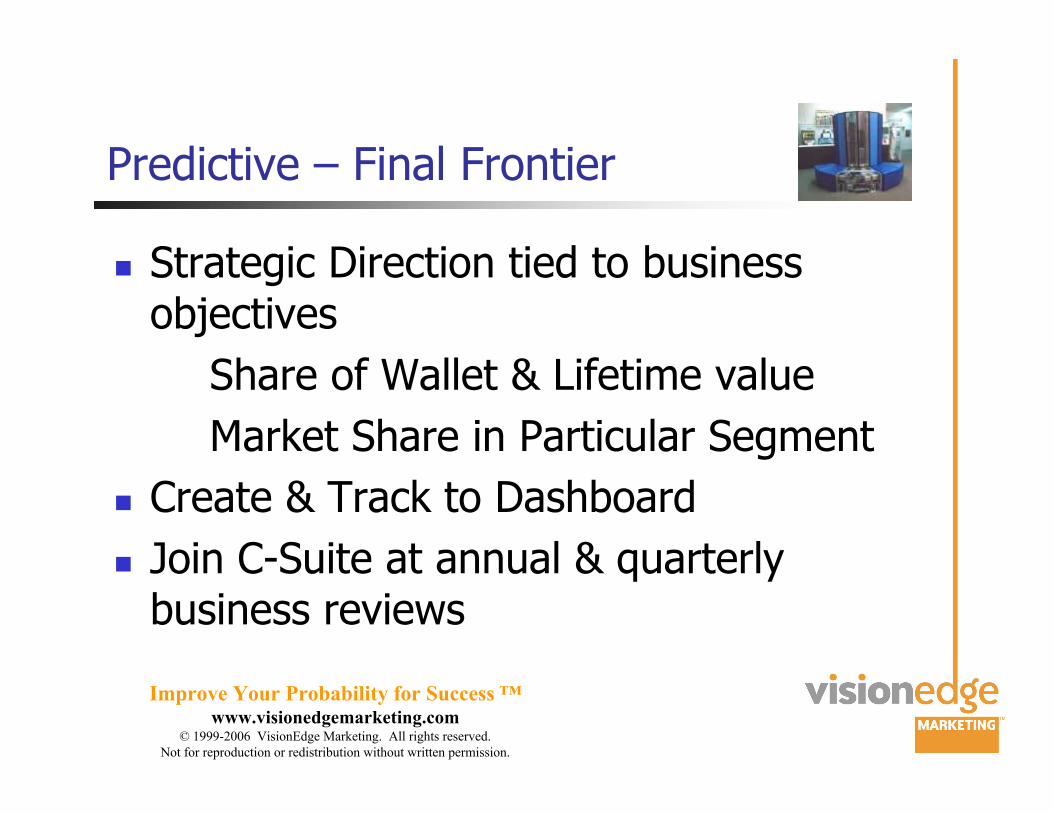
Predictive – Final Frontier
( Strategic Direction tied to businessobjectives
Share of Wallet & Lifetime value
Market Share in Particular Segment
( Create & Track to Dashboard
( Join C-Suite at annual & quarterlybusiness reviews
Improve Your Probability for Success ™www.visionedgemarketing.com
© 1999-2006 VisionEdge Marketing. All rights reserved.
Not for reproduction or redistribution without written permission.
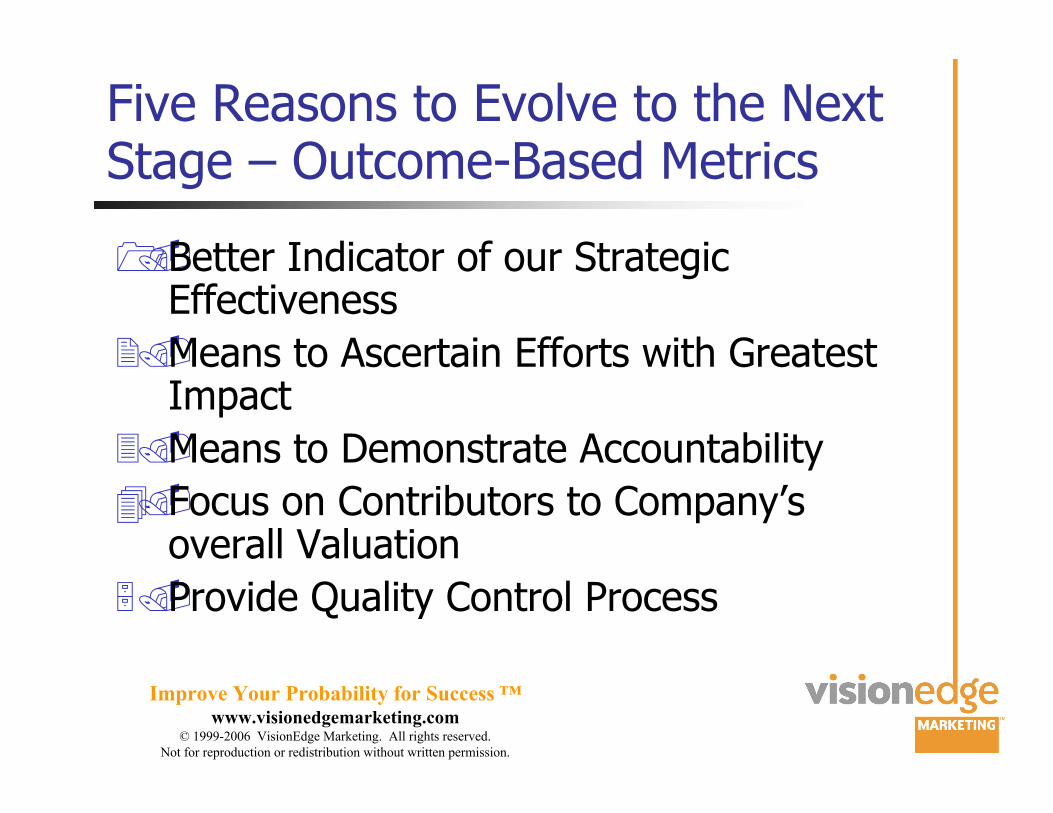
Five Reasons to Evolve to the NextStage – Outcome-Based Metrics
!"Better Indicator of our StrategicEffectiveness
#"Means to Ascertain Efforts with GreatestImpact
$"Means to Demonstrate Accountability
%"Focus on Contributors to Company’soverall Valuation
&"Provide Quality Control Process
Improve Your Probability for Success ™www.visionedgemarketing.com
© 1999-2006 VisionEdge Marketing. All rights reserved.
Not for reproduction or redistribution without written permission.
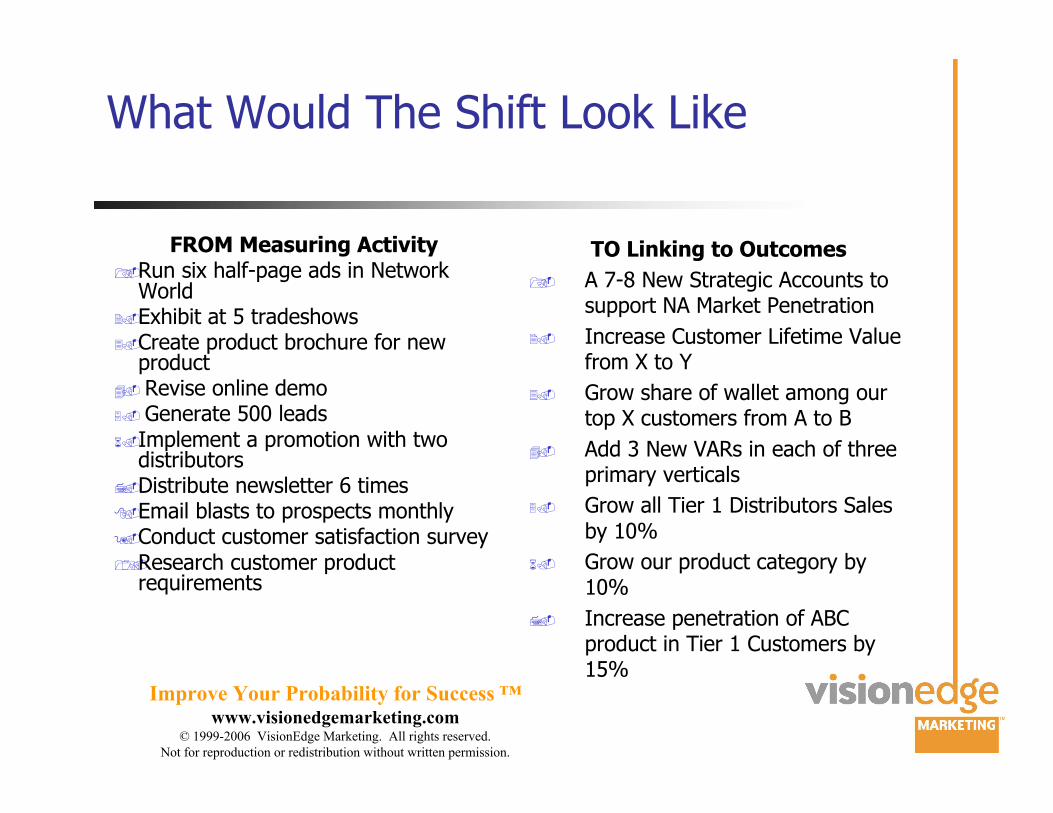
What Would The Shift Look Like
FROM Measuring Activity!"Run six half-page ads in Network
World#"Exhibit at 5 tradeshows$"Create product brochure for new
product%" Revise online demo&" Generate 500 leads'"Implement a promotion with two
distributors*"Distribute newsletter 6 times+"Email blasts to prospects monthly,"Conduct customer satisfaction survey!-"Research customer product
requirements
TO Linking to Outcomes
!" A 7-8 New Strategic Accounts tosupport NA Market Penetration
#" Increase Customer Lifetime Valuefrom X to Y
$" Grow share of wallet among ourtop X customers from A to B
%" Add 3 New VARs in each of threeprimary verticals
&" Grow all Tier 1 Distributors Salesby 10%
'" Grow our product category by10%
*" Increase penetration of ABCproduct in Tier 1 Customers by15%
Improve Your Probability for Success ™www.visionedgemarketing.com
© 1999-2006 VisionEdge Marketing. All rights reserved.
Not for reproduction or redistribution without written permission.
How Do We Get There?
“Marketing has the main responsibility forachieving profitable revenue growth”
Phil Kotler, 1999
Start with the purpose of Marketing
Improve Your Probability for Success ™www.visionedgemarketing.com
© 1999-2006 VisionEdge Marketing. All rights reserved.
Not for reproduction or redistribution without written permission.
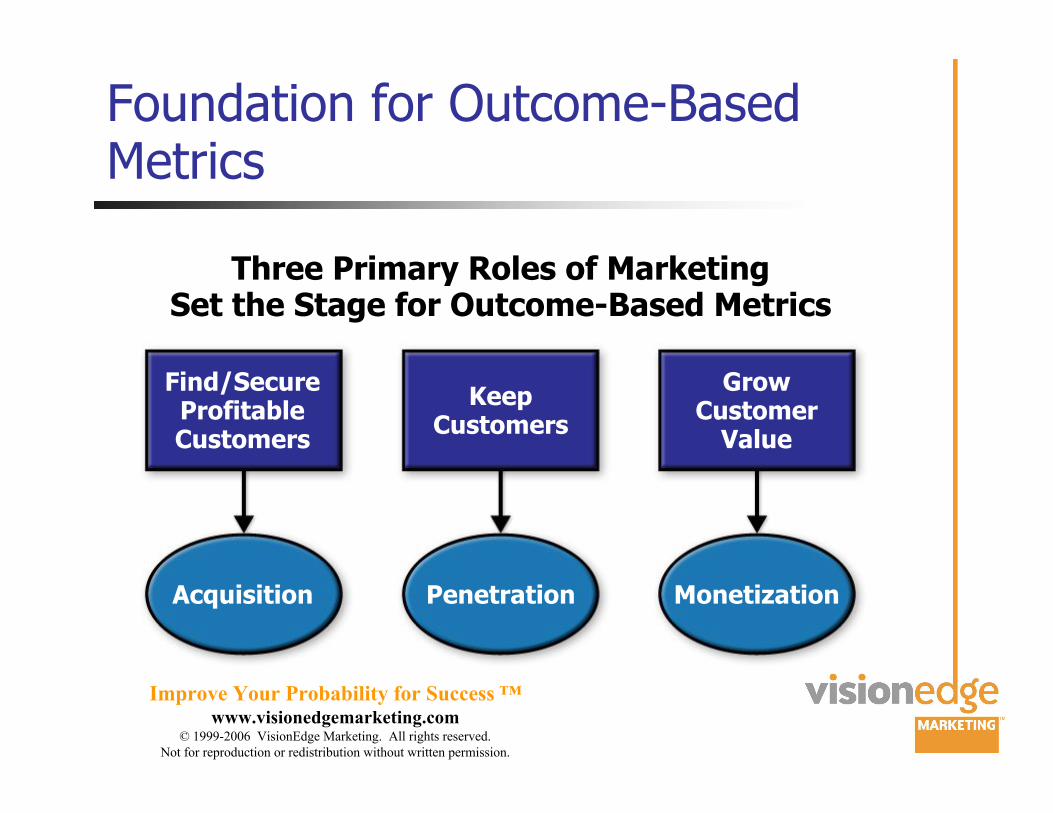
Foundation for Outcome-BasedMetrics
Three Primary Roles of MarketingSet the Stage for Outcome-Based Metrics
Find/SecureProfitableCustomers
Acquisition
KeepCustomers
Penetration
GrowCustomer
Value
Monetization
Improve Your Probability for Success ™www.visionedgemarketing.com
© 1999-2006 VisionEdge Marketing. All rights reserved.
Not for reproduction or redistribution without written permission.
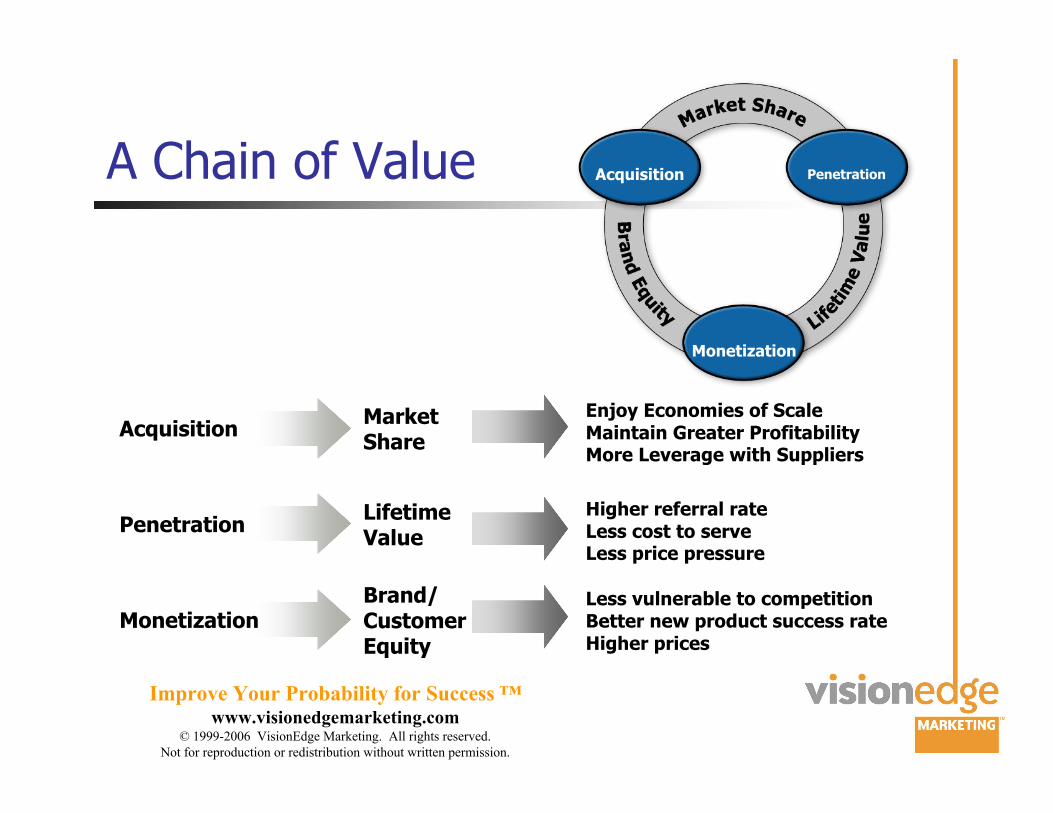
A Chain of Value
Acquisition Penetration
Monetization
AcquisitionMarketShare
PenetrationLifetimeValue
MonetizationBrand/CustomerEquity
Enjoy Economies of ScaleMaintain Greater ProfitabilityMore Leverage with Suppliers
Higher referral rateLess cost to serveLess price pressure
Less vulnerable to competitionBetter new product success rateHigher prices
Acquisition Penetration
Monetization
Improve Your Probability for Success ™www.visionedgemarketing.com
© 1999-2006 VisionEdge Marketing. All rights reserved.
Not for reproduction or redistribution without written permission.
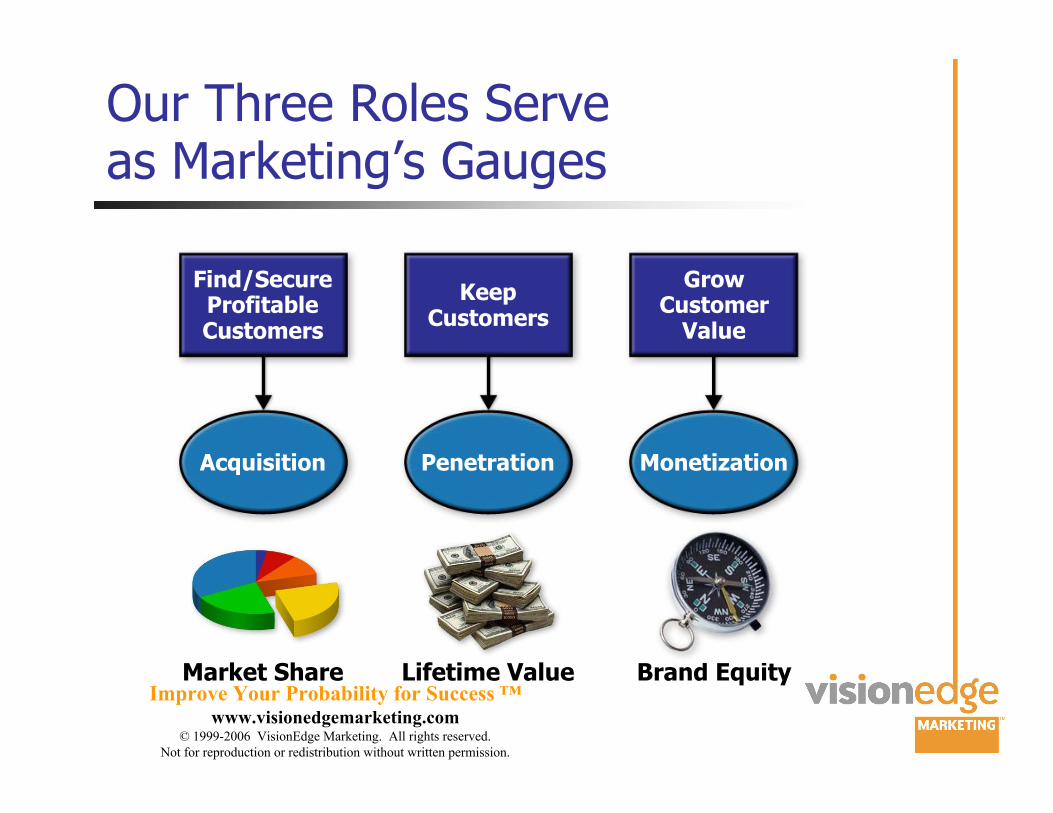
Our Three Roles Serveas Marketing’s Gauges
Market Share Lifetime Value Brand Equity
Find/SecureProfitableCustomers
Acquisition
KeepCustomers
Penetration
GrowCustomer
Value
Monetization
Improve Your Probability for Success ™www.visionedgemarketing.com
© 1999-2006 VisionEdge Marketing. All rights reserved.
Not for reproduction or redistribution without written permission.
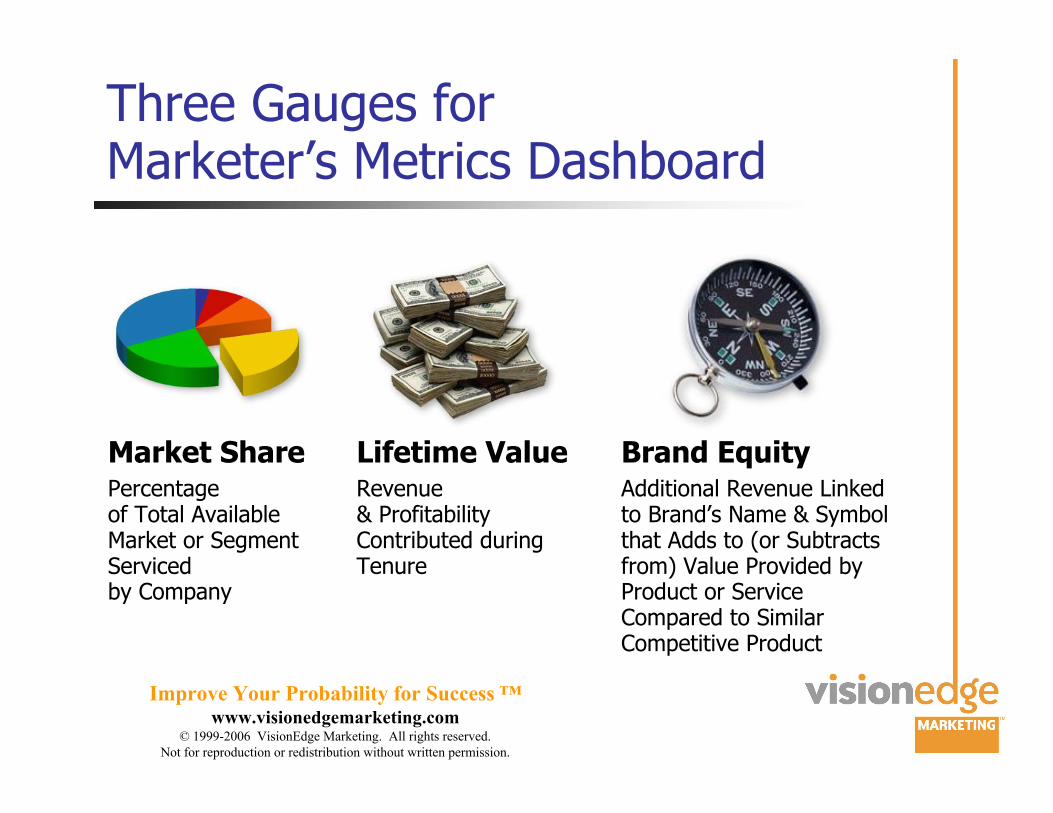
Three Gauges forMarketer’s Metrics Dashboard
Market SharePercentageof Total AvailableMarket or SegmentServicedby Company
Lifetime ValueRevenue& ProfitabilityContributed duringTenure
Brand EquityAdditional Revenue Linkedto Brand’s Name & Symbolthat Adds to (or Subtractsfrom) Value Provided byProduct or ServiceCompared to SimilarCompetitive Product
Improve Your Probability for Success ™www.visionedgemarketing.com
© 1999-2006 VisionEdge Marketing. All rights reserved.
Not for reproduction or redistribution without written permission.
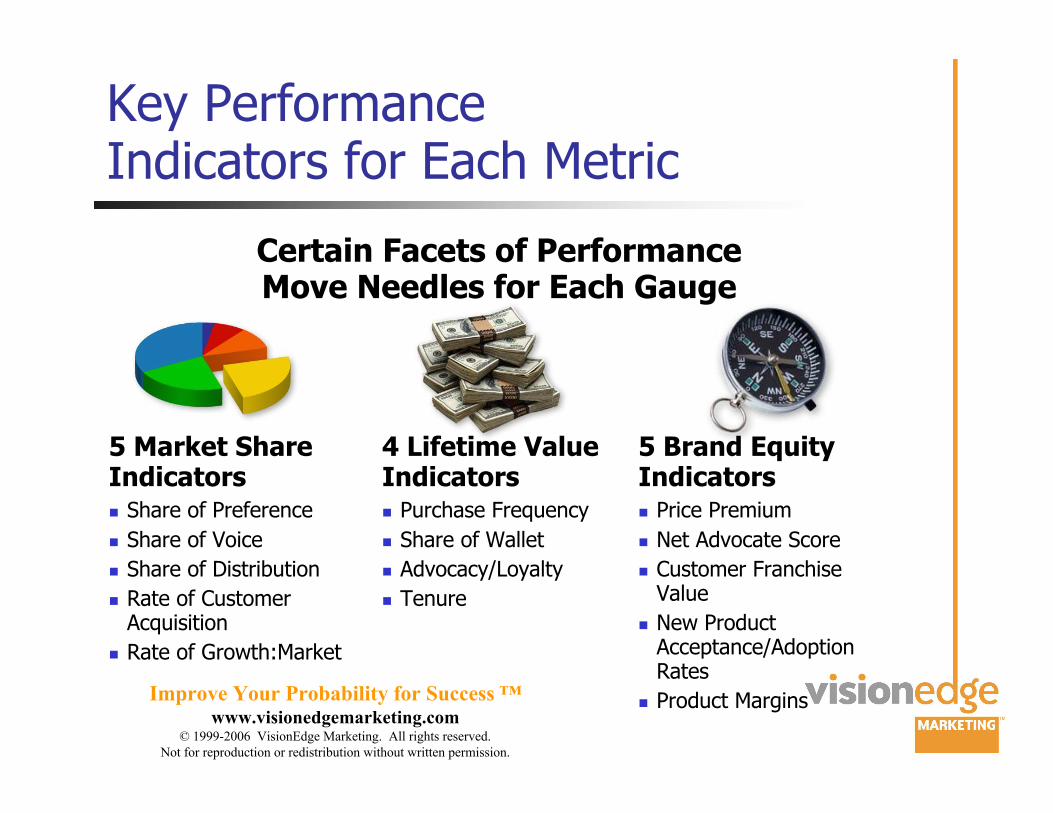
Key PerformanceIndicators for Each Metric
5 Brand EquityIndicators( Price Premium
( Net Advocate Score
( Customer FranchiseValue
( New ProductAcceptance/AdoptionRates
( Product Margins
Certain Facets of PerformanceMove Needles for Each Gauge
4 Lifetime ValueIndicators( Purchase Frequency
( Share of Wallet
( Advocacy/Loyalty
( Tenure
5 Market ShareIndicators( Share of Preference
( Share of Voice
( Share of Distribution
( Rate of CustomerAcquisition
( Rate of Growth:Market
Improve Your Probability for Success ™www.visionedgemarketing.com
© 1999-2006 VisionEdge Marketing. All rights reserved.
Not for reproduction or redistribution without written permission.
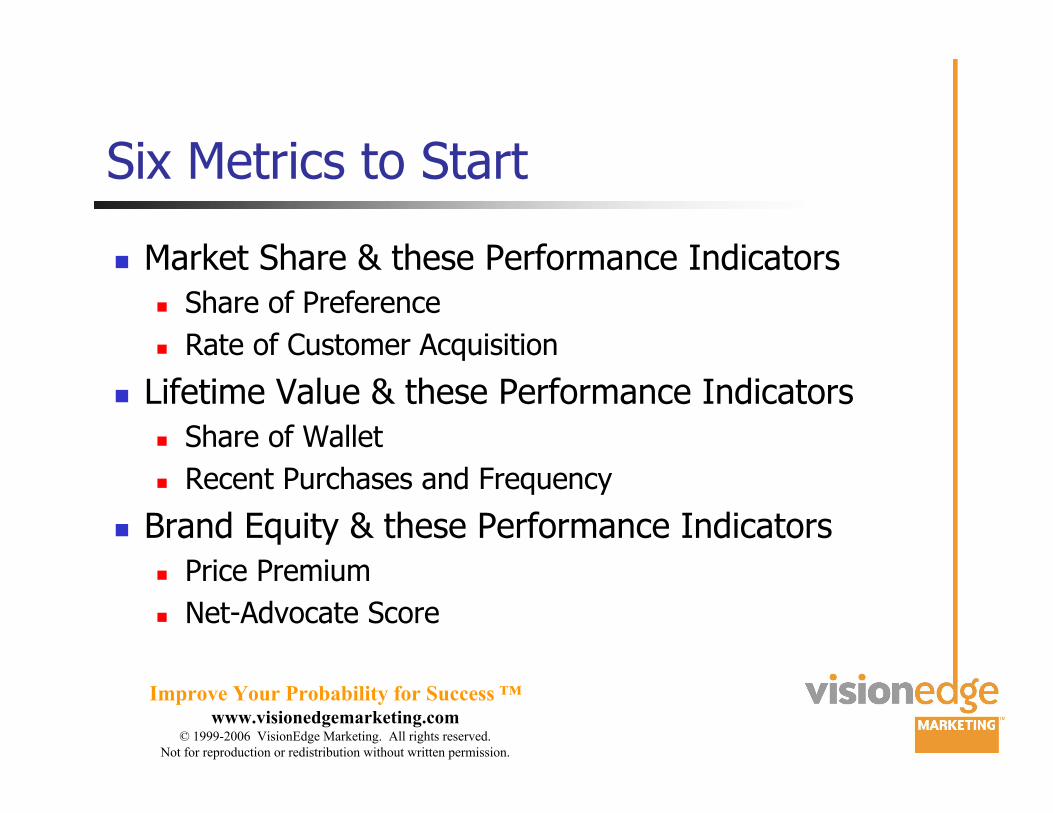
Six Metrics to Start
( Market Share & these Performance Indicators
( Share of Preference
( Rate of Customer Acquisition
( Lifetime Value & these Performance Indicators
( Share of Wallet
( Recent Purchases and Frequency
( Brand Equity & these Performance Indicators
( Price Premium
( Net-Advocate Score
Improve Your Probability for Success ™www.visionedgemarketing.com
© 1999-2006 VisionEdge Marketing. All rights reserved.
Not for reproduction or redistribution without written permission.
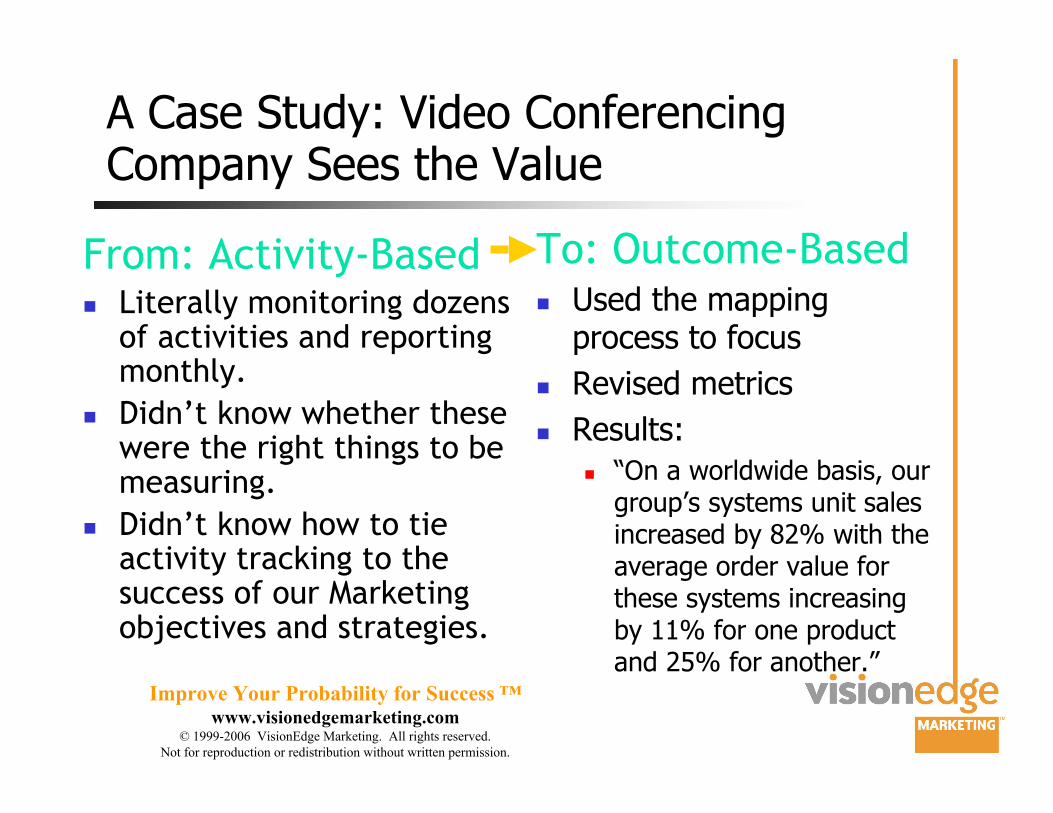
A Case Study: Video ConferencingCompany Sees the Value
From: Activity-Based( Literally monitoring dozens
of activities and reportingmonthly.
( Didn’t know whether thesewere the right things to bemeasuring.
( Didn’t know how to tieactivity tracking to thesuccess of our Marketingobjectives and strategies.
To: Outcome-Based( Used the mapping
process to focus
( Revised metrics
( Results:
( “On a worldwide basis, ourgroup’s systems unit salesincreased by 82% with theaverage order value forthese systems increasingby 11% for one productand 25% for another.”
Improve Your Probability for Success ™www.visionedgemarketing.com
© 1999-2006 VisionEdge Marketing. All rights reserved.
Not for reproduction or redistribution without written permission.
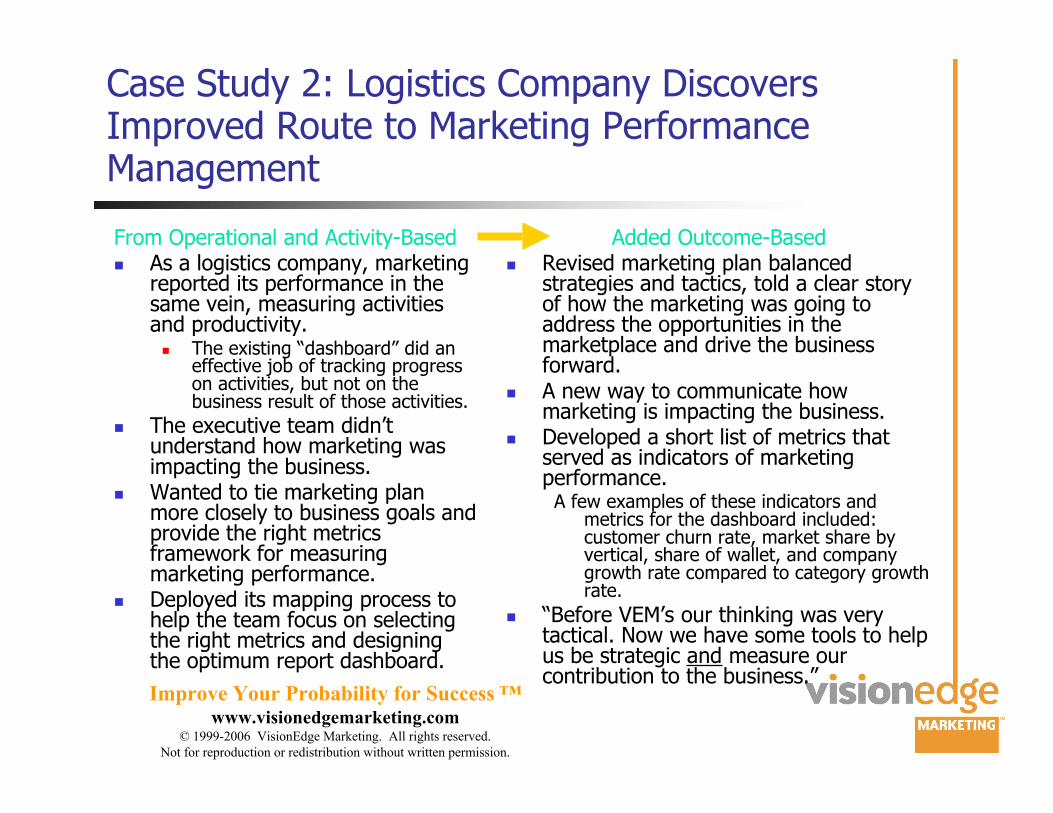
Case Study 2: Logistics Company DiscoversImproved Route to Marketing PerformanceManagement
From Operational and Activity-Based( As a logistics company, marketing
reported its performance in thesame vein, measuring activitiesand productivity.
( The existing “dashboard” did aneffective job of tracking progresson activities, but not on thebusiness result of those activities.
( The executive team didn’tunderstand how marketing wasimpacting the business.
( Wanted to tie marketing planmore closely to business goals andprovide the right metricsframework for measuringmarketing performance.
( Deployed its mapping process tohelp the team focus on selectingthe right metrics and designingthe optimum report dashboard.
Added Outcome-Based( Revised marketing plan balanced
strategies and tactics, told a clear storyof how the marketing was going toaddress the opportunities in themarketplace and drive the businessforward.
( A new way to communicate howmarketing is impacting the business.
( Developed a short list of metrics thatserved as indicators of marketingperformance.
A few examples of these indicators andmetrics for the dashboard included:customer churn rate, market share byvertical, share of wallet, and companygrowth rate compared to category growthrate.
( “Before VEM’s our thinking was verytactical. Now we have some tools to helpus be strategic and measure ourcontribution to the business.”
Improve Your Probability for Success ™www.visionedgemarketing.com
© 1999-2006 VisionEdge Marketing. All rights reserved.
Not for reproduction or redistribution without written permission.
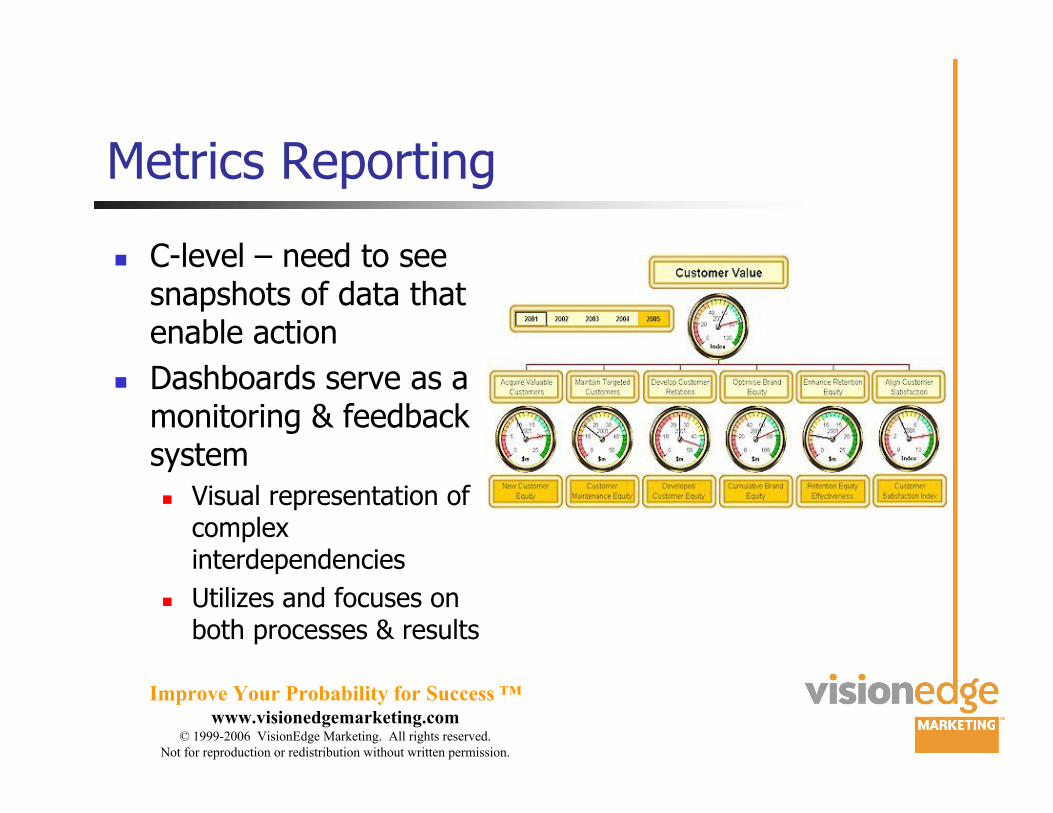
Metrics Reporting
( C-level – need to seesnapshots of data thatenable action
( Dashboards serve as amonitoring & feedbacksystem
( Visual representation ofcomplexinterdependencies
( Utilizes and focuses onboth processes & results
Improve Your Probability for Success ™www.visionedgemarketing.com
© 1999-2006 VisionEdge Marketing. All rights reserved.
Not for reproduction or redistribution without written permission.
Metrics Reporting - Dashboards
( Provide insight intoperformance
( Fosters decision-making
( Aligns strategy withimplementation
( “To address short- and long-term objectives, some firmshave developed marketingdashboards that define keymetrics and give a unified viewinto the effectiveness of theirmarketing.”
Taddy Hall, ARF
Improve Your Probability for Success ™www.visionedgemarketing.com
© 1999-2006 VisionEdge Marketing. All rights reserved.
Not for reproduction or redistribution without written permission.
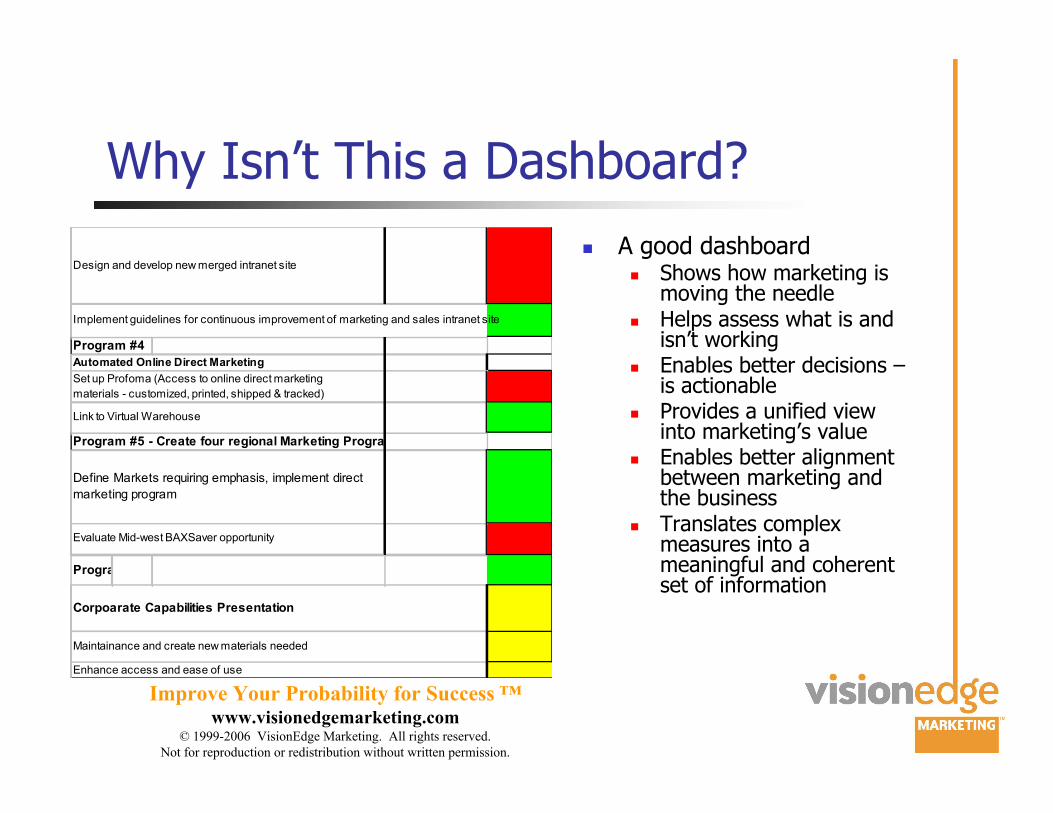
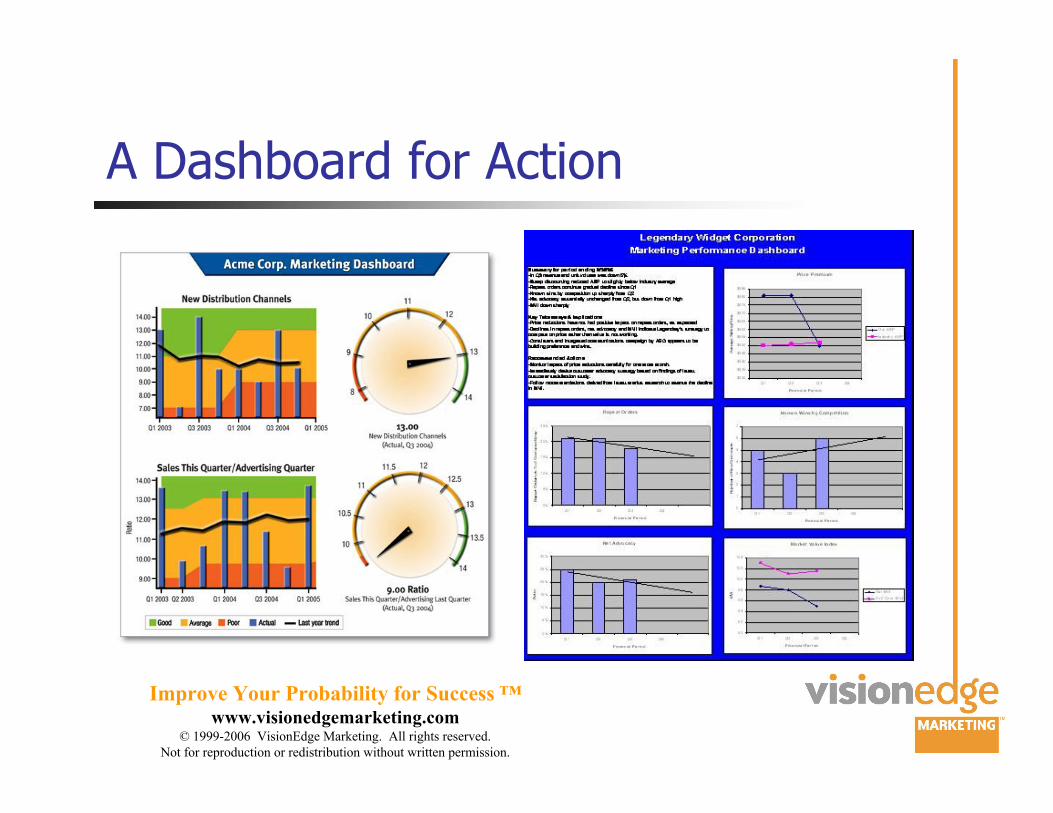
Why Isn’t This a Dashboard?
( A good dashboard( Shows how marketing is
moving the needle( Helps assess what is and
isn’t working( Enables better decisions –
is actionable( Provides a unified view
into marketing’s value( Enables better alignment
between marketing andthe business
( Translates complexmeasures into ameaningful and coherentset of information
Design and develop new merged intranet site
Implement guidelines for continuous improvement of marketing and sales intranet site
Program #4
Automated Online Direct Marketing
Program #5 - Create four regional Marketing Programs
Define Markets requiring emphasis, implement direct
marketing program
Evaluate Mid-west BAXSaver opportunity
Enhance access and ease of use
Maintainance and create new materials needed
Corpoarate Capabilities Presentation
Program #6
Set up Profoma (Access to online direct marketing
materials - customized, printed, shipped & tracked)
Link to Virtual Warehouse
Improve Your Probability for Success ™www.visionedgemarketing.com
© 1999-2006 VisionEdge Marketing. All rights reserved.
Not for reproduction or redistribution without written permission.
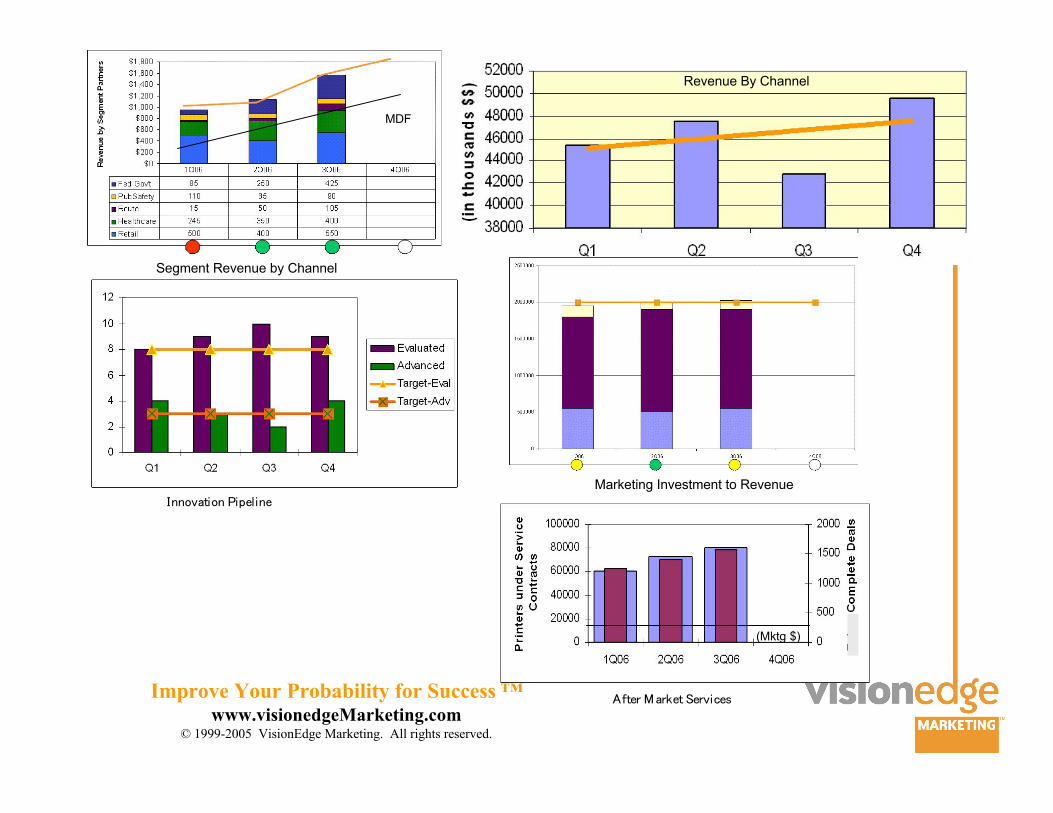
A Dashboard for Action
Improve Your Probability for Success ™www.visionedgeMarketing.com
© 1999-2005 VisionEdge Marketing. All rights reserved.
Segment Revenue by Channel
Revenue By Channel
!""#$%&'#"()'*+,'"+
-.&+/(0%/1+&(2+/$'3+4
Marketing Investment to Revenue
MDF
(Mktg $)
Improve Your Probability for Success ™www.visionedgemarketing.com
© 1999-2006 VisionEdge Marketing. All rights reserved.
Not for reproduction or redistribution without written permission.
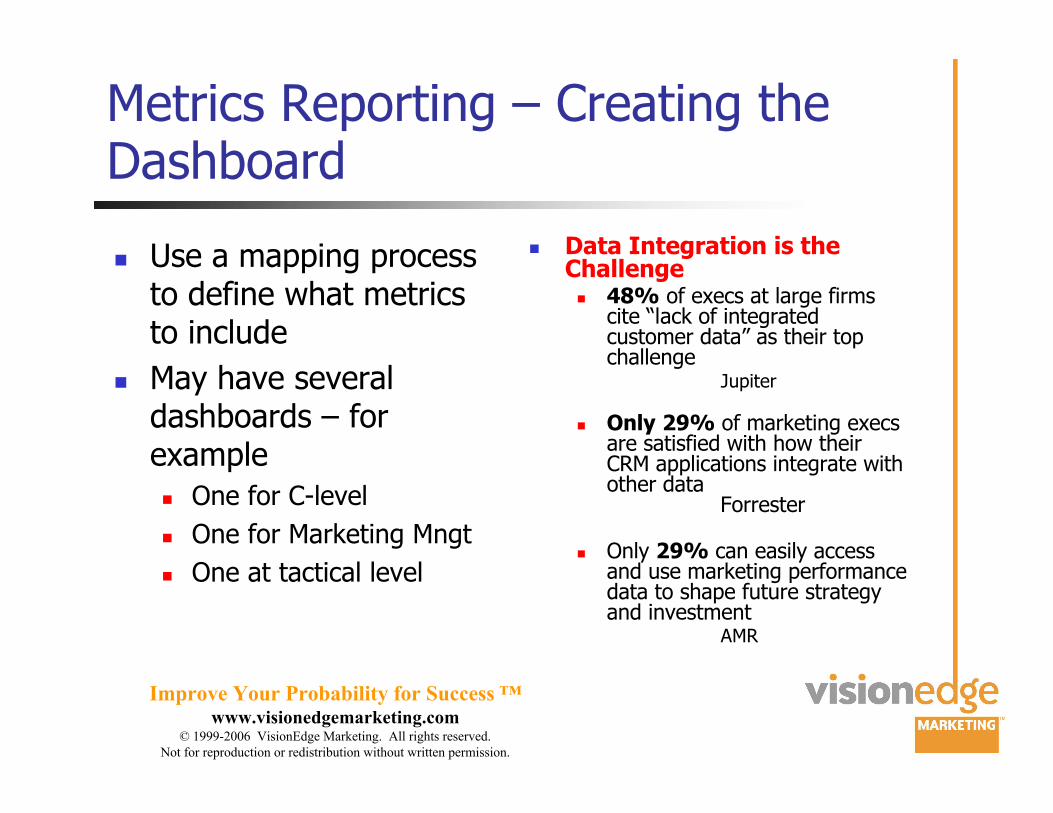
Metrics Reporting – Creating theDashboard
( Use a mapping processto define what metricsto include
( May have severaldashboards – forexample
( One for C-level
( One for Marketing Mngt
( One at tactical level
( Data Integration is theChallenge( 48% of execs at large firms
cite “lack of integratedcustomer data” as their topchallenge
Jupiter
( Only 29% of marketing execsare satisfied with how theirCRM applications integrate withother data
Forrester
( Only 29% can easily accessand use marketing performancedata to shape future strategyand investment
AMR
Improve Your Probability for Success ™www.visionedgemarketing.com
© 1999-2006 VisionEdge Marketing. All rights reserved.
Not for reproduction or redistribution without written permission.
Metrics Reporting
( Dashboard correlates Marketing activitiesand Metrics
( Focus on the most relevant, essential, & valuableactions
( Begin with business outcomes
( Identify most important measures of success
( Define performance indicators connected with thesemeasures
( Determine which data provides necessary information
( Analyze & report
Improve Your Probability for Success ™www.visionedgemarketing.com
© 1999-2006 VisionEdge Marketing. All rights reserved.
Not for reproduction or redistribution without written permission.
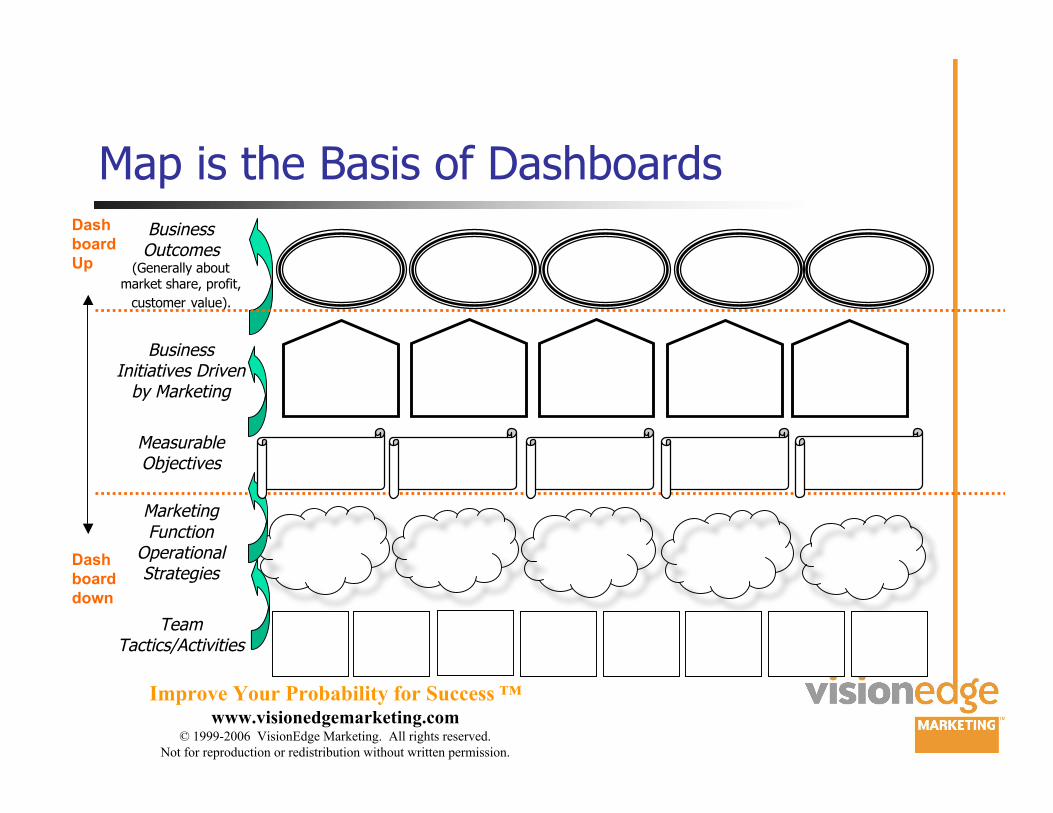
Map is the Basis of Dashboards
TeamTactics/Activities
MarketingFunction
OperationalStrategies
MeasurableObjectives
BusinessInitiatives Driven
by Marketing
BusinessOutcomes
(Generally aboutmarket share, profit,
customer value).
Dash
board
Up
Dash
board
down
Improve Your Probability for Success ™www.visionedgemarketing.com
© 1999-2006 VisionEdge Marketing. All rights reserved.
Not for reproduction or redistribution without written permission.
Creating Your Dashboard
( Design Your Dashboard to:
( Demonstrate how you are are moving theneedle
( To communicate what performance indicatorsaffect the business?
( When designing your dashboard consider
( What information/data will you need
( Whether you have access to this informationand if not, how will you acquire the data
Improve Your Probability for Success ™www.visionedgemarketing.com
© 1999-2006 VisionEdge Marketing. All rights reserved.
Not for reproduction or redistribution without written permission.
Marketing Dashboard
At least six metrics should be considered forevery marketing dashboard
!" New customer wins (acquisition) and rateof growth as it relates to market growth
#" New customers won by the competition$" Information about repeat business (SOW,
Customer Value)%" Customer Churn Rate/Defections/losses&" Overall Net Advocacy Score'" Market Value Index
Improve Your Probability for Success ™www.visionedgemarketing.com
© 1999-2006 VisionEdge Marketing. All rights reserved.
Not for reproduction or redistribution without written permission.
Where to Start
( Companies Must Take Metrics Seriously
( Conduct an Audit
( Companies Must Use Metrics to GuideBusiness Decisions
( Create Dashboards & Not UsualOperational Charts
( Companies Need Marketers with Metrics Skills
( Training Starting at Undergraduate Level on Up
Improve Your Probability for Success ™www.visionedgemarketing.com
© 1999-2006 VisionEdge Marketing. All rights reserved.
Not for reproduction or redistribution without written permission.
Metrics Competency
( State of tools, systems, & processes
( Audits provide a means to assessorganization’s current state, how muchchange required & in whichdirection/areas
( Self-scoring
( External experts
Improve Your Probability for Success ™www.visionedgemarketing.com
© 1999-2006 VisionEdge Marketing. All rights reserved.
Not for reproduction or redistribution without written permission.
Metrics Proficiency
( Training( Even best athletes, e.g.
Olympic contestantsinvest in training &coaches
( Marketing Performanceexceeds trackingnumbers & requiresskills at right time atright place( Training in Marketing
measurement rare
Improve Your Probability for Success ™www.visionedgemarketing.com
© 1999-2006 VisionEdge Marketing. All rights reserved.
Not for reproduction or redistribution without written permission.
Success Factors
Effective Metrics, commit to:
!"Strategies Linked to Metrics
#"Validate Links between PerformanceIndicators you Selectand Strategic Metrics
$"Set Right Performance Targets
%"Measure Correctly & Consistently
Improve Your Probability for Success ™www.visionedgemarketing.com
© 1999-2006 VisionEdge Marketing. All rights reserved.
Not for reproduction or redistribution without written permission.
Three Final Thoughts
!" A Little Less Talk and A Lot MoreAction
#" Start with the data you have, defineyour gaps and your action plan to fix
$" Stop reporting on activities, think interms of what information is neededto make important strategic decisions
Improve Your Probability for Success ™www.visionedgemarketing.com
© 1999-2006 VisionEdge Marketing. All rights reserved.
Not for reproduction or redistribution without written permission.
Thank you
( Questions?
Metrics concept papers, Measure WhatMatters book, and subscription to freeweekly Metrics Newsletter available at
www.visionedgemarketing.com
Improve Your Probability for Success ™www.visionedgemarketing.com
© 1999-2006 VisionEdge Marketing. All rights reserved.
Not for reproduction or redistribution without written permission.
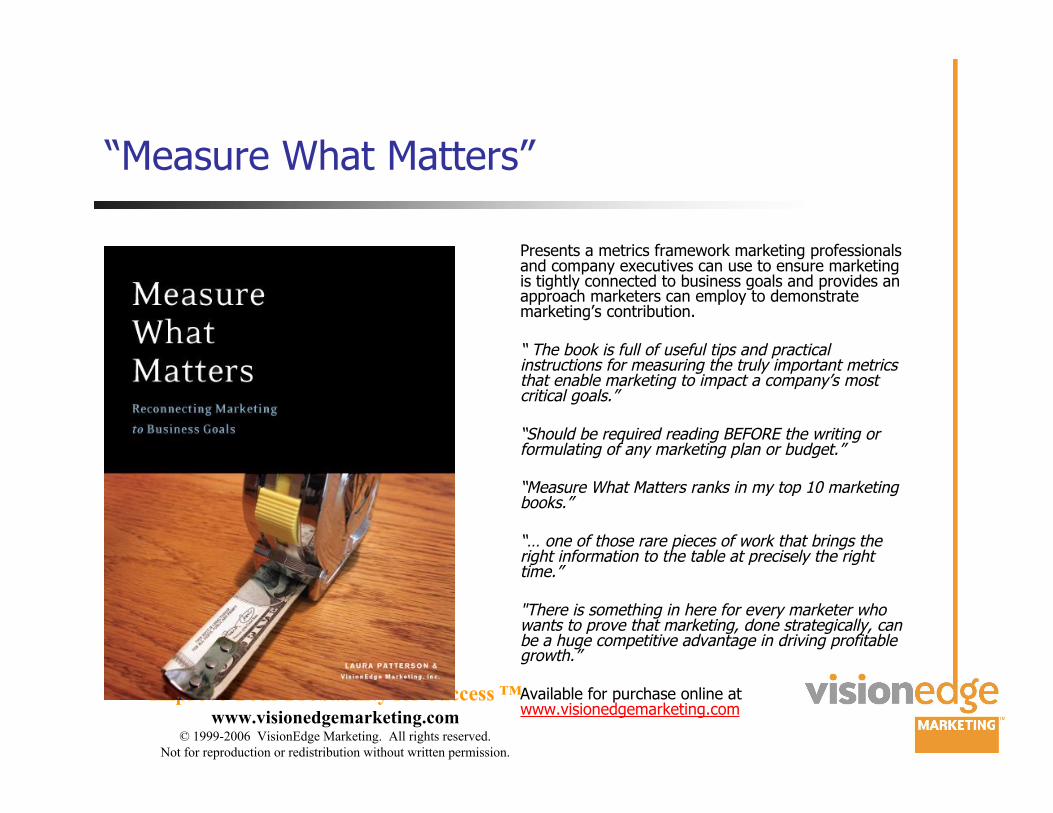
“Measure What Matters”
Presents a metrics framework marketing professionalsand company executives can use to ensure marketingis tightly connected to business goals and provides anapproach marketers can employ to demonstratemarketing’s contribution.
“ The book is full of useful tips and practicalinstructions for measuring the truly important metricsthat enable marketing to impact a company’s mostcritical goals.”
“Should be required reading BEFORE the writing orformulating of any marketing plan or budget.”
“Measure What Matters ranks in my top 10 marketingbooks.”
“… one of those rare pieces of work that brings theright information to the table at precisely the righttime.”
"There is something in here for every marketer whowants to prove that marketing, done strategically, canbe a huge competitive advantage in driving profitablegrowth.”
Available for purchase online atwww.visionedgemarketing.com
Improve Your Probability for Success ™www.visionedgemarketing.com
© 1999-2006 VisionEdge Marketing. All rights reserved.
Not for reproduction or redistribution without written permission.
About VisionEdge Marketing
( Headquartered in Austin, TX, VisionEdge Marketing, Inc. is theleader in metrics-focused marketing, providing complete strategicand product marketing services and training
( Company provides data-based strategically-tactical! programs toinfluence prospect and customer purchasing behavior and drivedemand designed to build and maximize valuation throughpositioning and brand strategy
( The firm primarily works in the B-B space, predominantlytechnology-based companies with an emphasis on software,wireless, security, networking, computing, semiconductors, andmedical devices. Some of our 70+customers include: AbbottSpine, a division of Abbott Labs; Adobe; BAX Global; BarberFoods; Boxx Technologies; ETS-Lindgren; FreescaleSemiconductor; Infoglide Software; Motion Computing; ROCSoftware; SkyBitz; and Sterling Commerce