methods of analysis of sewage sludge solid wastes and compost · analysis of sewage sludge solid...
TRANSCRIPT
3 4 0
7 8 M E
METHODS OF ANALYSIS OF SEWAGE SLUDGE SOLID WASTES AND COMPOST
WHO INTERNATIONAL REFERENCE CENTRE FOR WASTES DISPOSAL
CH-8600 DUBENDORF (SWITZERLAND)
1978
r. 3C/0-78MG-
METHODS OF ANALYSIS OF SEWAGE SLUDGE SOLID WASTES AND COMPOST
LIBRARY w ^ International Stefersnce Centre
tor Community Watar Supp«V
WHO INTERNATIONAL REFERENCE CENTRE FOR WASTES DISPOSAL
CH-8600 DUBENDORF (SWITZERLAND)
1978
PREFACE
An essential tool for research and development in most technical
and scientific fields is analysis: Analytical techniques enable one
to tackle a problem more successfully, and the application of the
same methods everywhere makes it possible to compare the results and
usefullness of individual investigations.
Compared to other disciplines, solid waste is a rather young but
nevertheless rapidly developping field of interest. To fulfil the
needs for analytical techniques these simple "Methods of Analysis V/X? \\v-
have been compiled. They are specifically suited to the more common
waste problems:yExcept for Atomic^Absorption Spectroscopy the labora
tory equipment and techniques required are quite simple. There is no
need for sophisticated analysis of high accuracy, since the starting
material, namely waste, is so heterogeneous that good sampling is
usually more difficult than the subsequent analysis. I
The following methods, which are quite common in experimental
chemical laboratories, have been especially adapted to the problems
o_f.-sewage sludge, municipal solid waste, and compost. /Part I, which
covers the analysis of sewage sludge, is based on the Final Report
of the Management Committee of the COST-Project 68 (European Coope
ration and Coordination in the Field of Scientific and Technical
Research). Part II deals with solid municipal waste and compost.
Initiall-y-jT7jthis €:ha-ptevi; has been prepared by the Solid Waste Dept.
of the Swiss Federal Institute for Water Resources and Water Pollu
tion Control (EAWAG)/_in r9%,l-. E'AWAG, in cooperation with ISWA ("In
ternational Solid Wastes and Public Cleansing Association") published
a similar manual in 1970, and the third edition, including more
sophisticated methods, is planned for 1978/79.
/ V .1
/
The WHO International Reference Centre for Wastes Disposal is
grateful to the staff of the Solid Waste Dept. of EAWAG who col
laborated in the preparation of this manual and whose support is
especially acknowledged.
W IIKJJ [U Ct-lu^o P.H.Brunner H.R.Wasmer
Editor Manager
WHO International Reference Centre for Wastes Disposal
Diibendorf (Switzerland), January ]978
Contents Pa9e
PART I SEWAGE SLUDGE
1.1. Sampling, preparation and storage of sewage sludge 1
1.2. Water content and dry residue 2
1.3. Volatile and nonvolatile substance 3
1.4. Heavy metals 4
1.5. Phosphorus 5
1.6. pH-value 7
1.7. Undissolved and dissolved substance 8
1.8. Settling rate, settled sludge volume, sludge index
and sludge density index 11
1.9. Capillary suction time 13
1.10. Specific resistance to filtration 15
PART II SOLID WASTE AND COMPOST
2.1. Preparation and storage of refuse and compost 18
2.2. Water content and dry residue 19
2.3. Volatile substance and non volatile substance 20
2.4. Empirical carbon content 21
2.5. Carbon 22
2.6. Hydrogen 25
2.7. Kjeldahl-nitrogen 26
2.8. Ratio of carbon to nitrogen 2 7
2.9. Calcium, sodium and potassium 28
2.10. Heavy metals 30
2.11. Phosphorus 32
2.12. Salt content 34
2.13. Chloride 35
2.14. pH-value 37
2.15. Calorific value and heat of combustion 38
2.16. Cellulose content 4 0
2.17. Fermentability 41
2.18. Seed test 42
1. Sewage Sludge
1.1. Sampling, Preparation and Storage of Sewage Sludge
Sewage sludge is a heterogeneous, frequently unstable, mixture of dissolved and undissolved substances in water. In order to attain representative samples, the following procedures are recommended:
1) The content of the sludge tank has to be well mixed before samples can be taken. This agitation changes certain physical characteristics by damaging the floe structure. If such physical properties are to be measured, the mixing must be done as carefully and as shortly as possible.
When dealing with large sludge containers, samples should be taken at different places of the tank and then combined to provide the final sample.
2) If possible, collect the samples when the sludge is pumped, e.g. from an open duct. Equivalent volumes should be collected with equal time intervals in a defined period of time.
3) In the laboratory, the samples are drained through a 4 mm screen. When the structure of the floes is not to be considered, the sludge can also be put through a mincing machine. Immediately before analyzing, samples are stirred in accordance to the kind of information one is looking for: For parameters like water content, dried residue or density, samples are shaken thoroughly to become homogeneous. When analyzing other parameters, where the structure of the floes is of importance (e.g. sedimentation rate, filtration resistance, etc.), samples are only allowed to be stirred slowly. For better results, the sludge is carefully mixed by pouring it repeatedly from one beaker into another.
4) If the dry residue of a sample is used for additional analysis (e.g. calorific value), it has to be finely grinded (<0.2 mm),
5) Sludge samples must be kept below 4 C. They should be stored in unsealed, partly filled polyethylene bottles. For certain investigations (measurement of volatile compounds), the sludge samples have to be stored in sealed glass bottles.
2
1.2. Water Content and Dry Residue
1. Definition
The w a t e r c o n t e n t (WC) is defined as the total weight-loss of a sample after it has been dried at 105 C.
The d r y r e s i d u e (DR) is defined as the remaining material after the sample has been dried at 105 C.
WC and DR are expressed as percentage, and they add up to a total of 100 percent.
2. Principle
In a mixture of liquids and solids, the two phases can be separated because of their difference in vapor pressure.
3. Procedure
3il;__Usin2_a_Dry_i.n2_Oven
Put 100-2 00 g of a well-mixed sludge sample into a flask and weigh it to the nearest 0.1 gram. Let it dry in the oven for 24 hours at the temperature of 100 + 2 C.
WC in % = initial weight - final weight . Q
initial weight -
DR in % = 100 - WG (+0.1)
3 .2 .__Using__Inf rared Light
Put 2 0 to 40 grams of the sample in an aluminum bowl and weigh it to the nearest 0.01 gram. Let it dry on a balance under an infrared lamp until the weight remains constant. During this drying process, the surface of the residue should not become carbonized. Using a 200 W bulb with a distance of 4.5 cm, drying usually takes 30 minutes: 10 minutes at 180 V (~175°C), followed by 20 minutes at 90 V (~105°C) . WC and DR are calculated according to 3.1.
4. Notes
4.1. To separate substances with similar vapor pressures is difficult. The measured water content therefore includes substances like nitrogen-containing compounds, organic solvents, certain metals, etc. Such substances cause an inaccuracy which is usually less than one percent.
4.2. The dried samples are hygroscopic and should be stored in an exsiccator.
3
1.3. Volatile and non volatile substance
1. Definition
V o l a t i l e s u b s t a n c e (VS)(loss on ignition) is the amount of mass of dry residue which has been gasified at 550 C. Volatile substance is not identical with the content of organic substance, since part of the inorganic substances is also decomposed or volatilized at 550 C.
N o n v o l a t i l e s u b s t a n c e (NVS) is the mass of the residue after ignition of the dry residue at 550 C. The non volatile substance is also known as the Ash Content.
VS and NVS are expressed as percentage: VS + NVS = 100 %.
2. Principle
When o r g a n i c subs tances a re i g n i t e d , they y i e l d in v o l a t i l e ox ida t ion p r o d u c t s . In g e n e r a l , t he ox ida t i o n of i n o r g a n i c subs tances r e s u l t s i n s o 1 i d p r o d u c t s .
3. Procedure
Place 3-5 grams of the dry residue to the accuracy of 1 mg in a Muffle Furnace at 550°C + 5°C. After one hour allow the sample to cool down in a exsiccator and reweigh the residue.
VS in % = initial weight - final weight . 1QQ Q > 1 )
initial weight
NVS in % = 100 - VS (+0.1)
Notes
4.1. At 550°C, not only the oxidation products but some of the formed inorganic decomposition products may become volatile (Metal carbonate -»- C02, crystal water -> H O ) .
4.2. If the content of organic matter is high, the sample should first be heated gently by a Bunsen burner. This prevents losses which can be caused by inflammation or fulmination.
4
1 .4 . Heavy M e t a l s
1. Definition
H e a v y m e t a l s is the term applied to those metallic elements which have a density >6 g/cm3. The total concentration of heavy metals in a sewage sludge is composed of the dissolved and the undissolved metals. It is expressed in mg/1 or ppm.
2. Principle
The free metallic atoms can absorb specific wavelengths of a continuous spectrum. The amount of light absorbed depends on the concentration of the metal.The free metallic atoms are usually produced by vaporizing a solution.
3. Procedure
3.1. The dissolved heavy metals are analyzed in the filtrate of a Membranfiltration (see 1.7), according to the methods used in water chemistry.
3.2. For the determination of the undissolved heavy metals, the filter-residue obtained in 3.1. has to be prepared as described in 3.3.
3.3. If the total concentration of the heavy metals is to be measured, the metals must first be dissolved. This is appropriately done by wet mineralisation: Place 100 - 250 mg of dry residue to the accuracy of 0.1 mg in a Erlenmeyer flask which has been previously cleaned with nitric acid. Add 5 ml cone, nitric acid, heat the suspension to the boiling point, and evaporate most of the acid. Add 2 ml digestion reagent (100 ml cone. HN03*and 50 ml cone. HCIO4") , and heat the sample again until white perchloricacid evaporates. If the residual acid appears brown or yellow, repeat the procedure with 2 ml digestion reagent until a colorless residue (silicic acid) remains only. Pour the digested sample into a 50 ml or 100 ml volumetric flask, and fill it up with 0.1 N nitric acid. Analyse the concentration of metals in this solution by an atomic absorption spectrometer according to the usual procedures.
4. Notes
4.1. In order to prevent fulmination, sludges with a large amount of volatile substance should first be treated with 5 ml diluted nitric acid.
4.2. This digestion method is not suited for samples to be analysed by atomic absorption using a graphite tube.
4.3. Mercury cannot be determined with this method.
* puriss. p.a.
5
1.5. Phosphorus
1. Definition
The p h o s p h o r u s c o n t e n t i s def ined as the t o t a l phosphorus in a sample expressed as weight pe rcen tage .
2. Principle
The sample is wet digested, and the phosphorus is measured photometrically as vanado-phospho-ammoniummolybdate (PO.(NH.)_ Vd0o NH, • 16 Mo0o). 4 4 3 3 4 3
3. Procedure
3I_l:__Di2estion
Place 100 - 250 mg of Dry Residue to the accuracy of 0.1 mg in a Kjeldahl flask which has been cleaned with nitric acid. Add 5 ml cone, nitric acid and heat the suspension to the boiling point. After the acid has almost completely evaporated, add 2 ml digestion reagent (100 ml cone. HNO^ p.a. and 50 ml HC104 p.a.). Heat up the sample again until white perchloric acid evaporates. If the residual acid appears brown or yellow, repeat the procedure with 2 ml digestion reagent until a colorless residue (silicic acid) remains.
3 i.2;__Colorimetric_ Analysis
Add 4 0 ml vanadium-molybdate solution to the cold, digested sample. Stir the yellow solution for about 1 hour and then filter it through a G3 glass suction filter. Measure the extinction of the filtrate with a Spectrophotometer and a 1 cm cell at a wavelength of 4 70 ran. The phosphate concentration can be determined by using a calibration curve with calium-dihydrogen-phosphate (KH2PCK). 1000 mg KH2PO4 correspond to 227.6 mg phosphorus. The result is reported as percentage of phosphorus in the sample.
1) Solutions a, b and c are mixed together in the following order and diluted with distilled water to 1000 ml.
a) 67 ml cone. HNO-. p.a. in 33 ml distilled water.
b) 0.25 % ammoniumvanadate: 0.25 g NH VO- p.a. in hot distilled water plus 2 ml cone. HN0_ p.a., diluted to 100 ml.
c) 5 % ammoniummolybdate: 5 g (HN4), Mo70„4. 4 H O p.a. in hot
distilled water and diluted to 100 ml.
6
4. Notes
4.1. Between 400 - 490 nm, the sensitivity of the measurement increases with decreasing wavelength. At ~ 400 nm, the absorption is affected significantly by iron-Ill.
4.2. Silicates produce the same color as phosphates. The ratio P205
: Si02 should not be less than 1 : 44.
4.3. The concentration of nitric acid in the solution to be measured should be between 0.2 N and 1.6 N.
7
Value
Definition
The p H - v a l u e is the term applied to the negative logarithm of the concentration of hydrogen ions either in the sludge itself or in the sludge water.
Principle
Between an aqueous solution and a glass surface exists a potential difference which depends on the pH of the solution. Therefore, the pH value can be determined by measuring this voltage with a glass electrode.
Procedure
The pH value is measured with a glass electrode. Before each measurement, the pH electrode has to be calibrated and corrected for temperature. The temperature should be reported together with the result.
3^1^_Direct_Mea^urement
If the sludge is quite fluid, the glass electrode can be inserted directly into the sample. After the measured value remained constant for at least 30 seconds, the reading is taken to the accuracy of 0.1 unit.
3^2^ Measurement in the Sludge Water
If dealing with a thick sludge containing many undissolved substances, the sample must first be centrifuged or filtered. The pH can then be measured according to 3.1.
Notes
4.1. If, due to the heterogeneity of the material, the pH-value differs in various samples of the same sludge, the range of the actually measured pH values and not the calculated mean value should be reported.
4.2. The carbondioxide content of the sample influences the pH value. Since the CO2 reaches equilibrium very quickly, the pH must be measured immediately after sampling.
8
1.7. Undissolved and Dissolved Substances
1. Definition
U n d i s s o l v e d s u b s t a n c e (US) is the term applied to the material which is left after filtration of a sample through a 0.4 5 um filter, and the subsequent drying of the filter cake in an oven.
D i s s o l v e d s u b s t a n c e (DS) is the term applied to the material which remains after the filtrate has been evaporated to dryness.
Dissolved and undissolved substances are expressed as percentage of the weight of the sludge. They generally add up to give the total dry residue:
US + DS = DR in %.
2. Principle
The dissolved solids can be largely separated from the undissolved solids by using a very fine filter.
3. Procedure
3.1^.Measurement
Weigh out 80 grams of sludge to the accuracy of 0.1 gram. Centrifuge at room temperature with 3000 g for 40 minutes. Record the weight of the sediment (U-,D ) and let it dry for 24 hours at 105 ± 2°C (US1 DS,).
Transfer the liquid fraction of the centrifuged sample into a pressfiltration-apparatus which has been supplied with a 0.45 um membrane filter (F)1). For the filtration use a pressure of 6.1-105 Pa (5 atu). Rinse the filtration apparatus with 15 ml water while the filtercake is still slightly humid, and put it again under pressure for a few minutes. Depending on the kind of sludge, the required filtration time varies from 5 to 50 min.
The weighed filter residue (incl. filter) (U2F) is dried for one hour at 105 + 2°C and 2.7-103 Pa (20 mm Hg). The weight of the empty membrane filter (F) is subtracted from the weight of the dried filter residue incl. filter, to yield the filter residue (US-)•
Also, the weighed filtrate (D2) is dried at 105 + 2°C for 24 hours, and weighed (DS~).
1) Prepare the membrane filter as follows: Soak the filter for 6 hours in warm water ( ~ 70 C) and let it dry at 105 C and 2.7*10 Pa (20 mm Hg) for one hour. Store them in an exsiccator.
9
3^2._Calculations
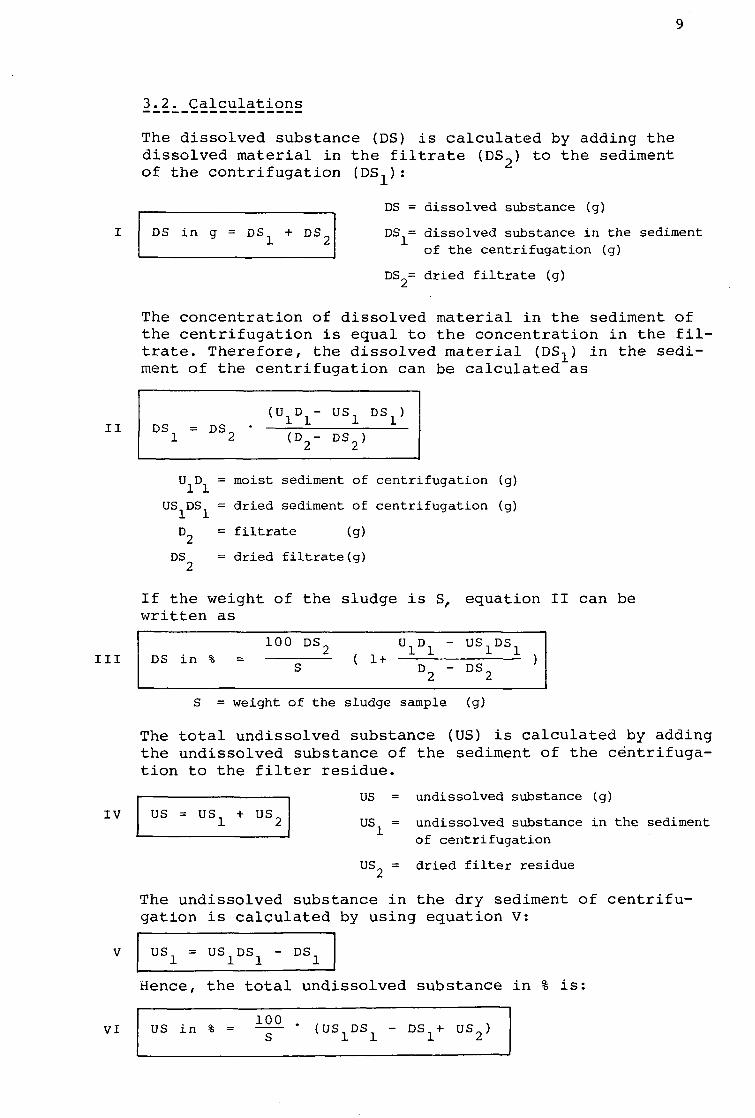
The dissolved substance (DS) is calculated by adding the dissolved material in the filtrate (DS_) to the sediment of the contrifugation (DS,):
DS = dissolved substance (g)
DS i n g = DS + DS DS = d i s s o l v e d substance i n t h e sediment of t h e c e n t r i f u g a t i o n (g)
DS = d r i e d f i l t r a t e (g)
The c o n c e n t r a t i o n of d i s s o l v e d m a t e r i a l i n t h e s e d i m e n t of t h e c e n t r i f u g a t i o n i s e q u a l t o t h e c o n c e n t r a t i o n i n t h e f i l t r a t e . T h e r e f o r e , t h e d i s s o l v e d m a t e r i a l (DS-,) i n t h e s e d i ment of t h e c e n t r i f u g a t i o n can be c a l c u l a t e d a s
D S 1 = D S2
( u i V u s i D V ( D 2 - D S 2 )
U D = moist sediment of centrifugation (g)
US DS = dried sediment of centrifugation (g)
= filtrate (g)
DS = dried filtrate(g) 2
If the weight of the sludge is S, equation II can be written as
DS in % 100 DS U D - US DS
£ ( 1+ _L_i ± — i ) D2 - DS 2
S = weight of the sludge sample (g)
The total undissolved substance (US) is calculated by adding the undissolved substance of the sediment of the centrifugation to the filter residue.
us = us + us US = undisso lved substance (g)
US = undisso lved substance in t h e sediment of c e n t r i f u g a t i o n
US = d r i e d f i l t e r r e s idue
The undissolved substance in the dry sediment of cen t r i fugation i s calculated by using equation V:
us = us DS - DS
Hence, the total undissolved substance in % is:
us in % = 100
(0S1DS1 DS1+ US2)
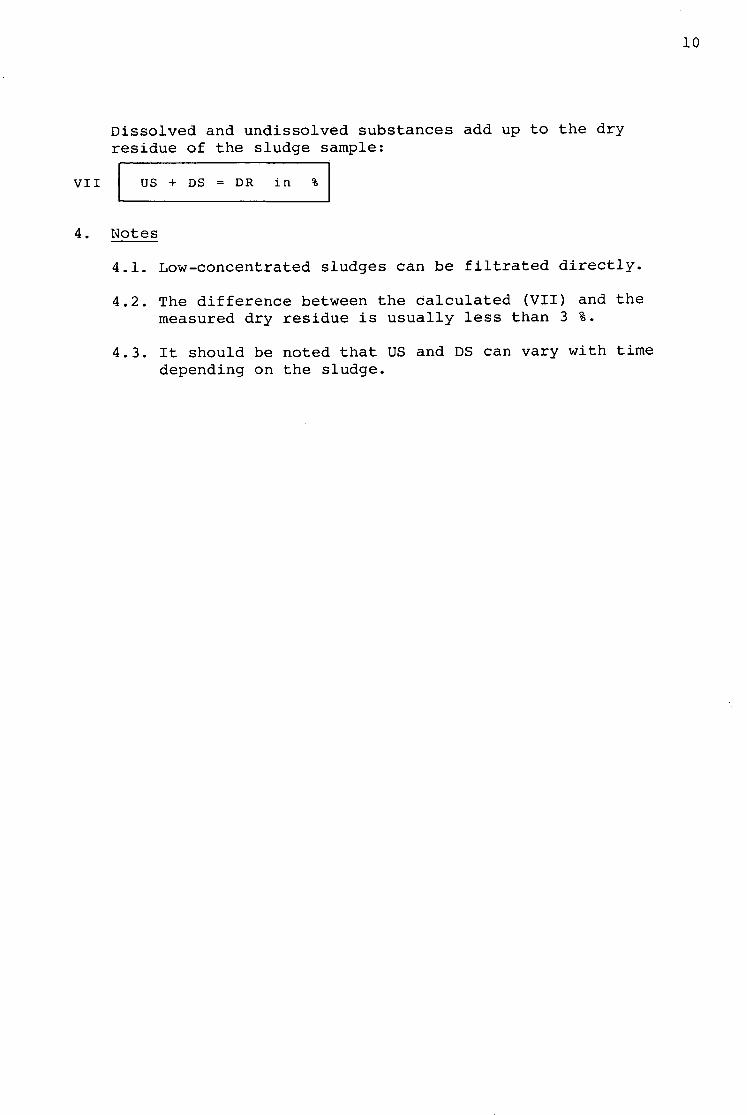
Dissolved and undissolved substances add up to the dry residue of the sludge sample:
US + DS = DR in %
Notes
4.1. Low-concentrated sludges can be filtrated directly.
4.2. The difference between the calculated (VII) and the measured dry residue is usually less than 3 %.
4.3. It should be noted that US and DS can vary with time depending on the sludge.
11
1.8. Determination of the Settling Rate, the Settled Sludge Volume, the Sludge Index and the Sludge Density Index _ _ ^
1. Definition
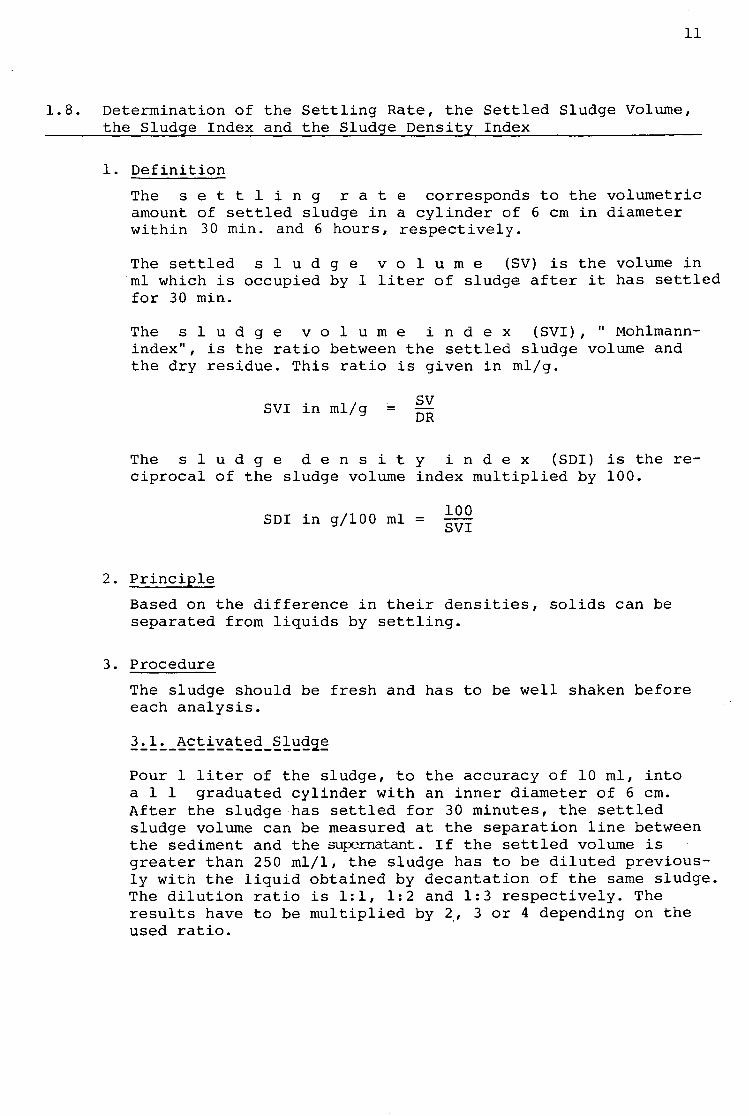
The s e t t l i n g r a t e corresponds to the volumetric amount of settled sludge in a cylinder of 6 cm in diameter within 30 min. and 6 hours, respectively.
The settled s l u d g e v o l u m e (SV) is the volume in ml which is occupied by 1 liter of sludge after it has settled for 30 min.
The s l u d g e v o l u m e i n d e x (SVI), " Mohlmann-index", is the ratio between the settled sludge volume and the dry residue. This ratio is given in ml/g.
SVI in ml/g = |^
The s l u d g e d e n s i t y i n d e x (SDI) is the reciprocal of the sludge volume index multiplied by 10 0.
SDI in g/100 ml = ^7?
2. Principle
Based on the difference in their densities, solids can be separated from liquids by settling.
3. Procedure
The sludge should be fresh and has to be well shaken before each analysis.
^l^Activated Sludge
Pour 1 liter of the sludge, to the accuracy of 10 ml, into a l l graduated cylinder with an inner diameter of 6 cm. After the sludge has settled for 30 minutes, the settled sludge volume can be measured at the separation line between the sediment and the supernatant. If the settled volume is greater than 250 ml/1, the sludge has to be diluted previously with the liquid obtained by decantation of the same sludge. The dilution ratio is 1:1, 1:2 and 1:3 respectively. The results have to be multiplied by 2, 3 or 4 depending on the used ratio.
12
31_2i_Other_Slud2es
If dealing with sludges with a long settling time (e.g. digested sludge, raw sludge), use the same procedure as in 3.1. The settling time, however, is increased to 6 hours.
4. Notes
4.1. Temperature influences the settling rate, and therefore the temperature difference between the sample and the environment should be < 2 C.
4.2. Vibrations during the settling test can affect the results.
13
1.9. Determination of the Capillary Suction Time (CST)
1. Definition
C a p i l l a r y s u c t i o n t i m e (CST) is the term applied to the time needed until a certain volume of a sludge is sucked into a filter paper by capillary pressure. The CST enables one to estimate roughly the required amount of flocculants and the filtration behavior of a sludge. The CST is reported in seconds.
2. Principle
When a sludge sample is put on a filter paper, a layer of solids is built up on the filter surface. This causes an increase in the filtration resistance; therefore, the volume of filtrate, which is sucked capillarily into the filter paper, decreases per unit of time, and the velocity of flow of the filtrate's front line decreases, too. The CST is the time required for this front line to travel a certain distance on a standardized filter paper.
3. Procedure
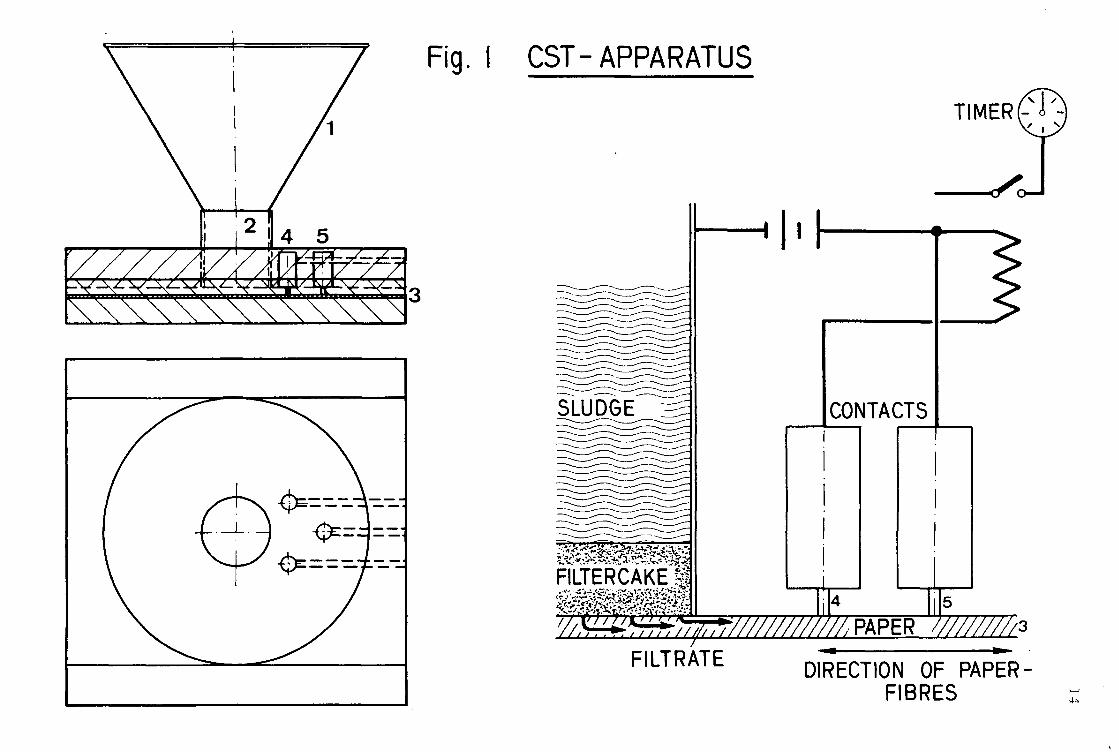
The capillary suction time is measured by a CST apparatus as shown in Figure 1.
Pour about 4 0 ml of the sludge through the funnel 1 into the tube 2. The capillaries of the 0.1 x 7 x 9 cm standardized cardboard 3 withdraw water from the sludge, and the water front moves in a nearly radial direction.
Because of the anisotrophy of the cardboard, the cellulose-fibres should always be parallel to the electrical contacts. The flow time between 4 and 5 is measured in seconds by an electric watch and yields in capillary suction time.
4. Notes
4.1. The capillary forces are proportional to the surface tension. The surface tension of different types of sludge varies only within narrow boundaries, and therefore an influence on the CST is unlikely.
4.2. To determine the flocculation behavior of a sludge, the following procedure is suggested:
Pour 40 ml of sludge into a beaker with a wide, closeable bottom-opening. Add flocculants to the sample while stirring it continuously. After 40 seconds, let the stirred sludge quickly flow through the bottom opening into the funnel of the CST apparatus. Proceed as described in 3.
CST-APPARATUS
TIMER (-
« < O—J
SLUDGE H
r-n T ^ r " » / N A i / r
< l '
CONTACTS
FILTRATE DIRECTION OF PAPER-FIBRES
15
1.10. Determination of the Specific Resistance to Filtration
Definition
The s p e c i f i c r e s i s t a n c e t o f i l t r a t i o n (r) is defined as the filtration resistance per cm2 filter area and per g dry residue for each ml residue which is built up on a filter, r is reported in m/kg.
The resistance to filtration r is based on d'Arcy's law which states, that the volumetric flow of filtrate per unit area is proportional to the dynamic viscosity of the filtrate. The resistance to filtration is reported in m -1
Principle
Since the filtration volume V(t) is time-dependent, the resistance to filtration can be calculated according to d'Arcy's law, provided that the filtration pressure stays constant and the filtration area A and the viscosity n are known.
II
According to Karmann, the gradient —r— stays constant during the undisturbed filtration process. Therefore, the specific resistance to filtration can be determined by measuring the time dependence of the filtrate volume and using equation II.
3. Procedure
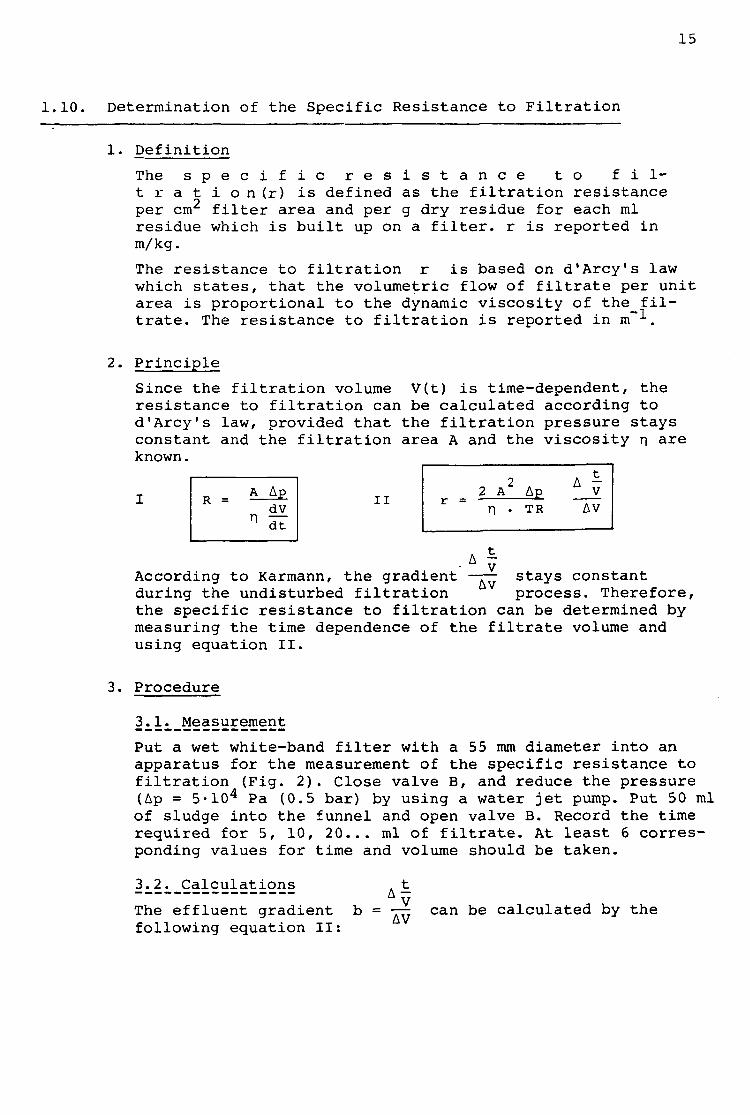
^ii:._Mea^urement
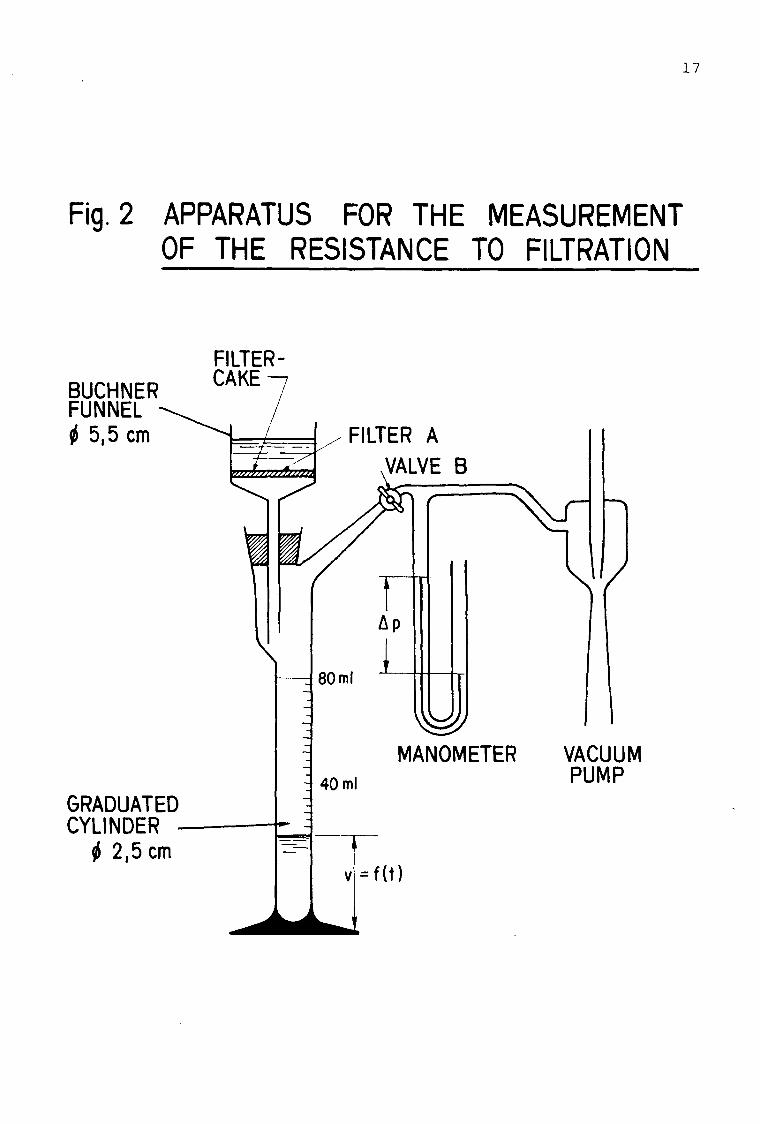
Put a wet white-band filter with a 55 mm diameter into an apparatus for the measurement of the specific resistance to filtration (Fig. 2). Close valve B, and reduce the pressure (Ap = 5-104 Pa (0.5 bar) by using a water jet pump. Put 50 ml of sludge into the funnel and open valve B. Record the time required for 5, 10, 20... ml of filtrate. At least 6 corresponding values for time and volume should be taken.
3^2L_Calculations
The effluent gradient b = following equation II:
4 i AV
can be calculated by the
16
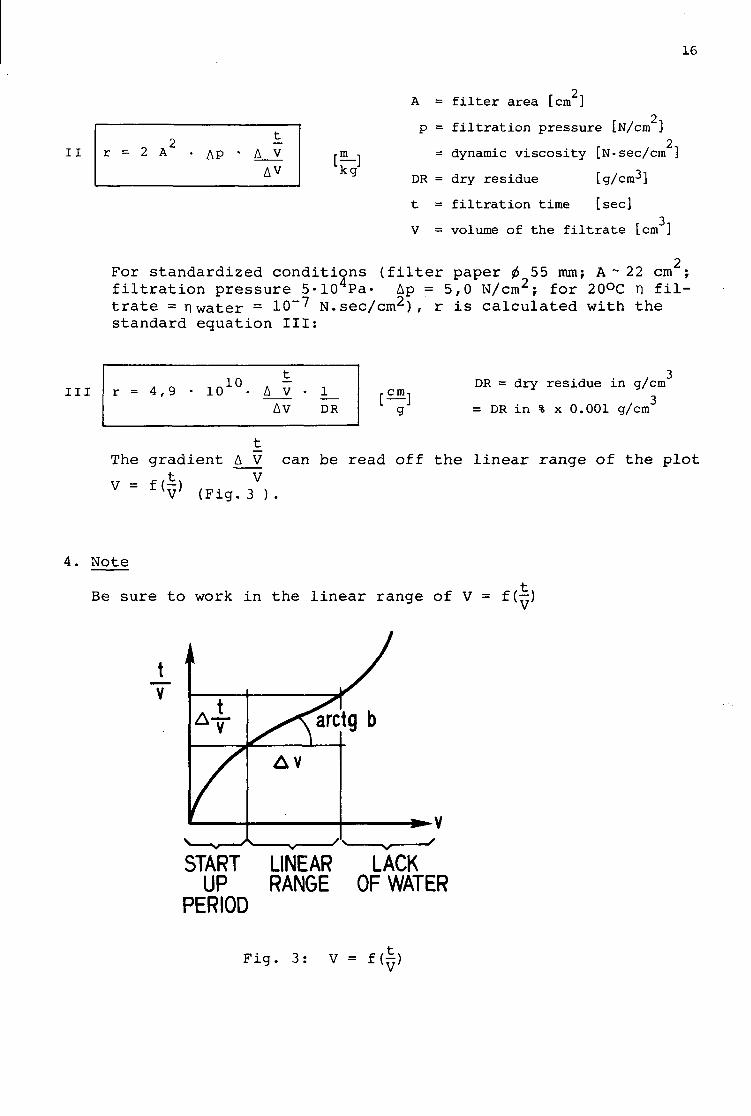
A = f i l t e r a rea [cm ]
I I r = 2 A AP t_
A V AV k g
p = f i l t r a t i o n p r e s s u r e [N/cm ] r J 2 n
= dynamic v i s c o s i t y I.N-sec/cm J
DR = dry r e s idue [g/cm-*]
t = f i l t r a t i o n time [sec] 3
V = volume of the f i l t r a t e [cm ]
For s t anda rd ized c o n d i t i o n s ( f i l t e r paper <t> 55 mm; A ~ 22 cm ; f i l t r a t i o n p r e s s u r e 5-104Pa- Ap = 5,0 N/cm2; for 20°C n f i l t r a t e = n water = 10~7 N . s e c / c m 2 ) , r i s c a l c u l a t e d with t h e s tandard equat ion I I I :
i n r = 4 , 9 i o 1 0 . t
A V • AV
1 DR g
DR = dry residue in g/cm , 3 = DR in % x 0.001 g/cm
The gradient A V can be read off the linear range of the plot
V = f A V
V (Fig. 3 ).
4. Note
Be sure to work in the linear range of V = f(—)
V
START LINEAR LACK UP RANGE OF WATER
PERIOD
F i g . 3 : V = f ( ^ )
17
Fig. 2 APPARATUS FOR THE MEASUREMENT OF THE RESISTANCE TO FILTRATION
BUCHNER FUNNEL <t> 5,5 cm
FILTER-CAKE
GRADUATED CYLINDER
I 2,5 cm
VACUUM PUMP
18
2. Refuse and Compost
2.1. The Preparation and Storage of Refuse and Compost Samples
1) Crude Sample
Samples which are taken from a waste silo, a compost windrow, a sanitary landfill etc. are heterogeneous mixtures of organic and inorganic substances. They are called c r u d e s a m p l e and are not suited for analysis without pre-treatment.
2) Laboratory Sample
The crude sample contains large pieces of metal which have to be sorted out. The sorted crude sample, which is well suited for further processing in a knife mill, is called the l a b o r a t o r y s a m p l e (labsample).
3) Analytical Sample
The laboratory sample is dried in order to measure the water content. The dry material is finely grinded with appropriate mills and grinders (hammer-, knife-, and ballmills), until it can be sieved through a 0.2 mm test screen (DIN 4188).
From the screenings, the large inorganic parts are removed and the remainder is grinded and sieved again. The sittings of the two grinding-courses are combined, mixed, and weighed. This material <0.2 mm is called the a n a l y t i c a l s a m p l e . The rest (>0.2 mm) is called the r e j e c t s and is weighed separately.
For all calculations, the rejects have to be taken into account, too.
4) Storage
The wet samples (crude sample, laboratory sample) must be stored at low temperature (<4°C). The dried samples (analytical sample) may be stored at room temperature. The analytical samples which are hygroscopic must be stored in dry, air-tight containers.
19
2.2. Water Content and Dry Residue
1) Definition
W a t e r c o n t e n t (WC) i s t h e t e rm a p p l i e d t o t h e o total loss of weight when a sample is dried at 105 C.
The d r y r e s i d u e (DR) is defined as the remaining material when a sample has been dried at 105°C. WC and DR are expressed as percentage, and they add up to a total of 100 percent.
2) Principle
By heating a two-phase-mixture, liquids and solids can be separated because of their difference in vaporpressure.
3) Procedure
Place about 1000 grams of the labsample on a weighed tin plate, and record the weight of the sample (+ 1 g ) . Put the plate into a ventilated drying oven, and dry the sample until the weight remains constant. Then, turn off the drying oven but leave the plate in the oven until both plate and sample are at room temperature. Reweigh the sample immediately after drying.
Initial Sample Weight - Final Sample Weight WC in % = : • 100
Initial Sample Weight ,+0 ,
DR in % = 100 - WC (±0.1)
4) Notes
4.1. If microbiological investigations are intended, the sample must be dried at 4 0 -50°C. In this case the temperature of drying should be reported together with the result.
4.2. It is difficult to separate substances with a similar vapor pressure. The measured water content therefore includes substances like nitrogen compounds, organic solvents, certain metals, etc. Such substances can cause an inaccuracy which is usually less than one percent.
20
2.3. Volatile Substance and Non Volatile Substance
1) Definition
The v o l a t i l e s u b s t a n c e (VS) is defined as the fraction of a refuse- or compostsample, which becomes volatile when heated to 550°C. The VS is often called the total organic matter.
N o n v o l a t i l e s u b s t a n c e (NVS) is the term applied to the part of the sample which does not become volatile when heated to 550°C.
VS and NVS are expressed as percentage: VS + NVS = 100 %.
2) Principle
When a mixture of substances is ignited, the organic substances usually produce volatile oxidation products, while the inorganic substances yield in solid oxidation products.
3) Procedure
Weigh about 4 grams (± 1 mg) of the analytical sample into a glowed porcelain crucible of known weight. Ash the sample over a small flame first, and then, put it into a muffle oven for 2 hours at 550° ± 5°C. Allow the residue to cool down in an exsiccator and reweigh it.
VS in % = initial weight - final weight . ±QQ Q
initial weight
NVS in %= 100 - VS (± 0.1)
4) Notes
4.1. At 550 C, not only the oxidation products but some of the formed inorganic decomposition products become volatile, (metal carbonate -»• CO„, cristall water ->- H20) . This is why the VS does not correspond exactly to the total organic matter; the error is generally <1 %. 4.2. For the calculation of the results, the rejects have to be taken into accounts
21
2.4. Empirical Carbon Content
1) Definition
The c a r b o n c o n t e n t is defined as the fraction of carbon in a sample, expressed as weight percentage.
2) Principle
Usually, the ratio between carbon content and volatile substance (VS) of a refuse or compost of a given area remains constant for some time.
3) Procedure
Determine the volatile substance by method 2.3. The empirical carbon content can be calculated by using the volatile substance and equation I.
C in % = a • VS in % a _ =0.42 refuse
a . = 0.52 compost depend on the composition of a refuse or
compost. The values given above are valid for urban areas in Switzerlandj they can not be applied to other areas without further investigations. In order to determine the specific values of 'a1, the carbon content is measured as described in 2.5., and the ratio C% is calculated. The values should be checked and revised VS% periodically. The result is reported to the accuracy of 1 %.
22
2 . 5 . Carbon
1) Definition
The c a r b o n c o n t e n t i s def ined as the f r a c t i on of carbon in a sample expressed as weight p e r c e n t a g e .
2) Principle
The carbon is combusted in an oxygen stream, and the formed carbon dioxide is measured gravimetrically as sodiumcarbo-nate.
3) Procedure
Carbon and hydrogen (see 2.6.) are measured by using an apparatus shown in figure 4. This apparatus consists essentially of three parts: the cleaning of the gases, the py-rolysis/oxidation, and the gas absorption.
Place about 40 mg of the sample to the accuracy of 0.1 mg in a glowed porcelain crucible, and put it into the degasing tube K. Open the valve H and let nitrogen gas flow through at a rate of 25 ml/min, open valve C to let oxygen gas flow through the oxidation tube X at a rate of 250 ml/ min. With a Bunsen-burner warm up the oxidation tube X and the liquid paraffin S which encloses the granular lead-(IV)-oxide (PbO„ p.a.). Heat the degasing tube K carefully over a Bunsen- burner until the sample in the porcelain crucible L volatilizes. When the pyrolysis gases pass through the capillary tube N, they are oxidized to carbon dioxide, water and other combustion products. The combustion gases pass through a layer of lead-(IV)-oxide S at 200 C, where the sulfur-oxides, nitrogen-oxides and halo-genes are absorbed. The cleaned gases flow through the containers U and V.
The container U is filled with magnesium perchlorate (Mg(Cl04)„ p.a.), which absorbs the water, and the bottle V contains sodium asbestos (fine p.a.), which absorbs carbon dioxide. When the sample is completely degased, let oxygen flow directly into the degasing chamber by opening valves C and H for oxygen and closing them for nitrogen. The sample is glowed in the oxygen stream for a few minutes until all organic material is oxidized. Then, remove the absorption bottles U and V, seal and reweigh them.
(Vfa - V ). • 27.29 carbon content in % =
V = Weight of the absorption container for carbon before combustion [g]
V, = Weight of the absorption container for carbon after combustion [g]
E = Weight of the sample [g]
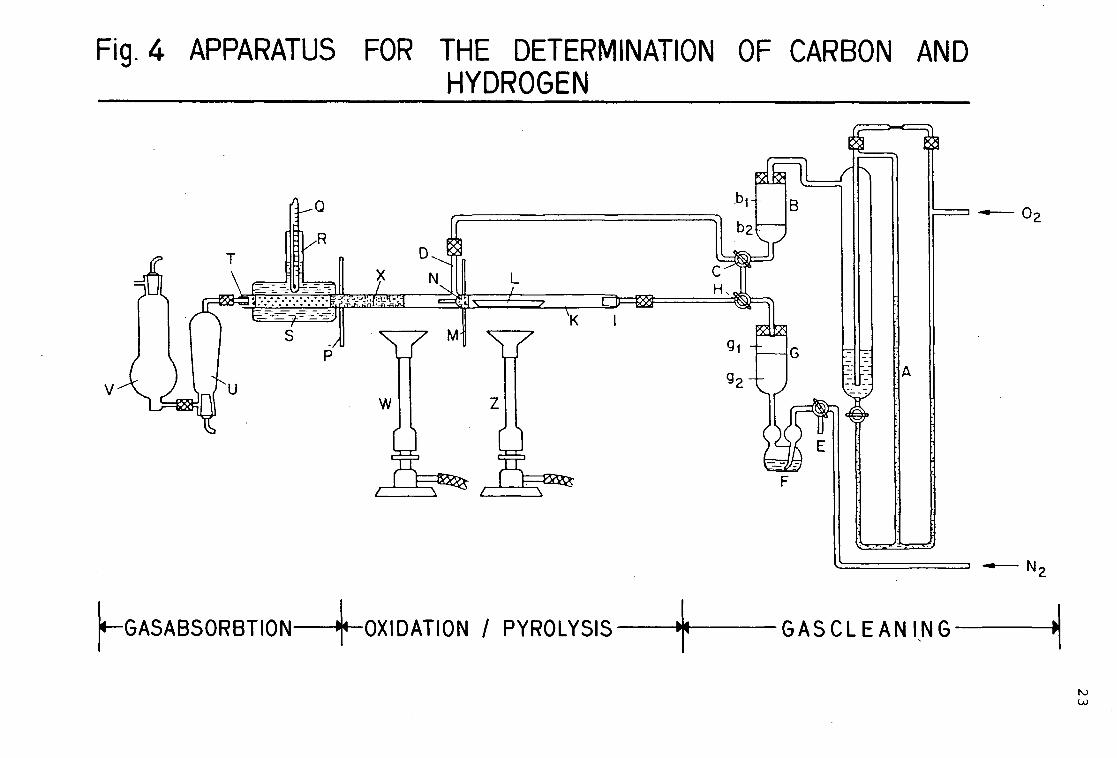
Fig. 4 APPARATUS FOR THE DETERMINATION OF CARBON AND HYDROGEN
A
/
Q
R D.
* N
SOIafa jj = w^^m s •A
P V M
W
Q \ ^ c
l F = g a x *
h GASABSORBTION- OXIDATION / PYR0LY5IS GASCLEANING
24
4) Notes
4.1. Use a sample size which allows about 3 0 mg carbon dioxide to be absorbed.
4.2. Lead-(IV)-oxide and magnesium perchlorate must be changed with the same intervals.
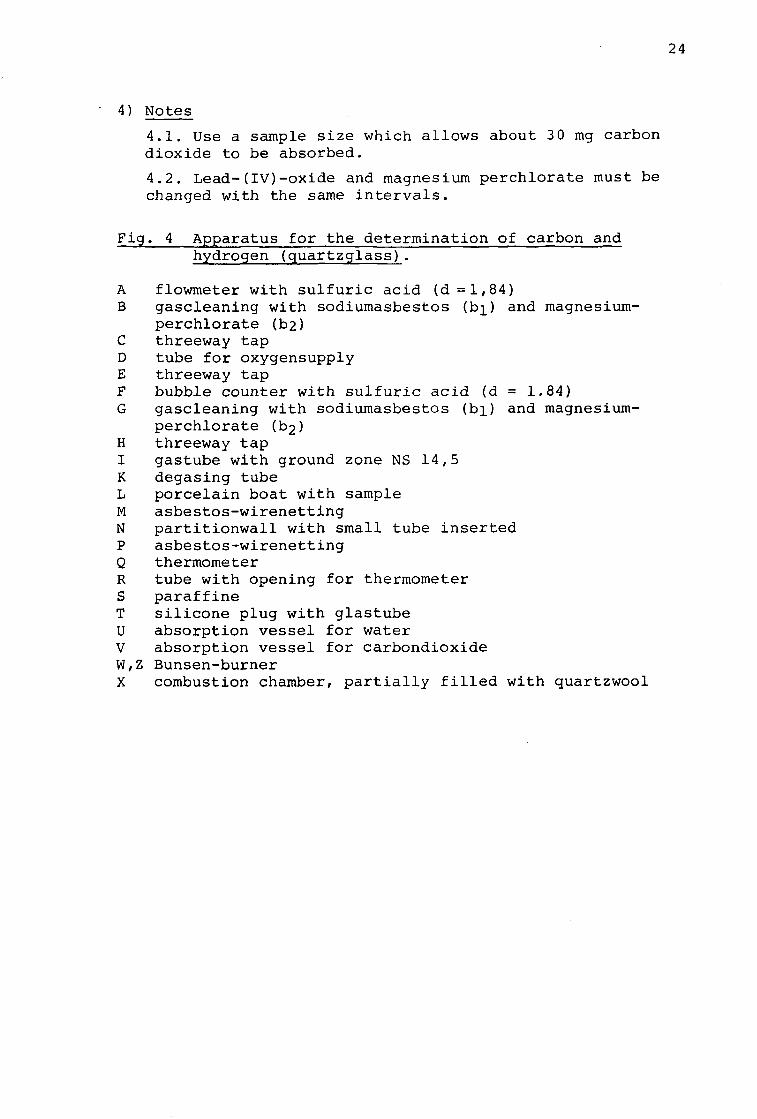
Fig. 4 Apparatus for the determination of carbon and hydrogen (quartzglass).
A flowmeter with sulfuric acid (d=l,84) B gascleaning with sodiumasbestos (b^) and magnesium-
perchlorate (b2) C threeway tap D tube for oxygensupply E threeway tap F bubble counter with sulfuric acid (d = 1.84) G gascleaning with sodiumasbestos (b]_) and magnesium-
perchlorate (b2) H threeway tap I gastube with ground zone NS 14,5 K degasing tube L porcelain boat with sample M asbestos-wirenetting N partitionwall with small tube inserted P asbestos-wirenetting Q thermometer R tube with opening for thermometer S paraffine T silicone plug with glastube U absorption vessel for water V absorption vessel for carbondioxide W,Z Bunsen-burner X combustion chamber, partially filled with quartzwool
25
2.6. Hydrogen
1) Definition
The h y d r o g e n c o n t e n t i s def ined as the f r a c t i o n of hydrogen in a sample expressed in %.
2) Principle
The hydrogen-containing substance is burned in an oxygen stream; the resulting water is absorbed with magnesium perchlorate and measured gravimetrically.
3) Procedure
The hydrogen content is determined the same way as the carbon content (see 2.5.). From the weight increase of the absorption container with magnesium perchlorate (MgCClO.)- p.a.) the hydrogen content can be calculated as follows:
(Ub - Ua) • 11.19 hydrogen content in % =
E
U = Weight of absorption container for hydrogen before combustion [g]
U, = Weight of absorption container for hydrogen after combustion [g]
E = Weight of the sample [g]
4) Notes
4.1. Use a sample size which allows about 20 mg of water to be absorbed.
4.2. Even when dried at 105°C, the analytical sample still contains some water. This water causes a usually small error in the determination of the hydrogen content.
26
2 . 7 . Kje ldahl -Ni t rogen
1) Definition
The K j e l d a h l - n i t r o g e n is defined as the nitrogen present in ammonia plus the portion of nitrogen which can be catalytically reduced to ammonia in a concentrated sulfuric acid solution. Kjeldahl-nitrogen generally includes most nitrogen containing compounds like ammonia and organic nitrogen. Nitrates and nitrites are sometimes not completely comprised.
2) Principle
In a concentrated sulfuric acid solution, the nitrogen of organic compounds can be catalytically reduced. The resulting ammonia is determined by titration.
3) Procedure
Place about 500 mg of the analytical sample to the accuracy of 1 mg into a digestion flask. Add 10 ml cone, sulfuric acid (H_SO., p.a., d = 1.84) and about 1 g catalyst (1 part selen p.a., 2 parts CuSO. • 5 H?0 p.a., and 7 4 parts K„SO. p.a.) or Kjeldahl-tablets according to Wieniger, Merck Nr. 10958. The sample is heated to 300°C for 3-6 hours. Allow the digested sample to cool, add 30-50 ml of distilled water and transfer it to a Kjeldahl distillation apparatus. Add sodium hydroxyde (NaOH p.a. 32 %) until the solution becomes very alkaline. By distillation, the produced ammonia is transferred into a receiver which contains 20 ml 0.05 N sulfuric acid (dilute 1.41 ml cone. H-SO. p.a. with distilled water to 1000 ml). The excess sulfuric acid is titrated with 0.05 N sodium hydroxyde (dilute 2.0 g NaOH p.a. with distilled water to 1000 ml) using the Kolthof indicator (200 mg methylred and 125 mg methylenblue dissolved in 100 ml ethanol p.a. 96 % ) . 1 ml 0.05 N sulfuric acid is equivalent to 0.70035 mg nitrogen.
M • a « 4.u * •* (S-L) • 70.035 ,. n ._. N in % of the dry residue = - •— (+ 0.05)
N = nitrogen content [%] E = weight of the sample [mg] S = amount of 0.05 N sulfuric acid in the receiver [ml] L = amount of 0.05 N sodium hydroxyde used for titration
[ml]
4) Notes
4.1. The nitrogen of some organic compounds cannot be detected by Kjeldahl's method (e.g. amines, azocompounds, etc.).
4.2. By adding a few drops of hydrogen peroxide (H202 p.a. 30 %) in the final stage of the digestion, the dissolution of hardly digestable substances can be improved. Caution: Make sure that the sample is cold when the peroxide is added!
27
2.8. Ratio of Carbon to Nitrogen
1) Definition
The C / N r a t i o is the ratio between the calculated or measured carbon and the Kjeldahl-nitrogen.
2) Principle
A certain C/N ratio is necessary to obtain biological degradation of organic matter. Usually, refuse has a C/N ratio of 30-40 while compost has a ratio of 15-20.
The C/N ratio gives some information if a refuse is suited for composting, and indicates the age and maturity of a compost. Also, it is an important criteria for the application of compost in agriculture.
3) Procedure
Determine carbon content and Kjeldahl-nitrogen with method 2.4/5 and 2.7. Calculate the C/N ratio, and round off to the closest integer.
C/N = f § (±1)
28
2.9. Calcium, Sodium and Potassium
1) Definition
The content of c a l c i u m , s o d i u m a n d p o t a s s i u m is defined as the proportion of the corresponding metal in the sample expressed as weight percentage.
2) Principle
The metals are dissolved in a strong oxidizing reagent. The metal concentration is determined by atomic absorption spectroscopy:
The free metalatoms can absorb specific wave lengths of a continuous spectrum. The amount of light absorbed depends on the concentration of the metal. The free metalatoms are usually produced by vaporizing a solution.
3) Procedure
The method of digestion, the AA spectroscopy and the calculations can be applied to the determination of heavy metals, too. It is appropriate to use the same sample for the determination of all metals.
3.1. Digestion
Place about 1 g of the analytical sample to the accuracy of 1 mg into an Erlenmayer flask, and add 5 ml of digestion reagent (2 parts cone. HNO-. p.a. and 1 part cone. HC10. p.a.). Heat it over a laboratory sand-heat until brown nitrogen peroxide and white perchloric acid evaporates. Before the residue is evaporated to dryness, repeat the procedure until only a white precipitant remains in the flask. Then filter through an ash free filter into a 100 ml volumetric flask and dilute the filtrate with 0.1 N nitric acid (p.a.) to 100 ml.
3.2. Atomic Absorgtion_Sp_ectroscop_Y_
The concentration of calcium, sodium and potassium termined from the 0.1 N nitric acid solution by AA troscopy according to the common methods described manuals.
3.3. Calculations
The concentration of the metal X in ppm = 100 ••?-
a = concentration of X in the solution of the digested sample [mg/1]
is de-spec-in AAS-
b = weight of the sample [g]
29
4) Notes
4.1. If the concentration of Ca, Na or K is very high, the nitric acid solution of the digested sample must be further diluted for atomic absorption spectroscopy.
4.2. Calcium can form compounds of low solubility (e.g. phosphate), which can not be measured by atomic absorption. However, if the described digestion is used, this error will be small.
30
2 . 1 0 . Heavy M e t a l s
1) Definition
H e a v y m e t a l s is the term applied to those metallic elements which have a density > 6 g/cm . In the context of refuse and compost, the most important heavy metals are: iron, cobalt, nickel, copper, zink, lead, cadmium, chrome and manganese. The concentration of heavy metals is reported in ppm, or as percentage if the concentration is very high (iron).
2) Principle
The metals are dissolved in a strong oxidizing reagent. Their concentration is determined by atomic absorption spectroscopy.
3) Procedure
The method of digestion, the AA spectroscopy and the calculations are the same as in 2.9. It is appropriate to use the same sample for the determination of all metals.
3.1. Digestion
Place about 1 g of the analytical sample to the accuracy of 1 mg into an Erlenmayer flask, and add 5 ml of digestion reagent (2 parts of cone. HNO~ p.a. and 1 part of cone. HC10. p.a.). Heat it over a laboratory sand-heat until brown nitrogen peroxide and white perchloric acid evaporates. Before the residue is evaporated to dryness, repeat the procedure until a white residue only remains in the flask. Then filter through an ash free filter into a 100 ml volumetric flask, and dilute the filtrate with 0.1 N nitric acid to 100 ml.
3.2. Atomic_AbsorDtion
The concentration of calcium, sodium and potassium is determined from the 0.1 N nitric acid solution by AA spectroscopy according to the common methods described in AAS-manuals.
3.3. Calculations
The concentration of the metal X in ppm = 100 «7-
a = concentration of X in the solution of the digested sample [mg/1]
b = weight of the sample [g]
31
4) Notes
4.1. Mercury can not be determined with this method.
4.2. This digestion method is not suited for samples to be analyzed by atomic absorption using a graphite tube.
4.3. If dealing with very low concentrations, the digested sample has to be diluted with less than 100 ml 0.1 N nitric acid.
32
2.11. Phosphorus
1) Definition
The p h o s p h o r u s content is defined as the total amount of phosphorus in a sample expressed as weight percentage .
2) Principle
The sample is digested by a strong oxidant and the dissolved phosphorus is measured photometrically as vanado-phospho-ammoniummolybdate (PO. (NH.) VdO_ NH.-16 MoO-.) .
3) Procedure
3.1. Di2estion__(cgi_2i9 . _and 2^1(K]_
Place about 100-250 mg of the analytical sample to the accuracy of 1 mg into an Erlenmayer flask, and add 5 ml of digestion reagent (2 parts of cone. HNO- p.a. and 1 part of cone. HC10. p.a.). Heat it over a laboratory sand-bath until brown nitrogen peroxide and white perchloric acid evaporates. Before complet dryness repeat the procedure until only a white residue remains in the flask.
3.2. Colorimetric_Measurement
Add 40 ml of vanadiummolybdenum -solution to the cold, digested sample, stir the yellow solution for about 1 hour and filter through a G3 glassfilter into a volumetric flask. Rinse the filter with vanadiummolybdenum-solution until the flask contains exactly 50 ml. Measure the extinction of the clear solution in a 1 cm cell with a spectrophotometer at a wavelength of 4 70 nm. The phosphorus concentration can be determined by using a calibration curve with potassiumdihydrogen-phosphate (KH_P0. p.a.). 1000 mg KH_PO. correspond to 227.6 mg phosphorus. The result is reported in percent phosphorus of the sample.
P in % = -r— b
a = cone, of phosphorus in the vanadiummolybdenum-solution [mg/1]
b = sample weight fmg]
1) The three solutions a, b and c are added in the following order, and the mixture is diluted with distilled water to 1000 ml.
a) 67 ml cone. HNO p.a. plus 33 ml distilled water. b) Ammoniumvanadate 0.25 %: Dissolve 0.25 g NH^VO^ p.a. in hot
distilled water plus 2 ml cone. HNO^ p.a., dilute to 100 ml. c) Ammoniummolybdate 5 %: Dissolve 5 g (HN ) Mo O . 4H 0 p.a.
in hot distilled water and dilute to 100 ml.
) Notes
4.1. Between 400-490 nm, the sensitivity of the colori-metric measurement increases with decreasing wavelength. Around 4 00 nm, the absorption is troubled significantly by iron-Ill.
4.2. Silicates produce the same color as phosphates. The ratio P2°q
t o s i oo should not be less than 1:44.
4.3. The concentration of nitric acid in the solution to be measured should range from 0.2 N and 1.6 N.
34
2 .12 . S a l t Content
1) Definition
The s a l t c o n t e n t is defined as the amount of salt which is calculated from the conductivity of a sample extract, assuming that the salt is present as potassium chloride. The salt content is reported in ppm.
2) Principle
The conductivity of a solution is a measure for the total concentration of organic and inorganic ionized substances. If the conductivity is known, the salt content can be calculated by using equation:
S = constant • x
S = salt content [mg/1]
X = conductivity [ys • cm ]
3) Procedure
Place about 20 g of the analytical sample to the accuracy of 0.1 g in an Erlenmayer flask. Add 100 ml of distilled water, shake for 1 hour at room temperature, and filter through an ash-free filter. Measure the conductivity x of the filtrate with an electrode at 20 C, and compare the result with the conductivity of a 0.01 N KC1 solution (745 mg KC1 p.a. in 1000 ml distilled water). Assuming that the calibration curve is linear, the salt content can be calculated:
a • x • 1000 As salt content in ppm =
P ' *k
mg KC1 per £ standard solution
weight of the sample [g]
conductivity of the extract
conductivity of the standard solution
a =
p =
*s =
35
2.13. Chloride
1) Definition
The c h l o r i d e content is defined as the total concentration of chlorides in a sample expressed as weight percentage.
2) Method
The sample is digested with sodium peroxide according to Wurz-Schmitt. The chloride is then measured as silver chloride by the method of Volhard.
3) Procedure
Pipette about 250 mg ethyleneglycol (C2H O p, digestion bomb which contains a small amount of
,a.) into a
sodium peroxide (Na202 p.a. ). Add about 200 mg (± 1 mg) of the analytical sample to the ethyleneglycol, and fill the bomb with sodiumperoxide. Close the bomb tightly and put it into a protected oven; heat it up with a micro burner until the content reacts and let the bomb cool down. Transfer the content into a beaker and rinse with distilled water without losing any material. Acidify the alkaline solution with cone, nitric acid (p.a.), and add 20 ml of 0.01 N silver nitrate1) solution while stirring the sample intensively.
Filter the solution through a blue-band filter and rinse three times with 20 ml of 3 % nitric acid. Add 4 ml of a saturated solution of ammoniumiron-(III)-sulfate((NH.) S04- Fe 2 (SOJ p.a. in dist. water) and titrate with a 0.01 N potassium thiocyanate solution (0.97184 g KCNS p.a. in 1000 ml dist. water) until the sample turns reddish. The content of chloride can be calculated by the required amount of potassiumthiocvanate and using the formula:
(b -a ) N 3,545 CI i n % = (± 0 .01 %)
a
b
N
E
1)
= amount of 0 . 0 1 N p o t a s s i u m t h i o c y a n a t e r e q u i r e d [ml]
= amount of 0 . 0 1 N p o t a s s i u m t h i o c y a n a t e r e q u i r e d f o r c a l i b r a t i o n [ml]
= n o r m a l i t y of p o t a s s i u m t h i o c y a n a t e
= w e i g h t of t h e a n a l y t i c a l sample [g]
Dissolve 1,6988 g AgNO p . a . in 1000 ml d i s t . wa te r . C a l i b r a t e the s o l u t i o n s as fo l lows: Add 1 ml cone, n i t r i c ac id , 1 ml s a t u r a t e d ammoniumiron-( I I I ) - su l fa te and 50 ml d i s t . water to 20,0 ml s i l v e r -n i t r a t e s o l u t i o n and t i t r a t e with 0,01 N potass iumthiocyanate u n t i l the color changes to a s l i g h t r ed .
36
4) Notes
4.1. If the digested sample appears to be brownish, the digestion is not complete. Either repeat the procedure with a smaller amount of sample, or with a larger amount of ethyleneglycol.
4.2. With silver nitrate,iodide, bromide and cyanide can form compounds of low solubility. Since the concentration of these compounds is usually very low, the resulting error may be neglected.
4.3. With 20 ml 0,01 N silver nitrate, it is possible to measure a chloride content up to 2 percent. If the content is higher, the added volume of silver nitrate (or it's concentration) has to be increased correspondingly.
37
2 . 1 4 . pH-Value
1) Definition
The p H - v a l u e is defined as the negative logarithm of the concentration of hydrogen ions in a mixture of the analytical sample with water.
2) Principle
Between an aqueous solution and a glass surface exists a potential difference which depends on the pH of the solution. Therefore, the pH value can be determined by measuring this voltage with a glass electrode.
3) Procedure
Dilute 50 grams of the analytical sample with 125 ml CO ?-free water 2:5. Leave the sample in a covered container for 2 hours, and shake it occasionally. Measure the pH value with a glass electrode while stirring the sample.
The pH apparatus has to be calibrated and corrected for temperature prior to each measurement. The result is reported with an accuracy of 0.1 pH-unit.
38
2.15. Calorific Value (H ) and Heat of Combustion (H )
1) Definition
The c a l o r i f i c v a l u e H (lower calorific value) is the heat generated by the complete incineration of a substance under the following conditions:
- the temperature of the substance before combustion, and of the combustion products must be 2 0°C.
- the water at 20 C is present as steam.
- carbon and sulfur are completely oxidized to carbon dioxide and sulfur dioxide.
The h e a t o f c o m b u s t i o n H (upper calorific value) is the heat generated by the complete incineration of a substance under the same conditions as above except:
- the water at 20 C is present as a liquid.
When calculating H and H , the watercontent and the re-u o
jects of the crude sample have to be taken into consideration, too (c.p. 2.1.). The result has to indicate the calorific value of the crude sample and is given in kilo-joule/kg .
2) Principle
The substance is combusted in a caloric bomb. The generated heat increases the temperature of the water which surrounds the bomb. From the temperature change, the generated heat can be determined using a calibration curve. The caloric value and the heat of combustion can be calculated if the sample weight and the weight of the produced water of combustion are known.
3) Procedure
3.1. Pregaration_of_the_samp_le
Grind and screen the crude sample as described in "2.1. Conditioning and Storing of Refuse and Compost". Be sure that the organics are removed completely from the screenings and added to the sievings after they have been grinded several times.
3.2. Calorimetric_Measurement
Combust about 1 g (± 1 mg) of the analysis sample in a caloric bomb according to DIN 51.708. The generated amount of heat is calculated by a calibration measurement.
3.3. Calculation_of_the_Calorific_Value
By the calorific experiment according to DIN 51.708, the heat of combustion H Q of the dry analytical sample is obtained. In order to calculate the lower calorific
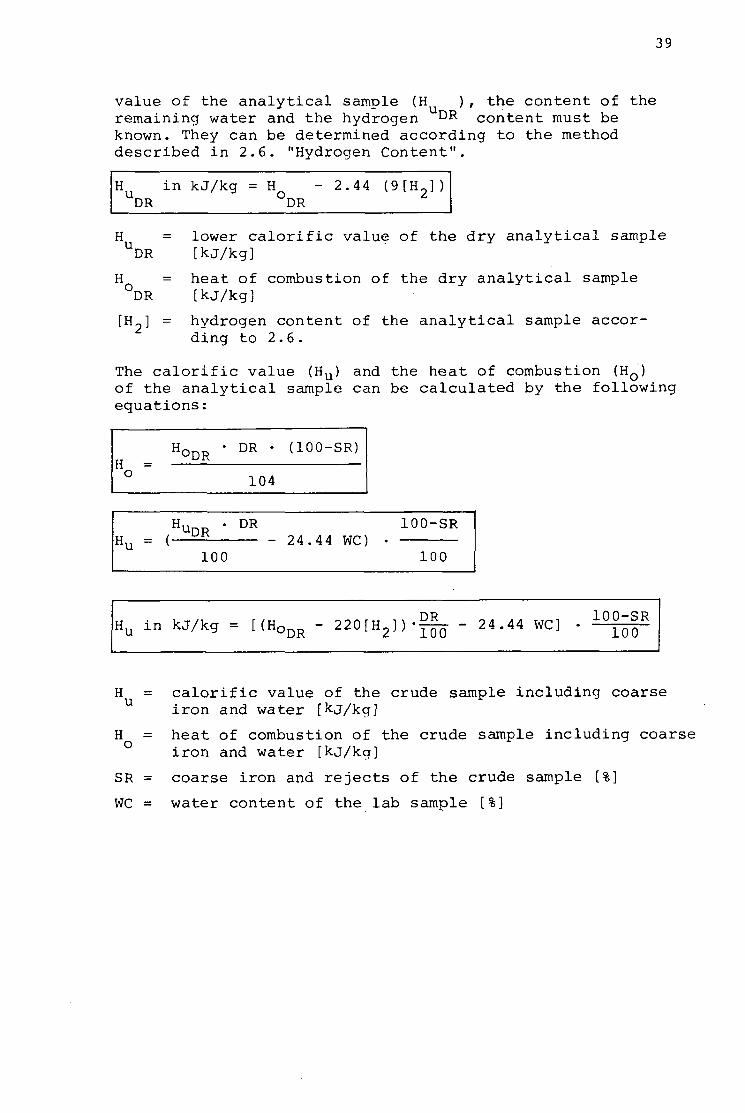
39
value of the analytical sample (H ), the content of the remaining water and the hydrogen DR content must be known. They can be determined according to the method described in 2.6. "Hydrogen Content".
H in kJ/kg = H - 2.44 9 HJ DR DR
H = lower calorific value of the dry analytical sample UDR [kj/kg]
H = heat of combustion of the dry analytical sample °DR [kj/kg]
[H„] = hydrogen content of the analytical sample according to 2.6.
The calorific value (Hu) and the heat of combustion (HQ) of the analytical sample can be calculated by the following equations:
H = o
H O D R • DR • (100-SR)
104
Hu = ( H U D R • D R
100 - 24.4 4 WC)
100-SR
100
Hu in kJ/kg = [(HODR - 2 2 0 ^ ] ) -^f^- - 24.44 WC] - 1 0 ° Q QR
H = u
H = o
SR =
WC =
calorific value of the crude sample including coarse iron and water [kj/kg]
heat of combustion of the crude sample including coarse iron and water [kj/kg]
coarse iron and rejects of the crude sample [%]
water content of the lab sample [%]
40
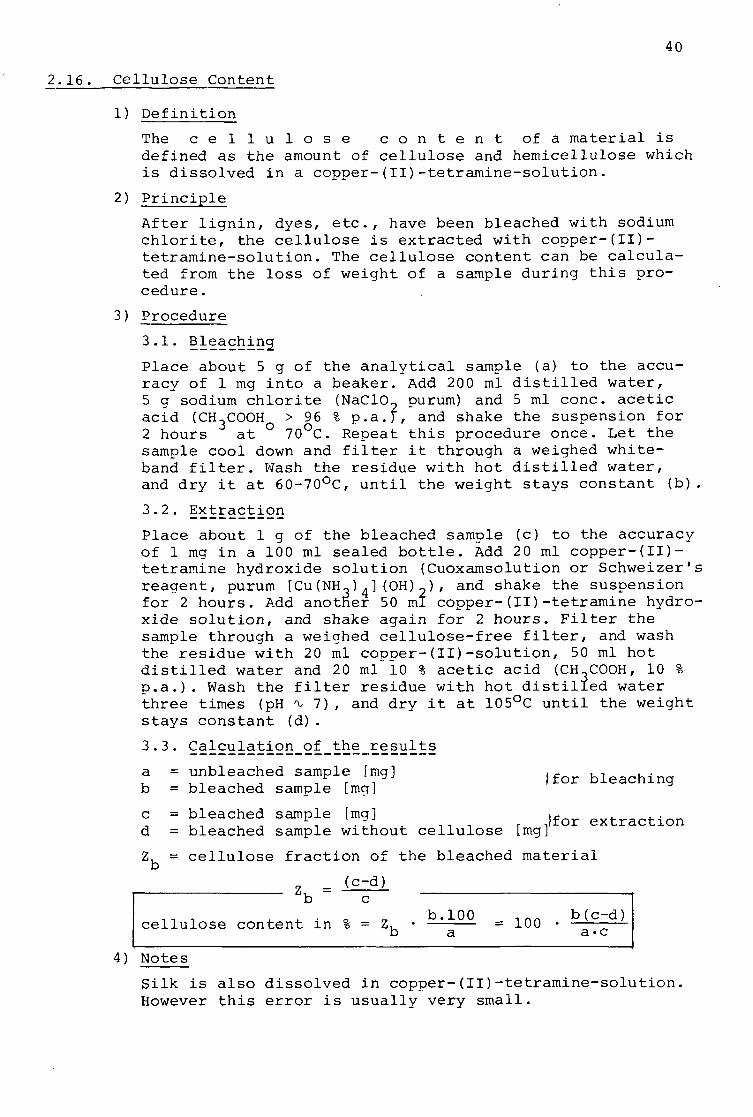
2.16 Cellulose Content
1) Definition
The c e l l u l o s e c o n t e n t of a material i s defined as the amount of ce l lu lose and hemicellulose which i s dissolved in a copper- ( I I ) - te t ramine-so lu t ion .
2) Principle
After lignin, dyes, etc., have been bleached with sodium chlorite, the cellulose is extracted with copper-(II)-tetramine-solution. The cellulose content can be calculated from the loss of weight of a sample during this procedure.
3) Procedure
3.1. Bleaching
Place about 5 g of th racy of 1 mg into a b 5 g sodium chlorite ( acid (CH3COOH > 96 % 2 hours at 70 C. sample cool down and band filter. Wash the and dry it at 60-70°C
3.2. Extraction
e analytical sample (a) to the accu-eaker. Add 200 ml distilled water, NaClO- purum) and 5 ml cone, acetic p.a.f, and shake the suspension for
Repeat this procedure once. Let the filter it through a weighed white-residue with hot distilled water, until the weight stays constant (b)
Place about 1 g of the bleached sample (c) to the accuracy of 1 mg in a 100 ml sealed bottle. Add 20 ml copper-(II)-tetramine hydroxide solution (Cuoxamsolution or Schweizer's reagent, purum [Cu(NH_).](OH)~), and shake the suspension for 2 hours. Add another 50 ml copper-(II)-tetramine hydroxide solution, and shake again for 2 hours. Filter the sample through a weighed cellulose-free filter, and wash the residue with 20 ml copper-(II)-solution, 50 ml hot distilled water and 20 ml lo % acetic acid (CH^COOH, 10 % p.a.). Wash the filter residue with hot distilled water three times (pH ^ 7) , and dry it at 105°C until the weight stays constant (d).
3.3. Calculation_of_the_results
a = unbleached sample fmg] b = bleached sample [mg]
c = bleached sample [mg] d = bleached sample without cellulose [mg]
}for bleaching
}for extraction
cellulose fraction of the bleached material
(c-d) Zb =
cellulose content in % b.100
= 100 b(c-d)
a-c
4) Notes
Silk is also dissolved in copper-(II)-tetramine-solution, However this error is usually very small.
41
2.17. Fermentability
1) Definition
The f e r m e n t a b i l i t y is defined as the property of a substance to undergo aerobic biological decomposition (composting).
2) Principle
To characterize the fermentability of a sample one compares several parameters (temperature, pH, VS etc.) of a standard material to the parameters of the sample. The fermentation tests are done either in perforated containers (baskets) or, on a larger scale, in small windrows. The latter is usefull if the compost is to be used for plant tests.
3) Procedure
3.1. Basket_Test
Mix about 30 kg of the roughly grinded labsample thoroughly and put it into a perforated plastic basket (content 50-60 1). The decomposition process can be followed by a thermometer or a thermocouple. Turn the material over every week, and if the water content drops below 30 % add water to about 50 %. A matured compost is generally obtained withr-in 4-5 weeks.
Test the material in several baskets and compare the results for temperature, volatile substance, pH, C/N ratio etc. with a known standard material of good fermentability.
3.2. Windrow_Test
About 1500 kg of the labsample are roughly grinded, well mixed and piled to a windrow of 1-1,5 m height. The fermentation process is followed by thermometers or thermocouples . In the beginning, the windrow has to be turned over every 2-3 weeks; later once a month is sufficient. After 4 to 6 months the fermentation process is usually completed. Follow the fermentation by testing for volatile substance, pH, C/N ratio, temperature etc., and compare with a standard compost.
4) Notes
If the temperature does not increase in the beginning of the test, or increases after a long period of time only, it is assumed that the refuse (physical structure, water content, etc.) or added substances inhibit the decomposition.
42
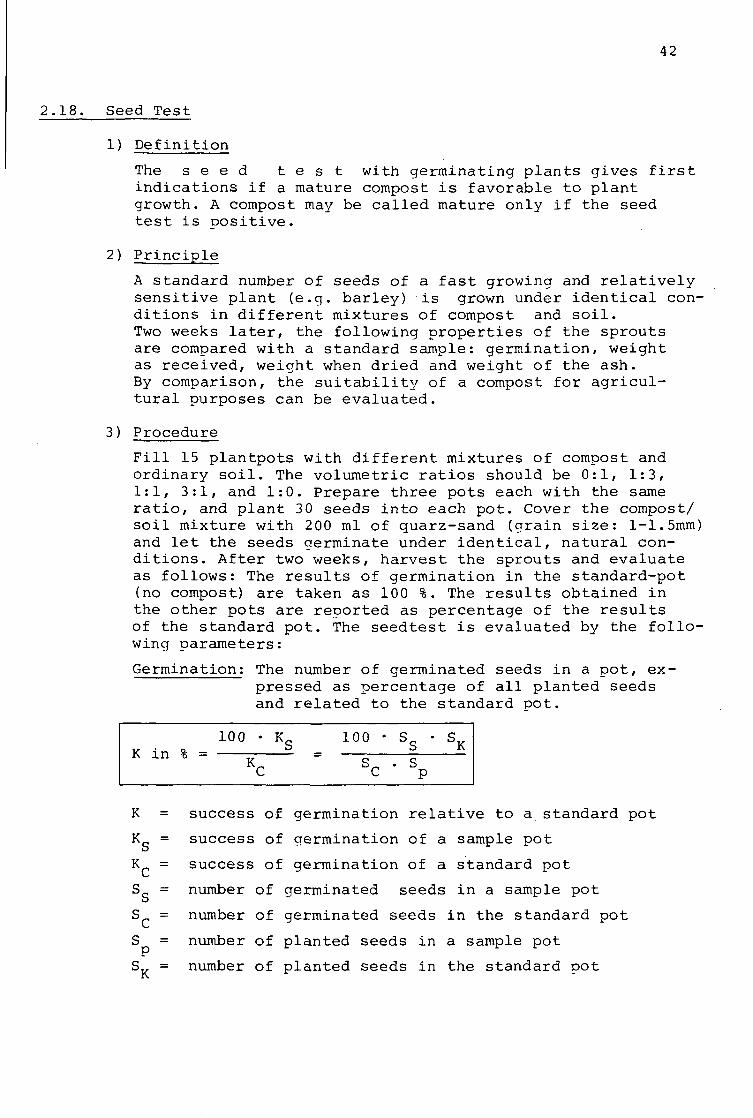
2.18. Seed Test
1) Definition
The s e e d t e s t with germinating plants gives first indications if a mature compost is favorable to plant growth. A compost may be called mature only if the seed test is positive.
2) Principle
A standard number of seeds of a fast growing and relatively sensitive plant (e.g. barley) is grown under identical conditions in different mixtures of compost and soil. Two weeks later, the following properties of the sprouts are compared with a standard sample: germination, weight as received, weight when dried and weight of the ash. By comparison, the suitability of a compost for agricultural purposes can be evaluated.
3) Procedure
Fill 15 plantpots with different mixtures of compost and ordinary soil. The volumetric ratios should be 0:1, 1:3, 1:1, 3:1, and 1:0. Prepare three pots each with the same ratio, and plant 3 0 seeds into each pot. Cover the compost/ soil mixture with 200 ml of quarz-sand (grain size: 1-1.5mm) and let the seeds germinate under identical, natural conditions. After two weeks, harvest the sprouts and evaluate as follows: The results of germination in the standard-pot (no compost) are taken as 100 %. The results obtained in the other pots are reported as percentage of the results of the standard pot. The seedtest is evaluated by the following parameters:
Germination: The number of germinated seeds in a pot, expressed as percentage of all planted seeds and related to the standard pot.
100 • Ke
-,, • s K i n % = K ,
C =
100 •
s^ c
s„ • s
. s p
s, K
K =
KS =
Kc =
ss =
sc = s = p
SK =
success of germination relative to a standard pot
success of germination of a sample pot
success of germination of a standard pot
number of germinated seeds in a sample pot
number of germinated seeds in the standard pot
number of planted seeds in a sample pot
number of planted seeds in the standard pot
43
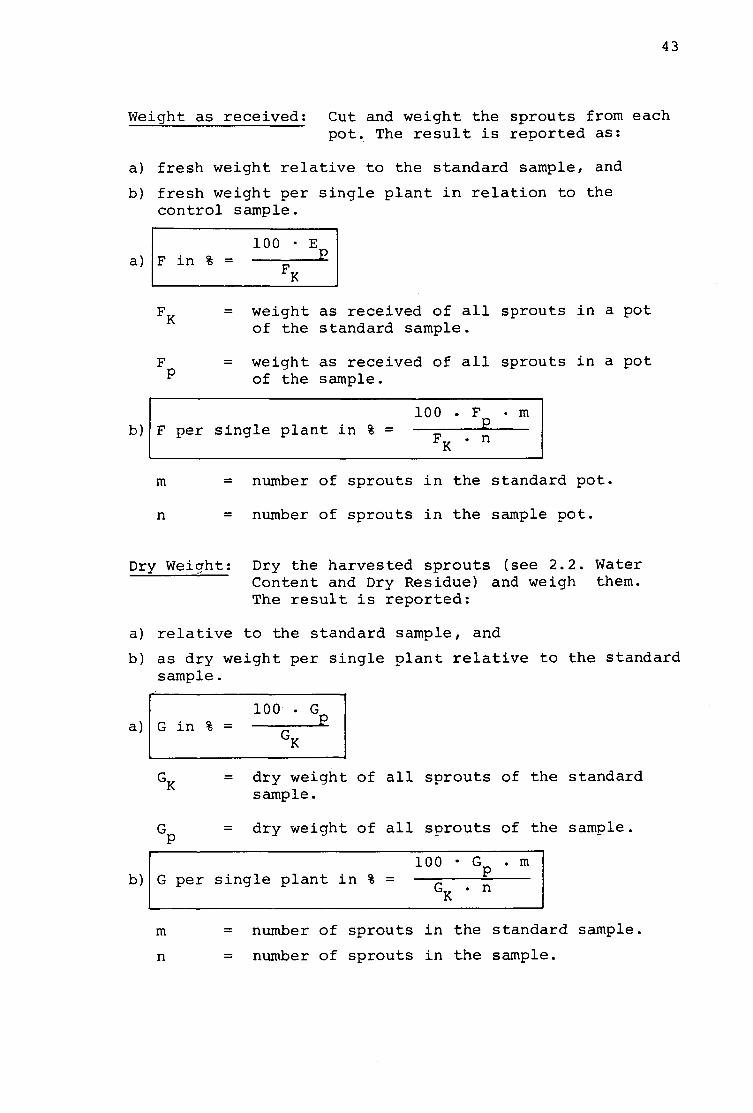
Weight as received; Cut and weight the sprouts from each pot. The result is reported as:
a) fresh weight relative to the standard sample, and
b) fresh weight per single plant in relation to the control sample.
a) 100
F in % = K
F = weight as received of all sprouts in a pot of the standard sample.
F = weight as received of all sprouts in a pot " of the sample.
b) F per single plant in % 100 . F • m
E FK . n
m = number of sprouts in the standard pot.
n = number of sprouts in the sample pot.
Dry Weight: Dry the harvested sprouts (see 2.2. Water Content and Dry Residue) and weigh them. The result is reported:
a) relative to the standard sample, and
b) as dry weight per single plant relative to the standard sample.
a) G i n % = 100 • G
P GK
G = dry weight of all sprouts of the standard sample.
G = dry weight of all sprouts of the sample.
b) 100 m
G per single plant in % = GR . n
m = number of sprouts in the standard sample,
n = number of sprouts in the sample.
44
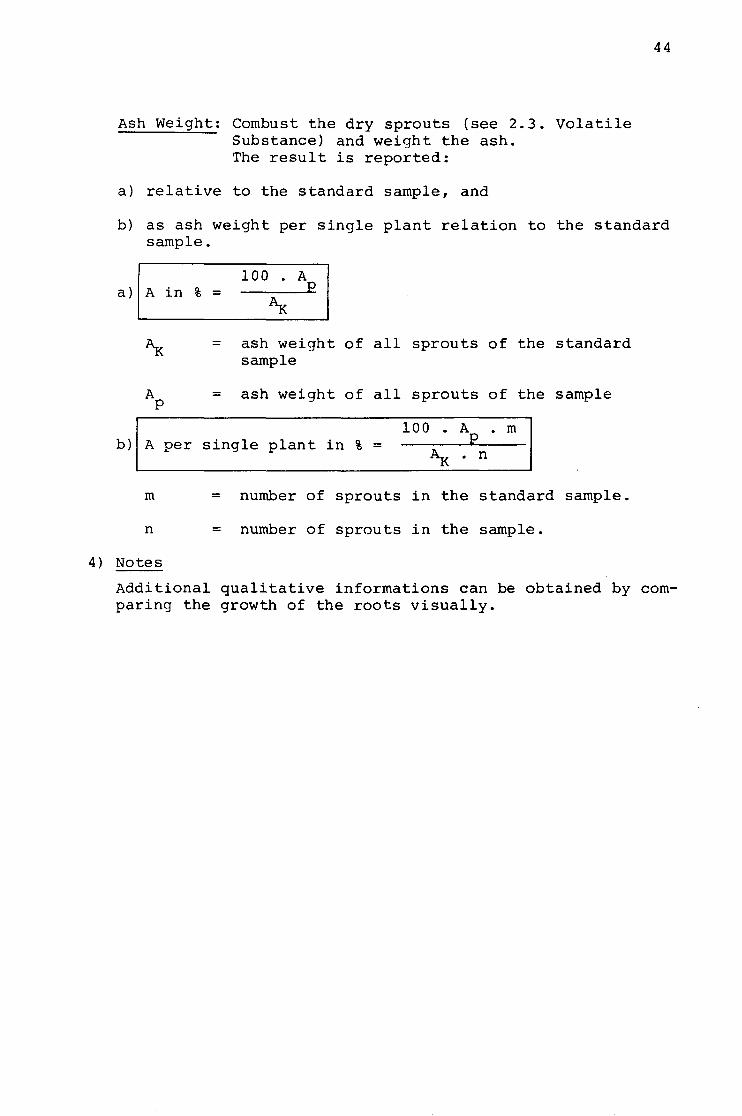
Ash Weight: Combust the dry sprouts (see 2.3. Volatile Substance) and weight the ash. The result is reported:
a) relative to the standard sample, and
b) as ash weight per single plant relation to the standard sample.
a) 100 . A
A in % = ^ *K
A^ = ash weight of all sprouts of the standard sample
A = ash weight of all sprouts of the sample
b) A per single plant in % = 100 . A . m
P
*K * n
m = number of sprouts in the standard sample
n = number of sprouts in the sample.
4) Notes
Additional qualitative informations can be obtained by comparing the growth of the roots visually.