methodological paper - methodological issues in the ... · methodological issues in the analysis of...
TRANSCRIPT
2010 edition
KS-RA-09-001-EN
-C
M e t h o d o l o g i e s a n d W o r k i n g p a p e r s
ISSN 1977-0375
Methodological issues in the analysis of the socioeconomic determinants of health using EU-SILC data

2010 edition
M e t h o d o l o g i e s a n d W o r k i n g p a p e r s
Methodological issues in the analysis of thesocioeconomic determinants of health using EU-SILC data

More information on the European Union is available on the Internet (http://europa.eu). Cataloguing data can be found at the end of this publication Luxembourg: Publications Office of the European Union, 2010 ISBN 978-92-79-16753-9ISSN 1977-0375 Doi:10.2785/55316 Cat. No. KS-RA-10-017-EN-N Theme: Population and social conditions Collection: Methodologies and working papers © European Union, 2010
Europe Direct is a service to help you find answers to your questions about the European Union
Freephone number (*):
00 800 6 7 8 9 10 11(*) Certain mobile telephone operators do not allow access
to 00 800 numbers or these calls may be billed.
1 Methodological issues in the analysis of the socioeconomic determinants of health using EU-SILC data
Eurostat is the Statistical Office of the European Union (EU). Its mission is to provide the EU with high-quality statistical information. To that end, it gathers and analyses data from the National Statistical Institutes (NSIs) across Europe and provides comparable and harmonised data for the EU to use in the definition, implementation and analysis of EU policies. Its statistical products and services are also of great value to Europe’s business community, professional organisations, academics, librarians, NGOs, the media and citizens. In the social field, the EU Statistics on Income and Living Conditions (EU-SILC) instrument is the main source for statistics on income, poverty, social exclusion and living conditions. Over the last years, important progress has been made in relation to EU-SILC. This is the result of the coordinated work of Eurostat and the NSIs, inter alia in the context of the EU ‘Living Conditions’ Working Group and various thematic Task-Forces. Despite these significant achievements, EU-SILC data are still insufficiently analysed and used. It is in this context that Eurostat launched in 2008 a call for applications with the following aims:
(1) develop methodology for advanced analysis of EU-SILC data; (2) discuss analytical and methodological papers at an international
conference; (3) produce a number of publications presenting methodological and
analytical results. The ‘Network for the Analysis of EU-SILC’ (Net-SILC), an ambitious 18-partner Network bringing together expertise from both data producers and data users, was set up as in response to this call. The initial Net-SILC findings were presented at the international conference on ‘Comparative EU Statistics on Income and Living Conditions’ (Warsaw, 25-26 March 2010), which was organised jointly by Eurostat and the Net-SILC network and hosted by the Central Statistical Office of Poland. A major deliverable from Net-SILC is a book to be published by the EU Publications Office at the end of 2010 and edited by Anthony B. Atkinson (Nuffield College and London School of Economics, United Kingdom) and Eric Marlier (CEPS/INSTEAD Research Institute, Luxembourg). The present methodological paper is also an outcome from Net-SILC. It has been prepared by Cristina Hernández-Quevedo, Cristina Masseria and Elias Mossialos (LSE Health, London School of Economics and Political Science, United Kingdom). Gara Rojas González was responsible at Eurostat for coordinating the publication of the methodological papers produced by Net-SILC members.
2 Methodological issues in the analysis of the socioeconomic
determinants of health using EU-SILC data
It should be stressed that this methodological paper does not in any way represent the views of Eurostat, the European Commission or the European Union. The authors have contributed in a strictly personal capacity and not as representatives of any Government or official body. Thus they have been free to express their own views and to take full responsibility both for the judgments made about past and current policy and for the recommendations for future policy. This document is part of Eurostat’s Methodologies and working papers collection which are technical publications for statistical experts working in a particular field. All publications are downloadable free of charge in PDF format from the Eurostat website (http://epp.eurostat.ec.europa.eu/portal/page/portal/income_social_inclusion_living_conditions/publications/Methodologies_and_working_papers ). Furthermore, Eurostat databases are freely available at this address, as are tables with the most frequently used and requested short- and long-term indicators.
3 Methodological issues in the analysis of the socioeconomic determinants of health using EU-SILC data
Table of contents
1. Introduction..................................................................................................... 6
2. Reporting bias ................................................................................................ 7
3. Measuring inequality: taking into account the longitudinal dimension .......... 10
4. Measuring inequality: the ‘adjusted’ CI......................................................... 14
5. Analysing unmet need for health care .......................................................... 17
6. Discussion.................................................................................................... 26
References....................................................................................................... 28
Appendix .......................................................................................................... 31

5 Methodological issues in the analysis of the socioeconomic determinants of health using EU-SILC data
Methodological issues in the analysis of the socioeconomic determinants of health
using EU-SILC data Cristina Hernández-Quevedo, Cristina Masseria and Elias Mossialos1 LSE Health, London School of Economics and Political Science Abstract : Health inequalities across socioeconomic groups are a health and public policy concern in all countries. There exist robust methodological tools from the epidemiological and economics disciplines to measure inequalities in health and there is a substantial amount of evidence on the level of inequalities in health across countries. However, there are numerous methodological issues that the study of health inequalities introduces. In this article we discuss the potential reporting bias and the alternative methods included in other health surveys to correct for this issue. Secondly, we distinguish between short-term and long-term concentration index (CI), exploiting the longitudinal data included in EU-SILC. Thirdly, we discuss the corrected CI suggested by Erreygers (2009) to overcome the limitations of the ‘old’ CI. Finally, we conclude with an analysis of unmet needs for medical and dental examination or treatment and their main reasons, using the data available in EU-SILC. Keywords: reporting bias, long-term inequality, mobility index, unmet need JL Code: I12, C23
1 The authors are based in LSE Health, London School of Economics and Political Science (UK). They would like to thank Tony Atkinson, Conchita d’Ambrosio and Eric Marlier for their comments and suggestions. Of course, these persons are not responsible in any way for the present contents. The European Commission bears also no responsibility for the analyses and conclusions, which are solely those of the authors. Address for correspondence: [email protected]
1 Introduction
6 Methodological issues in the analysis of the socioeconomic
determinants of health using EU-SILC data
1. Introduction Health inequalities across socioeconomic groups are a health and public policy concern in all countries, being considered a measure of performance of health care systems. As reported by the WHO in the World Health Report 2000, improving the health attainment of the population is a main goal in any health care system, together with improving responsiveness to population needs and fairness of financing. At the European level, socioeconomic inequalities in health and health care use are particularly important given not only the challenges posed by the European Union enlargement but also by population aging. Although there is an overall concern for health inequalities, there is also a substantial amount of evidence on the level of health inequalities across countries. Recent work has shown that significant inequalities favouring the better-off exist in EU member countries and that socioeconomic factors such as education, income and job status have a substantial effect on the health of individuals (Mackenbach, 2006; CSDH, 2008; Hernández-Quevedo et al, 2006, 2008, 2010). Robust epidemiological and economics methodological tools are available to measure inequalities in health, but, there are also numerous methodological issues that the study of health inequalities presents. In this note, we discuss several issues that arise from the analysis of the determinants of health in the European Union. Under Section 2, we discuss the potential reporting bias linked to the use of self-reported measures of health included in the EU-SILC, together with alternative methods included in other health surveys to correct for this issue. In Section 3, we distinguish between short-term and long-term concentration index (CI), exploiting the longitudinal data in order to capture potential mobility in the income distribution. This is especially important when income mobility is systematically related to changes in health status. In Section 4, we account for the limitations of the often-used CI, calculating a corrected CI as suggested by Erreygers (2009). Finally, we analyse in detail the unmet need variables included in the EU-SILC. Self-reported unmet need for health care and forgone care provide some insight into people’s perceived access problems; however, disaggregation of unmet need into the stated reasons is required to aid interpretation, in addition to further research investigating the long-term effects of unmet need and the association between the reported access problems and the actual use of health services.
2 Reporting bias
7 Methodological issues in the analysis of the socioeconomic determinants of health using EU-SILC data
2. Reporting bias In order to measure inequalities, we need accurate measures of socioeconomic status and health. Numerous surveys include this information, but the reliability on subjective measures of health status raises important methodological challenges that relate to the potential reporting bias that could appear.
Reporting bias has been a concern in the literature and can be defined as the differential reporting of health across individuals or groups of individuals with the same health status. The systematic use of different threshold levels by sub-groups of a population reflects the existence of reporting bias. Though there is strong evidence that self-assessed health (SAH) is not only a good predictor of mortality and of other objective measures of health, being a more comprehensive measure of health status than other measures, bias is possible whereby different population groups may systematically under- or over-report their health status relative to other groups.
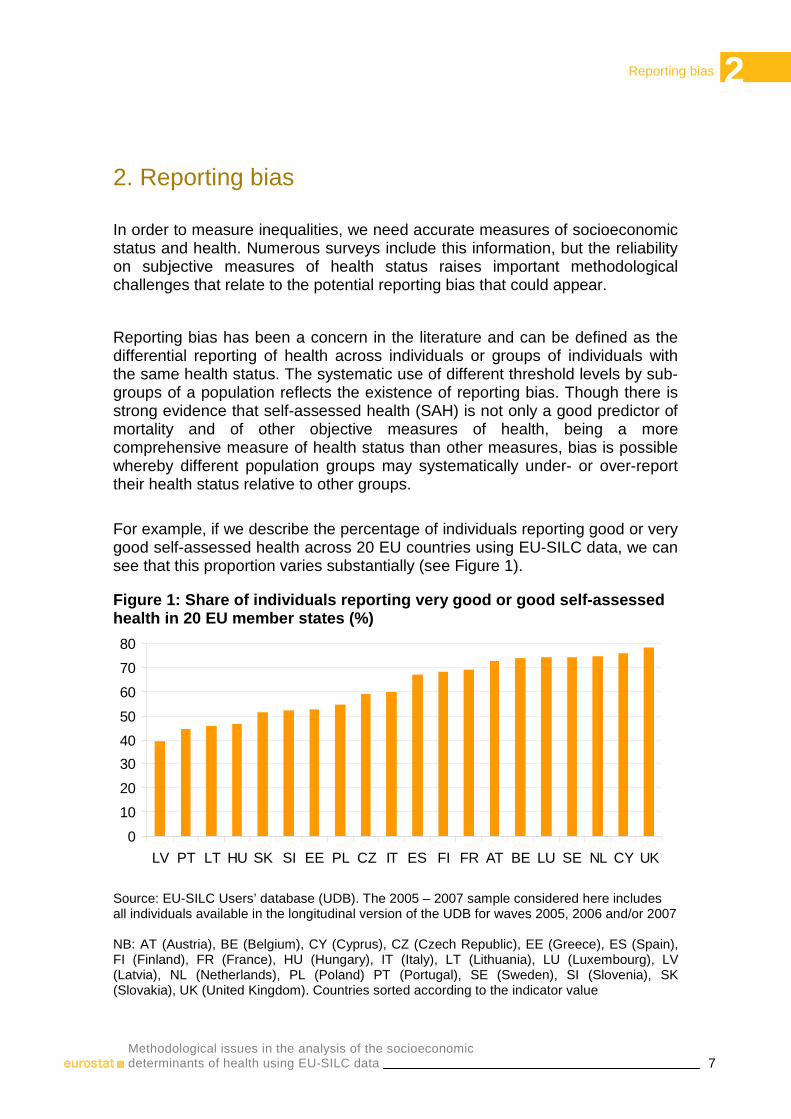
For example, if we describe the percentage of individuals reporting good or very good self-assessed health across 20 EU countries using EU-SILC data, we can see that this proportion varies substantially (see Figure 1).
Figure 1: Share of individuals reporting very good or good self-assessed health in 20 EU member states (%)
0
10
20
30
40
50
60
70
80
LV PT LT HU SK SI EE PL CZ IT ES FI FR AT BE LU SE NL CY UK
Source: EU-SILC Users’ database (UDB). The 2005 – 2007 sample considered here includes all individuals available in the longitudinal version of the UDB for waves 2005, 2006 and/or 2007 NB: AT (Austria), BE (Belgium), CY (Cyprus), CZ (Czech Republic), EE (Greece), ES (Spain), FI (Finland), FR (France), HU (Hungary), IT (Italy), LT (Lithuania), LU (Luxembourg), LV (Latvia), NL (Netherlands), PL (Poland) PT (Portugal), SE (Sweden), SI (Slovenia), SK (Slovakia), UK (United Kingdom). Countries sorted according to the indicator value
2 Reporting bias
8 Methodological issues in the analysis of the socioeconomic
determinants of health using EU-SILC data
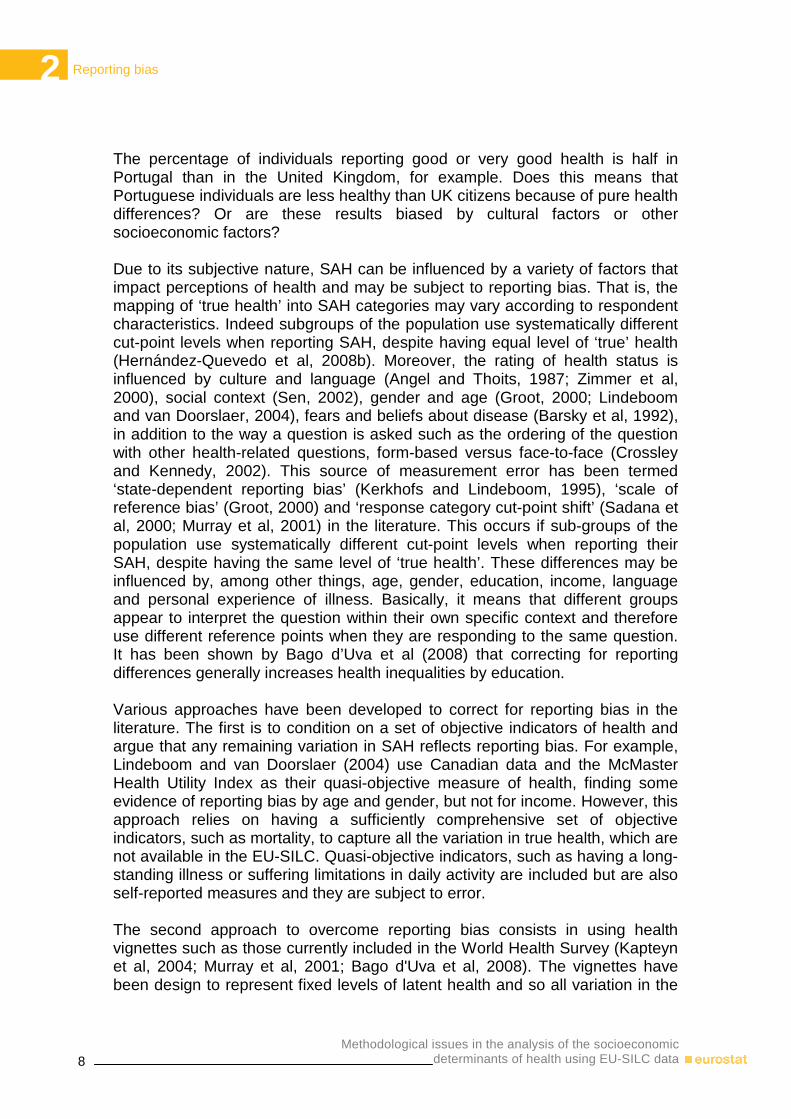
The percentage of individuals reporting good or very good health is half in Portugal than in the United Kingdom, for example. Does this means that Portuguese individuals are less healthy than UK citizens because of pure health differences? Or are these results biased by cultural factors or other socioeconomic factors? Due to its subjective nature, SAH can be influenced by a variety of factors that impact perceptions of health and may be subject to reporting bias. That is, the mapping of ‘true health’ into SAH categories may vary according to respondent characteristics. Indeed subgroups of the population use systematically different cut-point levels when reporting SAH, despite having equal level of ‘true’ health (Hernández-Quevedo et al, 2008b). Moreover, the rating of health status is influenced by culture and language (Angel and Thoits, 1987; Zimmer et al, 2000), social context (Sen, 2002), gender and age (Groot, 2000; Lindeboom and van Doorslaer, 2004), fears and beliefs about disease (Barsky et al, 1992), in addition to the way a question is asked such as the ordering of the question with other health-related questions, form-based versus face-to-face (Crossley and Kennedy, 2002). This source of measurement error has been termed ‘state-dependent reporting bias’ (Kerkhofs and Lindeboom, 1995), ‘scale of reference bias’ (Groot, 2000) and ‘response category cut-point shift’ (Sadana et al, 2000; Murray et al, 2001) in the literature. This occurs if sub-groups of the population use systematically different cut-point levels when reporting their SAH, despite having the same level of ‘true health’. These differences may be influenced by, among other things, age, gender, education, income, language and personal experience of illness. Basically, it means that different groups appear to interpret the question within their own specific context and therefore use different reference points when they are responding to the same question. It has been shown by Bago d’Uva et al (2008) that correcting for reporting differences generally increases health inequalities by education. Various approaches have been developed to correct for reporting bias in the literature. The first is to condition on a set of objective indicators of health and argue that any remaining variation in SAH reflects reporting bias. For example, Lindeboom and van Doorslaer (2004) use Canadian data and the McMaster Health Utility Index as their quasi-objective measure of health, finding some evidence of reporting bias by age and gender, but not for income. However, this approach relies on having a sufficiently comprehensive set of objective indicators, such as mortality, to capture all the variation in true health, which are not available in the EU-SILC. Quasi-objective indicators, such as having a long-standing illness or suffering limitations in daily activity are included but are also self-reported measures and they are subject to error. The second approach to overcome reporting bias consists in using health vignettes such as those currently included in the World Health Survey (Kapteyn et al, 2004; Murray et al, 2001; Bago d'Uva et al, 2008). The vignettes have been design to represent fixed levels of latent health and so all variation in the
2 Reporting bias
9 Methodological issues in the analysis of the socioeconomic determinants of health using EU-SILC data
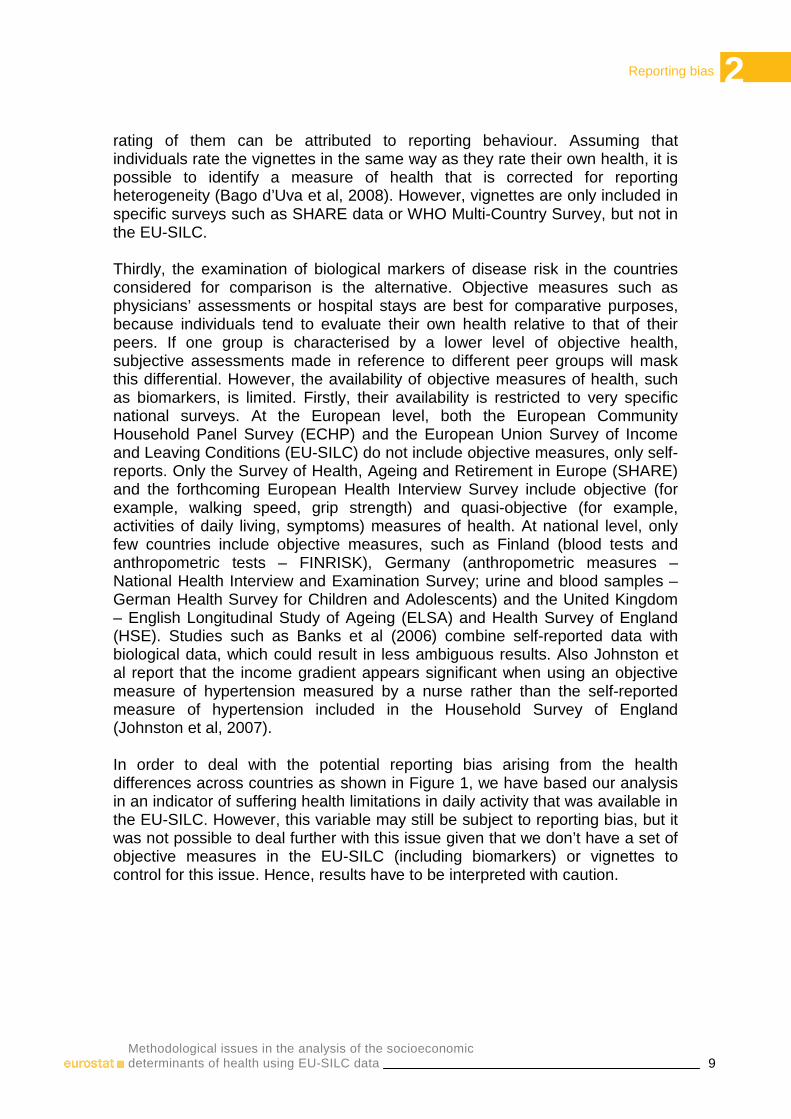
rating of them can be attributed to reporting behaviour. Assuming that individuals rate the vignettes in the same way as they rate their own health, it is possible to identify a measure of health that is corrected for reporting heterogeneity (Bago d’Uva et al, 2008). However, vignettes are only included in specific surveys such as SHARE data or WHO Multi-Country Survey, but not in the EU-SILC. Thirdly, the examination of biological markers of disease risk in the countries considered for comparison is the alternative. Objective measures such as physicians’ assessments or hospital stays are best for comparative purposes, because individuals tend to evaluate their own health relative to that of their peers. If one group is characterised by a lower level of objective health, subjective assessments made in reference to different peer groups will mask this differential. However, the availability of objective measures of health, such as biomarkers, is limited. Firstly, their availability is restricted to very specific national surveys. At the European level, both the European Community Household Panel Survey (ECHP) and the European Union Survey of Income and Leaving Conditions (EU-SILC) do not include objective measures, only self-reports. Only the Survey of Health, Ageing and Retirement in Europe (SHARE) and the forthcoming European Health Interview Survey include objective (for example, walking speed, grip strength) and quasi-objective (for example, activities of daily living, symptoms) measures of health. At national level, only few countries include objective measures, such as Finland (blood tests and anthropometric tests – FINRISK), Germany (anthropometric measures – National Health Interview and Examination Survey; urine and blood samples – German Health Survey for Children and Adolescents) and the United Kingdom – English Longitudinal Study of Ageing (ELSA) and Health Survey of England (HSE). Studies such as Banks et al (2006) combine self-reported data with biological data, which could result in less ambiguous results. Also Johnston et al report that the income gradient appears significant when using an objective measure of hypertension measured by a nurse rather than the self-reported measure of hypertension included in the Household Survey of England (Johnston et al, 2007). In order to deal with the potential reporting bias arising from the health differences across countries as shown in Figure 1, we have based our analysis in an indicator of suffering health limitations in daily activity that was available in the EU-SILC. However, this variable may still be subject to reporting bias, but it was not possible to deal further with this issue given that we don’t have a set of objective measures in the EU-SILC (including biomarkers) or vignettes to control for this issue. Hence, results have to be interpreted with caution.

3 Measuring inequality: taking into account the longitudinal dimension
10 Methodological issues in the analysis of the socioeconomic
determinants of health using EU-SILC data
3. Measuring inequality: taking into account the longitudinal dimension Longitudinal data offer information about the dynamics of individuals’ health and income and their impact on inequality over periods stretching longer than the typical one year cross-sectional survey. If health policy - and social policy in general - is concerned with lifetime histories (see for example the ‘fair innings’ argument described by Williams and Cookson, 2000) then the longer-run perspective provided by panel data can yield useful extra information. Recently, by drawing on the literature on income inequality, Jones and López-Nicolás (2004) have explored the additional information that can be obtained by using panel data. Work on income mobility has focused on comparing the distribution of income using two perspectives: firstly, a cross-sectional or short-run perspective and secondly, a long-run perspective where income is aggregated over a series of periods. If an individual’s income rank differs between the short-run and the long-run, there is evidence of income mobility. One way of measuring this phenomenon is through the index of income mobility proposed by Shorrocks (1978). Jones and López-Nicolás (2004) apply the principles used by Shorrocks (1978) to income-related health inequality. They show that income-related health inequality can be either greater or smaller in the long-run than the short-run and that, once again, these changes can be measured through an index of health-related income mobility which is based on the CI. It is useful to measure how much the longitudinal perspective, where N individuals are observed for T periods, alters the picture that would emerge from a series of cross-sections. Jones and López-Nicolás (2004) define an index of health-related income mobility to measure the difference between long-run and short-run inequality:
(1)
21 ( )( )
( ) 1, , ; 1, ,
( ) y
TT t T
it t i it t ti tt
t t
t
t T
itt i
titT
t i t
CIM y y R R
wCI N y CI
yw
T y
and
yi y i N t T
Ny y
iiNT T
= − = − −
=
= = =
= =
∑∑∑ ∑
∑
∑∑ ∑
K K
3 Measuring inequality: taking into account the longitudinal dimension
11 Methodological issues in the analysis of the socioeconomic determinants of health using EU-SILC data
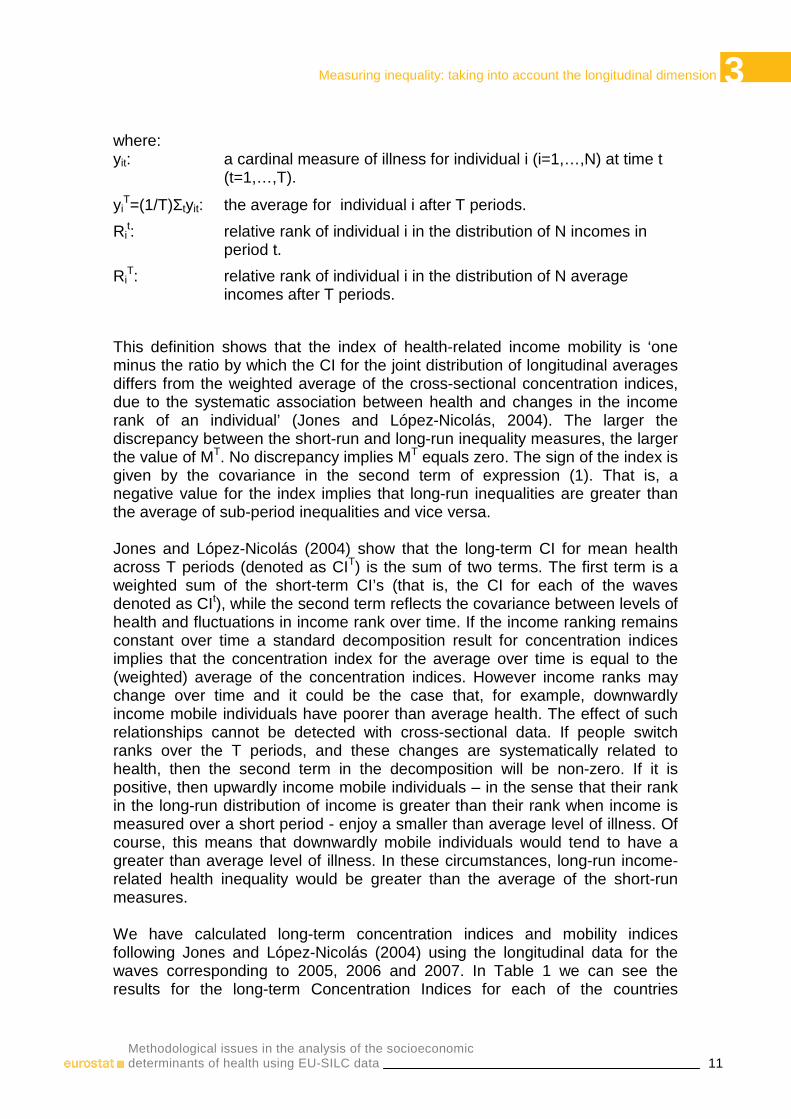
where: yit: a cardinal measure of illness for individual i (i=1,…,N) at time t
(t=1,…,T).
yiT=(1/T)Σtyit: the average for individual i after T periods.
Rit: relative rank of individual i in the distribution of N incomes in
period t.
RiT: relative rank of individual i in the distribution of N average
incomes after T periods.
This definition shows that the index of health-related income mobility is ‘one minus the ratio by which the CI for the joint distribution of longitudinal averages differs from the weighted average of the cross-sectional concentration indices, due to the systematic association between health and changes in the income rank of an individual’ (Jones and López-Nicolás, 2004). The larger the discrepancy between the short-run and long-run inequality measures, the larger the value of MT. No discrepancy implies MT equals zero. The sign of the index is given by the covariance in the second term of expression (1). That is, a negative value for the index implies that long-run inequalities are greater than the average of sub-period inequalities and vice versa. Jones and López-Nicolás (2004) show that the long-term CI for mean health across T periods (denoted as CIT) is the sum of two terms. The first term is a weighted sum of the short-term CI’s (that is, the CI for each of the waves denoted as CIt), while the second term reflects the covariance between levels of health and fluctuations in income rank over time. If the income ranking remains constant over time a standard decomposition result for concentration indices implies that the concentration index for the average over time is equal to the (weighted) average of the concentration indices. However income ranks may change over time and it could be the case that, for example, downwardly income mobile individuals have poorer than average health. The effect of such relationships cannot be detected with cross-sectional data. If people switch ranks over the T periods, and these changes are systematically related to health, then the second term in the decomposition will be non-zero. If it is positive, then upwardly income mobile individuals – in the sense that their rank in the long-run distribution of income is greater than their rank when income is measured over a short period - enjoy a smaller than average level of illness. Of course, this means that downwardly mobile individuals would tend to have a greater than average level of illness. In these circumstances, long-run income-related health inequality would be greater than the average of the short-run measures. We have calculated long-term concentration indices and mobility indices following Jones and López-Nicolás (2004) using the longitudinal data for the waves corresponding to 2005, 2006 and 2007. In Table 1 we can see the results for the long-term Concentration Indices for each of the countries

3 Measuring inequality: taking into account the longitudinal dimension
12 Methodological issues in the analysis of the socioeconomic
determinants of health using EU-SILC data
included in our analysis. The long-run CI’s inform us about the degree of income-related health inequality when both income and health are averaged over the whole period for which individuals are observed. Table 1: Long-term concentration indices and mobility indices for the European member states
CI_T MI BE -0.20 0.17 CZ -0.19 -0.21 EE -0.16 0.21 ES -0.12 0.15 FR -0.13 0.00 IT -0.11 0.08 CY -0.26 0.01 LV -0.20 -0.12 LT -0.17 0.04 LU -0.09 0.14 HU -0.10 0.08 NL -0.17 0.01 AT -0.13 -0.02 PL -0.04 0.32 PT -0.11 0.08 SI -0.17 0.07 SK -0.12 -0.07 FI -0.10 0.14 SE -0.12 0.01 UK -0.21 -0.01
Source: See Figure 1 Reading note: In Poland, the long-term concentration index equals -0.01, which implies that in the long-term, health limitations are more concentrated among individuals in the bottom of the income distribution. This level of pro-poor inequalities in health limitations are smaller than in Portugal (-0.11), in absolute terms. As to the MI, it is 0.32, which indicates that, if we were not considering the mobility of individuals in the income distribution over time when calculating long-term inequalities in health, we would be overestimating inequalities in health limitations in 32% Long-term concentration indices (CI_T) are negative for all the countries; hence, there are long-term income-related inequalities in health, with health limitations more concentrated among those with lower incomes. The largest long-term socioeconomic inequalities in health limitations can be seen in Cyprus, while the smallest correspond to Poland (in absolute terms). Regarding the mobility indices, it is possible to see that the majority are positive. This shows that there is lower long-run income-related inequality in health limitations than would be inferred by the average of the short-run indices. In other words, if we were calculating long-term inequalities without taking into account the mobility in the income distribution of individuals through time, we would be overestimating inequalities in health limitations for the majority of
3 Measuring inequality: taking into account the longitudinal dimension
13 Methodological issues in the analysis of the socioeconomic determinants of health using EU-SILC data
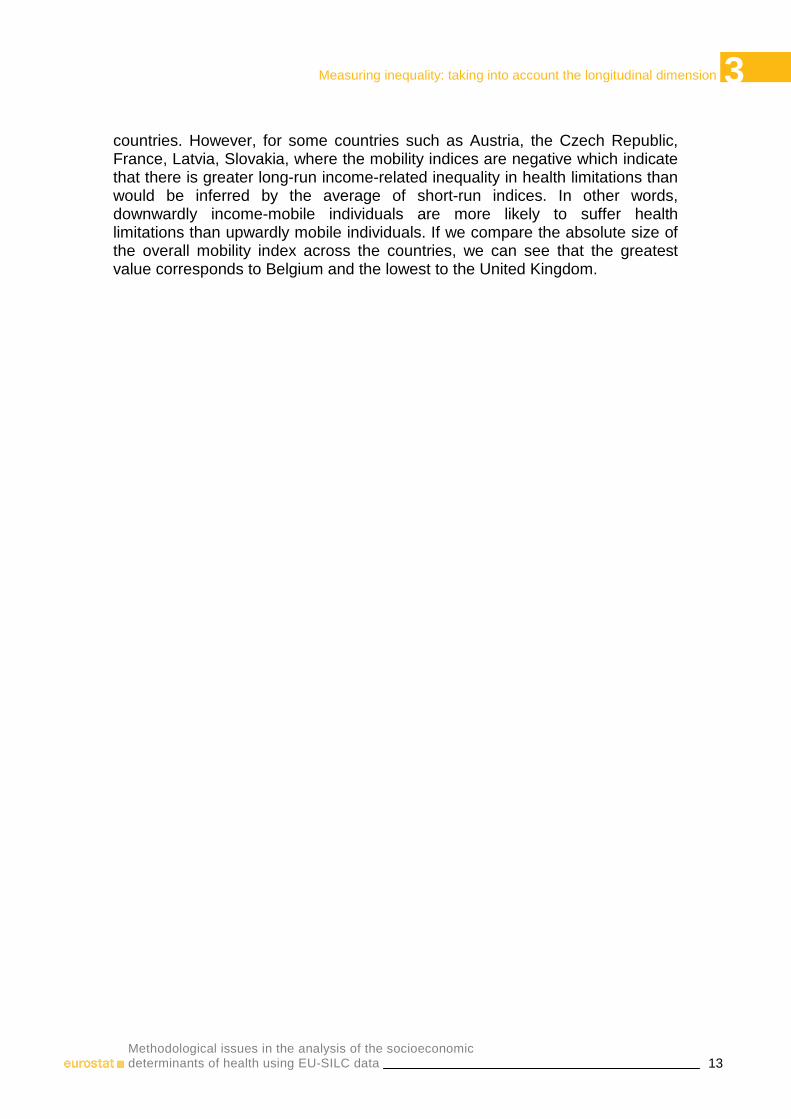
countries. However, for some countries such as Austria, the Czech Republic, France, Latvia, Slovakia, where the mobility indices are negative which indicate that there is greater long-run income-related inequality in health limitations than would be inferred by the average of short-run indices. In other words, downwardly income-mobile individuals are more likely to suffer health limitations than upwardly mobile individuals. If we compare the absolute size of the overall mobility index across the countries, we can see that the greatest value corresponds to Belgium and the lowest to the United Kingdom.
4 Measuring inequality: the 'adjusted' CI
14 Methodological issues in the analysis of the socioeconomic
determinants of health using EU-SILC data
4. Measuring inequality: the ‘adjusted’ CI Although the Concentration Index is a wide used measure of health, several drawbacks have been highlighted in the literature. Firstly, the bounds of the CI depend on the mean of the health variable, making comparisons across populations with different mean health levels problematic (Wagstaff, 2005). Secondly, it has been seen that different rankings are obtained when comparing inequalities in health with inequalities in ill-health (Clarke et al, 2002). Finally, it has been argue that if the health variable has a qualitative nature, then the index becomes arbitrary. Given these three issues, Erreygers (2009) suggests a new corrected concentration index to overcome the listed limitations. In order to make comparisons between groups of individuals that could present different levels of average health, we use the corrected Concentration Index suggested by Erreygers (2009). Taking into account the usual CI given by expression (1), the corrected Concentration Index can be calculated as follows:
)(*4
)(minmax
hCIhh
hhE
−= (2)
where h is the mean of the health variable, max
h and minh are the extremes of the
health variable and CI(h), the ‘old’ concentration index. Without this correction, the Concentration Index will depend on average health and this could confuse comparisons of inequalities in health among the countries analysed. If the adjusted CIs are considered, results vary compared to the standard CIs shown elsewhere (Hernández-Quevedo et al, 2010).
4 Measuring inequality: the 'adjusted' CI
15 Methodological issues in the analysis of the socioeconomic determinants of health using EU-SILC data
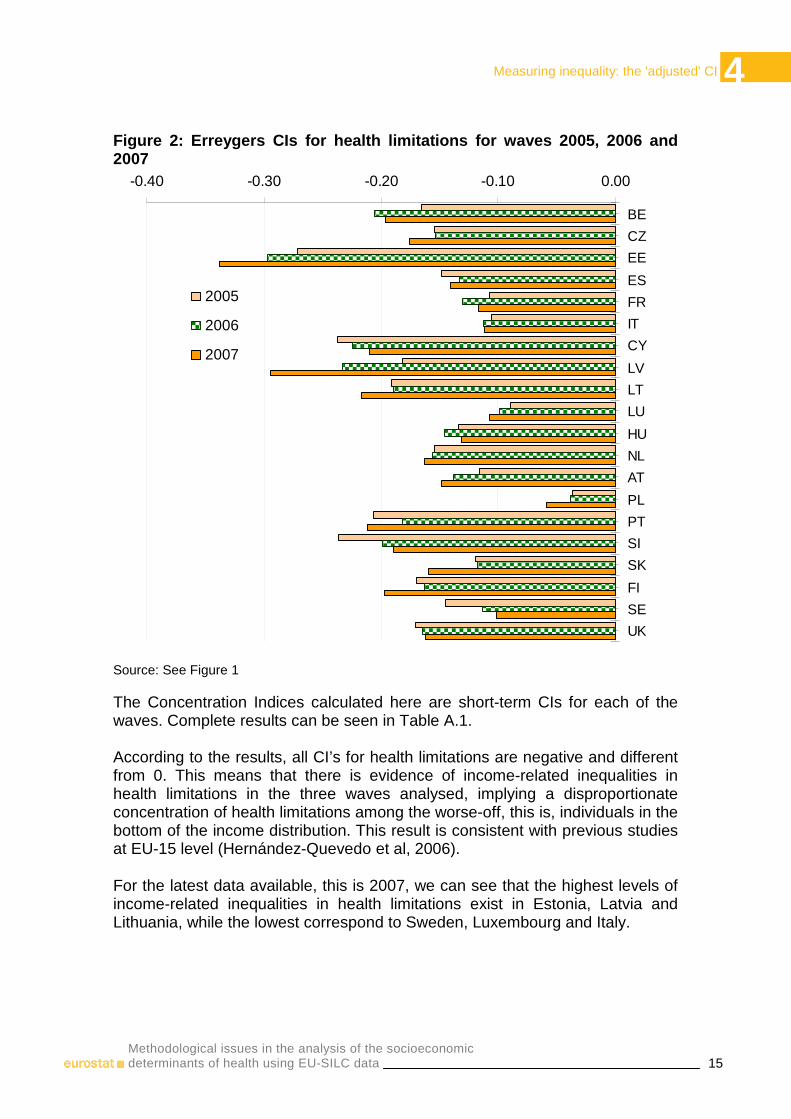
Figure 2: Erreygers CIs for health limitations for waves 2005, 2006 and 2007
-0.40 -0.30 -0.20 -0.10 0.00
BE
CZ
EE
ES
FR
IT
CY
LV
LT
LU
HU
NL
AT
PL
PT
SI
SK
FI
SE
UK
2005
2006
2007
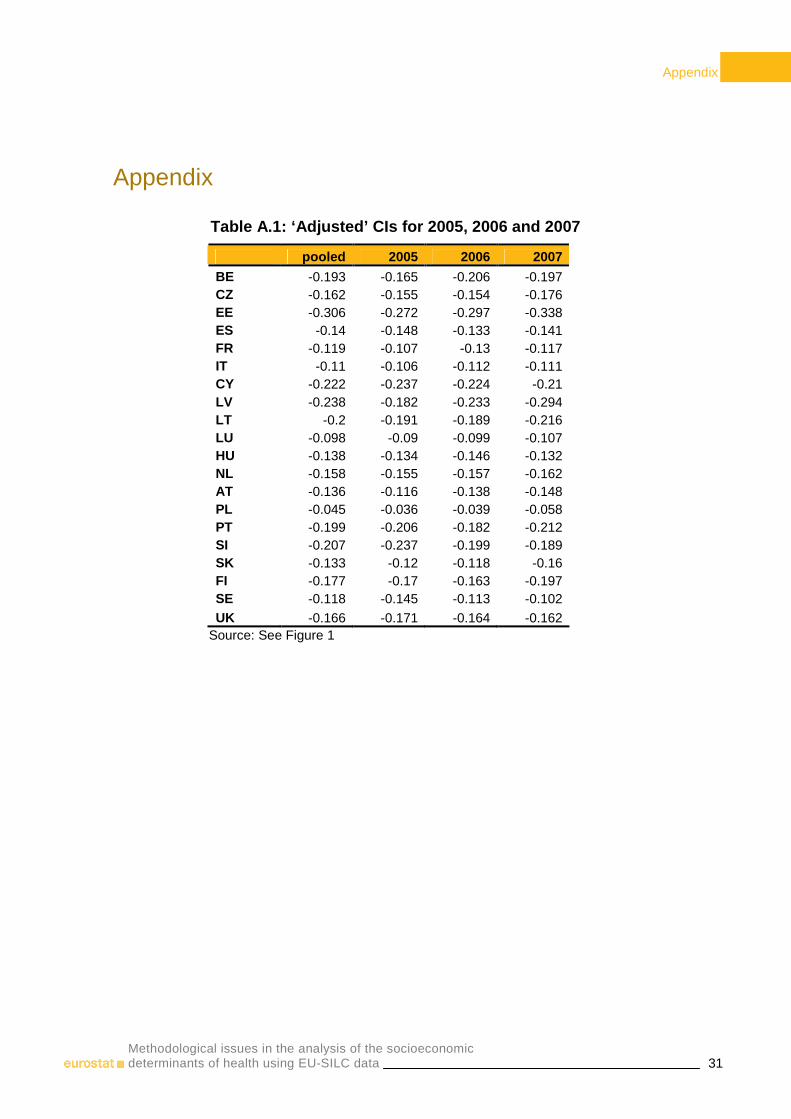
Source: See Figure 1 The Concentration Indices calculated here are short-term CIs for each of the waves. Complete results can be seen in Table A.1. According to the results, all CI’s for health limitations are negative and different from 0. This means that there is evidence of income-related inequalities in health limitations in the three waves analysed, implying a disproportionate concentration of health limitations among the worse-off, this is, individuals in the bottom of the income distribution. This result is consistent with previous studies at EU-15 level (Hernández-Quevedo et al, 2006). For the latest data available, this is 2007, we can see that the highest levels of income-related inequalities in health limitations exist in Estonia, Latvia and Lithuania, while the lowest correspond to Sweden, Luxembourg and Italy.
4 Measuring inequality: the 'adjusted' CI
16 Methodological issues in the analysis of the socioeconomic
determinants of health using EU-SILC data
Moreover, for several countries there was a clear trend on socioeconomic inequalities in health limitations through time. For Poland, the Netherlands, Latvia, Luxembourg, Lithuania, Estonia and Austria, there is a clear increase on income-related inequalities in health limitations across time, while for Sweden and Slovenia there is a clear decreasing trend for socioeconomic inequalities in health limitations from wave 2005 to wave 2007. If we compare income-related inequalities in health limitations between 2005 and 2007 for those countries without a clear pattern, we can see that overall inequalities increased everywhere with the exception of the United Kingdom, Hungary, Spain and Estonia.
5 Analysing unmet need for health care
17 Methodological issues in the analysis of the socioeconomic determinants of health using EU-SILC data
5. Analysing unmet need for health care Self-reported unmet need for health care is included in the EU-SILC cross- sectional data, providing an opportunity for cross-country comparative research on access to health care. Unmet need is considered an indicator of access to care (Allin and Masseria, 2009). Although there are various indicators of access to care, a relatively simple tool is to directly questioning individuals whether there was a time when they needed health care but did not receive it. There are a few studies of unmet need in Europe and all have identified a strong association with both income and health. People who report unmet need tend to be in worse health and with lower income. For instance, an early study of the EU-SILC (Koolman, 2007) found that reporting any unmet need was concentrated among those with lower income in all countries, as signalled by a negative concentration index. Even after adjusting for health (which tends to be worse among those with lower income), the relationship with income persisted in all countries except in Luxembourg, Norway and Spain (Koolman, 2007). Analyses of SHARE data also show an association between forgone care and income. Mielck et al (2007) found a higher likelihood of foregoing care among individuals with lower income in all countries studied. In the EU-SILC, two indicators of unmet need are included: unmet need for medical examination or treatment and unmet need for dental examination or treatment during the last 12 months. Individuals are provided two possible answers for both variables: ‘Yes, there was at least one occasion when the person really needed medical (dental) examination or treatment but did not’ and ‘No, there was no occasion when the person really needed medical (dental) examination or treatment but did not’. Moreover, there are two questions regarding the main reason for unmet need for medical and dental examination or treatment, with 8 possible answers: could not afford to (too expensive), waiting list, could not take time because of work, care for children or for others, too far to travel/no means of transportation, fear of doctor/hospitals/examination/treatment, wanted to wait and see if problem got better on its own, didn’t know any good doctor or specialist, other reasons. We considered unmet need. We analyse cross-sectional data for 2007 only. Table 2 reports the percentage of individuals that reported at least one occasion when they needed medical examination or treatment but did not get it in 2007 (column 1). We can see that countries present different prevalence of unmet need for medical examination, with percentages above 10% in Latvia (23.9%), Sweden (15.4%), Poland (12.7%), Estonia (12.4%), Portugal (11.7%), and Hungary (11.4%), but below 1% in Belgium (0.4%) and Slovenia (0.4%).
5 Analysing unmet need for health care
18 Methodological issues in the analysis of the socioeconomic
determinants of health using EU-SILC data
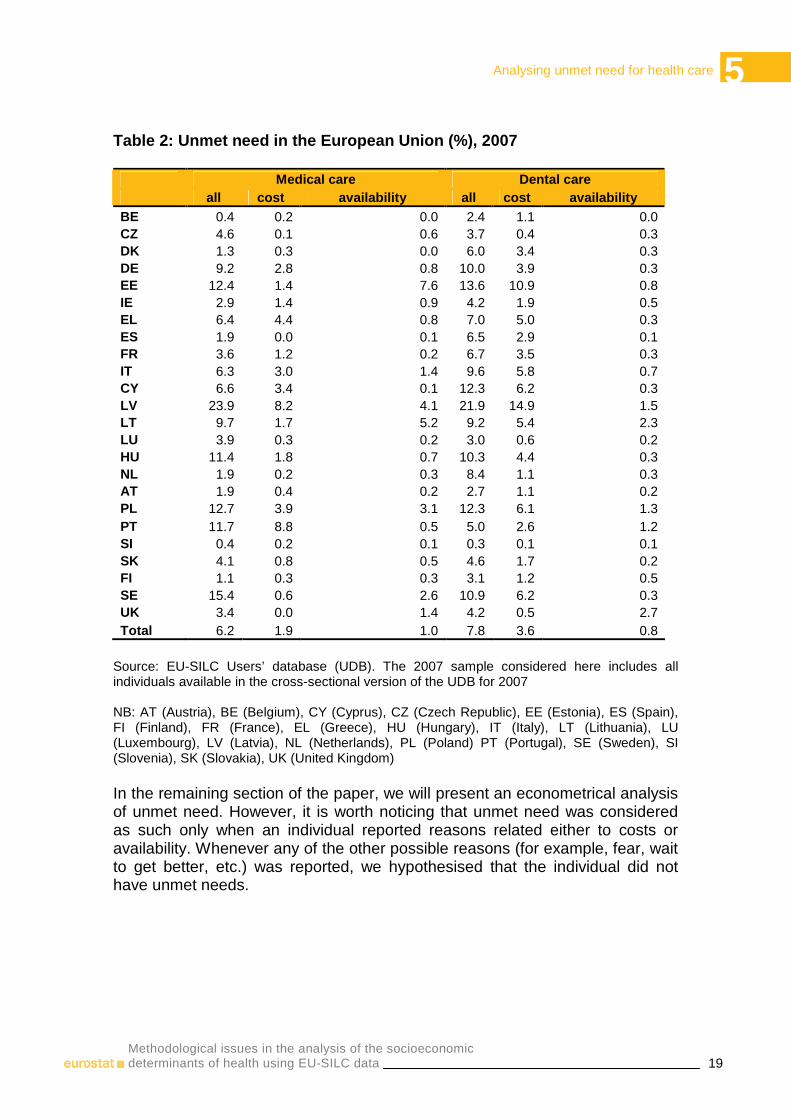
However, more than 50% of this reported unmet medical need can not be properly defined as unmet need since when considering only people who responded that they did not access care although needed because of cost -answer: could not afford to-, or availability reasons –answer: waiting list or too far to travel/no means of transportation- then the percentage of people reporting unmet need decrease significantly everywhere. It remains above 10% only in Latvia (12.3%), while in Portugal it decreased to 9.4%, in Estonia to 8.7%, in Sweden to 3.3%, and in Hungary to 2.6%. Among the countries with less than 1% of the population reporting unmet need there were not only Belgium (0.3%) and Slovenia (0.3%) but also the Czech Republic (0.8%), Austria (0.6%), Luxemburg (0.5%), the Netherlands (0.4%), Denmark (0.3%), and Spain (0.1%). In the majority of the countries, the main reason for unmet medical need was cost (column 2, Table 2) with the exception of the Czech Republic, Estonia, Spain, Latvia, the Netherlands, Sweden and the United Kingdom. For dental care the results are reported in Table 2, columns 4 to 6. The percentage of people who reported unmet need for any reason was higher for dental care than for medical care almost everywhere, but again there was large heterogeneity across countries. It was again the highest in Latvia (21.9%) followed by Estonia (13.6%), Poland (12.3%), Cyprus (12.3%), Sweden (10.9%), Hungary (10.3%) and Germany (10.0%). The countries with the lowest level of unmet need were Luxemburg (3.0%), Belgium (2.4%), and Slovenia (0.3%). As for medical care, the percentage of people reporting unmet need decreased when only reasons related with costs and availability were considered, explaining these on average 55% of total unmet need. The main cause of unmet dental need was costs (column 5, Table 2) everywhere but in the United Kingdom; with availability explaining 10% or less of unmet need in half of the countries (column 6, Table 2).
5 Analysing unmet need for health care
19 Methodological issues in the analysis of the socioeconomic determinants of health using EU-SILC data
Table 2: Unmet need in the European Union (%), 2007 Medical care Dental care all cost availability all cost availability BE 0.4 0.2 0.0 2.4 1.1 0.0 CZ 4.6 0.1 0.6 3.7 0.4 0.3 DK 1.3 0.3 0.0 6.0 3.4 0.3 DE 9.2 2.8 0.8 10.0 3.9 0.3 EE 12.4 1.4 7.6 13.6 10.9 0.8 IE 2.9 1.4 0.9 4.2 1.9 0.5 EL 6.4 4.4 0.8 7.0 5.0 0.3 ES 1.9 0.0 0.1 6.5 2.9 0.1 FR 3.6 1.2 0.2 6.7 3.5 0.3 IT 6.3 3.0 1.4 9.6 5.8 0.7 CY 6.6 3.4 0.1 12.3 6.2 0.3 LV 23.9 8.2 4.1 21.9 14.9 1.5 LT 9.7 1.7 5.2 9.2 5.4 2.3 LU 3.9 0.3 0.2 3.0 0.6 0.2 HU 11.4 1.8 0.7 10.3 4.4 0.3 NL 1.9 0.2 0.3 8.4 1.1 0.3 AT 1.9 0.4 0.2 2.7 1.1 0.2 PL 12.7 3.9 3.1 12.3 6.1 1.3 PT 11.7 8.8 0.5 5.0 2.6 1.2 SI 0.4 0.2 0.1 0.3 0.1 0.1 SK 4.1 0.8 0.5 4.6 1.7 0.2 FI 1.1 0.3 0.3 3.1 1.2 0.5 SE 15.4 0.6 2.6 10.9 6.2 0.3 UK 3.4 0.0 1.4 4.2 0.5 2.7 Total 6.2 1.9 1.0 7.8 3.6 0.8
Source: EU-SILC Users’ database (UDB). The 2007 sample considered here includes all individuals available in the cross-sectional version of the UDB for 2007 NB: AT (Austria), BE (Belgium), CY (Cyprus), CZ (Czech Republic), EE (Estonia), ES (Spain), FI (Finland), FR (France), EL (Greece), HU (Hungary), IT (Italy), LT (Lithuania), LU (Luxembourg), LV (Latvia), NL (Netherlands), PL (Poland) PT (Portugal), SE (Sweden), SI (Slovenia), SK (Slovakia), UK (United Kingdom) In the remaining section of the paper, we will present an econometrical analysis of unmet need. However, it is worth noticing that unmet need was considered as such only when an individual reported reasons related either to costs or availability. Whenever any of the other possible reasons (for example, fear, wait to get better, etc.) was reported, we hypothesised that the individual did not have unmet needs.
5 Analysing unmet need for health care
20 Methodological issues in the analysis of the socioeconomic
determinants of health using EU-SILC data
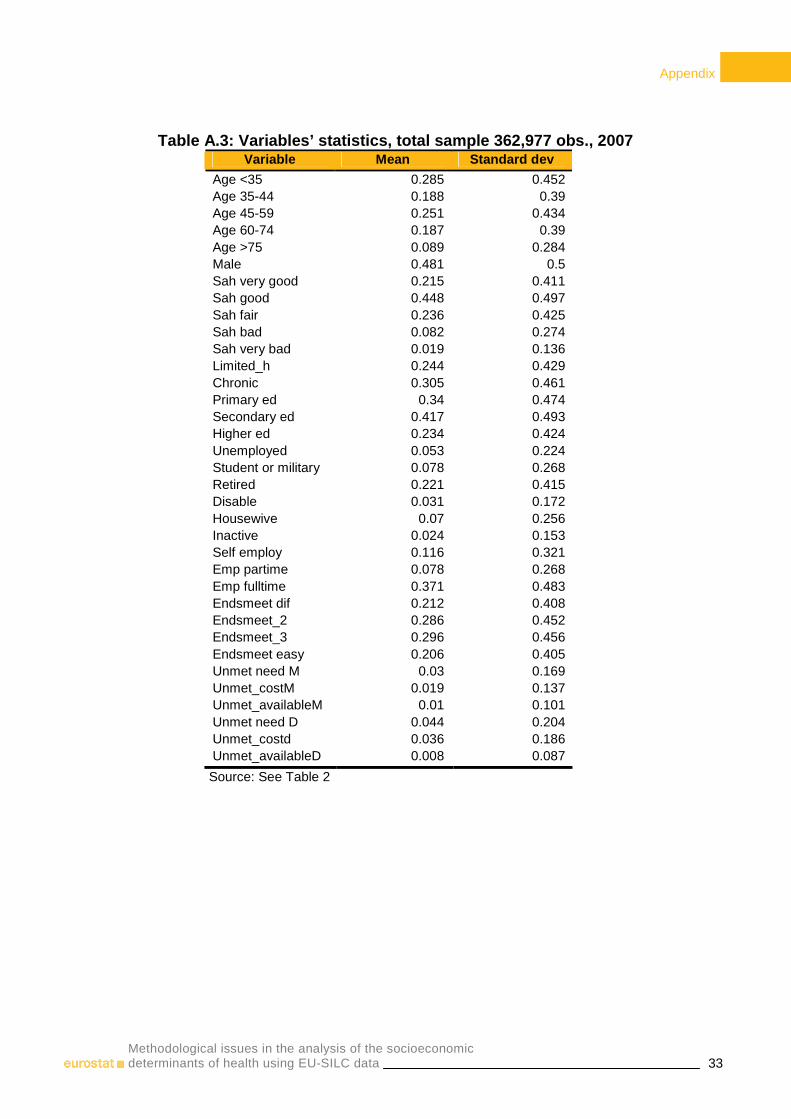
Explanatory variables As explanatory variables, we include a set of demographic and socioeconomic variables included in the longitudinal data of the EU-SILC (statistics are reported in Table A.2 and Table A.3). For our regression analysis, we use several demographic variables, such as age and gender, and health variables. Age was grouped in five categories: less than 35 years old -reference group-, between 35 and less than 45, between 45 and less than 60, between 60 and less than 75, and above 75 years old. We also include an indicator of being male, with female being the reference category. For the health variables, the EU-SILC includes three questions. One of the questions is self-perceived health. Individuals are asked: ‘how is your health in general?’ with five possible responses: very good, good, fair, bad and very bad. These were grouped in three categories: good (representing answers very good and good), fair, and bad (representing answers bad and very bad). A second health variable included asks the individual: ‘Do you have any long-standing illness, disability or infirmity?’, with two possible answers: yes, no. A dummy was created for people reporting chronic conditions. A third health outcome variable indicates whether the individual suffers any limitation in activities because of health problems for at least the last 6 months, with three possible answers: ‘yes, strongly’, ‘yes, limited’, ‘no, not limited’. A single dummy variable representing people with limitations (either sever or not) was included as explanatory variable in the unmet need model. As socioeconomic factors, we include the equivalised household disposable income, which is a derived variable already included in the EU-SILC database. In our regression analysis we include the logarithm of this variable (ln_inc). Three dummies representing the highest level of education attained based on the ISCED have been considered: primary and lower secondary education, (upper) secondary education and post-secondary non-tertiary education, and first stage of tertiary education (reference group); moreover, whenever the number of missing values was above 1000, we included a further category (missing value for education). Several indicators of activity status were also included (unemployed, student or in military service, retired, disabled, housewife, inactive, self-employed, employed part-time, and employed full-time, which is our reference category). Besides, we include several indicators regarding whether the individual make ends meet with great difficulty or with difficulty (endsmeet_dif), with some difficulty (endsmeet_2), fairly easily (endsmeet_3) or either easily or very easily, which is our reference category. We also include whether the individual has the capacity to afford paying for one week annual holiday away from home. We also include three indicators regarding the degree of urbanisation: densely populated area (urban1) which is the reference category, intermediate area (urban2) and thinly populated area (urban3). Besides, two dummies for waves 2006 and 2007 are included, with
5 Analysing unmet need for health care
21 Methodological issues in the analysis of the socioeconomic determinants of health using EU-SILC data
2005 being our reference wave. Finally, we include the different regions for each country. Empirical analysis of EU-SILC data: unmet need We analyze income-related inequities in reporting unmet need for health services in the 24 countries for which information is available in the 2007 cross-sectional database (country statistics are reported in Table A.2 and Table A.3). Since in most countries the percentage of people reporting unmet need is very low, it was impossible to perform a country by country analysis. Therefore, we have proceeded in two steps. Firstly, we run a probit model for the probability of reporting unmet need in all countries adding country dummies (the reference category was Austria), separately for medical and dental care. Concentration and horizontal inequity indices were calculated for each model. A multilevel logistic model was also specified to identify differences in the determinants of reporting unmet need due to cost and availability. Secondly, we grouped the 24 countries in 4 categories: Northern-Western European countries (Austria, Belgium, Germany, Denmark, Finland, France, Ireland, Luxemburg, the Netherlands, Sweden and the United Kingdom), Southern-European countries (Cyprus, Greece, Italy, Spain and Portugal), Baltic countries (Estonia, Latvia and Lithuania), and Central-Eastern European countries (the Czech Republic, Hungary, Poland, Slovenia and Slovakia). For each group of countries, probit models for the probability of reporting unmet need separately for medical and dental care were run calculating the concentration and horizontal inequity indices (the appropriate country dummies were again included among the explanatory variables). The horizontal inequity index (HI) is by definition equal to the difference between the income-related inequality in the unstandardised unmet need (unmet need concentration index, Cm) and the income-related inequality in need-expected care (Cn). When the worse-off (better-off) have higher unmet need than the better-off (worse-off), Cm is negative (positive), and when the need distribution favours the worse-off (better-off), the value of Cn is negative (positive). Therefore, whenever Cm equals Cn, HI is zero and no inequity is detected. On the contrary, a positive (negative) value of the index implies inequity favouring the better-off (worse-off). Estimates of needs necessary for calculating Cn were obtained using respectively probit or multilevel logit models. In the former, the dependent variable equals one if the individual reported unmet need or zero otherwise, with the independent variables differentiated between need (age, gender, self-reported health status, limitations in daily activities and probability of reporting at least one chronic condition) and non need variables. In the multinomial logit model, although the procedure is similar, the dependent variable equals zero if the individual did not report unmet need, one if she reported unmet need due to cost, and two if she reported unmet need due to availability.
5 Analysing unmet need for health care
22 Methodological issues in the analysis of the socioeconomic
determinants of health using EU-SILC data
For the dental care model, need variables included only age and gender, since it is difficult to argue that self-reported health status, limitations in daily activities, or probability of reporting chronic conditions represent needs for dental care. Results The results of the probit model for medical care show that worse health status was significantly correlated with the probability of reporting unmet need (Table A.4). People in worse health, with chronic condition and with at least some limitations in daily activities were more likely to report unmet need than their counterparts. Older people and men had a lower probability of reporting unmet needs. Among the socioeconomic variables, people with either primary or secondary education were less likely to report unmet needs than those with higher education. While among the employment variables, it emerges that unemployed and self-employed people reported significant higher unmet needs than those employed part-time; while retired people, disabled, students and the military reported significant less unmet needs for medical care than the reference category. A clear gradient appears in the make ends meet dummies; people reporting more difficulties in making ends meet also reported higher unmet needs for medical care. People who could afford at least one holiday per year were less likely to have unmet needs. Income per se was not statistically significant. However, there was an indirect effect of income through education, employment, and make ends meet on the probability of reporting unmet need. Indeed, the horizontal inequity index was negative and statistically significant implying a pro-poor inequity in unmet needs (Figure 3). The poor were more likely to report unmet needs, after standardising for the need, the level of inequity decreased (since also the needs were also pro-poor) but still remained statistically significant. A major determinant of unmet need was the country of residence, as already showed by country statistics (Table 2). Belgium, the Czech Republic, Denmark, Spain, the Netherlands, Slovenia, and Slovakia had a lower probability of reporting unmet needs than Austria; while Cyprus, Germany, Estonia, France, Greece, Ireland, Italy, Lithuania, Latvia, Poland, Portugal, Sweden and the United Kingdom were more likely to report unmet needs. The country by country analysis shows that there was statistically significant pro-poor inequity in unmet need in all country groups (Figure 3). However, the higher level of inequity is observed when all countries are grouped together. The lowest level of inequity was reported among the Central Eastern European countries, while the highest level of inequity is found among the Southern countries.

5 Analysing unmet need for health care
23 Methodological issues in the analysis of the socioeconomic determinants of health using EU-SILC data
Figure 3: Unmet need horizontal inequity indices for medical care, 2007
-0.30
-0.25
-0.20
-0.15
-0.10
-0.05
0.00
Central-Eastern Northern-Western Baltic Southern All countries
Source: See Table 2 The horizontal inequity indices for unmet needs due to costs and availability were calculated using the multinomial logit model and combining all countries together (Table A.4 reports the odds ratios). Again, health status was a main determinant of the probability of reporting unmet need both due to either costs or availability. However, the role of the socioeconomic variables often varied when looking at the results of the two outcomes. For unmet need due to costs for example, education was not statistically significant, while for unmet need due to availability, people with either primary or secondary education were less likely to report unmet needs than those with higher education. Among the employment dummies, people unemployed and employed part-time were more likely to report unmet needs due to cost but less likely to report unmet need due to availability. Inactive and self-employed individuals had a higher probability of reporting unmet need because of costs than those employed full-time, but no statistically significant difference in reporting was observed for unmet need because of availability reasons. Significant countries differences also emerge. For example, Belgium, Spain and Slovenia had a significant lower probability of reporting both unmet needs (cost and availability) than Austria (reference category); while Germany, Estonia, Greece, Ireland, Lithuania, Latvia, Poland and Sweden had a significant higher probability in both unmet needs. Discordant country pattern in reporting unmet need emerges in a few countries; Cyprus and France were more likely to report higher unmet needs due to cost but lower unmet needs due to availability; while the Czech Republic and the United Kingdom were more likely to report higher unmet needs for availability but less for costs than the reference category. The results of the horizontal inequity indices shows that pro-poor inequity was present in both unmet needs, although the level of inequity was higher for cost (-0.38) than availability (-0.16).
5 Analysing unmet need for health care
24 Methodological issues in the analysis of the socioeconomic
determinants of health using EU-SILC data
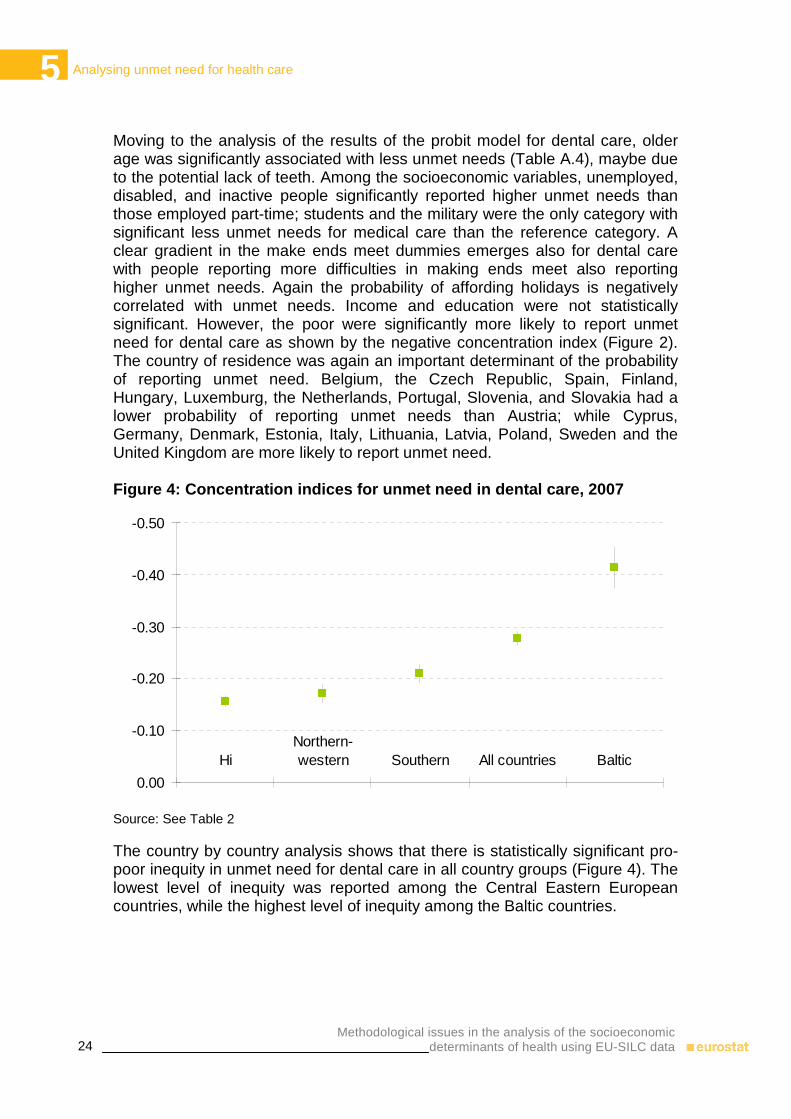
Moving to the analysis of the results of the probit model for dental care, older age was significantly associated with less unmet needs (Table A.4), maybe due to the potential lack of teeth. Among the socioeconomic variables, unemployed, disabled, and inactive people significantly reported higher unmet needs than those employed part-time; students and the military were the only category with significant less unmet needs for medical care than the reference category. A clear gradient in the make ends meet dummies emerges also for dental care with people reporting more difficulties in making ends meet also reporting higher unmet needs. Again the probability of affording holidays is negatively correlated with unmet needs. Income and education were not statistically significant. However, the poor were significantly more likely to report unmet need for dental care as shown by the negative concentration index (Figure 2). The country of residence was again an important determinant of the probability of reporting unmet need. Belgium, the Czech Republic, Spain, Finland, Hungary, Luxemburg, the Netherlands, Portugal, Slovenia, and Slovakia had a lower probability of reporting unmet needs than Austria; while Cyprus, Germany, Denmark, Estonia, Italy, Lithuania, Latvia, Poland, Sweden and the United Kingdom are more likely to report unmet need. Figure 4: Concentration indices for unmet need in dental care, 2007
-0.50
-0.40
-0.30
-0.20
-0.10
0.00
HiNorthern-western Southern All countries Baltic
Source: See Table 2 The country by country analysis shows that there is statistically significant pro-poor inequity in unmet need for dental care in all country groups (Figure 4). The lowest level of inequity was reported among the Central Eastern European countries, while the highest level of inequity among the Baltic countries.
5 Analysing unmet need for health care
25 Methodological issues in the analysis of the socioeconomic determinants of health using EU-SILC data
Differences in unmet needs due to costs and availability for all countries combined were analysed using a multinomial logit model (Table A.4). The results show again significant differences across countries. Belgium, the Czech Republic, Spain, Greece, Luxemburg, Slovenia and Slovakia had a significant lower probability of reporting dental unmet needs in both cost and availability than Austria; while Estonia, Italy, Lithuania and Latvia had a significant higher probability in both unmet needs. Discordant country pattern in reporting unmet need emerges in the following countries: Cyprus, Denmark, Germany, France and Sweden were more likely to report higher unmet needs due to cost but either lower or not significantly different unmet needs due to availability; while Poland, Portugal and the United Kingdom were more likely to report higher unmet needs for availability, but either less or not statistically different for costs than the reference category. The results of the horizontal inequity indices show that there was pro-poor inequity in dental unmet needs due to costs (-0.34), but not statistically significant inequity in unmet need due to availability (-0.02).
6 Discussion
26 Methodological issues in the analysis of the socioeconomic
determinants of health using EU-SILC data
6. Discussion Health inequalities across socioeconomic groups are a health and public policy concern in all countries. There exist robust methodological tools from the epidemiological and economics disciplines to measure inequalities in health and there is a substantial amount of evidence on the level of inequalities in health across countries. However, there are numerous methodological issues that the study of health inequalities introduces. In this article, we discuss the potential reporting bias and the alternative methods included in other health surveys to correct for this issue. Secondly, we distinguish between short-term and long-term CI, exploiting the longitudinal data available. Thirdly, we highlight the new ‘corrected’ CI that benefits comparison across countries with different average level of health. Finally, we conclude with an analysis of unmet need for medical and dental examination or treatment and their main reasons using the 2007 cross-sectional data, as this information is not available for the longitudinal data. We discussed the potential bias that could be leading to the percentage of individuals reporting very good and good health in the 20 European countries analysed. The different methods used in the literature to control for reporting bias were discussed, although we found limitations to implement them using EU-SILC data. We decided to focus our analysis on a quasi-objective measure included in the EU-SILC such as an indicator of suffering health limitations in daily activity. Given the limitations of using this type of indicators, we conclude that results provided from the EU-SILC have to be interpreted with caution. We provide new evidence on long-term CIs, which fully exploit the longitudinal nature of the panel. Hence, evidence on long-run inequalities in health limitations was provided, with health limitations concentrated in those individuals in the bottom of the income distribution. We also calculated an index of mobility and it was possible to see that for most of the countries, there was income mobility across time, which was systematically related to health mobility across time, with the exception being the United Kingdom, in which the MI is very close to zero. We also provided new evidence on income-related inequalities in health limitations across 20 European countries using the adjusted CI suggested by Erreygers (2009). We could see that the results differ from those obtained using the ‘old’ CI and hence, it is necessary to perform this adjustment in the context of European countries with different average levels of health status.

6 Discussion
27 Methodological issues in the analysis of the socioeconomic determinants of health using EU-SILC data
Regarding our unmet needs analysis, across European countries there was large heterogeneity in the probability of reporting unmet needs due to either cost or availability. The econometrical results show that the distribution of medical unmet need was significantly pro-poor in Europe with Southern countries reporting the highest level of inequity and Central-Eastern European countries the lowest. On average the level of inequity was higher for unmet needs due to costs than availability. Regarding dental unmet needs, again the poor had on average a higher probability of reporting unmet needs. The highest level of inequity was found in the Baltic countries and the lowest in the Northern-Western countries. By differentiating unmet needs due to costs and availability, we found that inequity was present only in the former while in the latter no statistically significant inequity was detected. A main limitation on our unmet needs analysis is the lack of access to care data. Indeed it would have been interesting to verify whether individuals reporting unmet needs access care less or more than those not reporting unmet needs. Previous studies show that people who report unmet need tend to use health care services more than those who do not report this access problem after standardising for health (Allin, Grignon and Le Grand, 2008; Hurley, Jamal, Grignon and Allin, 2008). Therefore it might be possible that unmet actually represent dissatisfaction with the health system more than problems in accessing health care; and this hypothesis is also supported by the education-gradient in reported unmet need been found in these Canadian studies as well as in our study, whereby higher educated individuals are more likely to report unmet need.
6 References
28 Methodological issues in the analysis of the socioeconomic
determinants of health using EU-SILC data
References Allin, S., Grignon, M., & Le Grand, J. (2008). Subjective Unmet Need and Utilization of Heatlh Care Services in Canada: Implications for Equity. Unpublished manuscript Allin, S and C Masseria (2009). Unmet need as an indicator of health care access. Eurohealth, 15(3) Angel, R and P Thoits (1987). The impact of culture on the cognitive structure of illness. Culture, Medicine and Psychiatry, 11(4): pp. 465-494 Bago d’Uva, T, E van Doorslaer, M Lindeboom, O O’Donnell (2008). Does reporting heterogeneity bias the measurement of health disparities? Health Economics, 17(3): 351 – 375 Banks, J, M Marmot, Z Oldfield, JP Smith (2006). Disease and disadvantage in the United States and England. Journal of the American Medical Association, 295(17): 2037 – 2045 Barsky, AJ, PD Cleary, GL Klerman (1992). Determinants of perceived health status of medical outpatients. Social Science and Medicine, 34(10): pp. 1147-1154 Clarke, PM, U-G Gerdtham, M Johannesson, K Bingefors, L Smith (2002). On the measurement of relative and absolute income-related health inequality. Social Science & Medicine, 55(11): 1923 – 1928 Crossley, TF and S Kennedy (2002). The reliability of self-assessed health status. Journal of Health Economics, 21:643 – 658
CSDH (2008). Closing the gap in a generation: health equity through action on the social determinants of health. Final Report of the Commission on Social Determinants of Health.Geneva, World Health Organization
Erreygers G. Correcting the Concentration Index. J of H Ecs, 2009; 28(2): 504 - 515 (2009) Groot, W (2000). Adaptation and scale of reference bias in self-assessments of quality of life. Journal of health Economics, 19(3): 403 - 420
References
29 Methodological issues in the analysis of the socioeconomic determinants of health using EU-SILC data
Hernández-Quevedo, C, AM Jones, Á López Nicolás, N Rice (2006). ‘Socioeconomic inequalities in health: a comparative longitudinal analysis using the European Community Household Panel’. Social Science and Medicine, 63 (5): 1246 – 1261 Hernández-Quevedo, C, AM Jones, N Rice (2008a). Persistence in health limitations: a European comparative analysis. Journal of Health Economics, 27(6): 1472 – 1488 Hernández-Quevedo, C, AM Jones, N Rice (2008b). Reporting bias and heterogeneity in self-assessed health. Evidence from the British Household Panel Survey. Cuadernos Económicos de ICE, 75: 63 – 97 Hernández-Quevedo, C, C Masseria, EA Mossialos (2010). Analysing the socioeconomic determinants of health in Europe: new evidence from the EU-SILC. Eurostat WP (forthcoming) Hurley, J., Jamal, T., Grignon, M., & Allin, S. (2008). The Relationship between Self-reported Unmet Need for Health Care and Health Care Utilization. Report for the Ontario Ministry of Health and Long Term Care. Hamilton: McMaster University Johnston, DW, C Propper, MA Shields (2007). Comparing subjective and objective measures of health: evidence from hypertension for the income/health gradient. IZA Discussion Paper No. 2737, Institute for the Study of Labour, Bonn Jones, AM and Á López Nicolás (2004). Measurement and explanation of socioeconomic inequality in health with longitudinal data. Health Economics, 13: 1015 – 1030 Kapteyn, A, JP Smith, A van Soest (2004). Self-reported work disability in the US and the Netherlands. RAND Labour and Population Working Paper Kherkofs, M and M Lindeboom (1995). Subjective health measures and state dependent reporting errors. Health Economics 4: 221 - 235 Koolman, X. (2007). Unmet need for health care in Europe. Comparative EU statistics on income and living conditions: issues and challenges. Proceedings of the EU-SILC conference. Helsinki: Eurostat Lindeboom, M and E van Doorslaer (2004). Cut-point shift and index shift in self-reported health. Journal of Health Economics, 23: 1083 - 1099 Mackenbach, J. P. (2006). Health inequalities: Europe in profile. Rotterdam: Erasmus MC

6 References
30 Methodological issues in the analysis of the socioeconomic
determinants of health using EU-SILC data
Mielck, A., Kiess, R., van den Knesebeck, O., Stirbu, I., & Kunst, A. (2007). Association between access to health care and household income among the elderly in 10 western European countries. Tackling health inequalities in Europe: An integrated approach pp. 471-482). Rotterdam: Erasmus MC Department of Public Health Murray, CJL, A Tandon, J Salomon and CD Mathers (2001). Enhancing cross-population comparability of survey results. GPE Discussion Paper No. 35, WHO/EIP, Geneva Sadana, R, CD Mathers, AD Lopez, CJL Murray and K Iburg (2000). Comparative analysis of more than 50 household surveys on health status. GPE Discussion Paper No. 15, EIP/GPE/EBD. World Health Organisation, Geneva Sen, A (2002). Health: perception versus observation. British Medical Journal, 324(7342): 860 – 861 Shorrocks, A. (1978) Income inequality and income mobility, Journal of Economic Theory, 19: 376 – 93 Wagstaff, A (2005). The bounds of the Concentration Index when the variable of interest is binary, with an application to immunization inequality. Health Economics, 14(4): 429 – 432 World Health Organisation (2000). The World Health Report: Health systems: improving performance. Geneva: World Health Organisation. Zimmer, Z, J Natividad, HS Lin and N Chayovan (2000). A cross-national examination of the determinants of self-assessed health. Journal of Health and Social Behaviour, 41(4): 465 – 481
Appendix
31 Methodological issues in the analysis of the socioeconomic determinants of health using EU-SILC data
Appendix
Table A.1: ‘Adjusted’ CIs for 2005, 2006 and 2007
pooled 2005 2006 2007
BE -0.193 -0.165 -0.206 -0.197 CZ -0.162 -0.155 -0.154 -0.176 EE -0.306 -0.272 -0.297 -0.338 ES -0.14 -0.148 -0.133 -0.141 FR -0.119 -0.107 -0.13 -0.117 IT -0.11 -0.106 -0.112 -0.111 CY -0.222 -0.237 -0.224 -0.21 LV -0.238 -0.182 -0.233 -0.294 LT -0.2 -0.191 -0.189 -0.216 LU -0.098 -0.09 -0.099 -0.107 HU -0.138 -0.134 -0.146 -0.132 NL -0.158 -0.155 -0.157 -0.162 AT -0.136 -0.116 -0.138 -0.148 PL -0.045 -0.036 -0.039 -0.058 PT -0.199 -0.206 -0.182 -0.212 SI -0.207 -0.237 -0.199 -0.189 SK -0.133 -0.12 -0.118 -0.16 FI -0.177 -0.17 -0.163 -0.197 SE -0.118 -0.145 -0.113 -0.102 UK -0.166 -0.171 -0.164 -0.162
Source: See Figure 1
6 Appendix
32 Methodological issues in the analysis of the socioeconomic
determinants of health using EU-SILC data
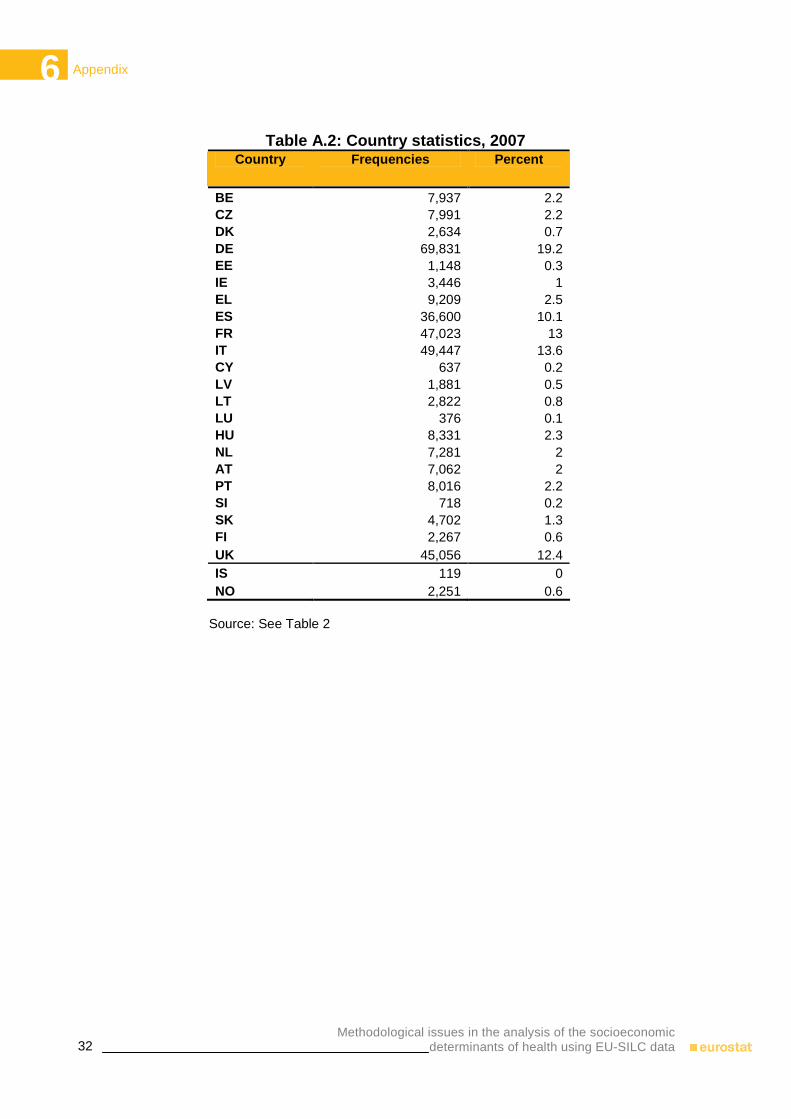
Table A.2: Country statistics, 2007 Country Frequencies Percent
BE 7,937 2.2 CZ 7,991 2.2 DK 2,634 0.7 DE 69,831 19.2 EE 1,148 0.3 IE 3,446 1 EL 9,209 2.5 ES 36,600 10.1 FR 47,023 13 IT 49,447 13.6 CY 637 0.2 LV 1,881 0.5 LT 2,822 0.8 LU 376 0.1 HU 8,331 2.3 NL 7,281 2 AT 7,062 2 PT 8,016 2.2 SI 718 0.2 SK 4,702 1.3 FI 2,267 0.6 UK 45,056 12.4 IS 119 0 NO 2,251 0.6
Source: See Table 2
Appendix
33 Methodological issues in the analysis of the socioeconomic determinants of health using EU-SILC data
Table A.3: Variables’ statistics, total sample 362,977 obs., 2007 Variable Mean Standard dev
Age <35 0.285 0.452 Age 35-44 0.188 0.39 Age 45-59 0.251 0.434 Age 60-74 0.187 0.39 Age >75 0.089 0.284 Male 0.481 0.5 Sah very good 0.215 0.411 Sah good 0.448 0.497 Sah fair 0.236 0.425 Sah bad 0.082 0.274 Sah very bad 0.019 0.136 Limited_h 0.244 0.429 Chronic 0.305 0.461 Primary ed 0.34 0.474 Secondary ed 0.417 0.493 Higher ed 0.234 0.424 Unemployed 0.053 0.224 Student or military 0.078 0.268 Retired 0.221 0.415 Disable 0.031 0.172 Housewive 0.07 0.256 Inactive 0.024 0.153 Self employ 0.116 0.321 Emp partime 0.078 0.268 Emp fulltime 0.371 0.483 Endsmeet dif 0.212 0.408 Endsmeet_2 0.286 0.452 Endsmeet_3 0.296 0.456 Endsmeet easy 0.206 0.405 Unmet need M 0.03 0.169 Unmet_costM 0.019 0.137 Unmet_availableM 0.01 0.101 Unmet need D 0.044 0.204 Unmet_costd 0.036 0.186 Unmet_availableD 0.008 0.087
Source: See Table 2

Appendix
34 Methodological issues in the analysis of the socioeconomic determinants of health using EU-SILC data
Table A.4: Probit model (marginal effects) and Multinomial logit model (odds ratios) results for both medical and dental unmet need, 2007
Medical care Dental care
Probit model Multinomail logit model Probit model Multinomail logit model
unmet need marg.eff S.E. Costs
OR S.E. Available OR S.E. unmet need
Marg. eff S.E. Costs OR S.E. Available
OR S.E.
ln_inc 0 0 0.984* 0.01 1.118* 0.07 0 0 0.997 0.01 0.983 0.02 age 35-44 0 0 0.946 0.07 1.039 0.1 0.005** 0 1.273** 0.07 0.92 0.1 age 45-59 -0.003 0 0.800** 0.06 0.826** 0.07 0.008** 0 1.435** 0.07 0.792** 0.08 age 60-74 -0.004** 0 0.751** 0.07 0.706** 0.08 0.005** 0 1.257** 0.08 0.966 0.12 age >75 -0.008** 0 0.396** 0.04 0.654** 0.08 -0.005** 0 0.750** 0.06 1.19 0.19 male -0.002** 0 0.852** 0.04 0.829** 0.04 -0.002 0 0.918** 0.03 1.09 0.07 sah good 0.009** 0 1.646** 0.17 2.504** 0.29 sah fair 0.025** 0 3.272** 0.36 4.409** 0.58 sah bad 0.043** 0 4.199** 0.54 5.927** 0.91 chronic 0.062** 0.01 5.304** 0.74 7.487** 1.28 limited_h 0.004** 0 1.156** 0.08 1.400** 0.11 primary ed 0.004** 0 1.252** 0.09 1.403** 0.11 secondary ed -0.002** 0 1.077 0.07 0.703** 0.05 0.001 0 1.096* 0.05 0.840** 0.07 unemployed -0.002** 0 1.037 0.07 0.764** 0.05 -0.001 0 0.996 0.05 1.005 0.08 stud_mil 0.008** 0 1.683** 0.12 0.720** 0.11 0.022** 0 1.720** 0.09 0.98 0.15 retired -0.003** 0 0.767** 0.09 0.774* 0.11 -0.013** 0 0.571** 0.05 0.656** 0.11 disable -0.004** 0 0.737** 0.06 0.832* 0.08 0 0 1.042 0.06 0.826 0.1 housewife -0.004** 0 0.851* 0.08 0.727** 0.08 0.010** 0 1.267** 0.08 1.850** 0.25 inactive -0.001 0 1.091 0.09 0.83 0.1 0.002 0 1.101* 0.06 1.067 0.16 self_empl 0.002 0 1.285** 0.14 0.935 0.14 0.005** 0 1.199** 0.1 1.206 0.22 emp_part 0.002** 0 1.198** 0.07 1.026 0.08 0 0 1.019 0.05 0.928 0.09 endsmeet_dif 0.002* 0 1.376** 0.13 0.963** 0.11 0.003 0 1.162** 0.08 1.036 0.13 endsmeet_2 0.033** 0 11.638** 1.89 1.829** 0.22 0.094** 0 14.541** 1.67 1.645** 0.21 endsmeet_3 0.011** 0 4.353** 0.7 1.419** 0.15 0.041** 0 6.199** 0.7 1.450** 0.16 efford_holiday 0.005** 0 2.030** 0.33 1.273 0.13 0.016** 0 2.471** 0.29 1.332** 0.15

Appendix
35 Methodological issues in the analysis of the socioeconomic determinants of health using EU-SILC data
Medical care Dental care
Probit model Multinomail logit model Probit model Multinomail logit model
unmet need marg.eff S.E. Costs
OR S.E. Available OR S.E. unmet need
Marg. eff S.E. Costs OR S.E. Available
OR S.E.
BE -0.009** 0 0.377** 0.03 0.929 0.07 -0.028** 0 0.393** 0.02 0.687** 0.05 CZ 0.015** 0 3.274** 0.51 0.266** 0.1 0.002 0 1.173** 0.1 0.509** 0.14 DK 0.030** 0 6.536** 0.97 1.862** 0.29 0.021** 0 2.300** 0.18 0.887 0.16 DE -0.006** 0 0.149** 0.04 1.526** 0.27 -0.026** 0 0.085** 0.01 0.547** 0.1 EE -0.006** 0 0.818 0.31 0.061** 0.04 0.029** 0.01 2.751** 0.4 0.743 0.36 IE 0.001 0 1.159 0.18 1.454** 0.27 -0.011** 0 0.698 0.05 0.472** 0.1 EL 0.004** 0 1.876** 0.31 0.500** 0.13 0.001 0 1.187** 0.1 0.574** 0.14 ES 0.075** 0.01 1.831** 0.32 17.581** 2.96 0.067** 0.01 4.192** 0.32 1.721** 0.3 FR -0.003 0 0.737 0.22 0.624 0.19 -0.008** 0 0.604** 0.09 1.199 0.27 IT 0.024** 0.01 2.806** 0.92 2.886** 0.56 -0.009** 0 0.632** 0.12 1.106 0.32 CY -0.009** 0 0.412** 0.1 0.107** 0.05 -0.019** 0 0.447** 0.05 0.087** 0.05 LV -0.001 0 0.912 0.32 0.691 0.24 -0.016** 0 0.447** 0.1 0.435** 0.17 LT 0.021** 0 2.998** 0.43 3.300** 0.47 0.007** 0 1.244** 0.08 1.459** 0.2 LU 0.038** 0 1.532** 0.26 11.062** 1.96 0.015** 0 1.165* 0.1 4.402** 0.67 HU 0.034** 0 4.464** 0.68 2.527** 0.48 -0.007** 0 0.819** 0.07 0.597** 0.13 NL -0.006** 0 0.344** 0.17 0.722 0.23 -0.012** 0 0.542** 0.09 0.688 0.25 PL 0.032** 0 2.839** 0.41 7.553** 1.24 0.005** 0 1.039 0.07 2.326** 0.31 PT 0.051** 0.01 7.039** 1.04 1.124 0.26 -0.012** 0 0.447** 0.04 2.493** 0.4 SI -0.011** 0 0.160** 0.08 0.200** 0.1 -0.027** 0 0.026** 0.01 0.136** 0.06 SK -0.004** 0 0.701** 0.12 1.183 0.24 -0.020** 0 0.342** 0.03 0.430** 0.1 FI -0.014** 0 0.006** 0 0.297** 0.1 -0.010** 0 0.746** 0.06 0.193** 0.05 SE 0.049** 0.01 1.795** 0.41 7.971** 1.26 0.060** 0.01 4.538** 0.41 0.864 0.22 UK 0.010** 0 0.091** 0.05 3.726** 0.56 0.009** 0 0.210** 0.03 6.456** 0.8 Pseudo R2 0.177 0.199 0.124 0.154 Log pseudolikelihood -39632 -44071 -56759 -61047
Source: See Table 2 NB: Numbers with 2 asterisks ** are significant with a 95% confidence interval, while those with just one asterisk * are significant with a 90% confidence interval

European Commission Methodological issues in the analysis of the socioeconomic determinants of health using EU-SILC data Luxembourg: Publications Office of the European Union 2010 — 35 pp. — 21 x 29.7 cm ISBN 978-92-79-16753-9 ISSN 1977-0375 Doi:10.2785/55316 Cat. No KS-RA-10-017-EN-N Theme: Population and social conditions Collection: Methodologies and working papers

terza_copertina.indd 3 24-05-2007 17:58:14
How to obtain EU publicationsFree publications:
• viaEUBookshop(http://bookshop.europa.eu);
• attheEuropeanUnion’srepresentationsordelegations.YoucanobtaintheircontactdetailsontheInternet(http://ec.europa.eu)orbysendingafax to +352 2929-42758.
Priced publications:
• viaEUBookshop(http://bookshop.europa.eu).
Priced subscriptions (e.g. annual series of the Official Journal of the European Union and reports of cases before the Court of Justice of the European Union):
• viaoneofthesalesagentsofthePublicationsOfficeoftheEuropeanUnion (http://publications.europa.eu/others/agents/index_en.htm).

2008 edition
KS-RA-10-017-EN
-N
M e t h o d o l o g i e s a n d W o r k i n g p a p e r s
Domestic tourism manual
ISSN 1977-0375