method of controlling a chemically- induced nuclear...
TRANSCRIPT

1
PREPRINT Mizuno, T. Method of controlling a chemically-induced nuclear reaction in metal
nanoparticles. in ICCF18 Conference. July 2013. University of Missouri. Addendum with new data,
November 2013.
Method of controlling a chemically-induced nuclear reaction in metalnanoparticles
Tadahiko MizunoHydrogen Engineering Application & Development Company
Three System Building 6 floor,Kita-ku, North 12, West-4, 1-15, Sapporo 001-0012
AbstractA nuclear reaction can occur when metal nanoparticles are exposed to hydrogen isotopes in
the gas phase. When hydrogen isotopes (light hydrogen and deuterium) enter the nanoparticles
and are exposed to electron irradiation, the hydrogen reacts inside the lattice, producing energy.
The reaction also produces neutrons, gamma rays and transmutations. Normally, electron
irradiation does not produce anomalous heat or radiation. A reaction occurs when hydrogen acts
as a heavy fermion (a heavy electron) inside metal nanoparticles below a certain particle size,
allowing protons or deuterons to approach one another closely.
Usually, with deuterium, to cause a fusion reaction it is necessary to supply energy of 107 K,
or 1 keV per atom. With light hydrogen it is necessary to supply 1.5 × 10⁷ K, for a reaction rate
of 10-31. With a reactor system on a scale smaller than the sun, a significant fusion reaction does
not occur. However, when heavy electrons enter the outer shell of a proton, the radius of the
hydrogen atom becomes exponentially smaller with respect to the weight of the heavy electrons,
bringing the protons closer together. When this happens, the probability of tunneling fusion
increases exponentially.
The nuclear reaction can be controlled with this energy production method of bringing
protons and heavy electrons together inside nanoparticles. This brings within reach the goal of
developing a practical nanoparticle energy reactor.
1 Theory
1.1 Summary
A population of free electrons in 10 nm metal nanoparticles are subjected to strong forces by the
metal atoms and by other electrons. This occurs when:
1. Hydrogen isotopes are injected into nanoparticles.

2
2. This causes the hydrogen density to rise, changing the nature of the nanoparticles, which
increases the effective mass of electrons to a high level.
3. Heavy electrons combine with hydrogen nuclei to form atoms.
4. When heavy electrons become extranuclear electrons the electron orbital radius shrinks.
5. The distance between the nucleus and the heavy electron shrinks.
6. The probability of nuclear fusion between hydrogen atoms increases because of the
tunneling effect.
7. When the mass of electrons doubles, the probability of fusion increases by 10 orders of
magnitude.
8. The reaction causes heat.
9. The reaction may cause neutrons, helium and other reaction products.
10. Other elements that easily generate heavy electrons increase the fusion probability between
heavy electrons and hydrogen nuclei include: alkali and alkaline-earth elements (such as Li,
Na, K, Ca, and so on which have atomic structures similar to hydrogen). These elements
enhance the electron transfer effect.
1.2 Calculating the tunneling effect
When a proton actually approaches x=δ(that is, the distance at which separate protons touch)
then the electrostatic potential that repels protons from one another is overwhelmed by an attractive
potential 5 orders of magnitude stronger. Therefore, the area x≧δprobability density function
becomes ψ2=2β・e-2βx where fusion is likely to occur.
Where γ is the probability of nuclear fusion:
γ = ∫δ∞ ψ2dx = ∫δ
∞ 2β・e-2βxdx = -[e-2βx]δ∞ =e-2βδ
∴ the probability of fusion γ = e-2βδ(where β=(2π/h)・{2m(U-E)}1/2)
This is the probability of fusion between protons. Theoretically, it should allow the tunneling
effect.
Here:
U: The electrostatic potential between two protons=1.15×10⁻¹³J
E: The kinetic energy of a direct collision of protons, computed here for the center of the sun.
That is, 15 million K = 4×(3/2)kT=1.24×10-15J
Here, h: Planck’s constant = 6.625×10⁻³⁴J・s
M: mass of a proton = 1.7×10⁻²⁷kg
δ: the necessary penetration distance of the proton = 1.86×10⁻¹³m
β=(2π/h)・{2m(U-E)}1/2=1.87×1014

3
The resulting probability of fusion is:
γ=e-2βδ=6.14×10⁻³¹
From the above, the probability that γ fusion will occur is obtained. The probability is very low,
with fusion occurring once in every 1031 head-on collisions. There is an observable fusion reaction
in the sun because there are so many collisions.
Figure 1. Tunneling fusion effect dependence on proton temperature.
Here is the calculation when the reaction occurs with heavy electrons. For example, with
palladium nanoparticles, the effective mass of heavy electrons is increased by a factor of 2, and the
tunneling effect rate increases by 10 orders of magnitude.
Figure 2. Fusion probability dependence on proton separation potential.
Here is an actual example of glow discharge with current density of 1 ~ 100 mA/cm2. Every
second, 6.24 × 10¹⁸ hydrogen atoms are supplied to the metal surface. The total number of hydrogen
atoms accumulating in the metal is equal to the average number of metal atoms in the nanoparticles.
When the glow discharge continues long enough, nanoparticles form over the entire surface of the
palladium.
1E+6 1E+7 1E+8 1E+9 1E+10
Temperature/K
1E-36
1E-30
1E-24
1E-18
1E-12
1E-6
1E+0
Rea
ctio
np
rob
abil
ity
offu
ison
1E-19 1E-18 1E-17 1E-16 1E-15 1E-14 1E-13 1E-12
Coulomb potential/Joule
1E-32
1E-28
1E-24
1E-20
1E-16
1E-12
1E-8
1E-4
1E+0
Rea
ctio
np
rob
abil
ity
for
fusi
on

4
Here is the calculation of the size of the effect assuming the entire surface of the metal has been
converted to nanoparticles. The nanolayers are approximately 10 atoms thick, so there are
approximately 1017 hydrogen atoms per centimeter of metal nanoparticles. Glow discharge
electrolysis supplies the hydrogen atoms at a constant rate. The probability of the reaction is 1017 ×
10-20 = 10-2/s/cm2. This translates to about 100 W of heat.
Normally, it is very difficult to sustain a stable nuclear reaction with hydrogen atoms. However,
with this method it is not difficult, even though this method uses cheap, abundant materials.
Here is the calculation for hydrogen atoms. Heavy electrons enter the atomic orbitals of the
hydrogen. The distance is determined by the electron mass of the nanoparticles. The heavy electrons
cause the following reaction:
(p e-h) + H → (pp e-
h) + e-∗
→ 2D + β+ + e-h + νe + 0.164 MeV
The reaction produces a deuteron, a positron and a meson. The heavy electron then returns to
the nanoparticle lattice. If electrons are present it is possible the positron will produce a gamma ray.
However, the probability of this is low.
β++e- → 2γ + 1.022MeV
3He can be produced, when the reaction forms a deuteron and a new heavy electron. A gamma
ray is produced when this happens. The heavy electron returns to the nanoparticle.
2D + (p e-h) → 3He + γ + e-
h + 5.493 MeV
It is possible for the newly formed 3He, a heavy electron and a proton to undergo this reaction:
(p e-h) + 3He → 4He + 2p + e-
h + 12.860 MeV
When all of these reactions occur in series, the total amount of energy produces is 26.218 MeV.
(p e-h) + 3H2 → 4He + e-
h + 26.218 MeV
With deuterium, a deuteron with a heavy electron forms, just as a proton pairs with a heavy
electron starting with hydrogen.
(d e-h) + (D2) → [(dd e-
h) + dee]∗
The reaction continues, producing fusion, which produces tritium, protons, 3He and neutrons. All of
these reactions together produce 3.27 ~ 4.03 MeV of heat.
[(dd e-h) + dee]∗ → T + p + e-
h + 4.03MeV
→ 3He + n + e-h +3.27MeV
When Li is introduced into the nanoparticle environment, tritium and helium are produced by
the following steps:
5
6Li + 1n → 4He + 3H
7Li + 1n → 4He + 3H + 1n
Since 92.5% of Li is 7Li, neutrons produce 4He and 3H. This nuclear fusion reaction has been
experimentally confirmed.
2 Method of Control
2.1 Gas
The reaction gases are hydrogen or deuterium. The gas purity is 99.99% for hydrogen (H2), and
99.9% for deuterium (for D, or for D2, 99.8%, HD, 0.2%).
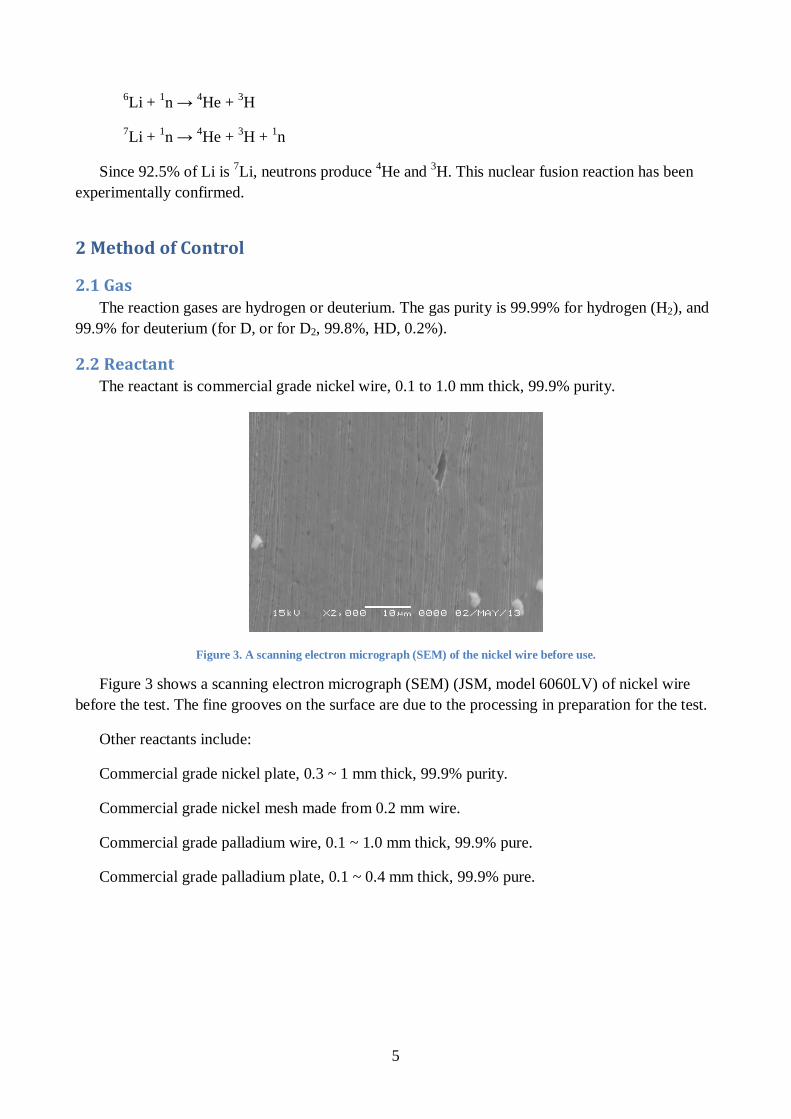
2.2 ReactantThe reactant is commercial grade nickel wire, 0.1 to 1.0 mm thick, 99.9% purity.
Figure 3. A scanning electron micrograph (SEM) of the nickel wire before use.
Figure 3 shows a scanning electron micrograph (SEM) (JSM, model 6060LV) of nickel wire
before the test. The fine grooves on the surface are due to the processing in preparation for the test.
Other reactants include:
Commercial grade nickel plate, 0.3 ~ 1 mm thick, 99.9% purity.
Commercial grade nickel mesh made from 0.2 mm wire.
Commercial grade palladium wire, 0.1 ~ 1.0 mm thick, 99.9% pure.
Commercial grade palladium plate, 0.1 ~ 0.4 mm thick, 99.9% pure.
6
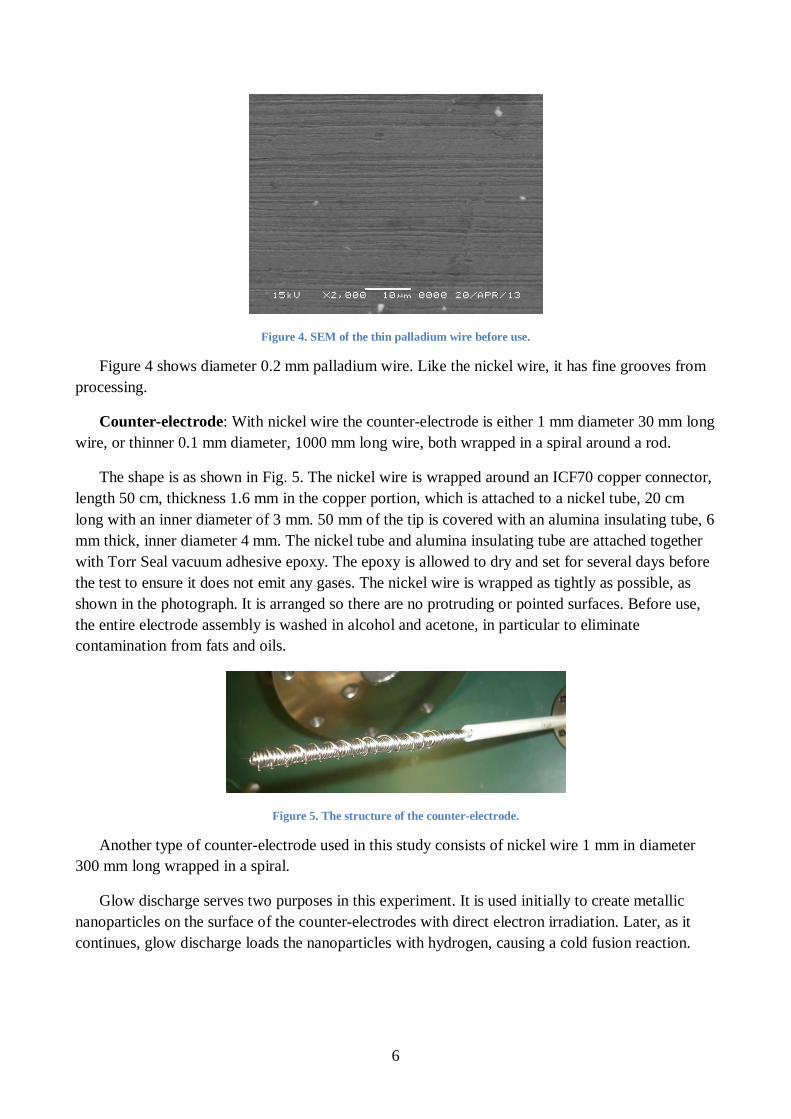
Figure 4. SEM of the thin palladium wire before use.
Figure 4 shows diameter 0.2 mm palladium wire. Like the nickel wire, it has fine grooves from
processing.
Counter-electrode: With nickel wire the counter-electrode is either 1 mm diameter 30 mm long
wire, or thinner 0.1 mm diameter, 1000 mm long wire, both wrapped in a spiral around a rod.
The shape is as shown in Fig. 5. The nickel wire is wrapped around an ICF70 copper connector,
length 50 cm, thickness 1.6 mm in the copper portion, which is attached to a nickel tube, 20 cm
long with an inner diameter of 3 mm. 50 mm of the tip is covered with an alumina insulating tube, 6
mm thick, inner diameter 4 mm. The nickel tube and alumina insulating tube are attached together
with Torr Seal vacuum adhesive epoxy. The epoxy is allowed to dry and set for several days before
the test to ensure it does not emit any gases. The nickel wire is wrapped as tightly as possible, as
shown in the photograph. It is arranged so there are no protruding or pointed surfaces. Before use,
the entire electrode assembly is washed in alcohol and acetone, in particular to eliminate
contamination from fats and oils.
Figure 5. The structure of the counter-electrode.
Another type of counter-electrode used in this study consists of nickel wire 1 mm in diameter
300 mm long wrapped in a spiral.
Glow discharge serves two purposes in this experiment. It is used initially to create metallic
nanoparticles on the surface of the counter-electrodes with direct electron irradiation. Later, as it
continues, glow discharge loads the nanoparticles with hydrogen, causing a cold fusion reaction.

7
2.3 ShapeThe smaller the nanoparticles in a sample are, the more effectively they absorb hydrogen, and
the faster the reaction will occur. The effect works best with a particle size of 2 ~ 5 nm, where the
number of atoms per particle is be 103 ~ 104.
Figure 6. Number of particles and mass of heavy electrons in nanoparticles.
As shown in Fig. 6, when nanoparticles absorb large amounts of hydrogen, the particle size and
number of atoms (horizontal axis), and the ratio of nanoparticles and electrons (vertical axis, where
1 is the ratio for electrons in bulk metal), the ratio decreases noticeably when the lattice number
falls below 100, and as it approaches 1 (on the left) it increases by a factor of 10. This is most
noticeable with palladium and titanium. With nickel when the lattice number is below 10 the
effective mass increases about 50%. However, for gold, the effective mass does not increase
because gold does not absorb hydrogen.
2.4 ReactorsTwo reactors were used in this study, a small one and a large one.
A stainless steel reactor vessel is used for both. Grade 316 stainless steel is preferred. The
vessels about as wide as they are tall, being cross-shaped with the gas inlet and window ports.
Electrodes are introduced from the top, and there are a variety of connection terminals at the sides,
including the gas inlet, pressure gauge and vacuum exhaust. The viewing window is made of Kovar
glass. All connections are ICF flanges. The flange sizes are: top and base, 213 ICF; the middle
portion flanges are 152 ICF; the front widow flange is 114 ICF; and the bottom mounting 70 ICF.
The electrode connections are made through a 34 ICF flange. The gas inlet is made of ¼ Swagelok
pipe and a ¼ Swagelok needle valve. The flange connections all use oxygen-free copper gaskets to
prevent vacuum leaks.
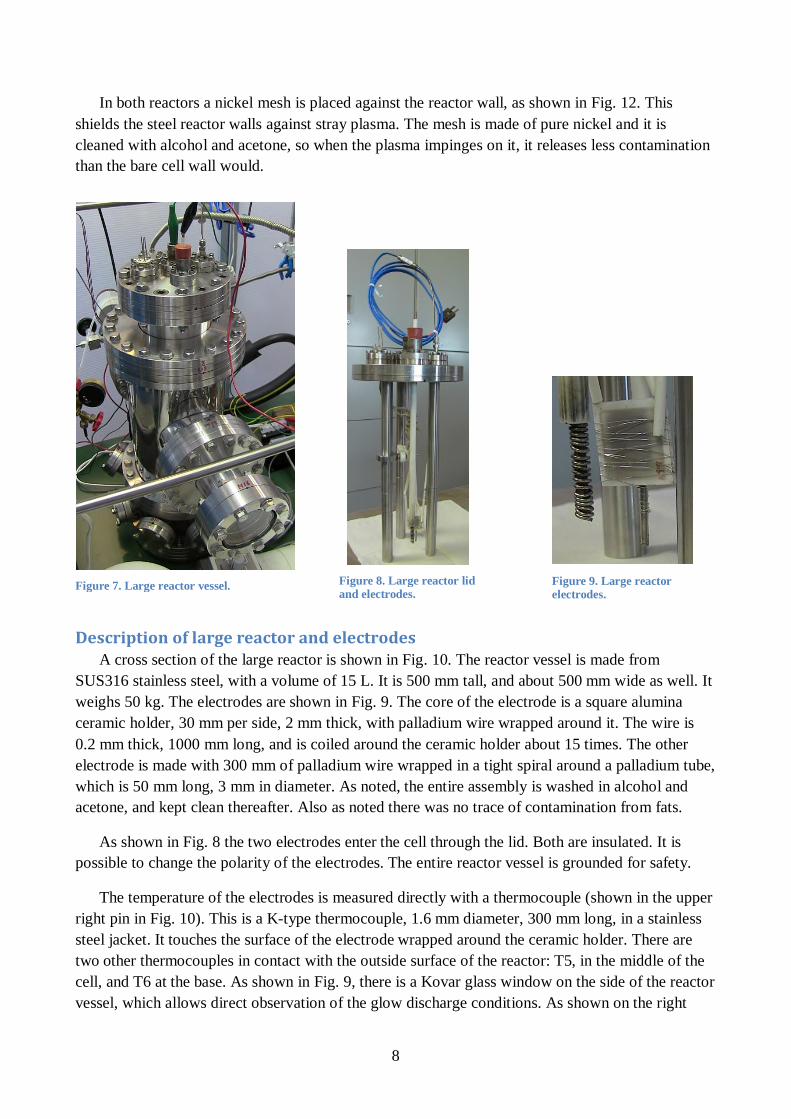
In both reactors a nickel mesh is placed against the reactor wall, as shown in Fig. 12. This
shields the steel reactor walls against stray plasma. The mesh is made of pure nickel and it is
cleaned with alcohol and acetone, so when the plasma impinges on it, it releases less contamination
than the bare cell wall would.
Description of large reactor and eA cross section of the large reactor is
SUS316 stainless steel, with a volume of
weighs 50 kg. The electrodes are shown i
ceramic holder, 30 mm per side, 2 mm thi
0.2 mm thick, 1000 mm long, and is coile
electrode is made with 300 mm of palladi
which is 50 mm long, 3 mm in diameter.
acetone, and kept clean thereafter. Also as
As shown in Fig. 8 the two electrodes
possible to change the polarity of the elec
The temperature of the electrodes is m
right pin in Fig. 10). This is a K-type ther
steel jacket. It touches the surface of the e
two other thermocouples in contact with t
cell, and T6 at the base. As shown in Fig.
vessel, which allows direct observation of
Fa
Fe
.
igure 8. Large reactor lidnd electrodes.8
lectrodesshown in Fig. 10. The reactor ves
15 L. It is 500 mm tall, and about
n Fig. 9. The core of the electrode
ck, with palladium wire wrapped
d around the ceramic holder abou
um wire wrapped in a tight spiral
As noted, the entire assembly is w
noted there was no trace of cont
enter the cell through the lid. Bot
trodes. The entire reactor vessel i
easured directly with a thermoco
mocouple, 1.6 mm diameter, 300
lectrode wrapped around the cera
he outside surface of the reactor:
9, there is a Kovar glass window
the glow discharge conditions. A
igure 9. Large reactorlectrodes.
Figure 7. Large reactor vessel
sel is made from
500 mm wide as well. It
is a square alumina
around it. The wire is
t 15 times. The other
around a palladium tube,
ashed in alcohol and
amination from fats.
h are insulated. It is
s grounded for safety.
uple (shown in the upper
mm long, in a stainless
mic holder. There are
T5, in the middle of the
on the side of the reactor
s shown on the right
9
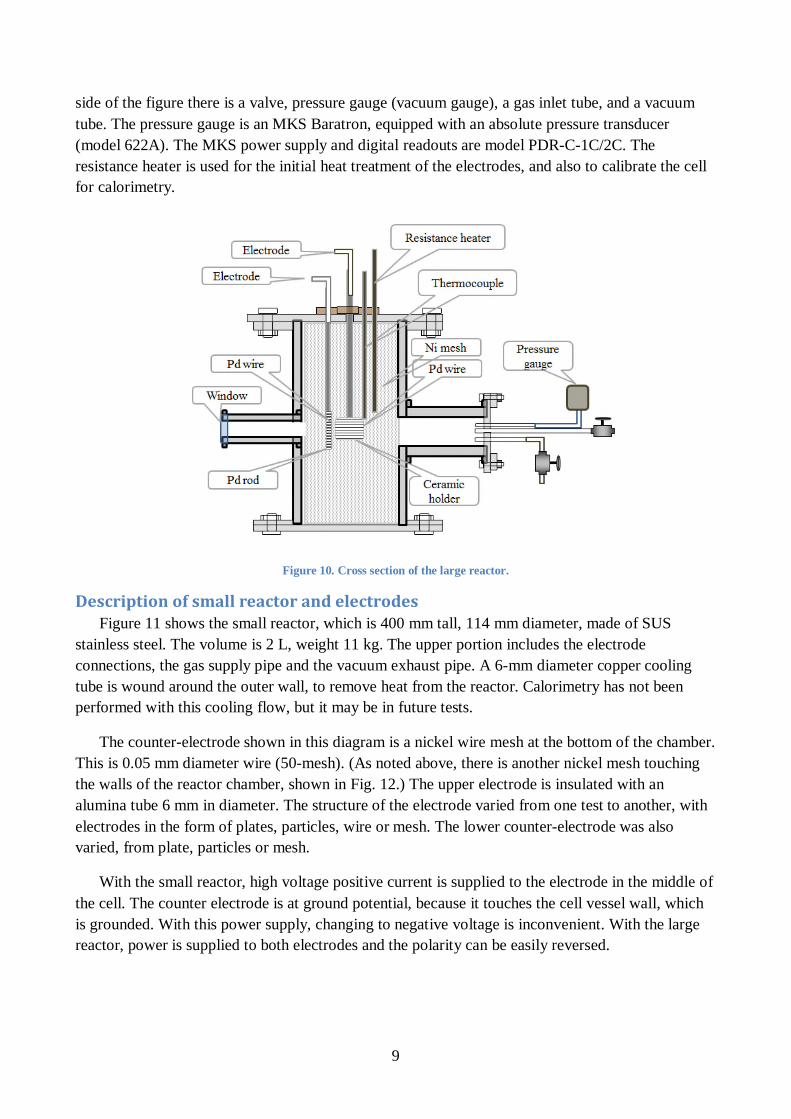
side of the figure there is a valve, pressure gauge (vacuum gauge), a gas inlet tube, and a vacuum
tube. The pressure gauge is an MKS Baratron, equipped with an absolute pressure transducer
(model 622A). The MKS power supply and digital readouts are model PDR-C-1C/2C. The
resistance heater is used for the initial heat treatment of the electrodes, and also to calibrate the cell
for calorimetry.
Figure 10. Cross section of the large reactor.
Description of small reactor and electrodesFigure 11 shows the small reactor, which is 400 mm tall, 114 mm diameter, made of SUS
stainless steel. The volume is 2 L, weight 11 kg. The upper portion includes the electrode
connections, the gas supply pipe and the vacuum exhaust pipe. A 6-mm diameter copper cooling
tube is wound around the outer wall, to remove heat from the reactor. Calorimetry has not been
performed with this cooling flow, but it may be in future tests.
The counter-electrode shown in this diagram is a nickel wire mesh at the bottom of the chamber.
This is 0.05 mm diameter wire (50-mesh). (As noted above, there is another nickel mesh touching
the walls of the reactor chamber, shown in Fig. 12.) The upper electrode is insulated with an
alumina tube 6 mm in diameter. The structure of the electrode varied from one test to another, with
electrodes in the form of plates, particles, wire or mesh. The lower counter-electrode was also
varied, from plate, particles or mesh.
With the small reactor, high voltage positive current is supplied to the electrode in the middle of
the cell. The counter electrode is at ground potential, because it touches the cell vessel wall, which
is grounded. With this power supply, changing to negative voltage is inconvenient. With the large
reactor, power is supplied to both electrodes and the polarity can be easily reversed.
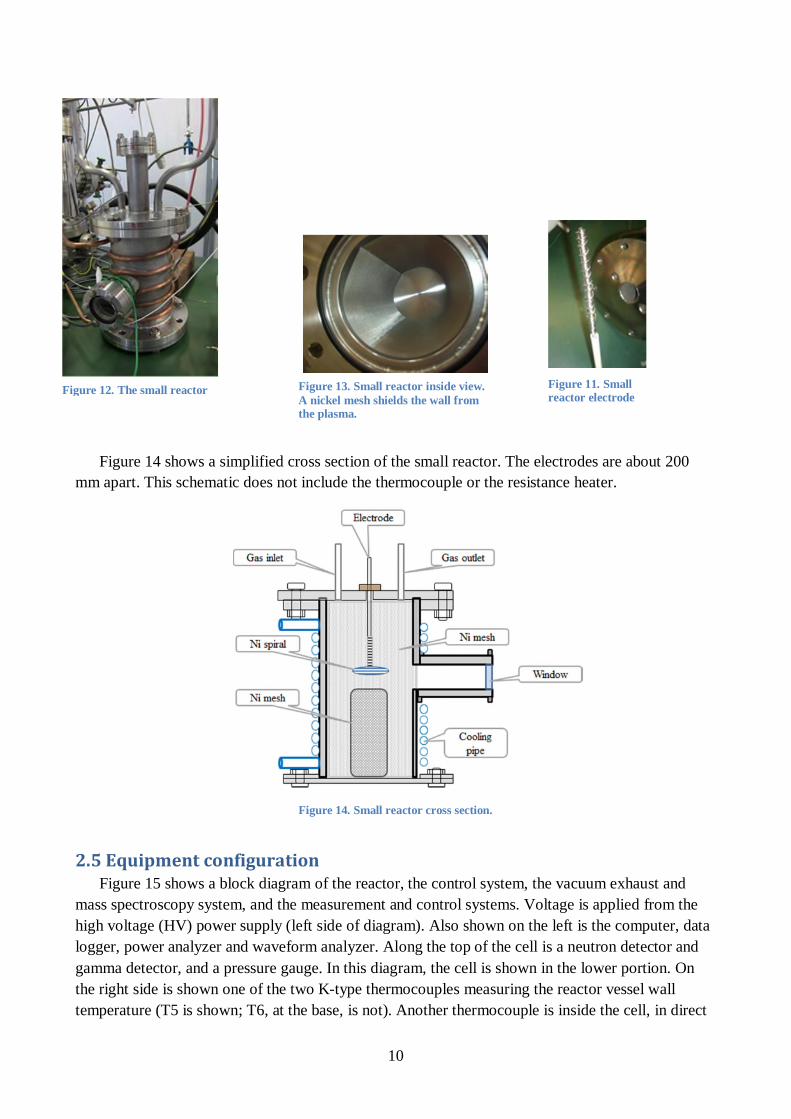
Figure 14 shows a simplified cr
mm apart. This schematic does not
2.5 Equipment configuratioFigure 15 shows a block diagra
mass spectroscopy system, and the
high voltage (HV) power supply (le
logger, power analyzer and wavefo
gamma detector, and a pressure gau
the right side is shown one of the tw
temperature (T5 is shown; T6, at th
F
Figure 13. Small reactor inside view.A nickel mesh shields the wall fromthe plasma.10
oss section of the small reactor. The ele
include the thermocouple or the resista
Figure 14. Small reactor cross section.
nm of the reactor, the control system, the
measurement and control systems. Volt
ft side of diagram). Also shown on the
rm analyzer. Along the top of the cell is
ge. In this diagram, the cell is shown in
o K-type thermocouples measuring the
e base, is not). Another thermocouple is
Figure 11. Smallreactor electrode
igure 12. The small reactor
ctrodes are about 200
nce heater.
vacuum exhaust and
age is applied from the
left is the computer, data
a neutron detector and
the lower portion. On
reactor vessel wall
inside the cell, in direct

11
contact with the electrode surface. The bottom right of the diagram shows the gas supply and
quadrupole mass analyzer used to analyze the gas withdrawn from the cell. Temperature is
measured in 4 locations total (including ambient temperature). Temperature, voltage, power,
pressure, the neutron and gamma count, and the gas analysis is collected by the logger and recorded
in the computer every few seconds.
Figure 15. Equipment configuration.
3 Method of controlling heatThe method of controlling the anomalous heat is described for the large reactor. The electrodes
are as shown in Fig. 9.
3.1 VacuumThe reactor vessel is evacuated down to several Pascals.
3.2 Glow discharge to form nanoparticlesAfter evacuating the reactor, the gas level is held at several Pascals, and electrons from the
central electrode are used to bombard the counter-electrode in the big reactor, or the reactant
material placed against the bottom of the small reactor. This activation treatment step exposes the
metal, cleaning off impurities and oxides. As shown in Fig. 15, voltage and current are applied to
the electrodes. At first the 0.1 mm thin wire palladium mesh is made the positive electrode at 600 V,
and glow discharge at 20 mA is continued for 600 s. Then the mesh is switched to negative terminal,
and glow discharge continues for 1200 s, again at 600 V and 20 mA.
This glow discharge cycle is repeated for about 15 hours with the thin 0.1 mm diameter wire, or
for 30 hours with the 1 mm wire. Glow discharge continues until many nanoparticles form on the
surface, and the surface is activated.

12
3.3 Heat treatmentThe vessel is then evacuated to a lower pressure while the electrodes are hot, to remove
additional impurities. The electrodes are then activated by being heated with the resistance heater,
to temperatures between 100°C and 200°C for about 3 hours. This continues until light hydrogen,
H2O, and gaseous hydrocarbons are driven out of the electrodes and are no longer detected by the
mass spectrometer in significant levels.
Figure 16. Electrode heating power input.
Figure 17. Temperature changes in the electrodes during heating.
3.4 Glow discharge heatingGlow discharge is then performed to produce nanoparticles on the electrode surface. The thin
wire palladium electrode is the positive terminal. Direct current glow discharge is maintained at

13
about 20 ~ 30 mA and 600 to 800 V for about 10 ks (10 kiloseconds; ~27 hours). After this, D2 gas
is admitted into the cell, and it absorbs into the electrode surface. Figure 18 shows the resulting
temperature changes. This figure shows the difference between the electrode temperature and
ambient temperature. Figure 19 shows a SEM photo of the palladium wire electrode surface after
this treatment, and Fig. 20 shows a nickel wire. Fine metal particles (nanoparticles) are formed on
the metal surface. The magnification here is 2000 times, which is enough to reveal nanoparticles of
less than 1 micrometer. When the SEM magnification is increased, even smaller particles can be
seen. Particles on the nanometer scale are ideal.
This method produces nanoparticles in situ after cleaning and purifying the electrode material,
in a high-purity gas environment. So the nanoparticles have little contamination on the surface and
they are highly absorbent. With other methods, the nanoparticle material is fabricated elsewhere and
exposed to air and contamination before being placed in the cell.
Figure 18. Heat treatment with glow discharge.
Figure 19. SEM photo of palladium thin wire after treatment.
14
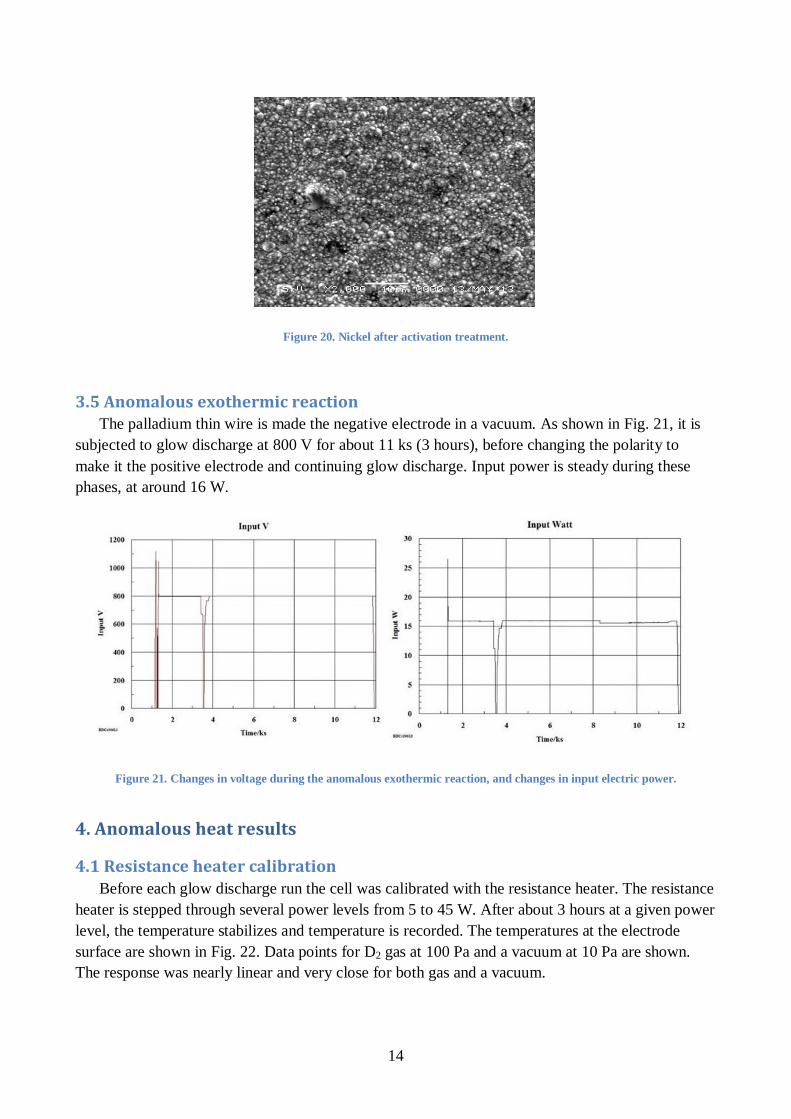
Figure 20. Nickel after activation treatment.
3.5 Anomalous exothermic reactionThe palladium thin wire is made the negative electrode in a vacuum. As shown in Fig. 21, it is
subjected to glow discharge at 800 V for about 11 ks (3 hours), before changing the polarity to
make it the positive electrode and continuing glow discharge. Input power is steady during these
phases, at around 16 W.
Figure 21. Changes in voltage during the anomalous exothermic reaction, and changes in input electric power.
4. Anomalous heat results
4.1 Resistance heater calibration
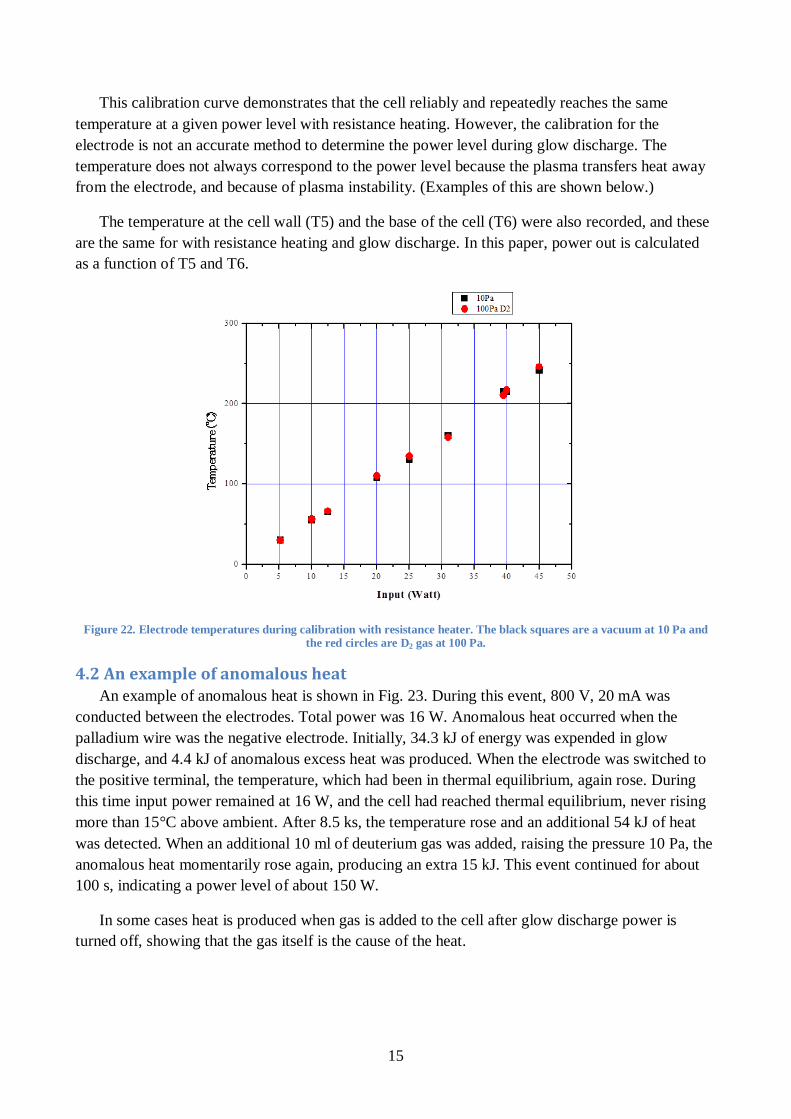
Before each glow discharge run the cell was calibrated with the resistance heater. The resistance
heater is stepped through several power levels from 5 to 45 W. After about 3 hours at a given power
level, the temperature stabilizes and temperature is recorded. The temperatures at the electrode
surface are shown in Fig. 22. Data points for D2 gas at 100 Pa and a vacuum at 10 Pa are shown.
The response was nearly linear and very close for both gas and a vacuum.
15
This calibration curve demonstrates that the cell reliably and repeatedly reaches the same
temperature at a given power level with resistance heating. However, the calibration for the
electrode is not an accurate method to determine the power level during glow discharge. The
temperature does not always correspond to the power level because the plasma transfers heat away
from the electrode, and because of plasma instability. (Examples of this are shown below.)
The temperature at the cell wall (T5) and the base of the cell (T6) were also recorded, and these
are the same for with resistance heating and glow discharge. In this paper, power out is calculated
as a function of T5 and T6.
Figure 22. Electrode temperatures during calibration with resistance heater. The black squares are a vacuum at 10 Pa andthe red circles are D2 gas at 100 Pa.
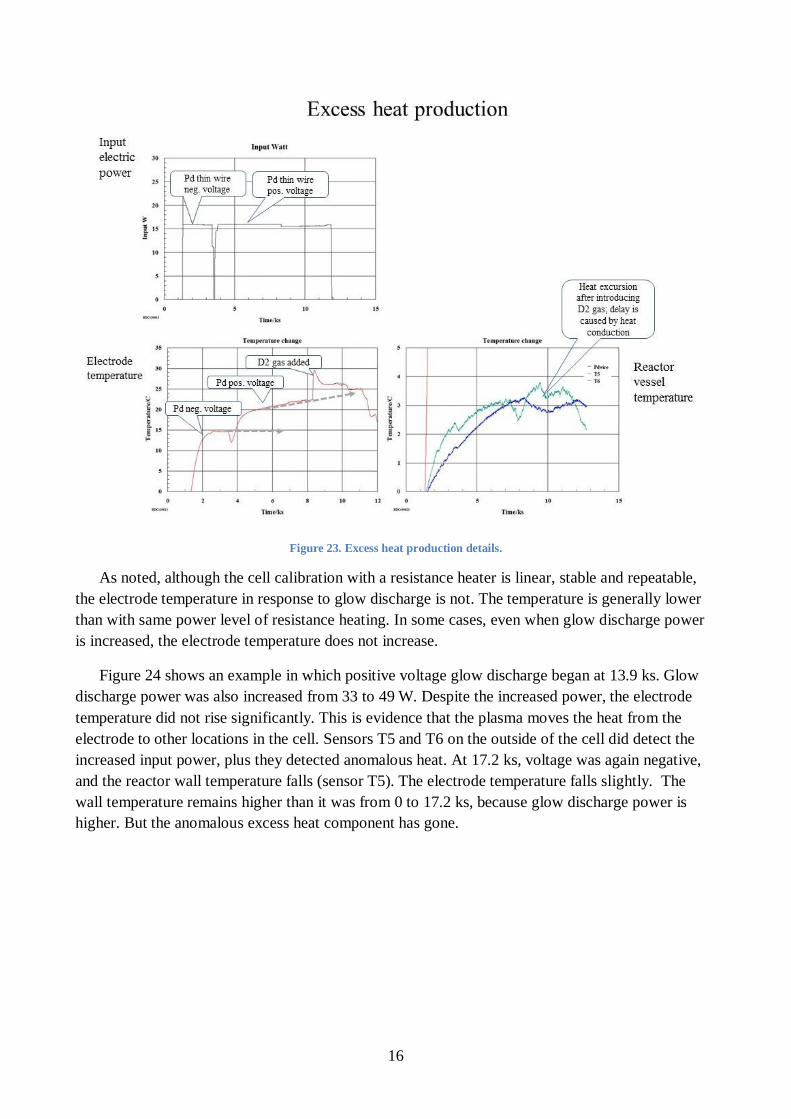
4.2 An example of anomalous heatAn example of anomalous heat is shown in Fig. 23. During this event, 800 V, 20 mA was
conducted between the electrodes. Total power was 16 W. Anomalous heat occurred when the
palladium wire was the negative electrode. Initially, 34.3 kJ of energy was expended in glow
discharge, and 4.4 kJ of anomalous excess heat was produced. When the electrode was switched to
the positive terminal, the temperature, which had been in thermal equilibrium, again rose. During
this time input power remained at 16 W, and the cell had reached thermal equilibrium, never rising
more than 15°C above ambient. After 8.5 ks, the temperature rose and an additional 54 kJ of heat
was detected. When an additional 10 ml of deuterium gas was added, raising the pressure 10 Pa, the
anomalous heat momentarily rose again, producing an extra 15 kJ. This event continued for about
100 s, indicating a power level of about 150 W.
In some cases heat is produced when gas is added to the cell after glow discharge power is
turned off, showing that the gas itself is the cause of the heat.
16
Figure 23. Excess heat production details.
As noted, although the cell calibration with a resistance heater is linear, stable and repeatable,
the electrode temperature in response to glow discharge is not. The temperature is generally lower
than with same power level of resistance heating. In some cases, even when glow discharge power
is increased, the electrode temperature does not increase.
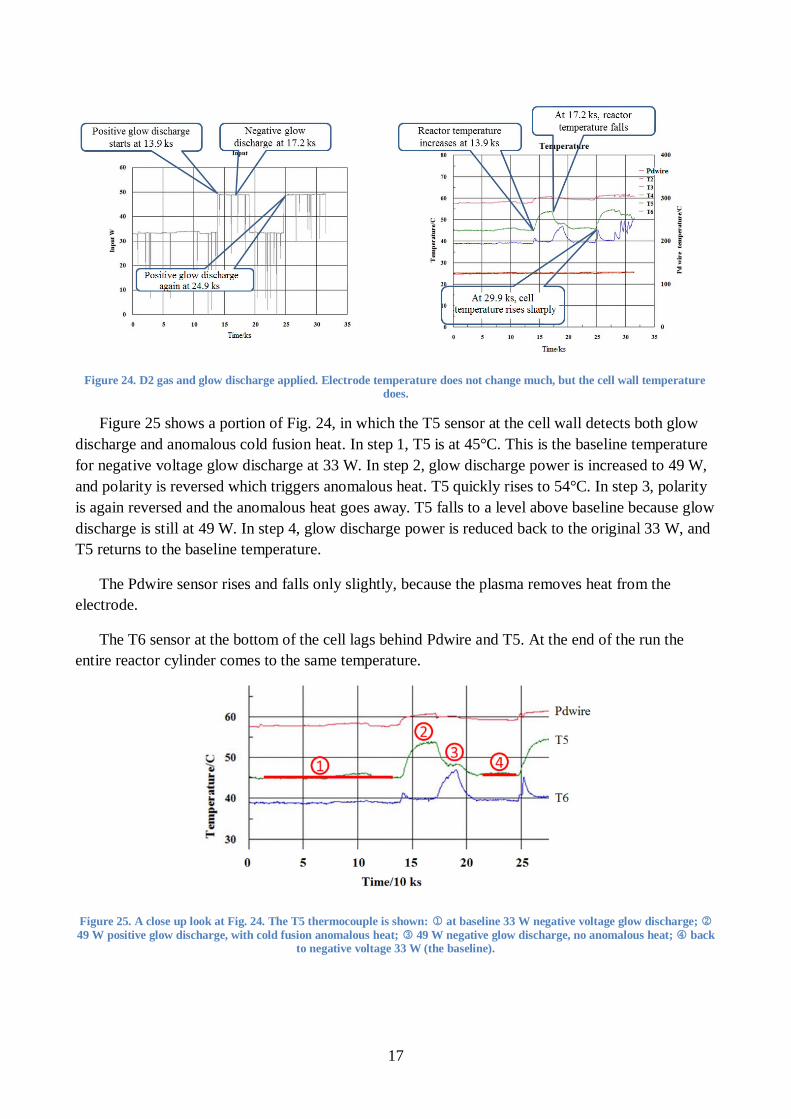
Figure 24 shows an example in which positive voltage glow discharge began at 13.9 ks. Glow
discharge power was also increased from 33 to 49 W. Despite the increased power, the electrode
temperature did not rise significantly. This is evidence that the plasma moves the heat from the
electrode to other locations in the cell. Sensors T5 and T6 on the outside of the cell did detect the
increased input power, plus they detected anomalous heat. At 17.2 ks, voltage was again negative,
and the reactor wall temperature falls (sensor T5). The electrode temperature falls slightly. The
wall temperature remains higher than it was from 0 to 17.2 ks, because glow discharge power is
higher. But the anomalous excess heat component has gone.
17
Figure 24. D2 gas and glow discharge applied. Electrode temperature does not change much, but the cell wall temperaturedoes.
Figure 25 shows a portion of Fig. 24, in which the T5 sensor at the cell wall detects both glow
discharge and anomalous cold fusion heat. In step 1, T5 is at 45°C. This is the baseline temperature
for negative voltage glow discharge at 33 W. In step 2, glow discharge power is increased to 49 W,
and polarity is reversed which triggers anomalous heat. T5 quickly rises to 54°C. In step 3, polarity
is again reversed and the anomalous heat goes away. T5 falls to a level above baseline because glow
discharge is still at 49 W. In step 4, glow discharge power is reduced back to the original 33 W, and
T5 returns to the baseline temperature.
The Pdwire sensor rises and falls only slightly, because the plasma removes heat from the
electrode.
The T6 sensor at the bottom of the cell lags behind Pdwire and T5. At the end of the run the
entire reactor cylinder comes to the same temperature.
Figure 25. A close up look at Fig. 24. The T5 thermocouple is shown: at baseline 33 W negative voltage glow discharge; 49 W positive glow discharge, with cold fusion anomalous heat; 49 W negative glow discharge, no anomalous heat; back
to negative voltage 33 W (the baseline).

18
In a recent test, the cell became very hot. The T5 thermocouple loosened and did not record the
temperature correctly. An IR camera showed the surface temperature to be 80°C where the heater
calibration showed it should not have exceeded 40°C.
Twenty-five out of 50 tests produced significant excess heat. During excess heat production,
neutrons, gamma rays and x-rays were also observed in some cases. Data on this will be presented
later. Table 1 shows a summary of the 25 successful tests. Electrodes were nickel or palladium.
Electrodes in the shape of coils and spirals were wrapped around tubes. The gas was either a
vacuum, hydrogen or deuterium gas. The tests were performed after both electrodes were activated
with glow discharge for many hours. The electric power was either direct current or alternating
current at 50 Hz. Voltage up to 1000 V was used.
In Table 1, “energy in” includes resistance heat and glow discharge. “Heat out” is calculated
based of the temperatures of T5 and T6 during calibration with the resistance. The last column
shows the ratio of excess heat and input power.

19
Table 1. Summary of the 25 successful tests
Test Reactor Gas PressureEnergy in/
kJ
Heat
out/kJOut/in
Anode + Cathode - H2 or D2 Pressure/Pa Current Volt
1 Small Ni wire coil Ni mesh H2 10 DC 605 17.9 27.0 1.51
2 Big Pd wire coil Pt mesh H2 10 DC 700 13.0 19.7 1.52
3 Small Ni wire coil Ni mesh H2 10 AC 1000 25.3 4.0 0.16
4 Big Pd wire coil Pt mesh D2 10 DC 800 30.3 45.6 1.50
5 Big Ni wire coil Ni mesh H2 10 AC 50Hz 700 32.7 38.0 1.16
6 Big Ni wire coil Ni mesh D2 10 DC 800 38.8 45.6 1.18
7 Big Ni wire coil Ni mesh D2 10 DC 800 17.1 30.4 1.78
8 Big Ni wire coil Ni mesh D2 10 AC 50Hz 700 15.9 11.8 0.74
9 Small Ni wire spiral Ni plate H2 10 DC 600 8.3 15.6 1.88
10 Small Ni wire spiral Ni plate H2 10 AC 50Hz 800 16.2 25.9 1.60
11 Small Ni wire spiral Ni mesh H2 10 DC 600 24.5 50.6 2.07
12 Small Ni wire spiral Ni mesh H2 10 AC 50Hz 750 76.7 62.3 0.81
13 Small Ni wire spiral Ni mesh D2 10 DC 600 109.0 126.6 1.16
14 Small Ni wire spiral Ni mesh D2 10 DC 750 91.6 146.0 1.59
15 Small Ni wire spiral Ni mesh D2 10 DC 700 110.0 162.0 1.47
16 Big Pd wire Pd rod H2 80 DC 590 4.6 8.0 1.75
17 Big Pd rod Pd wire H2 60 DC 595 10.7 10.3 0.96
18 Big Pd wire Pd rod H2 10 DC 800 125.0 122.0 0.97
19 Big Pd wire Pd rod H2 70 DC 800 34.3 53.2 1.55
20 Big Pd wire Pd rod H2 20 DC 800 74.8 107.2 1.43
21 Big Pd wire Pd rod D2 80 DC 800 56.0 66.5 1.19
22 Big Pd wire Pd rod H2 80 DC 759 15.0 41.8 2.79
23 Big Pd wire Pd rod H2 80 DC 780 137.0 147.0 1.07
24 Big Pd rod Pd wire H2 80 DC 790 173.5 152.0 0.87
25 Big Pd rod Pd wire H2 80 DC 790 0.8 1.9 2.49
Applied VElectrode

20
AddendumThis preprint paper was presented at a poster session at ICCF18 in July 2013. After the
conference, the author improved the calorimetry and ran a new series of tests. The problem
described above in section 4.2, in which the Pdwire sensor rises and falls only slightly in response
to excess heat, has now been address. Figure 26 shows the response of Pdwire (labeled “electrode”
here) and the two outside wall sensors in the new configuration. The linear series of red data points
are from calibration runs. They show that the electrode sensor registers ~260°C with 50 W input.
Figure 26. Improved calorimeter temperature sensor response. The sensor labeled "electrode" was labeled "Pdwire" inearlier figures.
21
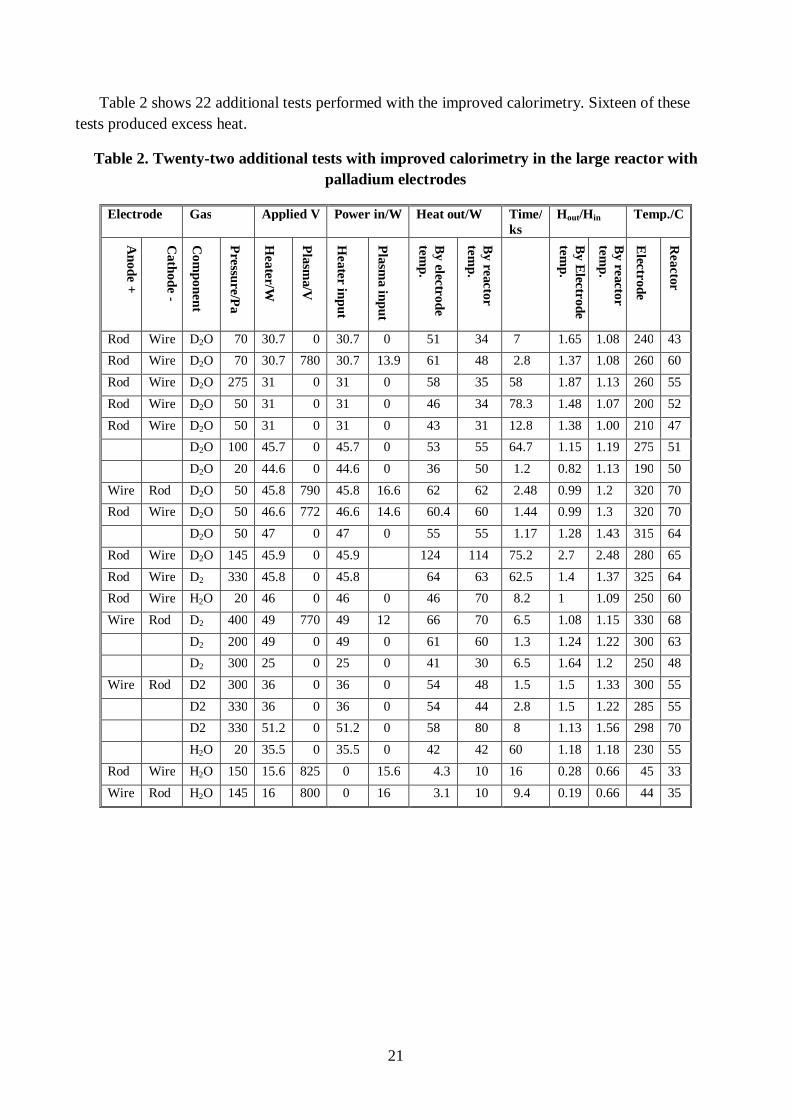
Table 2 shows 22 additional tests performed with the improved calorimetry. Sixteen of these
tests produced excess heat.
Table 2. Twenty-two additional tests with improved calorimetry in the large reactor with
palladium electrodes
Electrode Gas Applied V Power in/W Heat out/W Time/ks
Hout/Hin Temp./C
An
od
e+
Ca
tho
de
-
Co
mp
on
ent
Pressu
re/Pa
Hea
ter/W
Pla
sma/V
Hea
terin
pu
t
Pla
sma
inp
ut
By
electrod
etem
p.
By
reactor
temp
.
By
Electro
de
temp
.
By
reactor
temp
.
Electro
de
Rea
ctor
Rod Wire D2O 70 30.7 0 30.7 0 51 34 7 1.65 1.08 240 43
Rod Wire D2O 70 30.7 780 30.7 13.9 61 48 2.8 1.37 1.08 260 60
Rod Wire D2O 275 31 0 31 0 58 35 58 1.87 1.13 260 55
Rod Wire D2O 50 31 0 31 0 46 34 78.3 1.48 1.07 200 52
Rod Wire D2O 50 31 0 31 0 43 31 12.8 1.38 1.00 210 47
D2O 100 45.7 0 45.7 0 53 55 64.7 1.15 1.19 275 51
D2O 20 44.6 0 44.6 0 36 50 1.2 0.82 1.13 190 50
Wire Rod D2O 50 45.8 790 45.8 16.6 62 62 2.48 0.99 1.2 320 70
Rod Wire D2O 50 46.6 772 46.6 14.6 60.4 60 1.44 0.99 1.3 320 70
D2O 50 47 0 47 0 55 55 1.17 1.28 1.43 315 64
Rod Wire D2O 145 45.9 0 45.9 124 114 75.2 2.7 2.48 280 65
Rod Wire D2 330 45.8 0 45.8 64 63 62.5 1.4 1.37 325 64
Rod Wire H2O 20 46 0 46 0 46 70 8.2 1 1.09 250 60
Wire Rod D2 400 49 770 49 12 66 70 6.5 1.08 1.15 330 68
D2 200 49 0 49 0 61 60 1.3 1.24 1.22 300 63
D2 300 25 0 25 0 41 30 6.5 1.64 1.2 250 48
Wire Rod D2 300 36 0 36 0 54 48 1.5 1.5 1.33 300 55
D2 330 36 0 36 0 54 44 2.8 1.5 1.22 285 55
D2 330 51.2 0 51.2 0 58 80 8 1.13 1.56 298 70
H2O 20 35.5 0 35.5 0 42 42 60 1.18 1.18 230 55
Rod Wire H2O 150 15.6 825 0 15.6 4.3 10 16 0.28 0.66 45 33
Wire Rod H2O 145 16 800 0 16 3.1 10 9.4 0.19 0.66 44 35
22
References1. Tadahiko Mizuno, Tadashi Akimoto and Norio Sato, “Neutron Evolution from Annealed
Palladium Cathode in LiOD-D2O Solution”, The Electrochemical Society of Japan, Vol.57,
No.7, (1989) 742-743, in Japanese.
2. Tadahiko Mizuno, Tadashi Akimoto, Kazuhisa Azumi and Norio Sato, “Tritium evolution
during cathodic polarization of palladium electrode in D2O solution”, The Electrochemical
Society of Japan Vol.59, No.9, (1991) 798-799. in Japanese.
3. Tadahiko Mizuno and Michio Enyo, “Hydrogen Absorption and Hydride Formation in Ti
During Cathodic Electrolysis” Denki Kagaku, 63, 8, (1995) 719-725, in Japanese.
4. Tadahiko Mizuno, Tadayoshi Ohmori, Kazuya Kurokawa, Tadashi Akimoto, Masatoshi
Kitaichi, Koichi Inoda, Kazuhisa Azumi, Shigezo Shimokawa and Michio Enyo,
“Anomalous Isotopic Distribution of Elements Deposited on Palladium Induced by Cathodic
Electrolysis” Denki Kagaku, 64, 11, (1996) 1160-1165, in Japanese.
5. Tadahiko Mizuno, Tadashi Akimoto, Tadayoshi Ohmori, Akito Takahashi, Hiroshi Yamada
and Hiroo Numata, “Neutron Evolution from a Palladium Electrode by Alternate Absorption
Treatment of Deuterium and Hydrogen” Jpn. J. Appl. Phys, Vol. 40 (2001) L989-L991
6. Tadahiko Mizuno, Tadashi Akimoto, Kazuhisa Azumi, Tadayoshi Ohmori, Yoshiaki Aoki,
Akito Takahashi, “Hydrogen Evolution by Plasma Electrolysis in Aqueous Solution”, Jpn. J.
Appl. Phys., Vol. 44, No. 1A (2005) 396-401.
7. Tadahiko Mizuno, “Transmutation Reaction in Condensed Matter”, Low-Energy Nuclear
Reactions Sourcebook, American Chemical Society symposium series 998, 2008 271-294,
ed. Jan Marwan and Steven B. Krivit.