method development guide for hypercarb columns development guide for... · approach to method...
TRANSCRIPT
Hypercarb™ has unique properties as a packing for HPLC, which differfrom those of silica-based stationary phases. It has exceptional ability toretain very polar compounds and to separate closely related compounds.The hydrophobic and electrostatic retention mechanisms that explainthis behavior also require a different approach to develop a method onthis stationary phase. In this guide we have reviewed a successfulapproach to method development on Hypercarb columns.
c h r o m a t o g r a p h y
Method Development Guide for Hypercarb Columns
Part of Thermo Fisher Scientific
1. Introduction .......................41.1. Properties of Porous
Graphitic Carbon ..............................41.2. Mechanisms of inter .......................4
2. Organic modifier strength .............................5
3. Mobile phase additives ......6
4. Column geometryselection ............................7
5. Hypercarb columns for very polar analytesand in LC/MS......................7
6. Use of high temperature in LC and LC/MS .................86.1. Advantages........................................86.2. Column and oven requirements ....9
7. Method development .......107.1. Generic conditions ........................107.2. Very Polar Analytes .......................127.3. Acidic analytes...............................157.4. Non-acidic analytes ......................177.5. High temperature and
temperature programming............227.5.1. High temperature to reduce
run time .........................................227.5.2. Selectivity changes with
temperature..................................227.5.3. Temperature programming........257.5.4. “Green” LC....................................25
8. Wash procedures..............288.1. Removal of TFA and DEA ..............288.2. Acid/base wash..............................288.3. Strong organic wash.....................288.4. Normal phase wash ......................28
9. Applications .....................29
10. References .....................34
Method Development Guide for Hypercarb Columns
3
4
1.1. Properties of Porous Graphitic Carbon –Hypercarb media is 100% porous graphiticcarbon (PGC). The particles are spherical andfully porous. On a microscope scale, the surfaceof PGC is composed of flat sheets of hexagonallyarranged carbon atoms as in a very largepolynuclear aromatic molecule. The surface iscrystalline and highly reproducible, with no micropores or chemically bonded phase.
The properties of Hypercarb as a stationaryphase in HPLC have been utilized to providesolutions to a wide range of what might normallybe considered problematic separations in HPLC.Hypercarb provides unique retention andseparation of very polar compounds. The surfaceof Hypercarb is stereo-selective with thecapability to separate geometric isomers andother closely related compounds. Hypercarb isstable throughout the entire pH range 1-14, andis not affected by aggressive mobile phases. Itscompatibility with all solvent systems enablesseparation of a wide range of polarities within asingle chromatographic run.
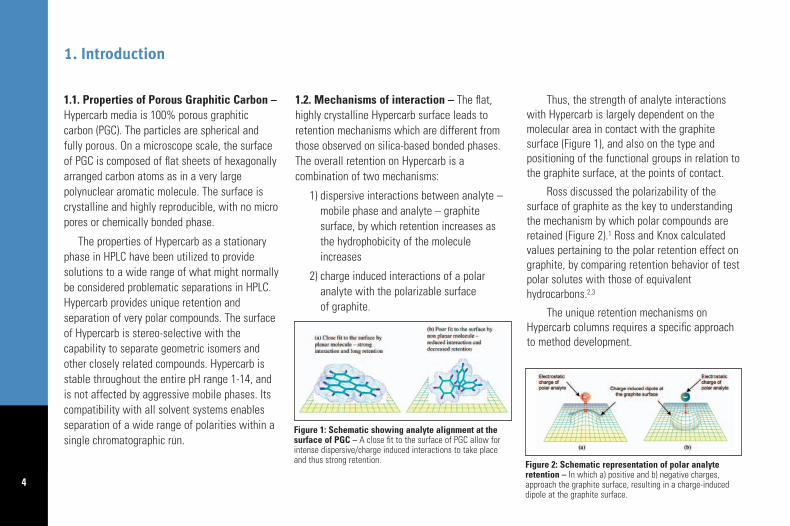
1.2. Mechanisms of interaction – The flat,highly crystalline Hypercarb surface leads toretention mechanisms which are different fromthose observed on silica-based bonded phases.The overall retention on Hypercarb is acombination of two mechanisms:
1) dispersive interactions between analyte –mobile phase and analyte – graphitesurface, by which retention increases asthe hydrophobicity of the moleculeincreases
2) charge induced interactions of a polaranalyte with the polarizable surface of graphite.
Thus, the strength of analyte interactionswith Hypercarb is largely dependent on themolecular area in contact with the graphitesurface (Figure 1), and also on the type andpositioning of the functional groups in relation tothe graphite surface, at the points of contact.
Ross discussed the polarizability of thesurface of graphite as the key to understandingthe mechanism by which polar compounds areretained (Figure 2).1 Ross and Knox calculatedvalues pertaining to the polar retention effect ongraphite, by comparing retention behavior of testpolar solutes with those of equivalenthydrocarbons.2,3
The unique retention mechanisms onHypercarb columns requires a specific approachto method development.
1. Introduction
Figure 1: Schematic showing analyte alignment at thesurface of PGC – A close fit to the surface of PGC allow forintense dispersive/charge induced interactions to take placeand thus strong retention. Figure 2: Schematic representation of polar analyte
retention – In which a) positive and b) negative charges,approach the graphite surface, resulting in a charge-induceddipole at the graphite surface.
The elutropic solvent series associated withsilica bonded phases does not always apply toHypercarb. The strength of organic solvents issolute-dependent and an important tool to adjustretention and selectivity. In general, methanol(MeOH) and acetonitrile (ACN) are similar instrength but weaker than 2-propanol (IPA) whichin turn is weaker than either tetrahydrofuran(THF) or dichloromethane (DCM). The pressuredifficulties associated with the use of IPA may beovercome by mixing it with ACN in a proportionof 1:1 or 3:1. This approach increases the relativeelution strength of ACN whilst avoiding excessivebackpressure. For the purpose of methoddevelopment it can be assumed that the organicsolvent elution strength increases as follows:
MeOH ≤ ACN < ACN:IPA(1:1) < ACN:IPA(1:3) < THF = DCM
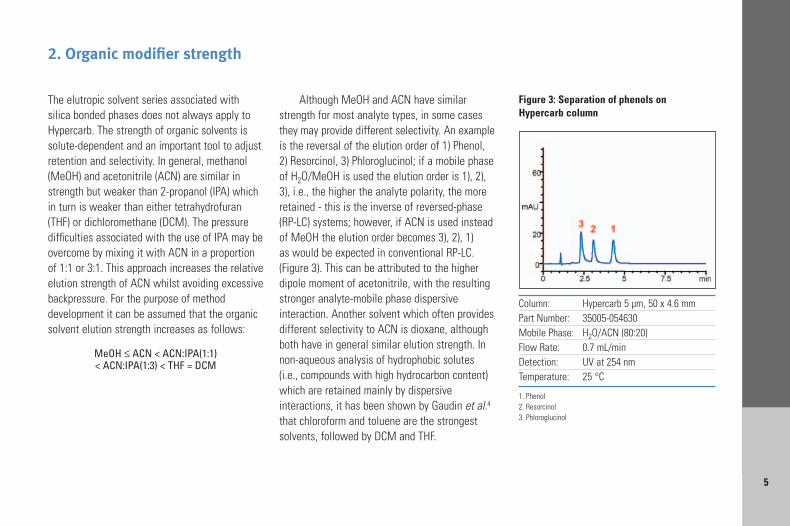
Although MeOH and ACN have similarstrength for most analyte types, in some casesthey may provide different selectivity. An exampleis the reversal of the elution order of 1) Phenol,2) Resorcinol, 3) Phloroglucinol; if a mobile phaseof H2O/MeOH is used the elution order is 1), 2),3), i.e., the higher the analyte polarity, the moreretained - this is the inverse of reversed-phase(RP-LC) systems; however, if ACN is used insteadof MeOH the elution order becomes 3), 2), 1) as would be expected in conventional RP-LC.(Figure 3). This can be attributed to the higherdipole moment of acetonitrile, with the resultingstronger analyte-mobile phase dispersiveinteraction. Another solvent which often providesdifferent selectivity to ACN is dioxane, althoughboth have in general similar elution strength. Innon-aqueous analysis of hydrophobic solutes(i.e., compounds with high hydrocarbon content)which are retained mainly by dispersiveinteractions, it has been shown by Gaudin et al.4
that chloroform and toluene are the strongestsolvents, followed by DCM and THF.
2. Organic modifier strength
5
Column: Hypercarb 5 µm, 50 x 4.6 mmPart Number: 35005-054630Mobile Phase: H2O/ACN (80:20)Flow Rate: 0.7 mL/minDetection: UV at 254 nmTemperature: 25 °C
1. Phenol2. Resorcinol3. Phloroglucinol
Figure 3: Separation of phenols on Hypercarb column
6
Retention of polar compounds and ions onHypercarb is due to specific interactions betweensolutes and delocalized electrons on the graphitesurface, which behaves both as an electron donorand electron acceptor. The type and concentrationof electronic modifiers in the mobile phase canhave a noticeable effect on the retention,selectivity and also on the peak symmetry ofsolutes separated on Hypercarb columns.
The most commonly used electronic modifier,trifluoroacetic acid (TFA), can act as a competitivemodifier which reduces polar retention. Whenseparating ionizable acidic solutes, very often itis essential to use TFA in order to obtain elutionin a reasonable run time. TFA competes with theacidic solutes for the graphite surface, preventingvery strong retention of these. When analyzingionizable basic solutes TFA behaves as an ionpairing agent which improves peak shape at thesame time as it increases retention; it is believedthat in this case, TFA forms an ion pair with theanalyte increasing retention moderately but alsoimproving resolution and peak shape viaelectronic interactions with the graphite surface.
Elfakir and Dreux compared the effect on soluteretention of various acidic electronic modifiersand salts.5 They found that
HClO4 > NaClO4 > TFA < KH2PO4,
and that the resolution values were also dependenton the concentration of the electronic modifier.
Diethylamine (DEA) also behaves as anelectronic modifier and is very useful whenstrong retention on the graphite surface resultsin broad, asymmetrical peaks or very late elutingpeaks, for basic or acidic analytes. In theseparation of basic analytes DEA can producesharp symmetrical peaks, even for compoundssuch as procainamides which are known forproducing poor peak shapes. It is thought thatDEA competes with the basic analytes for thesurface of the graphite, and thus reducesretention. For acidic analytes, this modifiers’selectronic interaction with the graphite surfacewill improve resolution and peak shape. 1-Methylpiperidine is another alternativeelectronic modifier for basic compounds, whichimproves peak symmetry.
3. Mobile phase additives
Hypercarb provides increased dispersiveinteractions relative to alkyl chain bondedsupports. Thus, a Hypercarb column will showmuch stronger retention than a silica based C18phase, for a given column length; a relativelyshort Hypercarb column should be used to
achieve comparable resolution. In most cases, a 100 mm length column is enough for anyseparation. The internal diameter will depend on various factors such as detection technique,amount of sample available, etc.
4. Column geometry selection
7
As discussed in section 1.2 polar moleculesshow affinity towards the graphite surface, andthus it is possible to obtain good retention andelution of polar species on Hypercarb. The key tothe analysis of polar species is to obtainsufficient retention to enable qualitative andquantitative analysis. In general, C18-silicasexhibit low capacity factors for polar analytes,even when fully aqueous mobile phases areutilized. The analysis of very polar compoundsunder reversed phase LC/MS is challengingbecause typical hydrophobic stationary phasesdo not provide enough retention to resolve and
quantify these types of compound, using themobile phases permitted with massspectrometric detection. Hypercarb is the idealstationary phase for the RP-LC/MS of polaranalytes for several reasons:
• Hypercarb provides unique retention andseparation of very polar compounds with “MSfriendly” mobile phases such as 0.1% formicor acetic acid and low concentrations ofvolatile buffers such as ammonium acetate orammonium formate;
• Polar compounds are well retained onHypercarb, therefore high concentrations oforganic modifiers can be employed, whichimproves nebulization in atmospheric pressureionization techniques, and thus improvessensitivity of the analysis;
• It allows shorter column lengths and smallerdiameters to be used without compromisingpeak capacity, often with increased sensitivity;
• There is no modification of the porousgraphitic carbon surface on Hypercarb, thus itis stable with any mobile phase and there areno issues of phase bleed.
5. Hypercarb columns for very polar analytes and in LC/MS
8
6.1. Advantages – The use of hightemperatures and temperature programming inreversed-phase liquid chromatography (RP-LC) isbecoming increasingly popular in laboratorieswhere high throughput is important. Mobilephase viscosity is reduced as separationtemperature increases and therefore higher flowrates can be utilized to achieve fast separations,without exceeding the standard operationalpressure limits of the HPLC system. The optimumlinear velocity increases proportionally to T/η(temperature/eluent viscosity), and therefore theflow rate for optimum efficiency is shifted to ahigher value at higher temperatures.6 As aconsequence, the analysis speed can be improvedby as much as 5- to 15-fold, when temperature isincreased from ambient to 200 °C. Reduced back-pressure at high temperature also allows longercolumns packed with small particles to be usedto facilitate the resolution of complex samples.
An additional benefit of using hightemperature is that the lower mobile phaseviscosity enhances the mass-transfer of the solutebetween the mobile and stationary phase, resultingin higher column efficiency and improved peakasymmetry. There are two major benefits toobtaining more efficient and symmetrical peaks:increased resolution and peak height, which inturn improves signal-to-noise ratios and thesensitivity of the analysis.
Another interesting aspect of high-temperatureliquid chromatography (HT-LC) is the possibility ofusing high temperature water as the mobilephase.7,8 At room temperature water is too weakas a solvent to elute all except the most polaranalytes but as the temperature of the water isincreased, particularly above its boiling point, itsdielectric constant (which is a measure of polarity)decreases, thereby increasing its elution strength inRP-LC.9 The advantages of using high-temperaturewater are the reduction or elimination ofhazardous organic solvents, thereby providing amore environmentally friendly and cheaper LCsolution, and also the possibility of coupling withflame ionization detection (FID), which is a verysensitive, universal detection technique.10
Temperature can also be used as a methoddevelopment parameter to change the selectivityof the separation, especially for polar and ionizablecompounds since the ionization equilibrium insolution is temperature dependent. This is detailedin section 7.5 of this guide.
HT-LC shows advantages when coupled withmass spectrometry. When HT-LC is used incombination with ESI and APCI, the mobile phasereaches the ion source at elevated temperature,which aids the vaporization and desolvationprocesses, thus increasing the ionization efficiencyand consequently the sensitivity of the analysis.11
6. Use of high temperature in LC and LC/MS
6.2. Column and oven requirements –Routine HT-LC requires a thermally stablecolumn. However, columns packed with alkyl-modified silicas, most generally used in RP-LC,should not be used above 60–70 °C, a limit thatis dependent upon the silica, ligand, and mobilephase composition (water content, pH). At thesetemperatures hydrolysis of the organosilane bondor dissolution of the silica may occur leading tocolumn failure. Hypercarb is 100% carbon withno bonded ligands, and is therefore chemicallyvery stable. It has been demonstrated thatHypercarb can be used routinely up to 200 °Cunder isothermal or temperature gradientconditions, without any loss in performance.11,12
Moreover, because Hypercarb has no bondedphase, column bleed does not occur, whichmeans that this column packing can be used inHT-LC with detection techniques such as massspectrometry, evaporative light scatteringdetection and FID, which are sensitive to columnbleed. The one consideration for the use ofHypercarb columns at high temperatures is thatthe column hardware must not contain PEEKcomponents. Hardware with full stainless steelconstruction is available for this purpose.
Ovens and column heaters specificallydesigned for HT-LC are now commercially available.These include temperature programming, mobilephase preheating, and mobile phase pre-detectorcooling. Mobile phase preheating is an importantrequirement at column temperatures above 80 °Cto prevent band dispersion caused by thermalmismatch across the diameter of the column.13
When using UV detection it is also necessary tocool the mobile phase to prevent damage of theflow cell; the mobile phase pre-detector cooler isbypassed when FID or MS detection are used.Another system requirement in HT-LC is that abackpressure regulator is used to maintain themobile phase in the liquid state, especially if thetemperature is close to or above the boiling point.
9
10
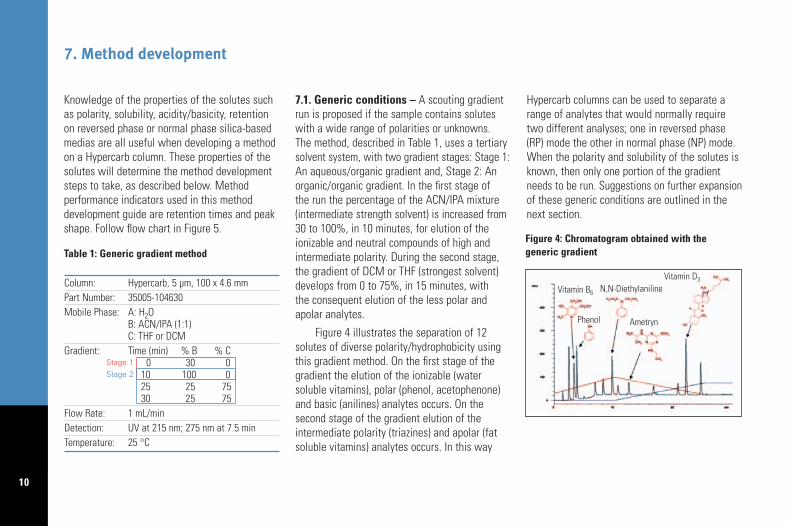
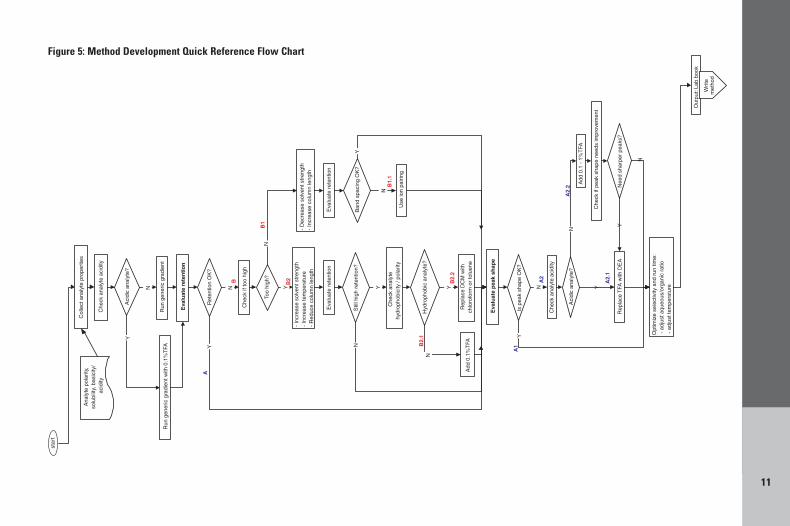
Knowledge of the properties of the solutes suchas polarity, solubility, acidity/basicity, retentionon reversed phase or normal phase silica-basedmedias are all useful when developing a methodon a Hypercarb column. These properties of thesolutes will determine the method developmentsteps to take, as described below. Methodperformance indicators used in this methoddevelopment guide are retention times and peakshape. Follow flow chart in Figure 5.
7.1. Generic conditions – A scouting gradientrun is proposed if the sample contains soluteswith a wide range of polarities or unknowns. The method, described in Table 1, uses a tertiarysolvent system, with two gradient stages: Stage 1:An aqueous/organic gradient and, Stage 2: Anorganic/organic gradient. In the first stage of the run the percentage of the ACN/IPA mixture(intermediate strength solvent) is increased from30 to 100%, in 10 minutes, for elution of theionizable and neutral compounds of high andintermediate polarity. During the second stage,the gradient of DCM or THF (strongest solvent)develops from 0 to 75%, in 15 minutes, with the consequent elution of the less polar andapolar analytes.
Figure 4 illustrates the separation of 12solutes of diverse polarity/hydrophobicity usingthis gradient method. On the first stage of thegradient the elution of the ionizable (watersoluble vitamins), polar (phenol, acetophenone)and basic (anilines) analytes occurs. On thesecond stage of the gradient elution of theintermediate polarity (triazines) and apolar (fatsoluble vitamins) analytes occurs. In this way
Hypercarb columns can be used to separate arange of analytes that would normally requiretwo different analyses; one in reversed phase(RP) mode the other in normal phase (NP) mode.When the polarity and solubility of the solutes isknown, then only one portion of the gradientneeds to be run. Suggestions on further expansionof these generic conditions are outlined in thenext section.
7. Method development
Table 1: Generic gradient method
Column: Hypercarb, 5 µm, 100 x 4.6 mmPart Number: 35005-104630Mobile Phase: A: H2O
B: ACN/IPA (1:1)C: THF or DCM
Gradient: Time (min) % B % C0 30 0
10 100 025 25 7530 25 75
Flow Rate: 1 mL/minDetection: UV at 215 nm; 275 nm at 7.5 minTemperature: 25 °C
Figure 4: Chromatogram obtained with the generic gradient
Stage 1Stage 2
Vitamin B6 N,N-Diethylaniline
Phenol Ametryn
Vitamin D3
11
Figure 5: Method Development Quick Reference Flow Chart
12
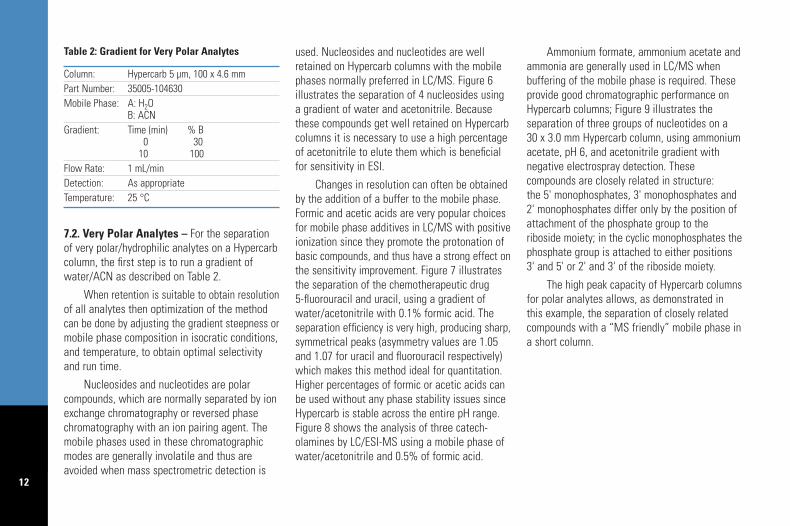
7.2. Very Polar Analytes – For the separationof very polar/hydrophilic analytes on a Hypercarbcolumn, the first step is to run a gradient ofwater/ACN as described on Table 2.
When retention is suitable to obtain resolutionof all analytes then optimization of the methodcan be done by adjusting the gradient steepness ormobile phase composition in isocratic conditions,and temperature, to obtain optimal selectivityand run time.
Nucleosides and nucleotides are polarcompounds, which are normally separated by ionexchange chromatography or reversed phasechromatography with an ion pairing agent. Themobile phases used in these chromatographicmodes are generally involatile and thus areavoided when mass spectrometric detection is
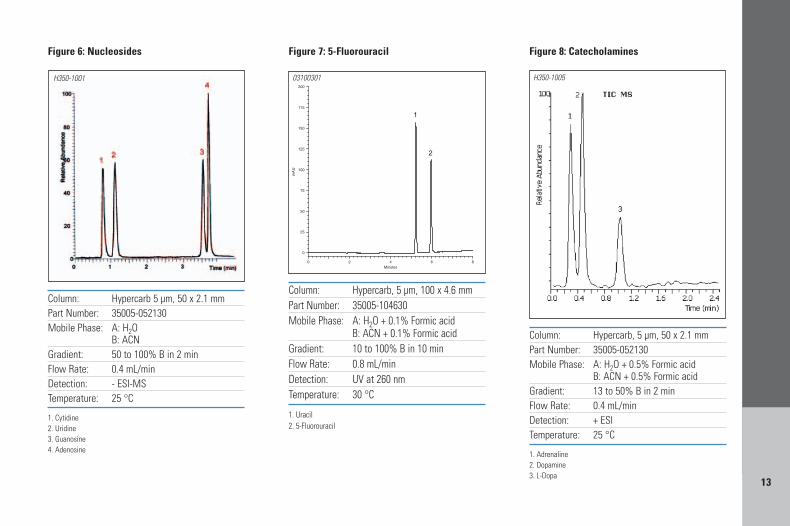
used. Nucleosides and nucleotides are wellretained on Hypercarb columns with the mobilephases normally preferred in LC/MS. Figure 6illustrates the separation of 4 nucleosides usinga gradient of water and acetonitrile. Becausethese compounds get well retained on Hypercarbcolumns it is necessary to use a high percentageof acetonitrile to elute them which is beneficialfor sensitivity in ESI.
Changes in resolution can often be obtainedby the addition of a buffer to the mobile phase.Formic and acetic acids are very popular choicesfor mobile phase additives in LC/MS with positiveionization since they promote the protonation ofbasic compounds, and thus have a strong effect onthe sensitivity improvement. Figure 7 illustratesthe separation of the chemotherapeutic drug 5-fluorouracil and uracil, using a gradient ofwater/acetonitrile with 0.1% formic acid. Theseparation efficiency is very high, producing sharp,symmetrical peaks (asymmetry values are 1.05and 1.07 for uracil and fluorouracil respectively)which makes this method ideal for quantitation.Higher percentages of formic or acetic acids canbe used without any phase stability issues sinceHypercarb is stable across the entire pH range.Figure 8 shows the analysis of three catech-olamines by LC/ESI-MS using a mobile phase ofwater/acetonitrile and 0.5% of formic acid.
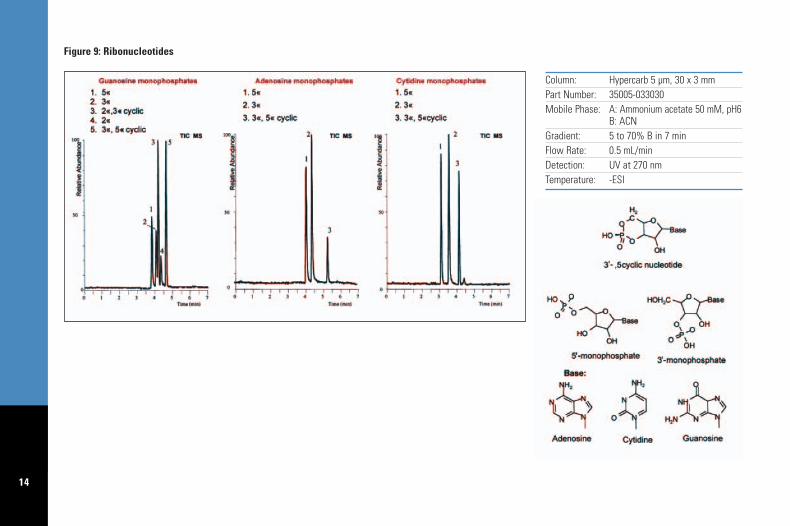
Ammonium formate, ammonium acetate andammonia are generally used in LC/MS whenbuffering of the mobile phase is required. Theseprovide good chromatographic performance onHypercarb columns; Figure 9 illustrates theseparation of three groups of nucleotides on a 30 x 3.0 mm Hypercarb column, using ammoniumacetate, pH 6, and acetonitrile gradient withnegative electrospray detection. Thesecompounds are closely related in structure: the 5' monophosphates, 3' monophosphates and2' monophosphates differ only by the position ofattachment of the phosphate group to theriboside moiety; in the cyclic monophosphates thephosphate group is attached to either positions3' and 5' or 2' and 3' of the riboside moiety.
The high peak capacity of Hypercarb columnsfor polar analytes allows, as demonstrated inthis example, the separation of closely relatedcompounds with a “MS friendly” mobile phase ina short column.
Table 2: Gradient for Very Polar Analytes
Column: Hypercarb 5 µm, 100 x 4.6 mmPart Number: 35005-104630Mobile Phase: A: H2O
B: ACNGradient: Time (min) % B
0 3010 100
Flow Rate: 1 mL/minDetection: As appropriateTemperature: 25 °C
13
Column: Hypercarb, 5 µm, 100 x 4.6 mmPart Number: 35005-104630Mobile Phase: A: H2O + 0.1% Formic acid
B: ACN + 0.1% Formic acidGradient: 10 to 100% B in 10 minFlow Rate: 0.8 mL/minDetection: UV at 260 nmTemperature: 30 °C
1. Uracil2. 5-Fluorouracil
Figure 7: 5-Fluorouracil
03100301
Column: Hypercarb, 5 µm, 50 x 2.1 mmPart Number: 35005-052130Mobile Phase: A: H2O + 0.5% Formic acid
B: ACN + 0.5% Formic acidGradient: 13 to 50% B in 2 minFlow Rate: 0.4 mL/minDetection: + ESI Temperature: 25 °C
1. Adrenaline2. Dopamine3. L-Dopa
Figure 8: Catecholamines
H350-1005
Column: Hypercarb 5 µm, 50 x 2.1 mmPart Number: 35005-052130Mobile Phase: A: H2O
B: ACNGradient: 50 to 100% B in 2 minFlow Rate: 0.4 mL/minDetection: - ESI-MSTemperature: 25 °C
1. Cytidine2. Uridine3. Guanosine4. Adenosine
Figure 6: Nucleosides
H350-1001
14
Column: Hypercarb 5 µm, 30 x 3 mmPart Number: 35005-033030Mobile Phase: A: Ammonium acetate 50 mM, pH6
B: ACNGradient: 5 to 70% B in 7 minFlow Rate: 0.5 mL/minDetection: UV at 270 nmTemperature: -ESI
Figure 9: Ribonucleotides
15
7.3. Acidic analytes – Generally, acidic solutesrequire the addition of TFA to the mobile phase inorder to obtain elution in a reasonable run time.Thus, the suggested first step in developing amethod on a Hypercarb column is to run thegeneric gradient, with 0.1% TFA on mobile phasesA, B and C (Table 3). Once retention and peakshape are determined under these conditions, thenext step can be selected from several options:
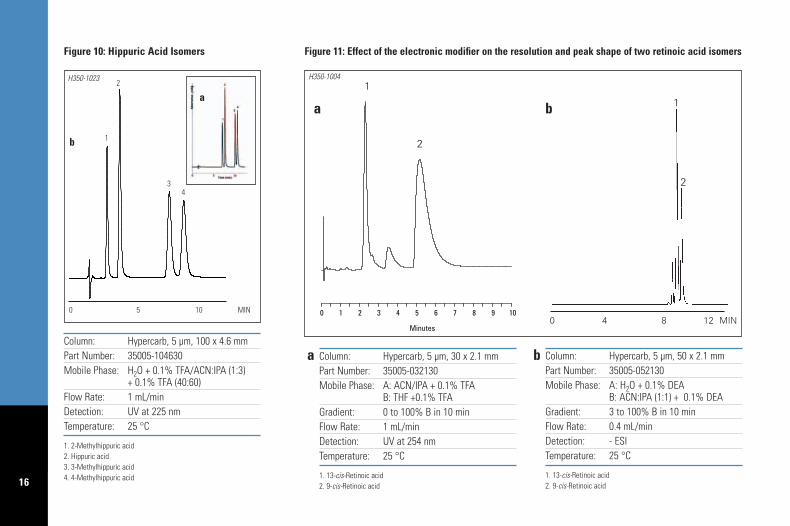
A1. – If retention is suitable to obtain resolutionof all analytes and symmetrical peak shapes areobtained, then optimization of the method can bedone by adjusting the mobile phase compositioneither in isocratic or gradient conditions, andtemperature, to obtain optimal selectivity and runtime. Figure 10 demonstrates the optimization ofthe separation of 4 hippuric acids. In Figure 10aa generic gradient of water containing 0.1% TFAto ACN/IPA (1:3) containing 0.1% TFA, 5% -100% B in 10 minutes was used. Resolution andrun time were improved (Figure10b) by changingto isocratic conditions and by reducing theorganic strength of the mobile phase.
B – When the generic gradient does not provideacceptable retention of the analytes then it isnecessary to take another approach; if retention istoo high or too low but peak shape is symmetricalthen the adjustment of solvent strength, temp-erature or column length is generally enough tobring a change in retention
B1 – For poorly retained analytes, decrease theorganic modifier strength, i.e., use gradient ofwater and ACN with 0.1% TFA or increasecolumn length;
B2 – For strongly retained analytes increasesolvent strength (increase ratio of IPA/ACN to 3:1),increase the steepness of the gradient, increasethe temperature of the column oven, reducecolumn length, or alternatively use a combinationof these.
A2.1 – In extreme cases where not only theretention is unsuitable but the peak shape isasymmetrical or in the cases where there is noelution in a reasonable run time, then it will benecessary to replace the modifier, i.e., replaceTFA with DEA. Figure 11 illustrates the separationof two isomers of retinoic acid, which is anexample of extreme retention under the genericgradient. When elution strength was increased byrunning a gradient of ACN/IPA to THF, containing0.1% TFA, retention times were reduced, howeverthe peak for 9-cis-retinoic acid was very broad(Figure 11a). Elution of both isomers, with goodpeak shape, was obtained by running the genericgradient: stage 1, with 0.1% DEA.
Table 3. Generic gradient method with 0.1%TFA
Column: Hypercarb, 5 µm, 100 x 4.6 mmPart Number: 35005-104630Mobile Phase: A: H2O+0.1 % TFA
B: ACN/IPA (1:1)+ % TFAC: THF or DCM + % TFA
Gradient: Time (min) % B % C0 30 0
10 100 025 25 7530 25 75
Flow Rate: 1 mL/minDetection: As appropriateTemperature: 25 °C
16
Column: Hypercarb, 5 µm, 100 x 4.6 mmPart Number: 35005-104630Mobile Phase: H2O + 0.1% TFA/ACN:IPA (1:3)
+ 0.1% TFA (40:60)Flow Rate: 1 mL/minDetection: UV at 225 nmTemperature: 25 °C
1. 2-Methylhippuric acid2. Hippuric acid3. 3-Methylhippuric acid4. 4-Methylhippuric acid
Figure 10: Hippuric Acid Isomers
H350-1023
0 5 10 MIN
1
2
34
Column: Hypercarb, 5 µm, 50 x 2.1 mmPart Number: 35005-052130Mobile Phase: A: H2O + 0.1% DEA
B: ACN:IPA (1:1) + 0.1% DEAGradient: 3 to 100% B in 10 minFlow Rate: 0.4 mL/minDetection: - ESI Temperature: 25 °C
1. 13-cis-Retinoic acid2. 9-cis-Retinoic acid
a
b
Column: Hypercarb, 5 µm, 30 x 2.1 mmPart Number: 35005-032130Mobile Phase: A: ACN/IPA + 0.1% TFA
B: THF +0.1% TFAGradient: 0 to 100% B in 10 minFlow Rate: 1 mL/minDetection: UV at 254 nmTemperature: 25 °C
1. 13-cis-Retinoic acid2. 9-cis-Retinoic acid
Figure 11: Effect of the electronic modifier on the resolution and peak shape of two retinoic acid isomers
H350-10041
2
0 4 8 12 MIN
1
2
a b
a b
17
7.4. Non-acidic analytes – For the separationof analytes which are not acidic, the first step isto run the generic gradient described in Table 1(see page 10). Once retention and peak shapeare determined under these conditions, the nextstep can be selected from several options:
A – If retention is suitable to obtain resolution ofall analytes and the peaks are symmetrical thenoptimization of the method can be done byadjusting the gradient or mobile phase compositionin isocratic conditions, and temperature, toobtain optimal selectivity and run time.
B – If the generic gradient does not provideacceptable retention then it is necessary to takeanother approach; if retention is too high or toolow but peak shape is symmetrical then eitherthe adjustment of solvent strength, temperatureor column length will generally be enough tobring a change in retention:
B1 – For poorly retained analytes increase thecolumn length, where possible, or decrease theorganic modifier strength, i.e., use gradient ofwater and ACN;
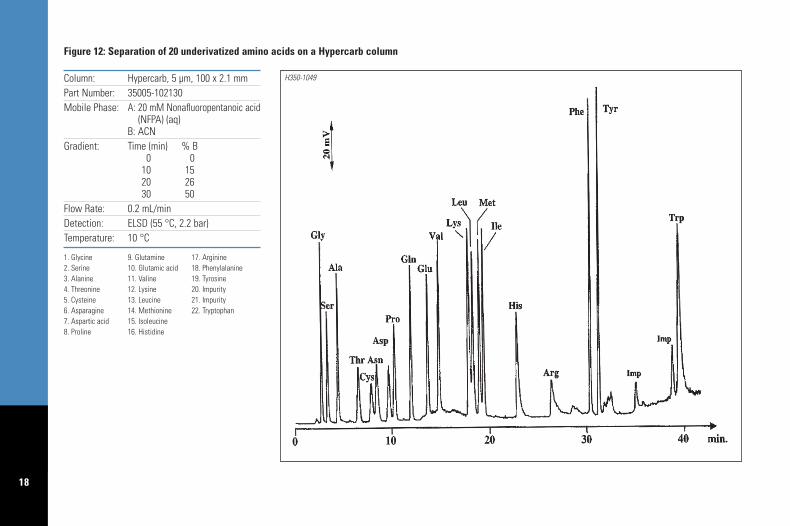
B1.1 – If this approach does not provide enoughresolution of all analytes replace ACN withMeOH, or use an ion pairing reagent, such as aperfluorocarboxylic acid, to increase retention ofbasic analytes. Figure 12 illustrates the separationof 20 underivatized amino acids on a Hypercarbcolumn using nonafluoropentanoic acid as theion pairing reagent.
B2 – For strongly retained analytes, increasesolvent strength (increase ratio of IPA/ACN to 3:1),increase the steepness of the gradient, increasethe temperature of the column oven or reducecolumn length.
B2.1 – If none of these alternatives reducesretention then addition of TFA, as an electroniccompetitor, may be attempted to reduce theretention of very polar analytes.
B2.2 – If the analytes are hydrophobic, it may benecessary to increase solvent strength furtherwith a mobile phase of ACN with toluene or ACNwith chloroform.
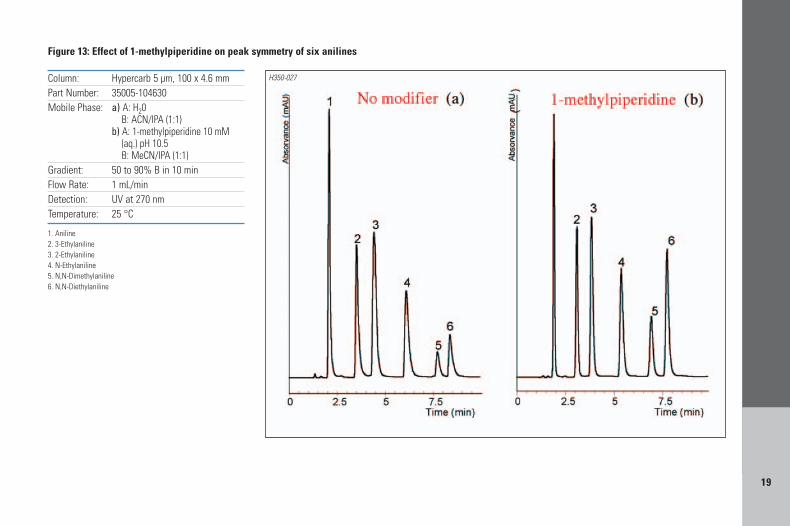
A2.2 – If retention is adequate, but peaks are notsymmetrical, then addition of 1-methylpiperidinewill improve peak shape of basic analytes, asillustrated on Figure 13 for the separation of sixanilines, where the addition of the modifierimproves peak symmetry by >20%.
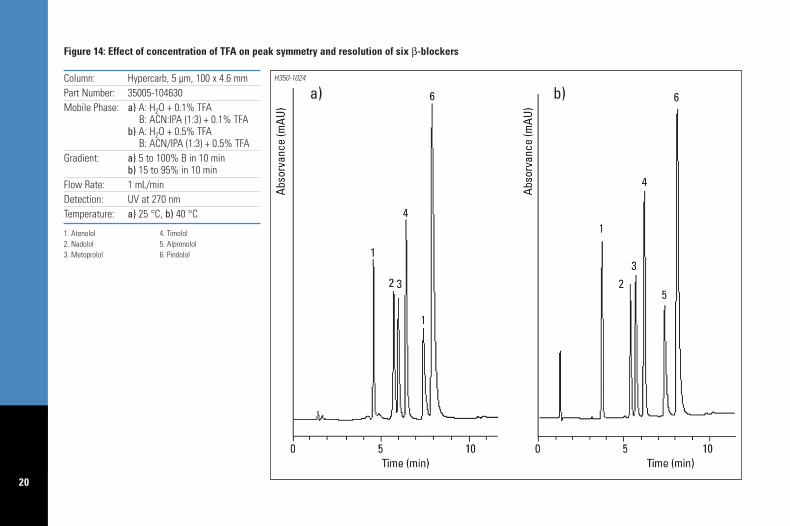
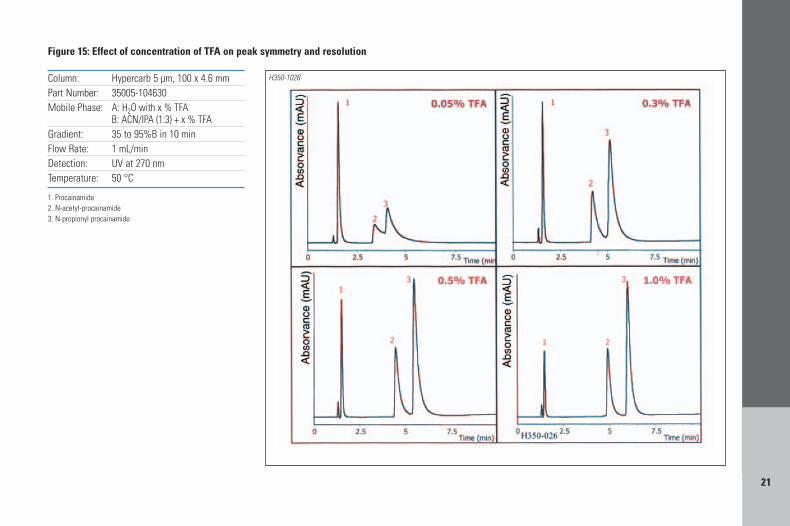
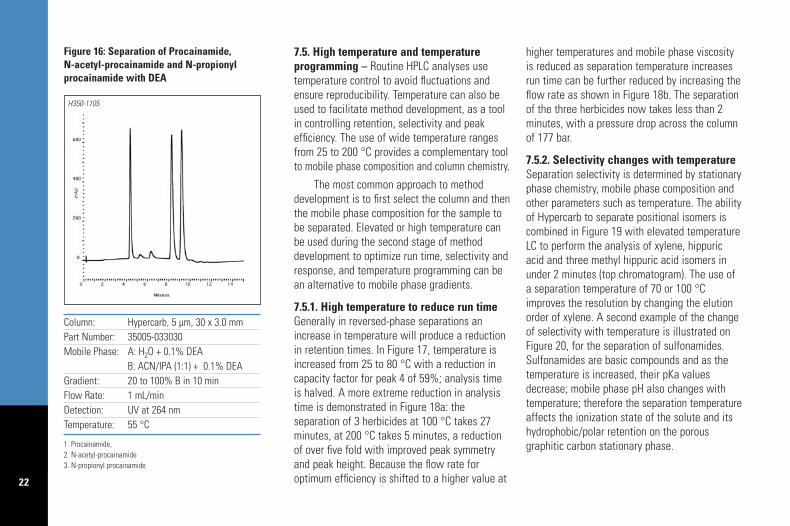
Quite often basic analytes can give rise topoor peak shapes. TFA and DEA can also be used toimprove peak shape. Increasing the concentrationof TFA above 0.1% can have a significant effecton the peak shape and resolution of the basicanalytes as shown on Figures 14 and 15 for theseparation of β-blockers, and procainamides andits metabolites, respectively. In Figure 14 theincrease in the concentration of TFA from 0.1%to 0.5% allowed for improved peak symmetryand also improved resolution between the pairsof analytes 2,3 and 5,6. Procainamide and itsmetabolites are well known for producing poorpeak shapes. Figure 15 illustrates the effect ofincreasing the %TFA (from 0.05% to 1.0%) onthe resolution and peak shape of those basicanalytes. Levels above 1% did not show furtherimprovements for these analytes. The Hypercarbphysical stability allows high concentration ofaggressive buffers such as 1%TFA to be usedwith no detrimental effect on the columnlifetime. In the extreme cases where TFA doesnot provide symmetrical peaks for basic analytesthen replacement of TFA with 0.1%DEA issuggested (Figure 16). DEA is also the bestmodifier if analytes are strongly retained (forinstance with hydrophobic analytes) or showtailing peaks.
18
Column: Hypercarb, 5 µm, 100 x 2.1 mmPart Number: 35005-102130Mobile Phase: A: 20 mM Nonafluoropentanoic acid
(NFPA) (aq)B: ACN
Gradient: Time (min) % B0 0
10 1520 2630 50
Flow Rate: 0.2 mL/minDetection: ELSD (55 °C, 2.2 bar)Temperature: 10 °C
1. Glycine 9. Glutamine 17. Arginine2. Serine 10. Glutamic acid 18. Phenylalanine3. Alanine 11. Valine 19. Tyrosine4. Threonine 12. Lysine 20. Impurity5. Cysteine 13. Leucine 21. Impurity6. Asparagine 14. Methionine 22. Tryptophan7. Aspartic acid 15. Isoleucine8. Proline 16. Histidine
H350-1049
Figure 12: Separation of 20 underivatized amino acids on a Hypercarb column
19
Column: Hypercarb 5 µm, 100 x 4.6 mmPart Number: 35005-104630Mobile Phase: a) A: H20
B: ACN/IPA (1:1)b) A: 1-methylpiperidine 10 mM
(aq.) pH 10.5B: MeCN/IPA (1:1)
Gradient: 50 to 90% B in 10 minFlow Rate: 1 mL/minDetection: UV at 270 nmTemperature: 25 °C
1. Aniline2. 3-Ethylaniline3. 2-Ethylaniline4. N-Ethylaniline5. N,N-Dimethylaniline6. N,N-Diethylaniline
H350-027
Figure 13: Effect of 1-methylpiperidine on peak symmetry of six anilines
20
Column: Hypercarb, 5 µm, 100 x 4.6 mmPart Number: 35005-104630Mobile Phase: a) A: H2O + 0.1% TFA
B: ACN:IPA (1:3) + 0.1% TFAb) A: H2O + 0.5% TFA
B: ACN/IPA (1:3) + 0.5% TFAGradient: a) 5 to 100% B in 10 min
b) 15 to 95% in 10 minFlow Rate: 1 mL/minDetection: UV at 270 nmTemperature: a) 25 °C, b) 40 °C
1. Atenolol 4. Timolol2. Nadolol 5. Alprenolol3. Metoprolol 6. Pindolol
H350-1024
Figure 14: Effect of concentration of TFA on peak symmetry and resolution of six β-blockers
a) b)
21
Column: Hypercarb 5 µm, 100 x 4.6 mmPart Number: 35005-104630Mobile Phase: A: H2O with x % TFA
B: ACN/IPA (1:3) + x % TFAGradient: 35 to 95%B in 10 minFlow Rate: 1 mL/minDetection: UV at 270 nmTemperature: 50 °C
1. Procainamide2. N-acetyl-procainamide3. N-propionyl procainamide
H350-1026
Figure 15: Effect of concentration of TFA on peak symmetry and resolution
22
Column: Hypercarb, 5 µm, 30 x 3.0 mmPart Number: 35005-033030Mobile Phase: A: H2O + 0.1% DEA
B: ACN/IPA (1:1) + 0.1% DEAGradient: 20 to 100% B in 10 minFlow Rate: 1 mL/minDetection: UV at 264 nmTemperature: 55 °C
1. Procainamide,2. N-acetyl-procainamide3. N-propionyl procainamide
Figure 16: Separation of Procainamide, N-acetyl-procainamide and N-propionylprocainamide with DEA
H350-1105
7.5. High temperature and temperatureprogramming – Routine HPLC analyses usetemperature control to avoid fluctuations andensure reproducibility. Temperature can also beused to facilitate method development, as a toolin controlling retention, selectivity and peakefficiency. The use of wide temperature rangesfrom 25 to 200 °C provides a complementary toolto mobile phase composition and column chemistry.
The most common approach to methoddevelopment is to first select the column and thenthe mobile phase composition for the sample tobe separated. Elevated or high temperature canbe used during the second stage of methoddevelopment to optimize run time, selectivity andresponse, and temperature programming can bean alternative to mobile phase gradients.
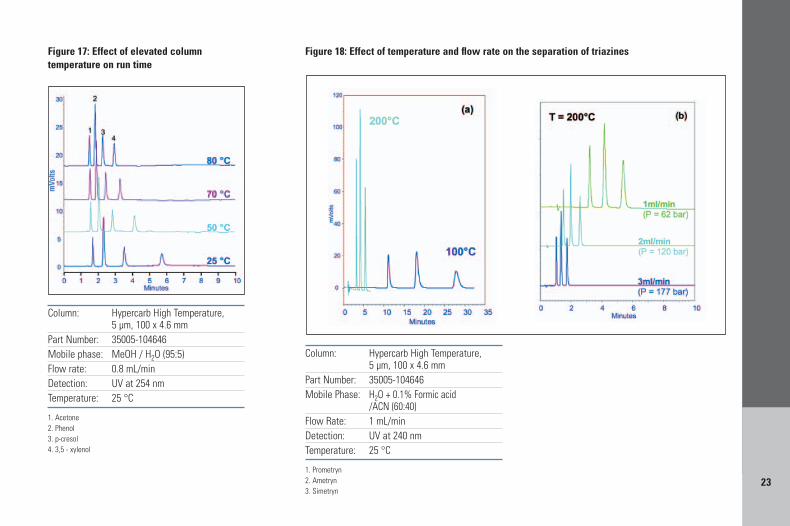
7.5.1. High temperature to reduce run timeGenerally in reversed-phase separations anincrease in temperature will produce a reductionin retention times. In Figure 17, temperature isincreased from 25 to 80 °C with a reduction incapacity factor for peak 4 of 59%; analysis timeis halved. A more extreme reduction in analysistime is demonstrated in Figure 18a: theseparation of 3 herbicides at 100 °C takes 27minutes, at 200 °C takes 5 minutes, a reductionof over five fold with improved peak symmetryand peak height. Because the flow rate foroptimum efficiency is shifted to a higher value at
higher temperatures and mobile phase viscosityis reduced as separation temperature increasesrun time can be further reduced by increasing theflow rate as shown in Figure 18b. The separationof the three herbicides now takes less than 2minutes, with a pressure drop across the columnof 177 bar.
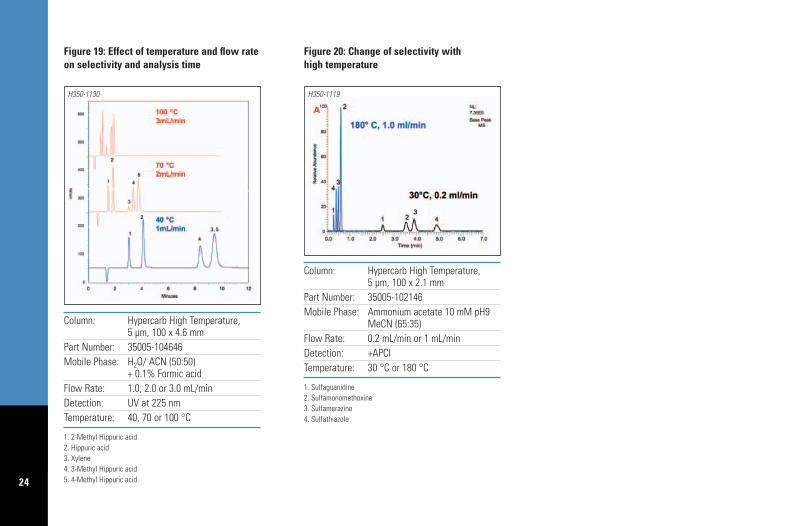
7.5.2. Selectivity changes with temperatureSeparation selectivity is determined by stationaryphase chemistry, mobile phase composition andother parameters such as temperature. The abilityof Hypercarb to separate positional isomers iscombined in Figure 19 with elevated temperatureLC to perform the analysis of xylene, hippuricacid and three methyl hippuric acid isomers inunder 2 minutes (top chromatogram). The use ofa separation temperature of 70 or 100 °Cimproves the resolution by changing the elutionorder of xylene. A second example of the changeof selectivity with temperature is illustrated onFigure 20, for the separation of sulfonamides.Sulfonamides are basic compounds and as thetemperature is increased, their pKa valuesdecrease; mobile phase pH also changes withtemperature; therefore the separation temperatureaffects the ionization state of the solute and itshydrophobic/polar retention on the porousgraphitic carbon stationary phase.
23
Figure 18: Effect of temperature and flow rate on the separation of triazines
Column: Hypercarb High Temperature, 5 µm, 100 x 4.6 mm
Part Number: 35005-104646Mobile Phase: H2O + 0.1% Formic acid
/ACN (60:40)Flow Rate: 1 mL/minDetection: UV at 240 nmTemperature: 25 °C
1. Prometryn2. Ametryn3. Simetryn
Column: Hypercarb High Temperature, 5 µm, 100 x 4.6 mm
Part Number: 35005-104646Mobile phase: MeOH / H2O (95:5)Flow rate: 0.8 mL/minDetection: UV at 254 nmTemperature: 25 °C
1. Acetone2. Phenol3. p-cresol4. 3,5 - xylenol
Figure 17: Effect of elevated columntemperature on run time
24
Column: Hypercarb High Temperature, 5 µm, 100 x 4.6 mm
Part Number: 35005-104646Mobile Phase: H2O/ ACN (50:50)
+ 0.1% Formic acidFlow Rate: 1.0, 2.0 or 3.0 mL/minDetection: UV at 225 nmTemperature: 40, 70 or 100 °C
1. 2-Methyl Hippuric acid2. Hippuric acid3. Xylene4. 3-Methyl Hippuric acid5. 4-Methyl Hippuric acid
Figure 19: Effect of temperature and flow rateon selectivity and analysis time
H350-1130
Column: Hypercarb High Temperature, 5 µm, 100 x 2.1 mm
Part Number: 35005-102146Mobile Phase: Ammonium acetate 10 mM pH9
MeCN (65:35)Flow Rate: 0.2 mL/min or 1 mL/minDetection: +APCITemperature: 30 °C or 180 °C
1. Sulfaguanidine2. Sulfamonomethoxine3. Sulfamerazine4. Sulfathiazole
Figure 20: Change of selectivity with high temperature
H350-1119
25
7.5.3. Temperature programming –When temperature programming is possible, a temperature gradient can replace a solventgradient. One of the advantages of usingtemperature gradients is for analyses withdetectors that are sensitive to differences inmobile phase composition such as evaporativelight scattering, corona discharge detectors andmass spectrometry.
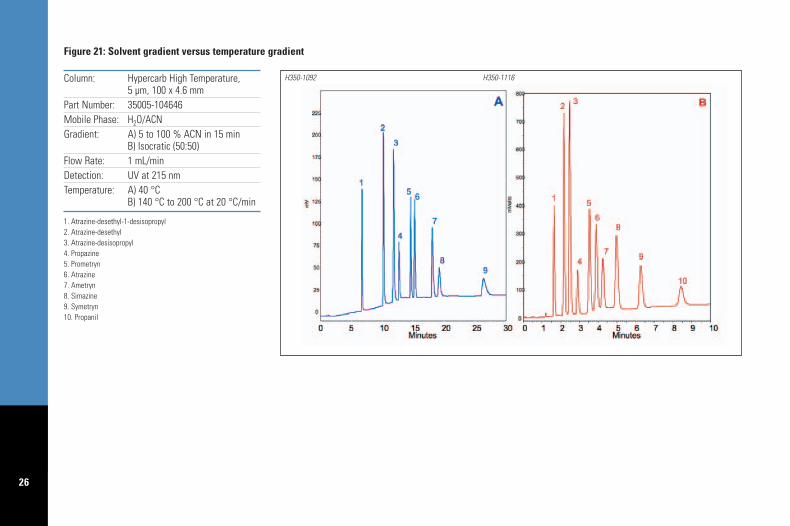
In Figure 21 seven herbicides and threemetabolites of atrazine were separated with asolvent gradient of water and acetonitrile, atconventional temperature. These compoundshave a wide range of hydrophobicity, log P = 0.32for atrazine-desethyl-1-desisopropyl and log P =3.07 for propanil. Porous graphitic carbon allowsfor good retention of the polar metabolites butalso strongly retains hydrophobic solutes1 suchas propanil. Under these mobile phase andtemperature conditions propanil does not elute in45 minutes. The solvent gradient (5 to 100 %organic) was replaced with a temperaturegradient from 140 to 200 °C at 20 °C / min andan isocratic mobile phase (50:50 v/v, water /acetonitrile); analysis time is reduced from 28 to9 minutes, with elution of the 10 analytes andstill exhibiting full baseline resolution. Theobserved resolution between any pair of solutesis > 1.5 in both of these runs (refer to Table 4).
A further practical advantage of using atemperature gradient in replacement of a solventgradient is that column re-equilibration at theend of the gradient is faster, allowing for shortercycle times. Typically ten column volumes areused for re-equilibration of a solvent gradientand therefore the 100 x 4.6 mm column runningat 1 mL/min required approximately 10 minutesto re-equilibrate. In the example shown in Figure21 the time required between temperaturegradient runs to cool the oven down to thestarting temperature (140 °C) was approximately3 minutes.
7.5.4. “Green” LC – Increased separationtemperature decreases the amount of organicmodifier required in the mobile phase and insome cases it can even be eliminated completely,resulting in pure aqueous mobile phases.
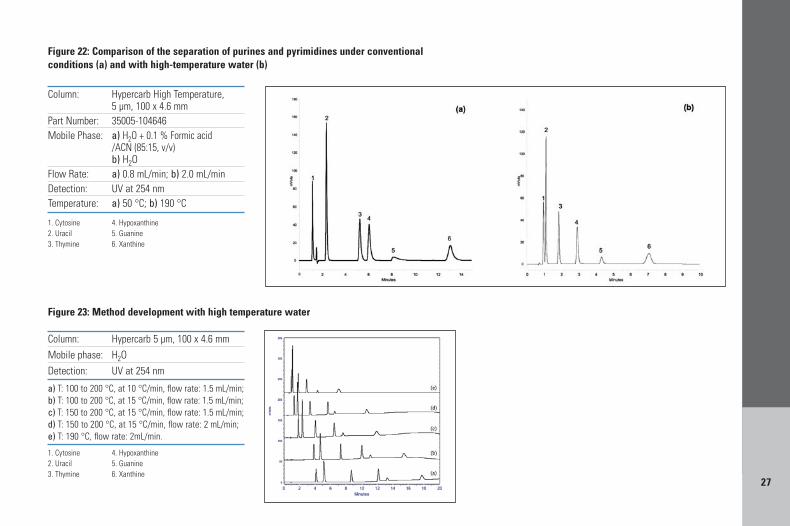
The retention and separation of a mixture ofpurines and pyrimidines, obtained with a mobilephase of water, acetonitrile and formic acid, at50 °C is shown in Figure 22a. By removing theorganic component (acetonitrile) and theelectronic modifier (formic acid) from the mobilephase, elution strength is greatly reduced, and atconventional temperatures this is too weak toelute the solutes from the PGC column. However,if the temperature of water is increased itselution strength increases due to a decreased
dielectric constant. In Figure 22b, the purines andpyrimidines are separated with a mobile phaseof pure water at 190 °C. Although the elutionorder is maintained, the separation selectivityobtained with 100 % water at 190 °C is differentand overall peak symmetry is improved at thishigh temperature. Asymmetry values for peaks 3 and 4 (at 10 % height) reduce from 1.37 and1.56 under conventional conditions to 1.22 and1.19 respectively at 190 °C. Parameters that canbe changed, when running a pure water mobilephase to adjust run time and resolution, aretemperature gradient slope, the gradient startingtemperature and the flow rate (illustrated inFigure 23).
Table 4: Comparison of resolution (USP) forchromatograms in Figure 21
Peak Pair Solvent Gradient T Gradient(Figure 21a) (Figure 21b)
2, 1 18.68 4.243, 2 6.70 2.184, 3 3.45 2.725, 4 7.96 3.706, 5 2.55 1.877, 6 8.65 1.718, 7 2.44 3.119, 8 8.88 4.6410, 9 – 6.08
26
Figure 21: Solvent gradient versus temperature gradient
Column: Hypercarb High Temperature, 5 µm, 100 x 4.6 mm
Part Number: 35005-104646Mobile Phase: H2O/ACNGradient: A) 5 to 100 % ACN in 15 min
B) Isocratic (50:50)Flow Rate: 1 mL/minDetection: UV at 215 nmTemperature: A) 40 °C
B) 140 °C to 200 °C at 20 °C/min
1. Atrazine-desethyl-1-desisopropyl2. Atrazine-desethyl3. Atrazine-desisopropyl4. Propazine5. Prometryn6. Atrazine7. Ametryn8. Simazine9. Symetryn10. Propanil
H350-1092 H350-1116
27
Figure 22: Comparison of the separation of purines and pyrimidines under conventionalconditions (a) and with high-temperature water (b)
Figure 23: Method development with high temperature water
Column: Hypercarb High Temperature, 5 µm, 100 x 4.6 mm
Part Number: 35005-104646Mobile Phase: a) H2O + 0.1 % Formic acid
/ACN (85:15, v/v)b) H2O
Flow Rate: a) 0.8 mL/min; b) 2.0 mL/minDetection: UV at 254 nmTemperature: a) 50 °C; b) 190 °C
1. Cytosine 4. Hypoxanthine2. Uracil 5. Guanine3. Thymine 6. Xanthine
Column: Hypercarb 5 µm, 100 x 4.6 mmMobile phase: H2O Detection: UV at 254 nm
a) T: 100 to 200 °C, at 10 °C/min, flow rate: 1.5 mL/min; b) T: 100 to 200 °C, at 15 °C/min, flow rate: 1.5 mL/min;c) T: 150 to 200 °C, at 15 °C/min, flow rate: 1.5 mL/min; d) T: 150 to 200 °C, at 15 °C/min, flow rate: 2 mL/min; e) T: 190 °C, flow rate: 2mL/min.
1. Cytosine 4. Hypoxanthine2. Uracil 5. Guanine3. Thymine 6. Xanthine
28
8.1. Removal of TFA and DEA – TFA and DEAhave the potential to adsorb to the surface ofporous graphitic carbon; thus after using theseadditives in the mobile phase, regeneration ofthe column should be undertaken to ensure theoriginal Hypercarb selectivity and that optimumperformance will always be achieved. Testing ofcolumn performance can be undertaken using theexperimental conditions in the test certificateprovided with the column. The regeneration is asfollows:
• Removal of TFA: Flush column with 70 columnvolumes of THF.
• Removal of DEA: Set column oven to 75 °Cand flush column with 120 column volumes of MeCN.
8.2. Acid/base wash – The acid/base wash issuitable for ionized species being chromatographedin strongly aqueous eluents. The procedure basedon a 100 x 4.6 mm column is outlined below:
1. Invert the column
2. Flush column at 1.0 mL/min. with 50 mL ofTHF:H20 (1:1) containing 0.1% TFA (acid wash)
3. Flush column at 1.0 mL/min with 50 mL ofTHF:H20 (1:1) containing 0.1% TEA or NaOH(base wash)
4. Flush column at 1.0 mL/min with 50 mL ofTHF:H20 (1:1) containing 0.1% TFA (acid wash)
5. Re-equilibrate column with MeOH:H20 (95:5)
6. Re-invert column and test performance.
8.3. Strong organic wash – The strong organicwash is suitable for applications involving polarand/or ionizable species chromatographed in anaqueous eluent using a 100 x 4.6 mm column:
1. Flush column at 1.0 mL/min with 50 mL of acetone
2. Flush column at 1.0 mL/min with 120 mL of dibutylether
3. Flush column at 1.0 mL/min with 50 mL of acetone
4. Re-equilibrate column with aqueous mobile phase.
8.4. Normal phase wash – The normal phasewash is suitable for applications running inpredominately normal phase organic/nonpolarsolvents. The procedure based on a 100 x 4.6mm column is outlined below:
1. Flush column at 1.0 mL/min with 50 mL of dichloromethane.
2. Flush column at 1.0 mL/min with 50 mL of methanol.
3. Flush column at 1.0 mL/min with 50 mL of HPLC grade water.
4. Flush column at 1.0 mL/min with 100 mL of 0.1M hydrochloric acid.
5. Flush column at 1.0 mLmin with 50 mL of HPLC grade water.
6. Flush column at 1.0 mL/min with 50 mL of methanol.
7. Flush column at 1.0 mL/min with 50 mL of dichloromethane.
8. Re-equilibrate column with mobile phase.
8. Wash procedures
29
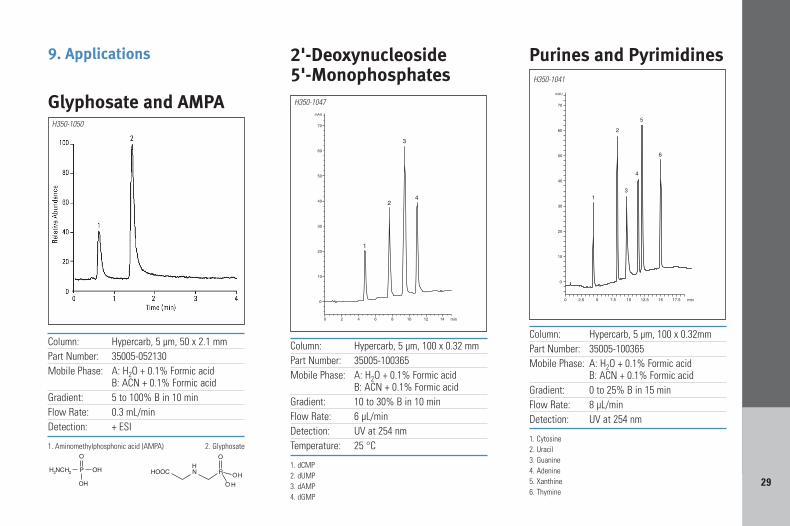
9. Applications
Column: Hypercarb, 5 µm, 100 x 0.32 mmPart Number: 35005-100365Mobile Phase: A: H2O + 0.1% Formic acid
B: ACN + 0.1% Formic acidGradient: 10 to 30% B in 10 minFlow Rate: 6 µL/minDetection: UV at 254 nmTemperature: 25 °C
1. dCMP2. dUMP3. dAMP4. dGMP
2'-Deoxynucleoside 5'-Monophosphates
H350-1047
Column: Hypercarb, 5 µm, 50 x 2.1 mmPart Number: 35005-052130Mobile Phase: A: H2O + 0.1% Formic acid
B: ACN + 0.1% Formic acid Gradient: 5 to 100% B in 10 minFlow Rate: 0.3 mL/minDetection: + ESI
1. Aminomethylphosphonic acid (AMPA) 2. Glyphosate
Glyphosate and AMPAH350-1050
Column: Hypercarb, 5 µm, 100 x 0.32mmPart Number: 35005-100365Mobile Phase: A: H2O + 0.1% Formic acid
B: ACN + 0.1% Formic acidGradient: 0 to 25% B in 15 minFlow Rate: 8 µL/minDetection: UV at 254 nm
1. Cytosine2. Uracil3. Guanine4. Adenine5. Xanthine6. Thymine
Purines and PyrimidinesH350-1041
30
Column: Hypercarb, 5 µm, 50 x 2.1 mmPart Number: 35005-052130Mobile Phase: A: 20 mM NH4OAc at pH 6
B: ACNGradient: 5 to 100% B in 5 minFlow Rate: 0.3 mL/minDetection: + ESITemperature: 35 °C
1. Thr-Ser-Lys2. Arg-Gly-Glu-Ser3. Asp-Ser-Asp-Pro-Arg
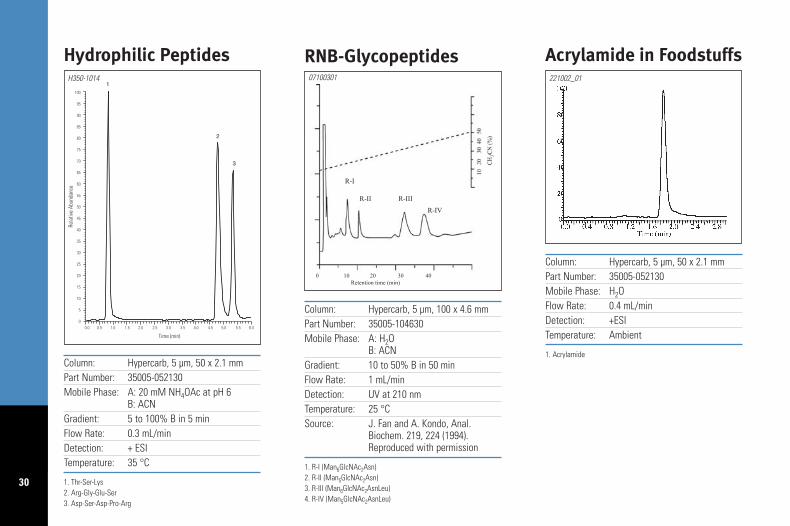
Hydrophilic PeptidesH350-1014
Column: Hypercarb, 5 µm, 100 x 4.6 mmPart Number: 35005-104630Mobile Phase: A: H2O
B: ACNGradient: 10 to 50% B in 50 minFlow Rate: 1 mL/minDetection: UV at 210 nmTemperature: 25 °CSource: J. Fan and A. Kondo, Anal.
Biochem. 219, 224 (1994).Reproduced with permission
1. R-I (Man6GlcNAc2Asn)2. R-II (Man5GlcNAc2Asn)3. R-III (Man6GlcNAc2AsnLeu)4. R-IV (Man5GlcNAc2AsnLeu)
RNB-Glycopeptides07100301
Column: Hypercarb, 5 µm, 50 x 2.1 mmPart Number: 35005-052130Mobile Phase: H2OFlow Rate: 0.4 mL/minDetection: +ESITemperature: Ambient
1. Acrylamide
Acrylamide in Foodstuffs221002_01
31
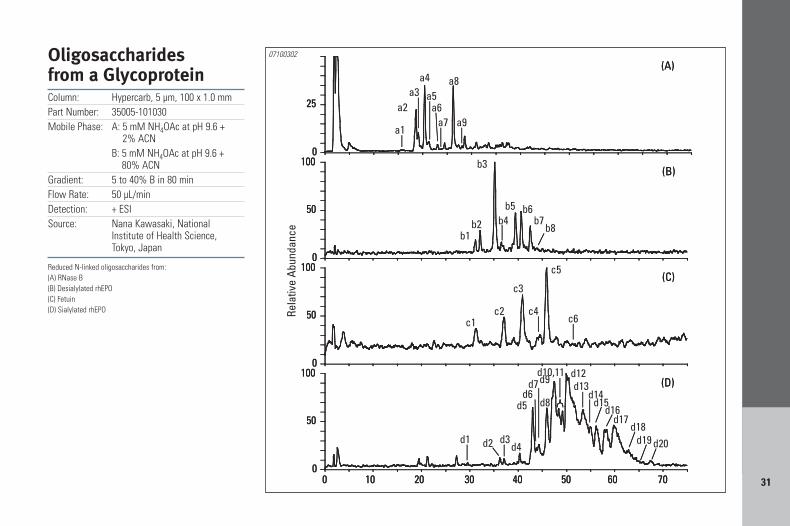
Oligosaccharidesfrom a GlycoproteinColumn: Hypercarb, 5 µm, 100 x 1.0 mmPart Number: 35005-101030Mobile Phase: A: 5 mM NH4OAc at pH 9.6 +
2% ACNB: 5 mM NH4OAc at pH 9.6 +
80% ACNGradient: 5 to 40% B in 80 minFlow Rate: 50 µL/minDetection: + ESISource: Nana Kawasaki, National
Institute of Health Science, Tokyo, Japan
Reduced N-linked oligosaccharides from:(A) RNase B(B) Desialylated rhEPO(C) Fetuin(D) Sialylated rhEPO
07100302
32
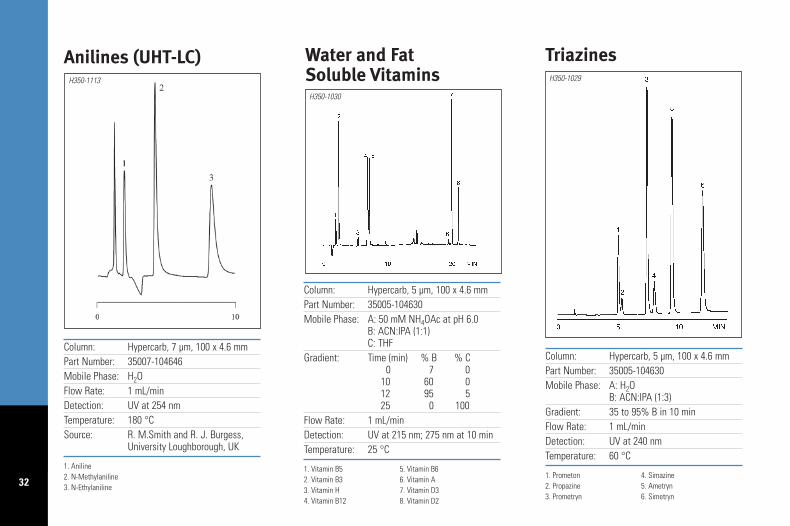
Column: Hypercarb, 7 µm, 100 x 4.6 mmPart Number: 35007-104646Mobile Phase: H2OFlow Rate: 1 mL/minDetection: UV at 254 nmTemperature: 180 °CSource: R. M.Smith and R. J. Burgess,
University Loughborough, UK
1. Aniline2. N-Methylaniline3. N-Ethylaniline
Anilines (UHT-LC)H350-1113
Column: Hypercarb, 5 µm, 100 x 4.6 mmPart Number: 35005-104630Mobile Phase: A: 50 mM NH4OAc at pH 6.0
B: ACN:IPA (1:1)C: THF
Gradient: Time (min) % B % C0 7 0
10 60 012 95 525 0 100
Flow Rate: 1 mL/minDetection: UV at 215 nm; 275 nm at 10 minTemperature: 25 °C
1. Vitamin B5 5. Vitamin B62. Vitamin B3 6. Vitamin A3. Vitamin H 7. Vitamin D34. Vitamin B12 8. Vitamin D2
Water and FatSoluble Vitamins
H350-1030
Column: Hypercarb, 5 µm, 100 x 4.6 mmPart Number: 35005-104630Mobile Phase: A: H2O
B: ACN:IPA (1:3)Gradient: 35 to 95% B in 10 minFlow Rate: 1 mL/minDetection: UV at 240 nmTemperature: 60 °C
1. Prometon 4. Simazine2. Propazine 5. Ametryn3. Prometryn 6. Simetryn
TriazinesH350-1029
33
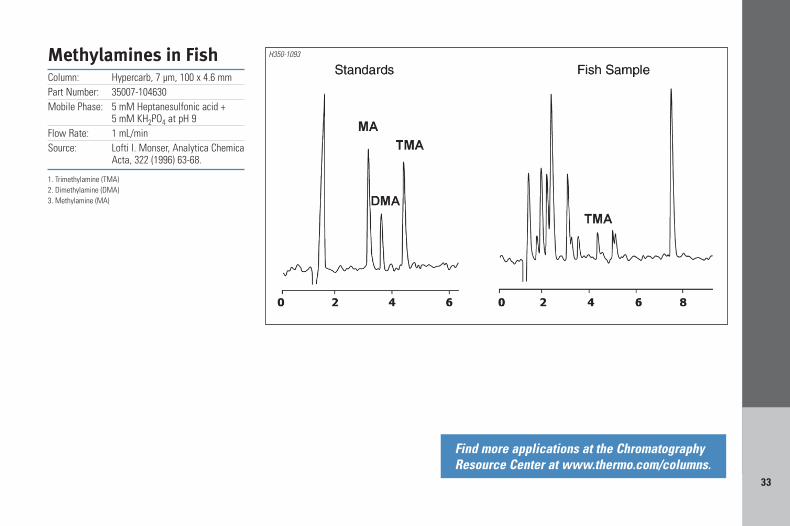
Methylamines in FishColumn: Hypercarb, 7 µm, 100 x 4.6 mmPart Number: 35007-104630Mobile Phase: 5 mM Heptanesulfonic acid +
5 mM KH2PO4 at pH 9Flow Rate: 1 mL/minSource: Lofti I. Monser, Analytica Chemica
Acta, 322 (1996) 63-68.
1. Trimethylamine (TMA)2. Dimethylamine (DMA)3. Methylamine (MA)
H350-1093
Find more applications at the ChromatographyResource Center at www.thermo.com/columns.
34
1. P. Ross LC-GC Europe, 13, no.5, (2000)
2. P. Ross PhD Thesis, Edinburgh University(Edinburgh, UK, 1999)
3. J.H. Knox and P. Ross, “Quantification andCorrelation of the Energies Associated withRetention of Polar analytes on PorousGraphitic Carbon” poster HPLC 99’ Granada,Spain, 30 May- 4 June 1999
4. K. Gaudin, P. Chaminade, A. Baillet, J.Chromatogr. A, 973 (2002) 61-68
5. C. Elfakir, M. Dreux, J. Chromatogr. A, 727(1996) 71-82
6. D. Guillarme, S. Heinisch, J.L. Rocca, J.Chromatogr. A, 1052 (2004) 39-51
7. I.D. Wilson, Chromatographia Suppl., 52 (2000)S28–S34.
8. R. Tajuddin, R.M. Smith, J. Chromatogr. A,1084 (2005) 194-200.
9. R. Tajuddin, R.M. Smith, Analyst, 127 (2002)883–885
10. D. Guillarme, S. Heinisch, J.Y. Gauvrit, P.Lanteri, J.L. Rocca, J. Chromatogr. A, 1078(2005) 22-27.
11. L. Pereira, S. Aspey, H. Ritchie, J. Sep. Sci.,30 (2007) 1115-1124.
12. S. J. Marin, B.A. Jones, W.D. Felix, J. Clark,J. Chromatogr. A, 1030 (2004) 255-262.
13. B. Jones, S. Marin, D. Felix, J. Clark,Proceedings of the Pittsburgh Conferenceabstracts), Orlando, FL, 9-14 March 2003,2020–2023.
10. References

©2007 Thermo FisherScientific Inc. All rightsreserved. All trademarks are the property of ThermoFisher Scientific Inc. and its subsidiaries.
Specifications, terms andpricing are subject to change.Not all products are availablein all countries. Please consultyour local sales representativefor details.
TG20394_E 12/07M
Thermo Electron Corporation,Bellefonte, PA is ISO Certified.
Thermo Hypersil Ltd., Runcorn, UK is ISO Certified.
ISO 9001:2000 FM 76231
North America+1 800 437 [email protected]
T
E
Africa, Asia, Europe, Latin America and Middle East+44 (0) 1928 [email protected]
T
E
For Technical Support:
Tap our expertise throughout the life of your instrument. Thermo Scientific Services
extends its support throughout our worldwide network of highly trained and certified
engineers who are experts in laboratory technologies and applications. Put our team
of experts to work for you in a range of disciplines – from system installation, training
and technical support, to complete asset management and regulatory compliance
consulting. Improve your productivity and lower the cost of instrument ownership
through our product support services. Maximize uptime while eliminating the
uncontrollable cost of unplanned maintenance and repairs. When it’s time to enhance
your system, we also offer certified parts and a range of accessories and
consumables suited to your application.
To learn more about our products and comprehensive service offerings,
visit us at www.thermo.com.
Laboratory Solutions Backed by Worldwide Service and Support
Visit the Chromatography Resource Center at: www.thermo.com/columns