method 552 determination of haloacetic · pdf file552-2 method 552 determination of haloacetic...
TRANSCRIPT

552-1
METHOD 552
DETERMINATION OF HALOACETIC ACIDS IN DRINKING WATER BY LIQUID-LIQUID EXTRACTION, DERIVATIZATION, AND GAS CHROMATOGRAPHY
WITH ELECTRON CAPTURE DETECTION
July 1990
Jimmie W. Hodgeson
J. Collins (Technology Applications Inc.)R.E. Barth (Technology Applications Inc.)
ENVIRONMENTAL MONITORING SYSTEMS LABORATORYOFFICE OF RESEARCH AND DEVELOPMENT
U.S. ENVIRONMENTAL PROTECTION AGENCYCINCINNATI, OHIO 45268

552-2
METHOD 552
DETERMINATION OF HALOACETIC ACIDS IN DRINKING WATER BY LIQUID-LIQUID EXTRACTION, DERIVATIZATION, AND GAS CHROMATOGRAPHY
WITH ELECTRON CAPTURE DETECTION
1.0 SCOPE AND APPLICATION
1.1 This is a gas chromatographic (GC) method applicable to the determination1-4,11
of the listed halogenated acetic acids in drinking water, ground water, rawwater and any intermediate treatment stage. In addition, the chlorinatedphenols listed may be analyzed by this method.
Analyte Registry NumberChemical Abstract Services
Monochloroacetic Acid 79-11-8Dichloroacetic Acid 79-43-6Trichloroacetic Acid 76-03-9Monobromoacetic Acid 79-08-3Bromochloroacetic Acid 5589-96-3Dibromoacetic Acid 631-64-12,4-Dichlorophenol 120-83-22,4,6-Trichlorophenol 88-06-2
1.2 This method is applicable to the determination of these analytes over theconcentration ranges typically found in drinking water , subject to the1,2,4
method detection limits (MDL) listed in Table 2. The detection limits observedmay vary according to the particular matrix analyzed and the specificinstrumentation employed. The haloacetic acids are observed ubiquitously inchlorinated supplies at concentrations normally within the spiking level rangesin Tables 2-5.
1.3 Tribromoacetic acid has not been included because of problems with extractionand chromatography by this method. The mixed bromochloroacetic acids haverecently been synthesized. The bromochloroacetic acid is present inchlorinated supplies and method validation data are provided herein. However, neat material for this compound is not readily available. The mixedtrihalogenated acids may also be present. These are not included because ofcurrent problems with sample purity and the chromatography for these twocompounds.
1.4 The 2-chlorophenol has not been included as a method analyte in the abovelist, primarily because its realistic detection limit in environmental samples islikely to be above the odor threshold. Poor precision is usually obtained forthis compound at even higher levels. In addition, this analyte displays

552-3
instability under the dechlorination/preservation conditions described herein. Nevertheless, some method validation data are given in Tables 2-7.
1.5 This method is designed for analysts skilled in liquid-liquid extractions, extractconcentration techniques, derivatization procedures and the use of GC andinterpretation of gas chromatograms.
1.6 When this method is used for the analyses of waters from unfamiliar sources,analyte identifications must be confirmed by at least one additional qualitativetechnique, such as GC/mass spectroscopy (MS) or by GC using dissimilarcolumns.
2.0 SUMMARY OF METHOD
2.1 A 100 mL volume of sample is adjusted to pH 11.5 and extracted with methyl-tert-butyl ether (MTBE) to remove neutral and basic organic compounds. Theaqueous sample is then acidified to pH 0.5 and the acids are extracted intoMTBE. After the extract is dried and concentrated, the acids are converted totheir methyl esters with diazomethane (DAM). Excess DAM is removed andthe methyl esters are determined by capillary GC using an electron capturedetector (ECD). An alternative microextraction procedure is also offered inwhich a 30 mL sample is extracted without cleanup with a single 3 mL aliquotof MTBE for direct analysis by GC-ECD after methylation. Samples containinghigh concentrations of haloacetic acids and other disinfection byproducts, orother potentially interfering organic compounds, may require the samplecleanup.
3.0 DEFINITIONS
3.1 Internal Standard -- A pure analyte(s) added to a solution in known amount(s)and used to measure the relative responses of other method analytes andsurrogates that are components of the same solution. The internal standardmust be an analyte that is not a sample component.
3.2 Surrogate Analyte -- A pure analyte(s), which is extremely unlikely to befound in any sample, and which is added to a sample aliquot in knownamount(s) before extraction and is measured with the same procedures used tomeasure other sample components. The purpose of a surrogate analyte is tomonitor method performance with each sample.
3.3 Laboratory Duplicates (LD1 and LD2) -- Two sample aliquots taken in theanalytical laboratory and analyzed separately with identical procedures.Analyses of LD1 and LD2 give a measure of the precision associated withlaboratory procedures, but not with sample collection, preservation, or storageprocedures.

552-4
3.4 Field Duplicates (FD1 and FD2) -- Two separate samples collected at the sametime and place under identical circumstances and treated exactly the samethroughout field and laboratory procedures. Analyses of FD1 and FD2 give ameasure of the precision associated with sample collection, preservation andstorage, as well as with laboratory procedures.
3.5 Laboratory Reagent Blank (LRB) -- An aliquot of reagent water that is treatedexactly as a sample including exposure to all glassware, equipment, solvents,reagents, internal standards, and surrogates that are used with other samples. The LRB is used to determine if method analytes or other interferences arepresent in the labora-tory environment, the reagents, or the apparatus.
3.6 Field Reagent Blank (FRB) -- Reagent water placed in a sample container in thelaboratory and treated as a sample in all respects, including exposure tosampling site conditions, storage, preservation and all analytical procedures.The purpose of the FRB is to determine if method analytes or otherinterferences are present in the field environment.
3.7 Laboratory Fortified Blank (LFB) -- An aliquot of reagent water to whichknown quantities of the method analytes are added in the laboratory. The LFBis analyzed exactly like a sample, and its purpose is to determine whether themethodology is in control, and whether the laboratory is capable of makingaccurate and precise measurements at the required method detection limit.
3.8 Laboratory Fortified Sample Matrix (LFM) -- An aliquot of an environmentalsample to which known quantities of the method analytes are added in thelaboratory. The LFM is analyzed exactly like a sample, and its purpose is todetermine whether the sample matrix contributes bias to the analytical results.The background concentrations of the analytes in the sample matrix must bedetermined in a separate aliquot and the measured values in the LFMcorrected for background concentrations.
3.9 Stock Standard Solution -- A concentrated solution containing a single certifiedstandard that is a method analyte, or a concentrated solution of a singleanalyte prepared in the laboratory with an assayed reference compound. Stockstandard solutions are used to prepare primary dilution standards.
3.10 Primary Dilution Standard Solution -- A solution of several analytes preparedin the laboratory from stock standard solutions and diluted as needed toprepare calibration solutions and other needed analyte solutions.
3.11 Calibration Standard (CAL) -- A solution prepared from the primary dilutionstandard solution and stock standard solutions of the internal standards andsurrogate analytes. The CAL solutions are used to calibrate the instrumentresponse with respect to analyte concentration.

552-5
3.12 Quality Control Sample (QCS) -- A sample matrix containing method analytesor a solution of method analytes in a water miscible solvent which is used tofortify reagent water or environmental samples. The QCS is obtained from asource external to the laboratory, and is used to check laboratory performancewith externally prepared test materials.
4.0 INTERFERENCES
4.1 Method interferences may be caused by contaminants in solvents, reagents,glassware and other sample processing apparatus that lead to discrete artifactsor elevated baselines in gas chromatograms. All reagents and apparatus mustbe routinely demonstrated to be free from interferences under the conditions ofthe analysis by analyzing laboratory reagent blanks as described inSection 10.2. Subtracting blank values from sample results is not permitted.
4.1.1 Glassware must be scrupulously cleaned . Clean all glassware as soon5
as possible after use by thoroughly rinsing with the last solvent used init. Follow by washing with hot water and detergent and thoroughrinsing with tap water, dilute acid, and reagent water. Drain and heatin an oven or muffle furnace at 400°C for one hour. Do not heatvolumetric ware. Thermally stable materials such as PCBs might not beeliminated by this treatment. Thorough rinsing with reagent gradeacetone may be substituted for the heating. After drying and cooling,seal and store glassware in a clean environment to prevent anyaccumulation of dust or other contaminants. Store inverted or cappedwith aluminum foil.
4.1.2 The use of high purity reagents and solvents helps to minimizeinterference problems. Purification of solvents by distillation in all-glass systems may be required. The extraction solvent, MTBE, mayneed to be redistilled.
4.2 Whereas the 2,4,6-trichlorophenol is converted quantitatively to thecorresponding anisole by the methylation procedure (Section 11.3), the 2,4 -dichlorophenol is only partially converted (10-20%). The 2,4 dichloroanisolepartially coelutes with the 2,4,6-trichloroanisole on the DB-1701 primarycolumn with the chromatographic conditions employed (Table 1). The2,4-dichlorophenol is quantitated on the phenol peak. The extent ofinterference of the dichloroanisole with the 2,4,6-trichlorophenol analysis isinsignificant (0.8%) when these compounds are present at equal concentrations. For samples in which the 2,4-dichlorophenol concentration appearssignificantly higher than that of the 2,4,6-trichlorophenol, e.g., greater than afactor of 15, analyses should be performed on the DB-210 confirmationcolumn, on which these compounds are completely resolved.
4.3 The acid forms of the analytes are strong organic acids which react readilywith alkaline substances and can be lost during sample preparation. Glassware and glass wool must be acid-rinsed with (1+9) hydrochloric acid,

552-6
and the sodium sulfate must be acidified (see Section 7.6) with sulfuric acidprior to use to avoid analyte losses due to adsorption.
4.4 Organic acids and phenols, especially chlorinated compounds, cause the mostdirect interference with the determination. The addition of base andsubsequent extraction of the basic sample removes many neutral and basicchlorinated hydrocarbons and phthalate esters that might otherwise interferewith the electron capture analysis.
4.5 Interfering contamination may occur when a sample containing lowconcentrations of analytes is analyzed immediately following a samplecontaining relatively high concentrations of analytes. Routine between-samplerinsing of the sample syringe and associated equipment with MTBE canminimize sample cross contamination. After analysis of a sample containinghigh concentrations of analytes, one or more injections of MTBE should bemade to ensure that accurate values are obtained for the next sample.
4.6 Matrix interferences may be caused by contaminants that are coextracted fromthe sample. The extent of matrix interferences will vary considerably fromsource to source, depending upon the water sampled. Positive identificationsshould be confirmed using the confirmation column specified in Table 1 or bythe use of gas chromatography with mass spectrometric detection.
5.0 SAFETY
5.1 The toxicity or carcinogenicity of each reagent used in this method has notbeen precisely defined; however, each chemical compound must be treated asa potential health hazard. From this viewpoint, exposure to these chemicalsmust be reduced to the lowest possible level by whatever means available. The laboratory is responsible for maintaining a current awareness file of OSHAregulations regarding the safe handling of the chemicals specified in thismethod. A reference file of material data handling sheets should also be madeavailable to all personnel involved in the chemical analysis. Additionalreferences to laboratory safety are available and have been identified for the6-8
information of the analyst.
5.2 Diazomethane is a toxic carcinogen and can explode under certain conditions,when produced in a purified or highly concentrated form. In this form, thefollowing safety precautions must be followed.
5.2.1 Use only in a well ventilated hood. Do not breathe vapors.
5.2.2 Use a safety screen. Wear protective clothing and a shielded safetyhood.
5.2.3 Use mechanical pipetting aides.
5.2.4 Do not heat above 90°C.

552-7
5.2.5 Avoid grinding surfaces, ground glass joints, sleeve bearings, glassstirrers.
5.2.6 Store away from alkali metals.
5.2.7 Solutions of diazomethane decompose rapidly in the presence of solidmaterials such as copper powder, calcium chloride, and boiling chips.
5.3 For the above reasons, the diazomethane generation apparatus used in theesterification procedure specified in this method produces only micromolar3
amounts of diazomethane in very dilute solution (Section 11.3) to minimizesafety hazards. In this form, the solution is not explosive. Nevertheless, thefollowing precautions should be followed.
5.3.1 Use only in a well ventilated hood.
5.3.2 When handling the diazomethane solution, avoid contact with skin. Ifcontact is made, immediately wash the exposed area with warm water.
5.3.3 Collect and store the diazomethane solution produced at 0°C tominimize losses due to decomposition.
5.4 The toxicity of the extraction solvent, MTBE, has not been well defined. Susceptible individuals may experience adverse affects upon skin contact orinhalation of vapors. For such individuals a mask may be required. Protectiveclothing and gloves should be used and MTBE should be used only in achemical fume hood or glove box.
6.0 APPARATUS AND EQUIPMENT (All specifications in Sections 6.0 and 7.0 aresuggested. Catalog numbers are provided for illustration only.)
6.1 Separatory Funnels -- 250 mL, with TFE fluorocarbon stopcocks, ground glassor TFE fluorocarbon stoppers.
6.2 Screw Cap -- 40 mL vials (Pierce #13219 or equivalent). Screw caps shouldhave TFE fluorocarbon liners.
6.3 Balance -- Analytical, capable of weighing to 0.0001 g.
6.4 Diazomethane Generator -- The generator assembly is shown in Figure 1 alongwith the diazomethane collection vessel. There are some diazomethanegenerating kits commercially available. One is the Aldrich Diazald Kit, PartNo. Z10,025-0; also see Aldrichim Acta, 1983, 16 for a review of the1,3
preparation and reactions of diazomethane.
6.5 Six or 12 Position Analytical Concentrator -- Organomation, N-EVAP Model#111/6917 or equivalent.

552-8
6.6 Gas Chromatograph -- Analytical system complete with gas chromatographequipped for electron capture detection, split/splitless capillary injection,temperature programming, differential flow control, and with all requiredaccessories including syringes, analytical columns, gases and strip-chartrecorder. A data system is recommended for measuring peak areas. Anautoinjector is recommended for improved precision of analyses. The gasesflowing through the election capture detector should be vented through thelaboratory fume hood system.
6.7 Vials -- Amber glass, 7-10 mL capacity with TFE-fluorocarbon lined screw cap.
6.8 Primary GC Column -- DB-1701 or equivalent bonded, fused silica column,30m x 0.32mm ID, 0.25 µm film thickness.
6.9 Confirmatory GC Column -- DB-210 or equivalent bonded, fused silica column,30 m x 0.32 mm ID, 0.50 µm film thickness.
6.10 Pasteur Pipets -- Glass disposable, 5¾" length wide bore diameter. (BaxterScientific Products Giant-Pette-Pipets, Cat. No. P5240-1 or equivalent)
6.11 Volumetric Ware -- 5 mL.
6.12 pH Meter -- Wide range with the capability of accurate pH measurements inthe 0-1 and 11-12 ranges. The use of separate glass pH electrode and calomelreference electrode facilitates this measurement.
7.0 REAGENTS AND CONSUMABLE MATERIALS
7.1 Glass Wool -- Acid washed, Heat to 400°C for one hour.
7.2 Reagent Water -- Reagent water is defined as a water in which an interferenceis not observed at the method detection limit of each parameter of interest.
7.2.1 A Milli-pore Super-Q water system or its equivalent may be used togenerate deionized reagent water. Distilled water that has beencharcoal filtered may also be suitable.
7.2.2 Test reagent water each day it is used by analyzing according toSection 11.0.
7.3 Methanol -- Pesticide quality or equivalent.
7.4 Ethyl Ether -- Nanograde, redistilled in glass if necessary. Ethers must be freeof peroxides as indicated by EM Quant test strips, available from EM Science,Gibbstown, NJ. Procedures recommended for removal of peroxides areprovided with the test strips. Ethers must be periodically tested (monthly) forperoxide formation during use.

552-9
7.5 Methyl-Tert-Butyl Ether -- Nanograde, redistilled in glass if necessary. Thesame peroxide precautions as in Section 7.4 apply to this ether.
7.6 Sodium Sulfate -- ACS, granular, acidified, anhydrous. Heat in a shallow trayat 400°C for a minimum of four hours to remove phthalates and otherinterfering organic substances. Alternatively, extract with methylene chloridein a Soxhlet apparatus for 48 hours. Acidify by slurrying 100 g sodium sulfatewith just enough ethyl ether to cover the solid. Add 0.1 mL concentratedsulfuric acid and mix thoroughly. Remove the ether under vacuum or allow toevaporate in a loosely covered beaker in a hood. Mix 1 g of the resulting solidwith 5 mL of reagent water and measure the pH of the mixture. It must bebelow pH 4. Store at 130°C.
7.7 Sulfuric Acid Solution (1+1) -- Slowly add 50 mL H SO (sp. gr. 1.84) to 50 mL2 4
of reagent water.
7.8 Sodium Hydroxide (NaOH), 1N -- Dissolve 4 g ACS grade in reagent waterand dilute up to 100 mL in a 100 mL volumetric flask.
7.9 Potassium Hydroxide (KOH), 37% -- Dissolve 37 g of ACS grade in reagentwater and dilute up to 100 mL in a 100 mL volumetric flask.
7.10 Carbitol -- (Diethylene glycol monoethyl ether), ACS. Available from AldrichChemical Co.
7.11 Diazald -- (N-methyl-N-nitroso-p-toluenesulfonamide), ACS. Available fromAldrich Chemical Co.
7.12 Diazald Solution -- Prepare a solution containing 10 g Diazald in 100 mL of a50:50 by volume mixture of ethyl ether and carbitol. This solution is stable forone month or longer when stored at 4°C in an amber colored bottle with aTeflon-lined screw cap.
7.13 Silica Gel -- Chromatographic grade, nominal 100 mesh. Heat to 400°C forfour hours. Store at 130°C.
7.14 Acetone -- ACS reagent grade or equivalent.
7.15 Ammonium Chloride -- ACS reagent grade or equivalent.
7.16 Sodium Sulfite -- ACS reagent grade or equivalent.
7.17 1,2,3-Trichloropropane -- Aldrich Chemical, 99+%.
7.18 3,5-Dichlorobenzoic Acid -- Aldrich Chemical, 99%.
7.19 Copper (II) Sulfate Pentahydrate -- ACS reagent grade or equivalent.

552-10
8.0 SAMPLE COLLECTION, PRESERVATION AND STORAGE
8.1 Grab samples must be collected in accordance with conventional samplingpractices using glass containers with TFE-lined screw-caps and capacities in9
excess of 100 mL.
8.1.1 Prior to shipment to the field, to combine residual chlorine, addcrystalline ammonium chloride (NH Cl) to the sample container in an4
amount to produce a concentration of 100 mg/L in the sample.Alternatively, add 1.0 mL of a 10 mg/mL aqueous solution of NH Cl to4
the sample bottle for each 100 mL of sample bottle capacityimmediately prior to sample collection. Granular ammonium chloridemay also be added directly to the sample bottle.
8.1.2 After collecting the sample in the bottle containing the dechlorinationreagent, seal the bottle and agitate for one minute.
8.1.3 Samples must be iced or refrigerated at 4°C and maintained at theseconditions away from light until extraction. Holding studies performedto date have suggested that, in samples dechlorinated with NH Cl, the4
analytes are stable for up to 28 days. Since stability may be matrixdependent, the analyst should verify that the prescribed preservationtechnique is suitable for the samples under study.
8.1.4 Dried extract concentrates (Section 11.3.6) should be stored at 0-4°C away from light in glass vials with TFE-faced caps. Extracts should beanalyzed within 48 hours following preparation.
9.0 CALIBRATION
9.1 Establish GC operating parameters equivalent to specifications in Table 1. TheGC system must be calibrated using the internal standard (IS) technique.
9.2 Internal Standard Calibration Procedure -- This approach requires the analystto select one or more internal standards which are compatible in analyticalbehavior with the method analytes. For the single laboratory precision andaccuracy data reported in Tables 2-7, one internal standard(1,2,3-trichloropropane) was employed. The concentration of the internalstandard used in obtaining these data was 0.4 µg/mL in the final 5.0 mLconcentrate (Section 11.3.3).
9.2.1 Prepare separate stock standard solutions for each compound of interestat a concentration of 1-5 mg/mL in MTBE solvent. Method analytesmay be obtained as neat materials or ampulized solutions (>99% purity)from a number of commercial suppliers.

552-11
9.2.2 Prepare primary dilution standard solutions by combining and dilutingstock calibration standards with MTBE. The primary dilution standardsare used to prepare calibration standards, which comprise at least threeconcentration levels (optimally five) of each analyte with the loweststandard being at or near the method detection limit of each analyte. The concentrations of the other standards should define a rangecontaining the expected sample concentrations or the working range ofthe detector.
9.2.2.1 Calibration standards for 100 mL sample extraction(Section 11.1). These standards are prepared in the final 5 mLMTBE extract form and thus are not subject to the extractionprocedure. These standards must be esterified according to theprocedure beginning in Section 11.3.3. Thus, the individualcalibration standards are initially prepared in approximately4 mL MTBE to allow for the addition of diazomethane solutionand the final dilution to 5.0 mL as called for in Section 11.3.3.2.
NOTE: The concentrations of the 5 mL calibration standardsmust be equivalent, after correction for the concentration factor,to aqueous standards which span the concentration range calledfor in Section 9.2.2.
9.2.2.2 Calibration standards for 30 mL (Microextraction) Samples(Section 11.2). In this procedure, aqueous standards areprepared by dilution of primary dilution standards with reagentwater. These aqueous standards are treated and extracted in thesame manner as the samples according to Section 11.2. The final2 mL extract is esterified according to the procedure beginningin Section 11.3.4.
9.2.3 Include a surrogate analyte within the calibration standards prepared inSection 9.2.2. Both 3,5-dichlorobenzoic acid and 2,3-dichloropropanoicacid have been used as surrogate analytes in this method.
9.2.4 Inject 2 µL of each standard and calculate the relative response for eachanalyte (RR ) using the equation:a
RR = A /Aa a is
where: A = the peak area of the analyte.a
A = the peak area of the internal standard.is
9.2.5 Generate a calibration curve of RR versus analyte concentration of thea
standards expressed in equivalent µg/L in the original aqueous sample. The working calibration curve must be verified daily by measurementof one or more calibration standards. If the response for any analytefalls outside the predicted response by more than 15%, the calibration

552-12
check must be repeated using a freshly prepared calibration standard. Should the retest fail, a new calibration curve must be generated.
10.0 QUALITY CONTROL
10.1 Minimum quality control (QC) requirements are initial demonstration oflaboratory capability, determination of surrogate compound recoveries in eachsample and blank, monitoring internal standard peak area or height in eachsample and blank, analysis of laboratory reagent blanks, laboratory fortifiedblanks, laboratory fortified sample matrices, and QC samples. Additionalquality control practices are recommended.
10.2 Laboratory Reagent Blanks (LRB) -- Before processing any samples, the analystmust analyze at least one LRB to demonstrate that all glassware and reagentinterferences are under control. In addition, each time a set of samples isextracted or reagents are changed, a LRB must be analyzed. If within theretention time window (Section 11.4.4) of any analyte, the LRB produces apeak that would prevent the determination of that analyte, determine thesource of contamination and eliminate the interference before processingsamples.
10.3 Initial Demonstration of Capability
10.3.1 Select a representative fortified concentration for each of the targetanalytes. Concentrations near Level 3 (Table 4) are recommended. Prepare a laboratory control (LC) sample concentrate in methanol1000 times more concentrated than the selected concentration. With asyringe, add 100 µL of the LC sample concentrate to each of four toseven 100 mL aliquots of reagent water. Analyze the aliquots accordingto the method beginning in Section 11.0 and calculate mean recoveriesand standard deviation for each analyte.
10.3.2 Calculate the mean percent recovery (R) and the standard deviation ofthe recovery (S ). For each analyte, the mean recovery values for allR
must fall in the range of R ±30% (or within R ±3S if broader) using theR
values for R and S for reagent water in Table 4. The standardR
deviation should be less than ±30% or 3S , whichever is larger. ForR
those compounds that meet these criteria, performance is consideredacceptable and sample analysis may begin. For those compounds thatfail these criteria, this procedure must be repeated using a minimum offive fresh samples until satisfactory performance has beendemonstrated.
10.3.3 The initial demonstration of capability is used primarily to preclude alaboratory from analyzing unknown samples via a new, unfamiliarmethod prior to obtaining some experience with it. It is expected thatas laboratory personnel gain experience with this method, the quality ofdata will improve beyond those required here.

552-13
10.3.4 The analyst is permitted to modify GC columns, GC conditions,detectors, extraction techniques, concentration techniques (i.e.,evaporation techniques), internal standard or surrogate compounds. Each time such method modifications are made, the analyst must repeatthe procedures in Section 10.3.1.
10.4 Assessing Surrogate Recovery
10.4.1 When surrogate recovery from a sample or method blank is <70% or>130%, check (1) calculations to locate possible errors, (2) standardsolutions for degradation, (3) contamination, and (4) instrumentperformance. If those steps do not reveal the cause of the problem,reanalyze the extract.
10.4.2 If the extract reanalysis fails the 70-130% recovery criterion, the problemmust be identified and corrected before continuing.
10.4.3 If the extract reanalysis meets the surrogate recovery criterion, reportonly data for the analyzed extract. If sample extract continues to failthe recovery criterion, report all data for that sample as suspect.
10.4.4 Develop and maintain control charts on surrogate recovery asdescribed in Section 10.6.2. Charting of surrogate recoveries isan especially valuable activity, since these are present in everysample and the analytical results will form a significant recordof data quality.
10.5 Assessing the Internal Standard
10.5.1 When using the internal standard calibration procedure, the analyst isexpected to monitor the IS response (peak area or peak height) of allsamples during each analysis day. The IS response for any samplechromatogram should not deviate from daily calibration standard's ISresponse by more than 30%.
10.5.2 If >30% deviation occurs with an individual extract, optimizeinstrument performance and inject a second aliquot of that extract.
10.5.2.1 If the reinjected aliquot produces an acceptable internalstandard response, report results for that aliquot.
10.5.2.2 If a deviation of greater than 30% is obtained for thereinjected extract, analysis of the samples should berepeated beginning with Section 11.0, provided thesample is still available. Otherwise, report resultsobtained from the reinjected extract, but annotate assuspect.

552-14
10.5.3 If consecutive samples fail the IS response acceptance criterion,immediately analyze a calibration check standard.
10.5.3.1 If the check standard provides a response factor (RF)within 20% of the predicted value, then followprocedures itemized in Section 10.5.2 for each samplefailing the IS response criterion.
10.5.3.2 If the check standard provides a response factor whichdeviates more than 20% of the predicted value, then theanalyst must recalibrate, as specified in Section 9.0.
10.6 Laboratory Fortified Blank (LFB)
10.6.1 The laboratory must analyze at least one LFB sample with every20 samples or one per sample set (all samples extracted within a24-hour period), whichever is greater. Fortified concentrations nearLevel 3 (Table 4) are recommended. Calculate accuracy as percentrecovery (R). If the recovery of any analyte falls outside the controllimits (see Section 10.6.2), that analyte is judged out of control, and thesource of the problem should be identified and resolved beforecontinuing analyses.
10.6.2 Prepare control charts based on mean upper and lower control limits,R ±3 S . The initial demonstration of capability (Section 10.3)R
establishes the initial limits. After each four to six new recoverymeasurements, recalculate R and S using all the data, and constructR
new control limits. When the total number of data points reach 20,update the control limits by calculating R and S using only the mostR
recent 20 data points. At least quarterly, replicates of LFBs should beanalyzed to determine the precision of the laboratory measurements. Add these results to the ongoing control charts to document dataquality.
10.7 Laboratory Fortified Sample Matrix
10.7.1 The laboratory must add known concentrations of analytes to aminimum of 10% of the routine samples or one concentration persample set, whichever is greater. The concentrations should be equal toor greater than the background concentrations in the sample selectedfor fortification. Ideally, the concentration should be the same as thatused for the laboratory fortified blank (Section 10.6). Over time,samples from all routine sample sources should be fortified.
10.7.2 Calculate the mean percent recovery, R, of the concentration for eachanalyte, after correcting the total mean measured concentration, A, fromthe fortified sample for the back-ground concentration, B, measured inthe unfortified sample, i.e.:
552-15
R = 100 (A - B) / C,
where: C = the fortifying concentration.
Compare these values to control limits appropriate for reagent waterdata collected in the same fashion (Section 10.6).
10.7.3 If the analysis of the unfortified sample reveals the absence ofmeasurable background concentrations, and the added concentrationsare those specified in Section 10.6, then the appropriate control limitswould be the acceptance limits in Section 10.6.
10.7.4 If the sample contains measurable background concentrations ofanalytes, calculate mean recovery of the fortified concentration, R, foreach such analyte after correcting for the background concentration.
R = 100 (A - B)/C
Compare these values to reagent water recovery data, R*, at comparablefortified concentrations from Tables 3-5. Results are consideredcomparable if the measured recoveries fall within the range,
R* ±3S ,c
where S = the estimated percent relative standard deviation in thec
measurement of the fortified concentration.
By contrast to the measurement of recoveries in reagent water(Section 10.6.2) or matrix samples without background (Section 10.7.3),the relative standard deviation, S , must be expressed as the statisticalc
sum of variation from two sources, the measurement of the totalconcentration as well as the measurement of background concentration. In this case, variances, defined as S , are additive and S can be2
c
expressed as,
S = S + S c a b2 2 2
or S = (S + S ) ,c a b2 2 1/2
where S and S = the percent relative standard deviations of the totala b
measured concentration and the background concentration respectively.
The value of S may be estimated from the mean measurement of Aa
above or from data at comparable concentrations from Tables 3-5. Likewise, S can be measured from repetitive measurements of theb
background concentration or estimated from comparable concentrationdata from Tables 2-5.

552-16
10.7.5 If the recovery of any such analyte falls outside the designated range,and the laboratory performance for that analyte is shown to be incontrol (Section 10.6), the recovery problem encountered with thefortified sample is judged to be matrix related, not system related. Theresult for that analyte in the unfortified sample is labeledsuspect/matrix to inform the data user that the results are suspect dueto matrix effects.
10.8 Quality Control Sample (QCS) -- At least quarterly, analyze a QCS from anexternal source. If measured analyte concentrations are not of acceptableaccuracy, check the entire analytical procedure to locate and correct theproblem source.
10.9 The laboratory may adapt additional quality control practices for use with thismethod. The specific practices that are most productive depend upon theneeds of the laboratory and the nature of the samples. For example, field orlaboratory duplicates may be analyzed to assess the precision of theenvironmental measurements or field reagent blanks may be used to assesscontamination of samples under site conditions, transportation and storage.
11.0 PROCEDURE
11.1 Sample Preparation -- 100 mL sample. This procedure employs a samplecleanup step, serial extraction with MTBE, extract concentration and dryingprior to esterification (Section 11.3.3). In this procedure, sample standards areprepared in the final 5 mL extract form prior to esterification.
11.1.1 Remove the samples from storage (Section 8.1.3) and allow toequilibrate to room temperature.
11.1.2 Transfer 100 mL of sample with a pipet to a 250 mL separatory funnel. Add 1 mL of 1.0 N NaOH solution. Remove an aliquot and measurepH, which should be approximately 11.5.
11.1.3 Optional -- Add 100 µL of surrogate fortifying solution (5 µg/mL of3,5-dichlorobenzoic acid or 2,3-dibromo-propanoic acid in methanol) toeach sample including standards and blanks.
11.1.4 Return the aliquot to the separatory funnel.
NOTE: If sufficient sample is available, use a separate 100 mL sampleto measure the basic pH and to determine the amount of H SO2 4
required.
The measurement of pH should be done with the wide range pH meterdescribed in Section 6.12. Add 30 mL MTBE. Extract the sample onetime by vigorously shaking the funnel for two minutes with periodicventing to release excess pressure. Allow the organic layer to separate
552-17
from the water phase for a minimum of 10 minutes. If the emulsioninterface between layers is more than one-third the volume of thesolvent layer, the analyst must employ mechanical techniques tocomplete the phase separation. The optimum technique depends uponthe sample, but may include stirring, filtration of the emulsion throughglass wool, centrifugation, or other physical methods. Discard theorganic phase and return the aqueous phase to the 250 mL separatoryfunnel.
11.1.5 Add sufficient 1:1 H SO in reagent water (ca. 15-20 mL) to adjust the2 4
pH to pH ≤0.5. Add 15 mL of MTBE and extract for two minutes as inSection 11.1.3. Allow the phases to separate for 10 minutes. If anemulsion persists employ the same procedures for separation as inSection 11.1.3. Separate the phases and collect the MTBE phase in a40 mL screw cap vial (Section 6.2). Add 15 mL of MTBE to the sampleand repeat the extraction a second time. Combine the extracts in the40 mL vial.
11.1.6 Extract concentration -- Evaporate the solvent at room temperature to avolume of 1-2 mL under a gentle stream of dry nitrogen. Under theseconditions the sample cools during evaporation and some condensationwill be observed on the outside of the vial. Alternately place the vialsin a water bath maintained at 35°C and concentrate to a minimumvolume of 2 mL. The method validation data in Tables 2-7 wereobtained with the former technique. These gentle concentrationconditions are necessary because of the volatility of the monohaloaceticacids.
11.1.7 Extract drying technique
11.1.7.1 Prepare sodium sulfate drying tubes by inserting a smallpiece of acid washed glass wool into the bottom,restricted, end of a wide bore, Pasteur pipet(Section 6.10).
11.1.7.2 Add a column of approximately 5 cm acidified sodiumsulfate. Tap pipet gently to pack sodium sulfate.
11.1.7.3 Immediately, using another Pasteur pipet, transfer the1-2 mL MTBE extract from the 40 mL vial into the top ofthe drying tube. A small amount of separated waterphase will likely be present in the bottom of the 40 mLvial. Avoid transferring any of the water phase. Examine the lower portion of the Pasteur pipet to seewhether a separate water phase is present. Collect driedextract in a 5.0 mL volumetric flask.

552-18
11.1.7.4 Rinse sides of 40 mL sample tube with approximately0.7 mL of clean MTBE. Transfer this MTBE into thedrying tube using the same pipet as in Step 3.
11.1.7.5 Repeat Step 4 until the volumetric flask contains3.8-4.0 mL.
11.2 Sample Preparation -- 30 mL sample. Without employing any sample cleanup,a 30 mL aliquot is salted and extracted with a single aliquot of MTBE. Theextract is esterified directly, without a prior drying step. Aqueous standardsare also processed through the complete procedure .11
11.2.1 Remove the samples from storage and allow them to equilibrate toroom temperature.
11.2.2 Transfer 30 mL sample or standard with a pipet to a 40 mL vialequipped with a Teflon-faced screw cap. A slightly larger vial might bemore suitable.
11.2.3 Optional -- Add 30 µL of surrogate spiking solution (10 µg/mL2,3-dibromopropanoic acid in methanol) to each sample includingstandards and blanks.
11.2.4 Add 1.5-3.0 mL concentrated sulfuric acid to lower the pH to less than0.5. The analyst must verify that the pH is less than 0.5.
11.2.5 Add accurately 3.0 mL methyl tertiary butyl ether (MTBE) using apipet.
11.2.6 Add 3 g copper (II) sulfate pentahydrate, followed by 12 g acidifiedsodium sulfate, carefully to prevent splashing the MTBE. The bluecolor of the copper sulfate solution facilitates observation of the phaseinterface when the organic extract is transferred in Section 11.2.10.
11.2.7 Cap all vials immediately, and shake by hand to break up clumps.Vent, recap, and lay vials on their sides until all vials have beenshaken. Clumps of undissolved salt will cause loss of analytes.
11.2.8 Place vials in a mechanical shaker and shake for approximately30 minutes. Required shaking time will vary from shaker to shaker.Shaking by hand is perfectly acceptable. The required time for this willhave to be established during the initial demonstration of capability.
11.2.9 Remove vials from shaker and allow to stand for five minutes for phaseseparation.
11.2.10 Transfer exactly 2.0 mL of the ether extract (top layer) using a pipetinto a 2.0 mL volumetric flask.

552-19
Be careful to not include any water.
11.2.11 Using a stream of clean, dry nitrogen, evaporate approximately0.3 mL of MTBE from the flask to make room for the addition ofdiazomethane and internal standard (Section 11.3.4.2).
11.3 Esterification of Acids
11.3.1 Assemble the diazomethane generator shown in Figure 1 in a hood. The collection vessel is a 10-15 mL vial, equipped with a Teflon-linedscrew cap and maintained at 0-5°C. It is perfectly acceptable to use acommercially available diazomethane generator in place of the oneshown in Figure 1.
11.3.2 Add a sufficient amount of ethyl ether to Tube 1 to cover the firstimpinger. Add 5 mL of MTBE to the collection vial. Set the nitrogenflow at 5-10 cm /min. Add 2 mL Diazald solution and 1.5 mL of 37%3
KOH solution to the second impinger. Connect the tubing as shownand allow the N flow to purge the diazomethane from the reaction2
vessel into the collection vial for 30 minutes. Cap the vial whencollection is complete and maintain at 0-5°C. When stored at 0-5°C thisdiazomethane solution may be used over a period of 48 hours.
11.3.3 Esterification of 100 mL Extract (from Section 11.1.7.5)
11.3.3.1 Fortify the sample (Section 11.1.7.5) and standard(Section 9.2.2.1) extracts with identical volumes of theinternal standard(s). The appropriate amount of internalstandard is dependent on the calibration range. As ageneral rule, the internal standard response should beapproximately equal to the response produced by themiddle trichloroacetic acid calibration standard. For thevalidation data in Table 3-7, 20 µL of a 100 µg/mLinternal standard solution in MTBE were added to the5.0 mL concentrate to yield a concentration of 0.4 µg/mL.
11.3.3.2 Add 100 µL methanol and 500 µL of cold diazomethanesolution (Section 11.3.2). A persistent pale yellow colorafter the addition of diazomethane indicates that anexcess was available for esterification of the analytes. Ifthis is not obtained, continue adding successive 50 µLaliquots of diazomethane solution until the persistentyellow color is obtained. Dilute to a final volume of5.0 mL with MTBE.

552-20
11.3.4 Esterification of 30 mL extract (from Section 11.2.11).
11.3.4.1 Add 20 µL of a 20 µg/mL solution of1,2,3-trichloropropane in methanol as the internalstandard to the extract from aqueous standards orsamples (Section 11.2.11).
11.3.4.2 Add 250 µL of cold diazomethane solution(Section 11.3.2). A persistent yellow colorrepresenting excess diazomethane should beobserved in the solution. The final extract volumeshould be 2.0 mL.
11.3.5 Allow the sample from Section 11.3.3.2 or 11.3.4.2 to remain in contactwith dizaoamethane for 30 minutes. Remove any unreacteddiazomethane by addition of 0.2 g silica gel. Effervescence due tonitrogen evolution is a further indication that excess diazomethane ispresent. Mix gently by inverting once.
11.3.6 After a contact time of 15-20 minutes, transfer a portion of the extractsolution to an appropriate vial for injection into the GC. A duplicateGC vial may be filled from excess sample extract, if desired. Analyzethe samples as soon as possible. Alternatively, the sample extract, afterremoval from the silica gel, may be stored for 48 hours at 0-4°C awayfrom light in glass vials with TFE-lined caps.
11.4 Gas Chromatography
11.4.1 Table 1 summarizes the recommended operating conditions for the GC. Included in Table 1 are the retention times observed using this method. An example of the separation achieved using these conditions is shownin Figure 2. Other GC columns, chromatographic conditions, ordetectors may be used if the requirements of Section 10.3 are met.
11.4.2 Calibrate the system daily as described in Section 9.0. The standardsand extracts must be in MTBE.
11.4.3 Inject 2 µL of the sample extract. Record the resulting peak size in areaunits.
11.4.4 The width of the retention time window used to make identificationsshould be based upon measurements of actual retention time variationsof standards over the course of a day. Three times the standarddeviation of a retention time can be used to calculate a suggestedwindow size for a compound. However, the experience of the analystshould weigh heavily in the interpretation of chromatograms.

552-21
11.4.5 If the response for the peak exceeds the working range of the system,dilute the extract and reanalyze.
12.0 CALCULATIONS
12.1 Calculate analyte concentrations in the sample from the response for theanalyte relative to the internal standard (RR ) using the equation ina
Section 9.2.4.
12.2 For samples processed as part of a set where recoveries falls outside of thecontrol limits established in Section 10.0, results for the affected analytes mustbe labeled as suspect.
13.0 PRECISION AND ACCURACY
13.1 In a single laboratory (EMSL-Cincinnati), recovery and precision data wereobtained at four concentrations in reagent water (Tables 2-5). Tables 6 and 7give representative recovery and precision data for fortified tap water, whichhad been chlorinated. The Method Detection Limit (MDL) data are given in10
Table 2, and Tables 3-5 illustrate instrument range. These method validationdata were obtained by the 100 mL sample extraction procedure. In thecalculation of MDL's, the mean observed concentrations were not corrected forrecovery. Method detection limits using the microextraction samplepreparation were determined from eight replicate analyses of fortified reagentwater. The data showed they were not significantly different from those listedin Table 2, obtained using the large sample preparation procedure. Also, dataobtained from replicate analyses of a variety of drinking water samples usingthe microextraction sample preparation procedure were found to be essentiallyequivalent to the 100 mL procedure. The data indicate that both samplepreparation procedures presented for the haloacetic acids provide goodanalytical results under routine use for finished drinking waters. However,the microextraction procedure has not been tested on samples from formationpotential tests in which the total concentration of haloacetic acids may exceed100 µg/L. In these cases, the cleanup steps presented in this method may benecessary to eliminate interferences.
14.0 REFERENCES
1. Quimby, B.D., Delaney, M.F., Uden. P.C., and Barnes, R.M. Anal. Chem. 52,1980, pp. 259-263.
2. Uden, P.C. and Miller, J.W. J. Am. Water Works Assoc. 75, 1983, pp. 524-527.
3. Hodgeson, J.W., Cohen, A.L., and Collins, J.D. "Analytical Methods forMeasuring Organic Chlorination Byproducts", Proceedings Water QualityTechnology Conference (WQTC-16), St. Louis, MO, Nov. 13-17, 1988, AmericanWater Works Association, Denver, CO, pp. 981-1001.

552-22
4. Fair. P.S., Barth, R.C., Flesch, J. J., and Brass, H. "Measurement of DisinfectionByproducts in Chlorinated Drinking Water," Proceedings Water QualityTechnology Conference (WQTC-15), Baltimore, Maryland, November 15-20,1987, American Water Works Association, Denver, CO, pp. 339-353.
5. ASTM Annual Book of Standards, Part 31, D3694, "Standard Practice forPreparation of Sample Containers and for Preservation", American Society forTesting and Materials, Philadelphia, PA, p. 679, 1980.
6. "Carcinogens-Working with Carcinogens", Publication No. 77-206, Departmentof Health, Education, and Welfare, Public Health Service, Center for DiseaseControl, National Institute of Occupational Safety and Health, Atlanta,Georgia, August 1977.
7. "OSHA Safety and Health Standards, General Industry", (29 CFR 1910), OSHA2206, Occupational Safety and Health Administration, Washington, D.C. Revised January 1976.
8. "Safety In Academic Chemistry Laboratories", 3rd Edition, American ChemicalSociety Publication, Committee on Chemical Safety, Washington, D.C., 1979.
9. ASTM Annual Book of Standards, Part 31, D3370, "Standard Practice forSampling Water", American Society for Testing and Materials, Philadelphia,PA, p. 76, 1980.
10. Glaser, J.A., Foerst, D.L., McKee, G.D., Quave, S.A., and Budde, W.L. Environ. Sci. Technol. 15, 1981, pp. 1426-1435.
11. Chinn, R. and Krasner, S. " A Simplified Technique for the Measurement ofHalogenated Organic Acids in Drinking Water by Electron Capture GasChromatography". Presented at the 28th Pacific Conference on Chemistry andSpectroscopy, Pasadena, CA, October, 1989.

552-23
TABLE 1. RETENTION DATA AND CHROMATOGRAPHIC CONDITIONS
Retention Time (min)
Analyte Column A Column B
Monochloroacetic Acid 5.77 10.97Monobromoacetic Acid 8.70 13.03Dichloroacetic Acid 9.40 12.72Trichloroacetic Acid 12.20 14.371,2,3-Trichloropropane 13.28 13.87a
Bromochloroacetic Acid 13.52 15.11Dibromoacetic Acid 16.00 16.832-Chlorophenol 16.65 18.322,4-Dichlorophenol 20.70 19.272,4,6-Trichlorophenol 21.94 22.083,5-Dichlorobenzoic Acid 23.06 23.95b
Column A: DB-1701, 30 m x 0.32 mm i.d., 0.25 µm film thickness, Injector Temp. =200°C, Detector Temp. = 290°C, Helium Linear Velocity = 27 cm/sec,Splitless injection with 30 second delay
Program: Hold at 50°C for 10 minutes, to 210°C at 10°C/min. and hold 10 minutes.
Column B: DB-210, 30 m x 0.32 mm i.d., 0.50 µm film thickness, Injector Temp. = 200°C,Detector Temp. = 290°C, Linear Helium Flow = 25 cm/sec, splitless injectionwith 30 second delay.
Program: Hold at 50°C for 10 minutes, to 210°< at 10°C/min and hold 10 minutes.
Internal Standard.a
Surrogate Acid.b
552-24
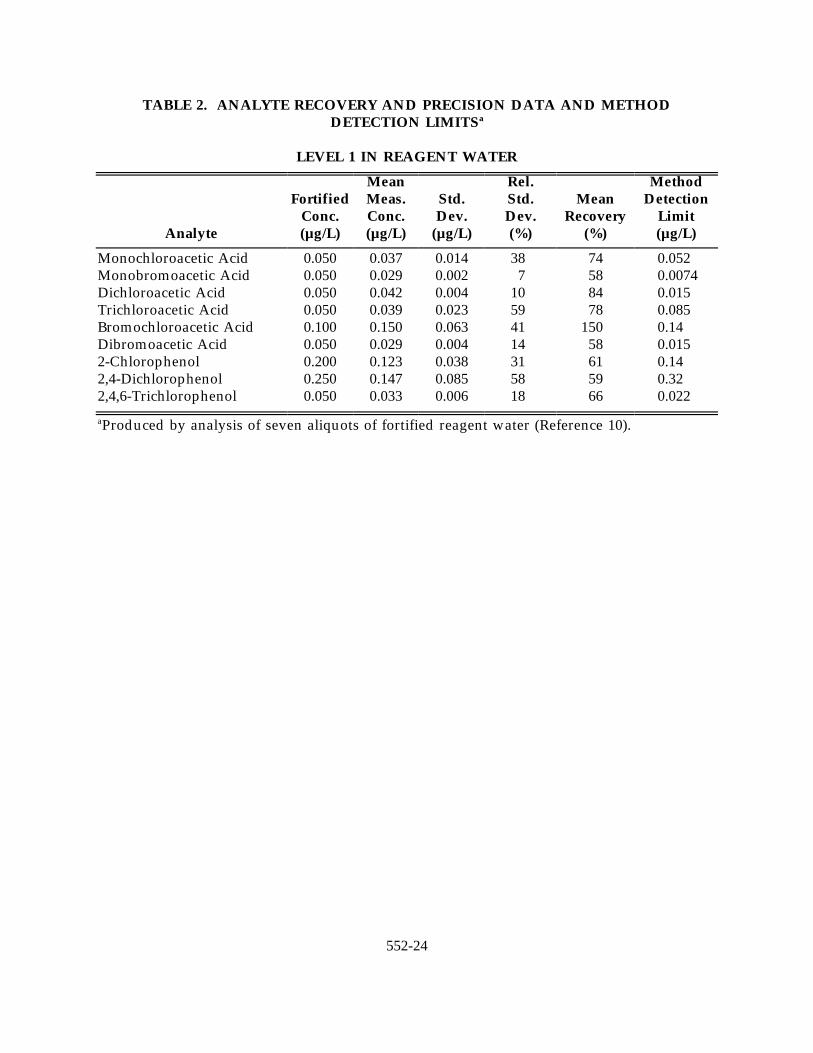
TABLE 2. ANALYTE RECOVERY AND PRECISION DATA AND METHODDETECTION LIMITSa
LEVEL 1 IN REAGENT WATER
Analyte (µg/L) (µg/L) (µg/L) (%) (%) (µg/L)
Fortified Meas. Std. Std. Mean DetectionConc. Conc. Dev. Dev. Recovery Limit
Mean Rel. Method
Monochloroacetic Acid 0.050 0.037 0.014 38 74 0.052Monobromoacetic Acid 0.050 0.029 0.002 7 58 0.0074Dichloroacetic Acid 0.050 0.042 0.004 10 84 0.015Trichloroacetic Acid 0.050 0.039 0.023 59 78 0.085Bromochloroacetic Acid 0.100 0.150 0.063 41 150 0.14Dibromoacetic Acid 0.050 0.029 0.004 14 58 0.0152-Chlorophenol 0.200 0.123 0.038 31 61 0.142,4-Dichlorophenol 0.250 0.147 0.085 58 59 0.322,4,6-Trichlorophenol 0.050 0.033 0.006 18 66 0.022
Produced by analysis of seven aliquots of fortified reagent water (Reference 10).a

552-25
TABLE 3. ANALYTE RECOVERY AND PRECISION DATAa
LEVEL 2 IN REAGENT WATER
Analyte (µg/L) (µg/L) (µg/L) (%) (%)
Fortified Meas. Std. Std. MeanConc. Conc. Dev. Dev. Recovery
Mean Rel.
Monochloroacetic Acid 1.0 0.81 0.065 8 81Monobromoacetic Acid 1.0 0.61 0.046 8 61Dichloroacetic Acid 2.5 2.53 0.15 6 101Trichloroacetic Acid 0.50 0.30 0.032 11 60Bromochloroacetic Acid 0.50 0.51 0.041 8 103Dibromoacetic Acid 1.25 0.81 0.033 4 652-Chlorophenol 2.50 1.79 0.62 35 722,4-Dichlorophenol 1.00 0.74 0.072 10 742,4,6-Trichlorophenol 0.50 0.43 0.032 7 86
Produced by the analysis of seven aliquots of fortified reagent water.a
552-26
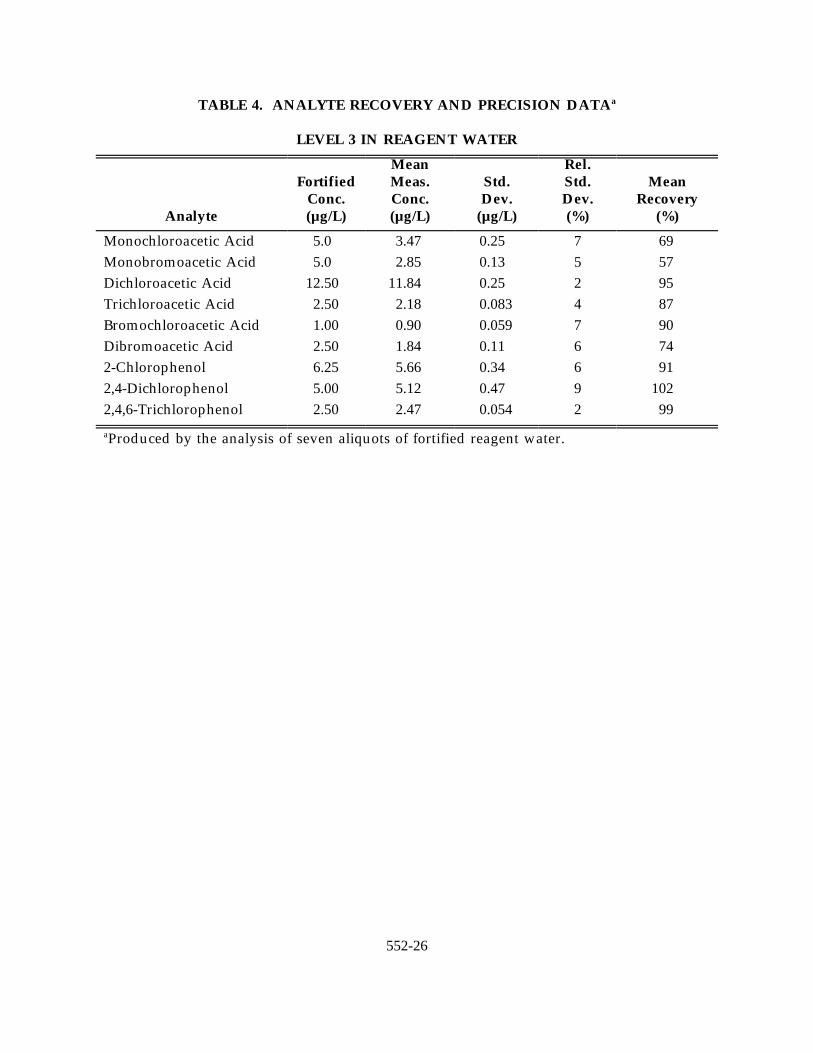
TABLE 4. ANALYTE RECOVERY AND PRECISION DATAa
LEVEL 3 IN REAGENT WATER
Analyte (µg/L) (µg/L) (µg/L) (%) (%)
Fortified Meas. Std. Std. MeanConc. Conc. Dev. Dev. Recovery
Mean Rel.
Monochloroacetic Acid 5.0 3.47 0.25 7 69Monobromoacetic Acid 5.0 2.85 0.13 5 57Dichloroacetic Acid 12.50 11.84 0.25 2 95Trichloroacetic Acid 2.50 2.18 0.083 4 87Bromochloroacetic Acid 1.00 0.90 0.059 7 90Dibromoacetic Acid 2.50 1.84 0.11 6 742-Chlorophenol 6.25 5.66 0.34 6 912,4-Dichlorophenol 5.00 5.12 0.47 9 1022,4,6-Trichlorophenol 2.50 2.47 0.054 2 99
Produced by the analysis of seven aliquots of fortified reagent water.a

552-27
TABLE 5. ANALYTE RECOVERY AND PRECISION DATAa
LEVEL 4 IN REAGENT WATER
Analyte (µg/L) (µg/L) (µg/L) (%) (%)
Fortified Meas. Std. Std. MeanConc. Conc. Dev. Dev. Recovery
Mean Rel.
Monochloroacetic Acid 10.0 7.08 0.16 2.3 71Monobromoacetic Acid 10.0 7.62 0.18 2.4 76Dichloroacetic Acid 25.0 24.1 0.41 1.7 96Trichloroacetic Acid 5.00 5.70 0.11 1.9 114Bromochloroacetic Acid 5.00 4.66 0.22 4.7 93Dibromoacetic Acid 5.00 5.35 0.096 1.8 1072-Chlorophenol 12.50 12.7 0.66 5.2 1022,4-Dichlorophenol 10.00 11.0 0.57 5.2 1102,4,6-Trichlorophenol 5.00 5.18 0.072 1.4 104
Produced by the analysis of seven aliquots of fortified reagent water.a

552-28
TABLE 6. ANALYTE RECOVERY AND PRECISION DATAa
LEVEL 1 IN TAP WATER
Analyte (µg/L) (µg/L) (µg/L) (µg/L) (%) (%)
Back- Mean Rel.ground Fortified Meas. Std. Std. MeanConc. Conc. Conc. Dev. Dev. Recovery
b
Monochloroacetic Acid 1.83 3.60 2.23 0.19 8 62Monobromacetic Acid 0.32 1.20 1.36 0.11 8 113Dichloroacetic Acid 32.3 36.0 26.0 2.4 9 72Trichloroacetic Acid 5.4 10.0 10.7 0.83 8 107Dibromoacetic Acid 10.6 15.0 19.2 1.4 7 1282-Chlorophenol 11.5 45.0 41.6 8.5 20 922,4-Dichlorophenol 0 10.0 12.0 1.2 10 1202,4,6-Trichlorophenol 0 2.00 28.8 0.23 8 144
Produced by the analysis of seven aliquots of fortified tap water.a
Background level subtracted.b

552-29
TABLE 7. ANALYTE RECOVERY AND PRECISION DATAa
LEVEL 2 IN TAP WATER
Analyte (µg/L) (µg/L) (µg/L) (µg/L) (%) (%)
Back- Mean Rel.ground Fortified Meas. Std. Std. MeanConc. Conc. Conc. Dev. Dev. Recovery
b
Monochloroacetic Acid 1.44 10.0 6.45 0.26 40 64Monobromacetic Acid 0.27 4.00 3.85 0.20 5 96Dichloroacetic Acid 27.9 72.0 61.0 2.9 5 85Trichloroacetic Acid 49.2 20.0 20.7 1.0 5 104Dibromoacetic Acid 11.0 30.0 34.1 0.89 3 1142-Chlorophenol 11.0 60.0 69.8 6.0 9 1162,4-Dichlorophenol 0 30.0 26.9 1.5 55 902,4,6-Trichlorophenol 0 10.0 10.7 0.27 2 107
Produced by the analysis of seven aliquots of fortified tap water.a
Background level subtracted.b
552-30
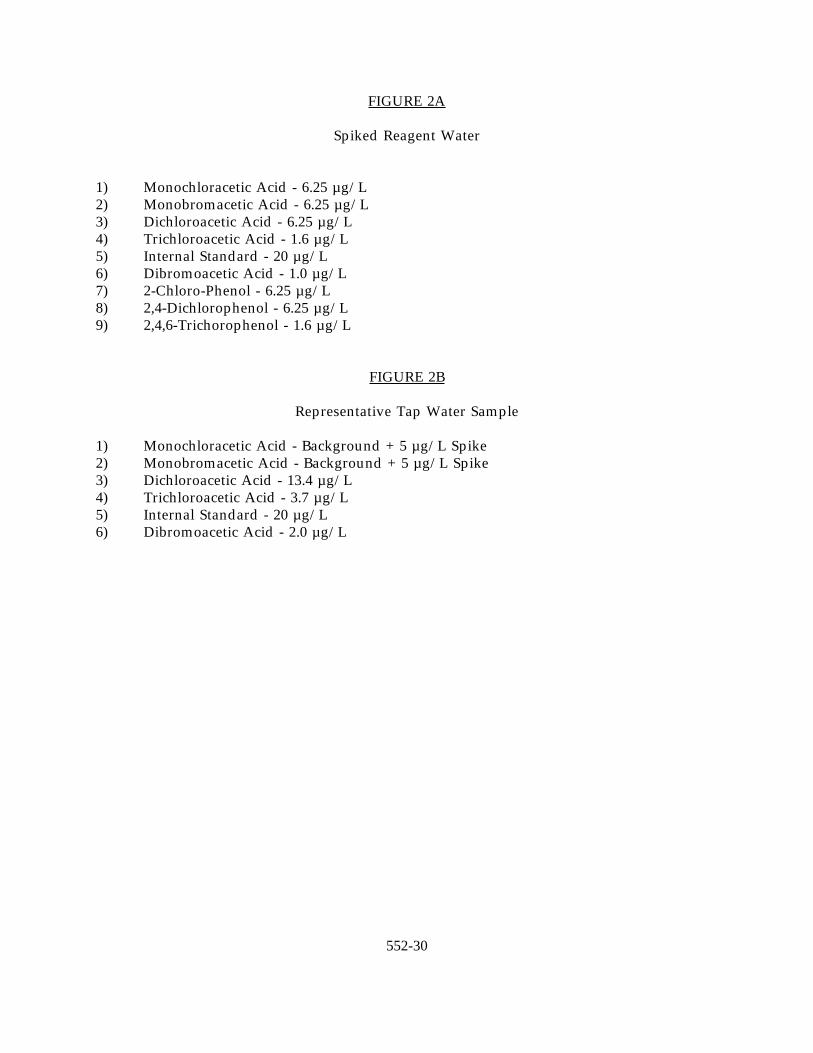
FIGURE 2A
Spiked Reagent Water
1) Monochloracetic Acid - 6.25 µg/L2) Monobromacetic Acid - 6.25 µg/L3) Dichloroacetic Acid - 6.25 µg/L4) Trichloroacetic Acid - 1.6 µg/L5) Internal Standard - 20 µg/L6) Dibromoacetic Acid - 1.0 µg/L7) 2-Chloro-Phenol - 6.25 µg/L8) 2,4-Dichlorophenol - 6.25 µg/L9) 2,4,6-Trichorophenol - 1.6 µg/L
FIGURE 2B
Representative Tap Water Sample
1) Monochloracetic Acid - Background + 5 µg/L Spike2) Monobromacetic Acid - Background + 5 µg/L Spike3) Dichloroacetic Acid - 13.4 µg/L4) Trichloroacetic Acid - 3.7 µg/L5) Internal Standard - 20 µg/L6) Dibromoacetic Acid - 2.0 µg/L

552-31

552-32