method 1624, revision c. volatile organic compounds by ... · volatile organic compounds by isotope...
TRANSCRIPT
Office of Water www.epa.gov 1990
Method 1624, Revision C: Volatile Organic Compounds by Isotope Dilution GCMS
Method 1624 Revision C
Volatile Organic Compounds by Isotope Dilution GCMS
Method 1624 Volatile Organic Compounds by Isotope Dilution GCMS
1. SCOPE AND APPLICATION
1.1 This method is designed to meet the survey requirements of the USEPA ITD. The method is used to determine the volatile toxic organic pollutants associated with the Clean Water Act (as amended 1987); the Resource Conservation and Recovery Act (as amended in 1986); the Comprehensive Environmental Response, Compensation, and Liability Act (as amended in 1986); and other compounds amenable to purge and trap gas chromatography/mass spectrometry (GCMS).
1.2 The chemical compounds listed in Tables 1 and 2 may be determined in waters, soils, and municipal sludges by the method.
1.3 The detection limits of the method are usually dependent on the level of interferences rather than instrumental limitations. The levels in Table 3 typify the minimum quantities that can be detected with no interferences present.
1.4 The GCMS portions of the method are for use only by analysts experienced with GCMS or under the close supervision of such qualified persons. Laboratories unfamiliar with analysis of environmental samples by GCMS should run the performance tests in Reference 1 before beginning.
2. SUMMARY OF METHOD
2.1 The percent solids content of the sample is determined. If the solids content is known or determined to be less than 1%, stable isotopically labeled analogs of the compounds of interest are added to a 5-mL sample and the sample is purged with an inert gas at 20 to 25°C in a chamber designed for soil or water samples. If the solids content is greater than one, mL of reagent water and the labeled compounds are added to a 5-aliquot of sample and the mixture is purged at 40°C. Compounds that will not purge at 20 to 25°C or at 40°C are purged at 75 to 85°C (see Table 2). In the purging process, the volatile compounds are transferred from the aqueous phase into the gaseous phase where they are passed into a sorbent column and trapped. After purging is completed, the trap is backflushed and heated rapidly to desorb the compounds into a gas chromatograph (GC). The compounds are separated by the GC and detected by a mass spectrometer (MS) (References 2 and 3). The labeled compounds serve to correct the variability of the analytical technique.
2.2 Identification of a pollutant (qualitative analysis) is performed in one of three ways: (1) For compounds listed in Table 1 and other compounds for which authentic standards are available, the GCMS system is calibrated and the mass spectrum and retention time for each standard are stored in a user created library. A compound is identified when its retention time and mass spectrum agree with the library retention time and spectrum. (2) For compounds listed in Table 2 and other compounds for which standards are not available, a compound is identified when the retention time and mass spectrum agree with those specified in this method. (3) For chromatographic peaks which are not identified by (1) and (2) above, the background corrected spectrum at the peak maximum
�
is compared with spectra in the EPA/NIH mass spectral file (Reference 4). Tentative identification is established when the spectrum agrees (see Section 12).
2.3 Quantitative analysis is performed in one of four ways by GCMS using extracted ion current profile (EICP) areas: (1) For compounds listed in Table 1 and other compounds for which standards and labeled analogs are available, the GCMS system iscalibrated and the compound concentration is determined using an isotope dilution technique. (2) For compounds listed in Table 1 and for other compounds for which authentic standards but no labeled compounds are available, the GCMS system is calibrated and the compound concentration is determined using an internal standard technique. (3) For compounds listed in Table 2 and other compounds for which standards are not available, compound concentrations are determined using known response factors. (4) For compounds for which neither standards nor known response factors are available, compound concentration is determined using the sum of the EICP areas relative to the sum of the EICP areas of the nearest eluted internal standard.
2.4 The quality of the analysis is assured through reproducible calibration and testing of the purge and trap and GCMS systems.
3
Pollutant Labeled Compound
CAS Registry
EPA EGD
CAS Registry
EPA EGD Compound STORET NPDES Analog
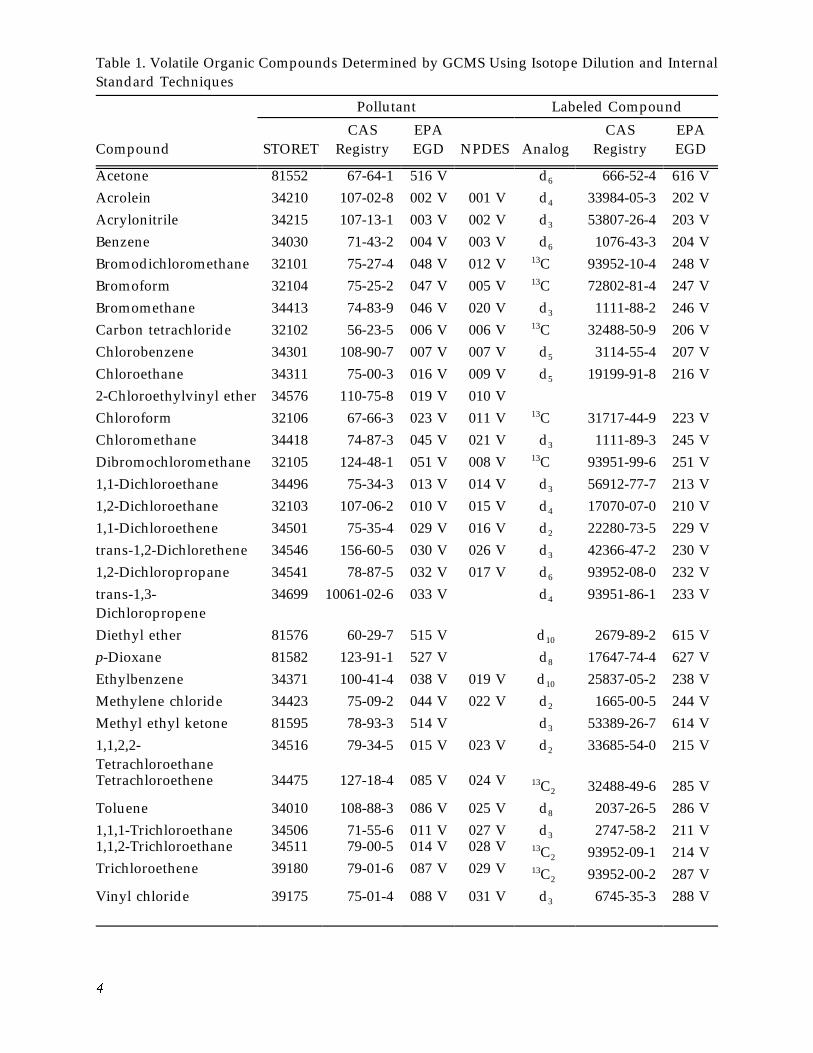
Acetone 81552 67-64-1 516 V d6 666-52-4 616 V
Acrolein 34210 107-02-8 002 V 001 V d4 33984-05-3 202 V
Acrylonitrile 34215 107-13-1 003 V 002 V d3 53807-26-4 203 V
Benzene 34030 71-43-2 004 V 003 V d6 1076-43-3 204 V
Bromodichloromethane 32101 75-27-4 048 V 012 V 13C 93952-10-4 248 V
Bromoform 32104 75-25-2 047 V 005 V 13C 72802-81-4 247 V
Bromomethane 34413 74-83-9 046 V 020 V d3 1111-88-2 246 V
Carbon tetrachloride 32102 56-23-5 006 V 006 V 13C 32488-50-9 206 V
Chlorobenzene 34301 108-90-7 007 V 007 V d5 3114-55-4 207 V
Chloroethane 34311 75-00-3 016 V 009 V d5 19199-91-8 216 V
2-Chloroethylvinyl ether 34576 110-75-8 019 V 010 V
Chloroform 32106 67-66-3 023 V 011 V 13C 31717-44-9 223 V
Chloromethane 34418 74-87-3 045 V 021 V d3 1111-89-3 245 V
Dibromochloromethane 32105 124-48-1 051 V 008 V 13C 93951-99-6 251 V
1,1-Dichloroethane 34496 75-34-3 013 V 014 V d3 56912-77-7 213 V
1,2-Dichloroethane 32103 107-06-2 010 V 015 V d4 17070-07-0 210 V
1,1-Dichloroethene 34501 75-35-4 029 V 016 V d2 22280-73-5 229 V
trans-1,2-Dichlorethene 34546 156-60-5 030 V 026 V d3 42366-47-2 230 V
1,2-Dichloropropane 34541 78-87-5 032 V 017 V d6 93952-08-0 232 V
trans-1,3- 34699 10061-02-6 033 V d4 93951-86-1 233 V Dichloropropene
Diethyl ether 81576 60-29-7 515 V d10 2679-89-2 615 V
p-Dioxane 81582 123-91-1 527 V d8 17647-74-4 627 V
Ethylbenzene 34371 100-41-4 038 V 019 V d10 25837-05-2 238 V
Methylene chloride 34423 75-09-2 044 V 022 V d2 1665-00-5 244 V
Methyl ethyl ketone 81595 78-93-3 514 V d3 53389-26-7 614 V
1,1,2,2- 34516 79-34-5 015 V 023 V d2 33685-54-0 215 V Tetrachloroethane Tetrachloroethene 34475 127-18-4 085 V 024 V 13C2 32488-49-6 285 V
Toluene 34010 108-88-3 086 V 025 V d8 2037-26-5 286 V
1,1,1-Trichloroethane 34506 71-55-6 011 V 027 V d3 2747-58-2 211 V 1,1,2-Trichloroethane 34511 79-00-5 014 V 028 V 13C2 93952-09-1 214 V Trichloroethene 39180 79-01-6 087 V 029 V 13C2 93952-00-2 287 V
Vinyl chloride 39175 75-01-4 088 V 031 V d3 6745-35-3 288 V
Table 1. Volatile Organic Compounds Determined by GCMS Using Isotope Dilution and Internal Standard Techniques
�
1
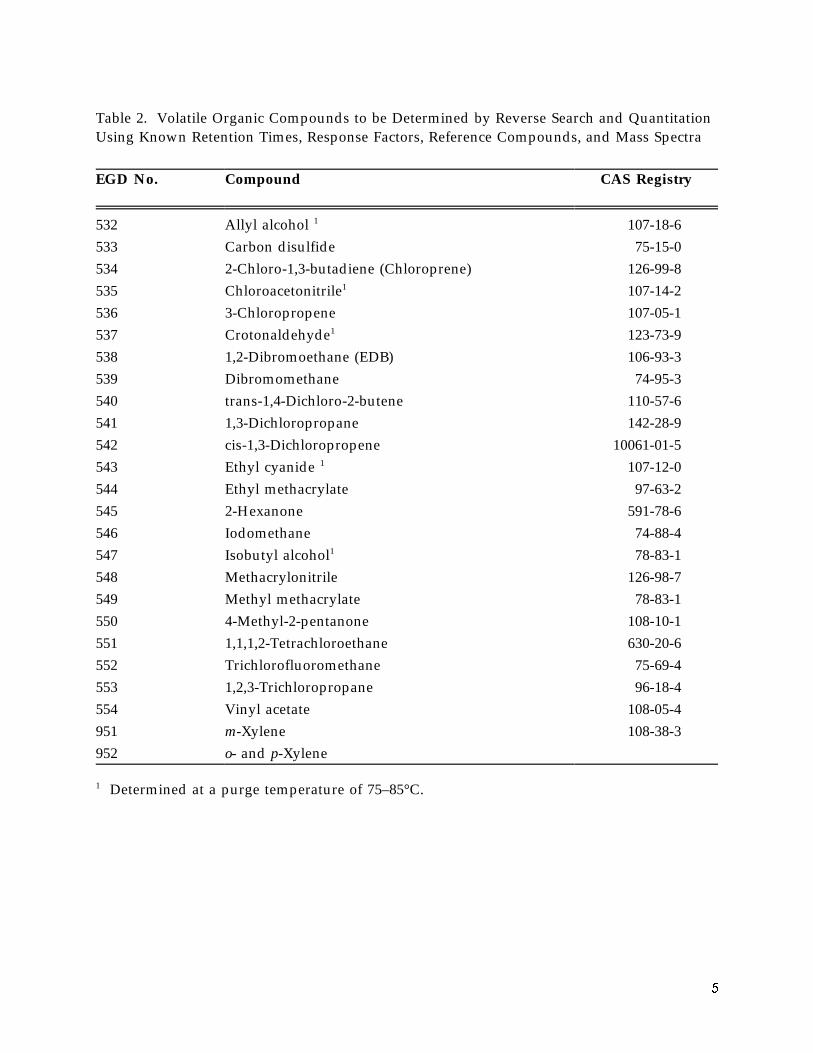
Table 2. Volatile Organic Compounds to be Determined by Reverse Search and Quantitation Using Known Retention Times, Response Factors, Reference Compounds, and Mass Spectra
EGD No. Compound CAS Registry
532 Allyl alcohol 1 107-18-6 533 Carbon disulfide 75-15-0 534 2-Chloro-1,3-butadiene (Chloroprene) 126-99-8 535 Chloroacetonitrile1 107-14-2 536 3-Chloropropene 107-05-1 537 Crotonaldehyde1 123-73-9 538 1,2-Dibromoethane (EDB) 106-93-3 539 Dibromomethane 74-95-3 540 trans-1,4-Dichloro-2-butene 110-57-6 541 1,3-Dichloropropane 142-28-9 542 cis-1,3-Dichloropropene 10061-01-5 543 Ethyl cyanide 1 107-12-0 544 Ethyl methacrylate 97-63-2 545 2-Hexanone 591-78-6 546 Iodomethane 74-88-4 547 Isobutyl alcohol1 78-83-1 548 Methacrylonitrile 126-98-7 549 Methyl methacrylate 78-83-1 550 4-Methyl-2-pentanone 108-10-1 551 1,1,1,2-Tetrachloroethane 630-20-6 552 Trichlorofluoromethane 75-69-4 553 1,2,3-Trichloropropane 96-18-4 554 Vinyl acetate 108-05-4 951 m-Xylene 108-38-3 952 o- and p-Xylene
Determined at a purge temperature of 75–85°C.
5
3. CONTAMINATION AND INTERFERENCES
3.1 Impurities in the purge gas, organic compounds out-gassing from the plumbing upstream of the trap, and solvent vapors in the laboratory account for the majority of contamination problems. The analytical system is demonstrated to be free from interferences under conditions of the analysis by analyzing reagent water blanks initially and with each sample batch (samples analyzed on the same 8-hour shift), as described in Section 8.5.
3.2 Samples can be contaminated by diffusion of volatile organic compounds (particularly methylene chloride) through the bottle seal during shipment and storage. A field blank prepared from reagent water and carried through the sampling and handling protocol may serve as a check on such contamination.
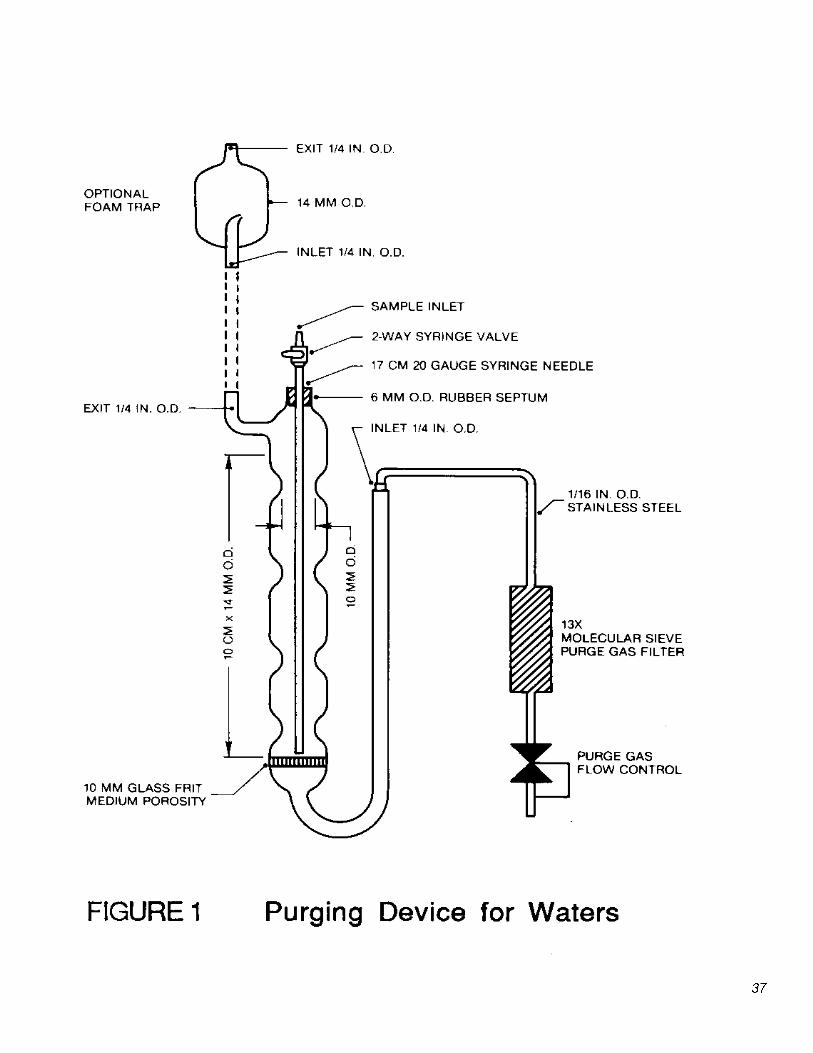
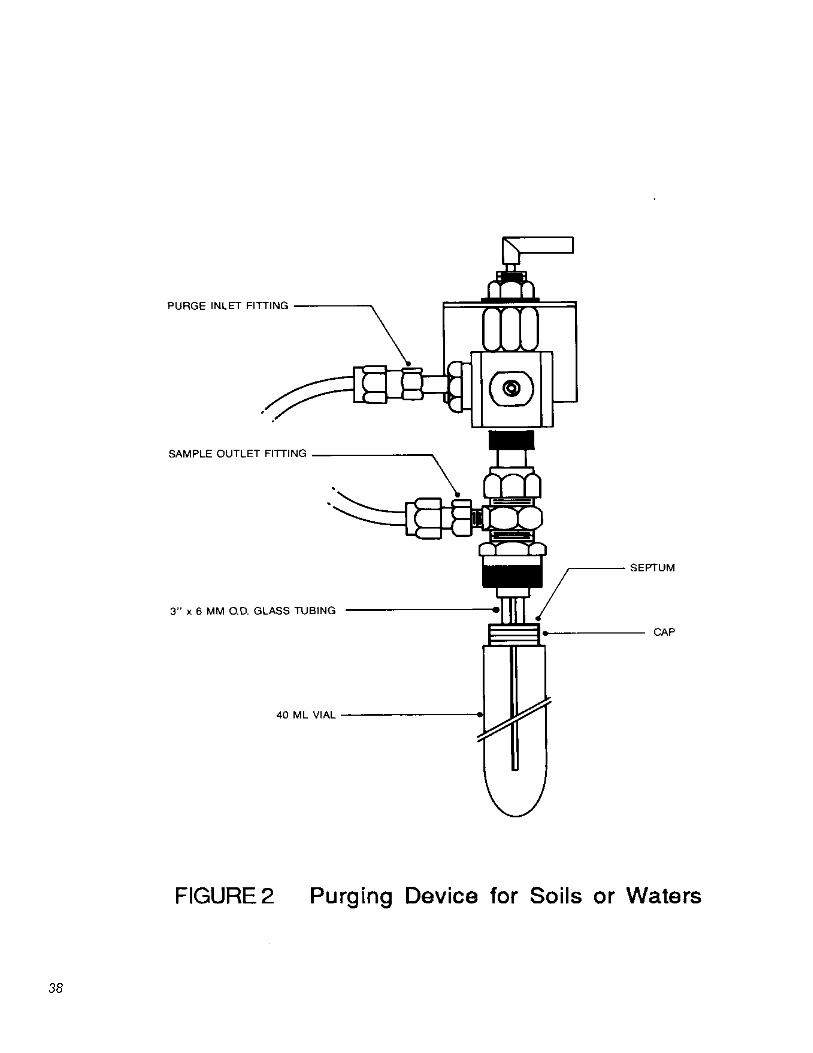
3.3 Contamination by carry-over can occur when high level and low level samples are analyzed sequentially. To reduce carry-over, the purging device (Figure 1 for samples containing less than one percent solids; Figure 2 for samples containing one percent solids or greater) is cleaned or replaced with a clean purging device after each sample is analyzed. When an unusually concentrated sample is encountered, it is followed by analysis of a reagent water blank to check for carry-over. Purging devices are cleaned by washing with soap solution, rinsing with tap and distilled water, and drying in an oven at 100 to 125°C. The trap and other parts of the system are also subject to contamination; therefore, frequent bakeout and purging of the entire system may be required.
3.4 Interferences resulting from samples will vary considerably from source to source, depending on the diversity of the site being sampled.
�
Method Detection Limit 4 Retention Time
Minimum Level 3
(µg/L)
Low Solids
(µg/kg)
HighSolids
(µg/kg) EGD No.1
Mean (sec)
EGD Ref Compound Relative 2
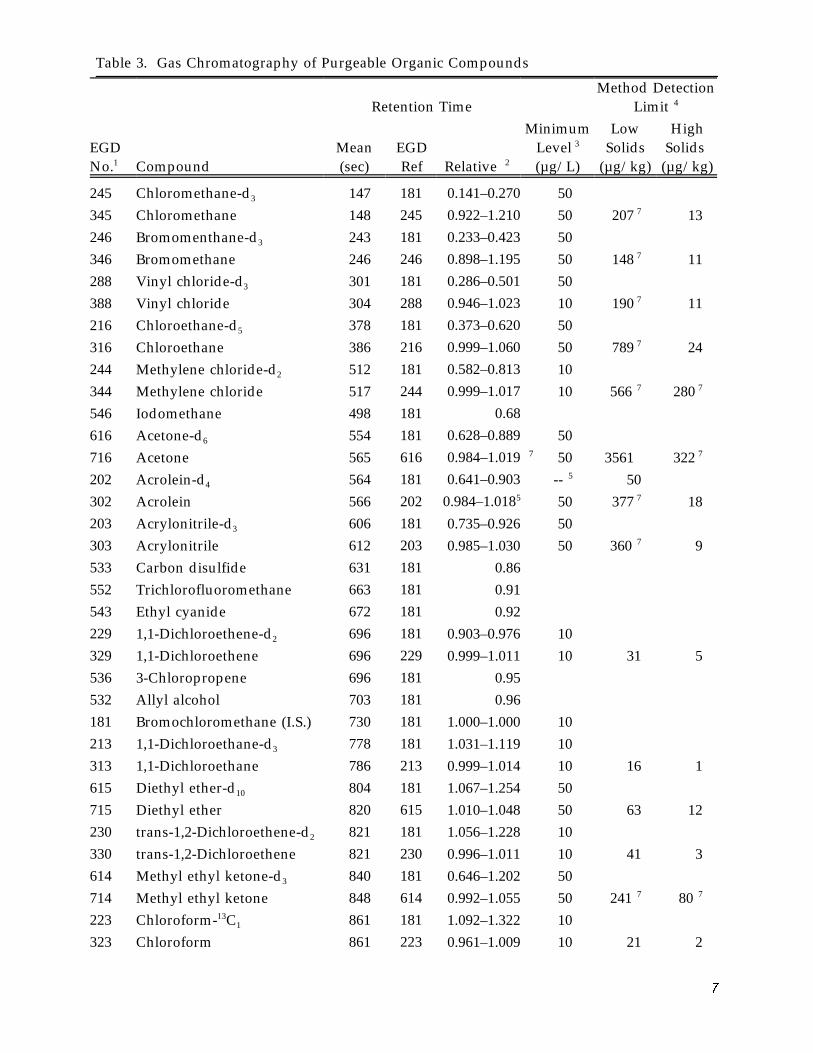
245 Chloromethane-d3 147 181 0.141–0.270 50 345 Chloromethane 148 245 0.922–1.210 50 207 7 13246 Bromomenthane-d3 243 181 0.233–0.423 50 346 Bromomethane 246 246 0.898–1.195 50 148 7 11288 Vinyl chloride-d3 301 181 0.286–0.501 50 388 Vinyl chloride 304 288 0.946–1.023 10 190 7 11216 Chloroethane-d5 378 181 0.373–0.620 50 316 Chloroethane 386 216 0.999–1.060 50 789 7 24244 Methylene chloride-d2 512 181 0.582–0.813 10 344 Methylene chloride 517 244 0.999–1.017 10 566 7 280 7
546 Iodomethane 498 181 0.68
616 Acetone-d6 554 181 0.628–0.889 50 716 Acetone 565 616 0.984–1.019 7 50 3561 322 7
202 Acrolein-d4 564 181 0.641–0.903 5 -- 50 302 Acrolein 566 202 0.984–1.0185 50 377 7 18 203 Acrylonitrile-d3 606 181 0.735–0.926 50 303 Acrylonitrile 612 203 0.985–1.030 50 360 7 9533 Carbon disulfide 631 181 0.86 552 Trichlorofluoromethane 663 181 0.91 543 Ethyl cyanide 672 181 0.92 229 1,1-Dichloroethene-d2 696 181 0.903–0.976 10 329 1,1-Dichloroethene 696 229 0.999–1.011 10 31 5 536 3-Chloropropene 696 181 0.95 532 Allyl alcohol 703 181 0.96 181 Bromochloromethane (I.S.) 730 181 1.000–1.000 10 213 1,1-Dichloroethane-d3 778 181 1.031–1.119 10 313 1,1-Dichloroethane 786 213 0.999–1.014 10 16 1 615 Diethyl ether-d10 804 181 1.067–1.254 50 715 Diethyl ether 820 615 1.010–1.048 50 63 12 230 trans-1,2-Dichloroethene-d2 821 181 1.056–1.228 10 330 trans-1,2-Dichloroethene 821 230 0.996–1.011 10 41 3 614 Methyl ethyl ketone-d3 840 181 0.646–1.202 50 714 Methyl ethyl ketone 848 614 0.992–1.055 50 241 7 80 7
223 Chloroform-13C 1 861 181 1.092–1.322 10 323 Chloroform 861 223 0.961–1.009 10 21 2
Table 3. Gas Chromatography of Purgeable Organic Compounds
7
Method Detection Limit 4 Retention Time
Minimum Level 3
(µg/L)
Low Solids
(µg/kg)
HighSolids
(µg/kg) EGD No.1
Mean (sec)
EGD Ref Compound Relative 2
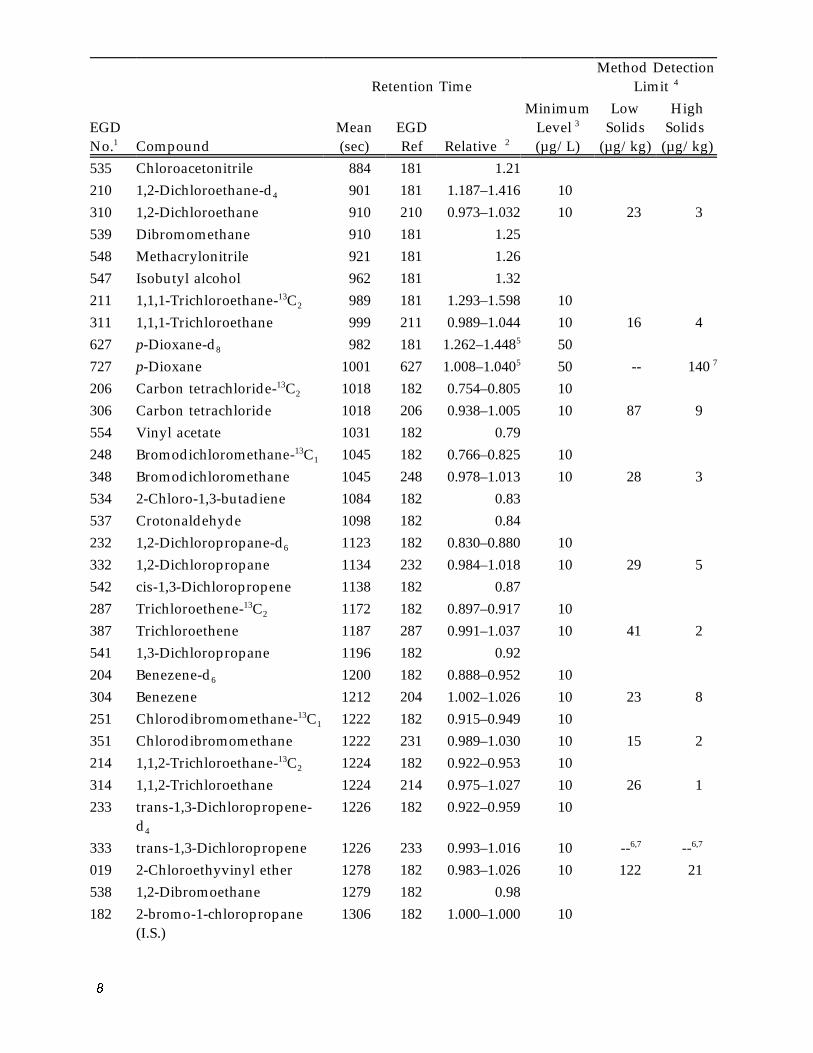
535 Chloroacetonitrile 884 181 1.21 210 1,2-Dichloroethane-d4 901 181 1.187–1.416 10 310 1,2-Dichloroethane 910 210 0.973–1.032 10 23 3 539 Dibromomethane 910 181 1.25 548 Methacrylonitrile 921 181 1.26 547 Isobutyl alcohol 962 181 1.32 211 1,1,1-Trichloroethane-13C 2 989 181 1.293–1.598 10 311 1,1,1-Trichloroethane 999 211 0.989–1.044 10 16 4 627 p-Dioxane-d8 982 181 1.262–1.4485 50 727 p-Dioxane 1001 627 1.008–1.0405 50 -- 140 7
206 Carbon tetrachloride-13C 2 1018 182 0.754–0.805 10 306 Carbon tetrachloride 1018 206 0.938–1.005 10 87 9 554 Vinyl acetate 1031 182 0.79 248 Bromodichloromethane-13C 1 1045 182 0.766–0.825 10 348 Bromodichloromethane 1045 248 0.978–1.013 10 28 3 534 2-Chloro-1,3-butadiene 1084 182 0.83 537 Crotonaldehyde 1098 182 0.84 232 1,2-Dichloropropane-d6 1123 182 0.830–0.880 10 332 1,2-Dichloropropane 1134 232 0.984–1.018 10 29 5 542 cis-1,3-Dichloropropene 1138 182 0.87 287 Trichloroethene-13C 2 1172 182 0.897–0.917 10 387 Trichloroethene 1187 287 0.991–1.037 10 41 2 541 1,3-Dichloropropane 1196 182 0.92 204 Benezene-d6 1200 182 0.888–0.952 10 304 Benezene 1212 204 1.002–1.026 10 23 8 251 Chlorodibromomethane-13C 1 1222 182 0.915–0.949 10 351 Chlorodibromomethane 1222 231 0.989–1.030 10 15 2 214 1,1,2-Trichloroethane-13C 2 1224 182 0.922–0.953 10 314 1,1,2-Trichloroethane 1224 214 0.975–1.027 10 26 1 233 trans-1,3-Dichloropropene-
d4
1226 182 0.922–0.959 10
333 trans-1,3-Dichloropropene 1226 233 0.993–1.016 10 6,7 -- 6,7 --019 2-Chloroethyvinyl ether 1278 182 0.983–1.026 10 122 21 538 1,2-Dibromoethane 1279 182 0.98 182 2-bromo-1-chloropropane
(I.S.) 1306 182 1.000–1.000 10
�
Method Detection Limit 4 Retention Time
Minimum Level 3
(µg/L)
Low Solids
(µg/kg)
HighSolids
(µg/kg) EGD No.1
Mean (sec)
EGD Ref Compound Relative 2
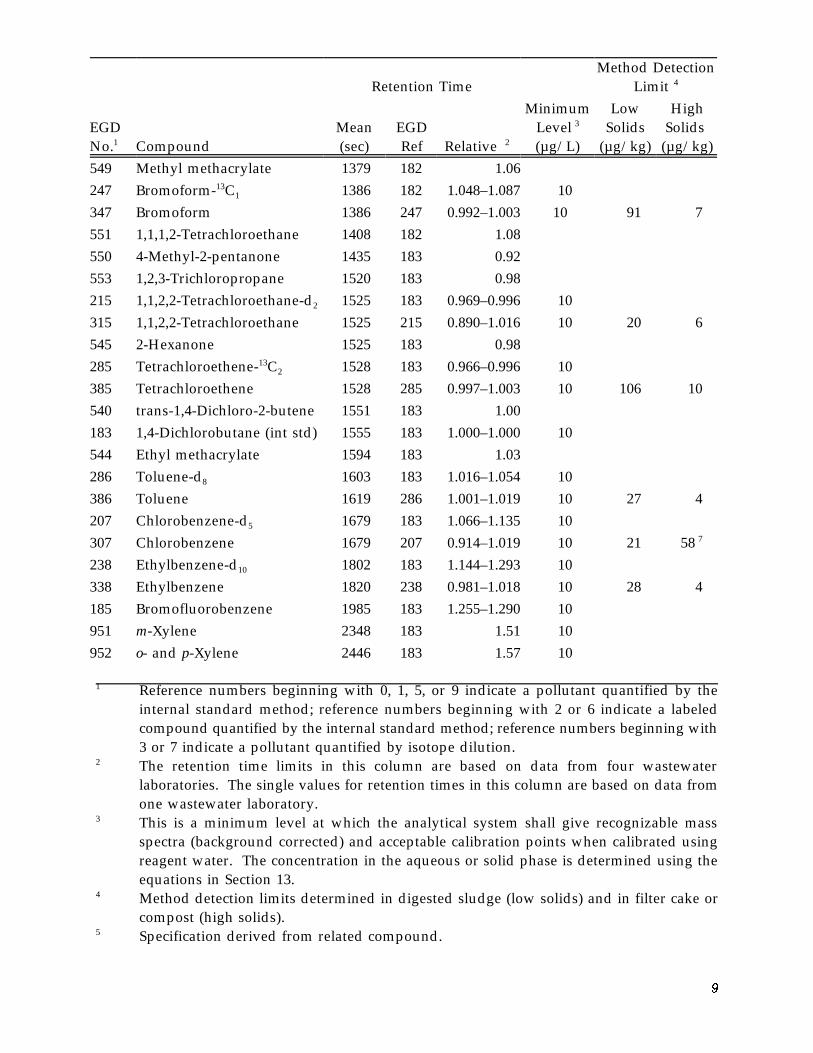
549 Methyl methacrylate 1379 182 1.06 247 13Bromoform- C 1 1386 182 1.048–1.087 10 347 Bromoform 1386 247 0.992–1.003 10 91 7551 1,1,1,2-Tetrachloroethane 1408 182 1.08 550 4-Methyl-2-pentanone 1435 183 0.92 553 1,2,3-Trichloropropane 1520 183 0.98 215 1,1,2,2-Tetrachloroethane-d2 1525 183 0.969–0.996 10 315 1,1,2,2-Tetrachloroethane 1525 215 0.890–1.016 10 20 6545 2-Hexanone 1525 183 0.98 285 13Tetrachloroethene- C 2 1528 183 0.966–0.996 10 385 Tetrachloroethene 1528 285 0.997–1.003 10 106 10540 trans-1,4-Dichloro-2-butene 1551 183 1.00 183 1,4-Dichlorobutane (int std) 1555 183 1.000–1.000 10 544 Ethyl methacrylate 1594 183 1.03 286 Toluene-d8 1603 183 1.016–1.054 10 386 Toluene 1619 286 1.001–1.019 10 27 4 207 Chlorobenzene-d5 1679 183 1.066–1.135 10 307 Chlorobenzene 1679 207 0.914–1.019 10 21 58 7
238 Ethylbenzene-d10 1802 183 1.144–1.293 10 338 Ethylbenzene 1820 238 0.981–1.018 10 28 4 185 Bromofluorobenzene 1985 183 1.255–1.290 10 951 m-Xylene 2348 183 1.51 10 952 o- and p-Xylene 2446 183 1.57 10
1 Reference numbers beginning with 0, 1, 5, or 9 indicate a pollutant quantified by the internal standard method; reference numbers beginning with 2 or 6 indicate a labeled compound quantified by the internal standard method; reference numbers beginning with 3 or 7 indicate a pollutant quantified by isotope dilution.
2 The retention time limits in this column are based on data from four wastewater laboratories. The single values for retention times in this column are based on data from one wastewater laboratory.
3 This is a minimum level at which the analytical system shall give recognizable mass spectra (background corrected) and acceptable calibration points when calibrated using reagent water. The concentration in the aqueous or solid phase is determined using the equations in Section 13.
4 Method detection limits determined in digested sludge (low solids) and in filter cake or compost (high solids).
5 Specification derived from related compound.
9
6 An unknown interference in the particular sludge studied precluded measurement of the method detection limit (MDL) for this compound.
7 Background levels of these compounds were present in the sludge resulting in higher than expected MDLs. The MDL for these compounds is expected to be approximately 20 µg/kg (100 to 200 µg/kg for the gases and water soluble compounds) for the low solids method and 5 to 10 µg/kg (25 to 50 µg/kg for the gases and water soluble compounds) for the high solids methods, with no interferences present.
Column: 2.4 m (8 ft) × 2 mm I.D. glass, packed with 1% SP-1000 coated on 60/80 Carbopak B. Carrier gas: Helium at 40 mL/min. Temperature program: 3 min at 45°C, 8°C/min to 240°C, hold at 240°C for 15 minutes.
4. SAFETY
4.1 The toxicity or carcinogenicity of each compound or reagent used in this method has not been precisely determined; however, each chemical compound should be treated as a potential health hazard. Exposure to these compounds should be reduced to the lowest possible level. The laboratory is responsible for maintaining a current awareness file of OSHA regulations regarding the safe handling of the chemicals specified in this method. A reference file of data handling sheets should also be made available to all personnel involved in these analyses. Additional information on laboratory safety can be found in References 5 through 7.
4.2 The following compounds covered by this method have been tentatively classified as known or suspected human or mammalian carcinogens: benzene, carbon tetrachloride, chloroform, and vinyl chloride. Primary standards of these toxic compounds should be prepared in a hood, and a NIOSH/MESA approved toxic gas respirator should be worn when high concentrations are handled.
5. APPARATUS AND MATERIALS
5.1 Sample bottles for discrete sampling.
5.1.1 Bottle: 25− to 40−mL with screw—cap (Pierce 13075, or equivalent). Detergent —wash, rinse with tap and distilled water, and dry at >105°C for a minimum of 1 hour before use.
5.1.2 Septum: Teflon-faced silicone (Pierce 12722, or equivalent), cleaned as above and baked at 100 to 200°C for 1 hour minimum.
5.2 Purge and trap device: Consists of purging device, trap, and desorber.
5.2.1 Purging devices for water and soil samples.
5.2.1.1 Purging device for water samples Designed to accept 5-mL samples with water column at least 3 cm deep. The volume of the gaseous head space between the water and trap shall be less than 15 mL. The purge gas shall be introduced less than 5 mm from the base of the water column and shall pass through the water as bubbles with a
10
diameter less than 3 mm. The purging device shown in Figure 1 meets these criteria.
5.2.1.2 Purging device for solid samples: Designed to accept 5 g of solids plus 5 mL of water. The volume of the gaseous head space between the water and trap shall be less than 25 mL. The purge gas shall be introduced less than 5 mm from the base of the sample and shall pass through the water as bubbles with a diameter less than 3 mm. The purging device shall be capable of operating at ambient temperature (20 to 25°C) and of being controlled at temperatures of 40°C (±2°C) and 80°C (±5°C) while the sample is being purged. The purging device shown in Figure 2 meets these criteria.
5.2.2 Trap: 25 to 30 cm long × 2.5 mm I.D. minimum, containing the following:
5.2.2.1 Methyl silicone packing: 1cm (±0.2cm), 3% OV-1 on 60/80 mesh Chromosorb W, or equivalent.
5.2.2.2 Porous polymer: 15cm (±1.0 cm), Tenax GC (2,6-diphenylene oxide polymer), 60/80 mesh, chromatographic grade, or equivalent.
5.2.2.3 Silica gel: 8cm (±1.0 cm), Davison Chemical, 35/60 mesh, grade 15, or equivalent. The trap shown in Figure 3 meets these specifications.
5.2.3 Desorber: Shall heat the trap to 175°C (±5°C) in 45 seconds or less. The polymer section of the trap shall not exceed a temperature of 180°C and the remaining sections shall not exceed 220°C during desorb, and no portion of the trap shall exceed 225°C during bakeout. The desorber shown in Figure 3 meets these specifications.
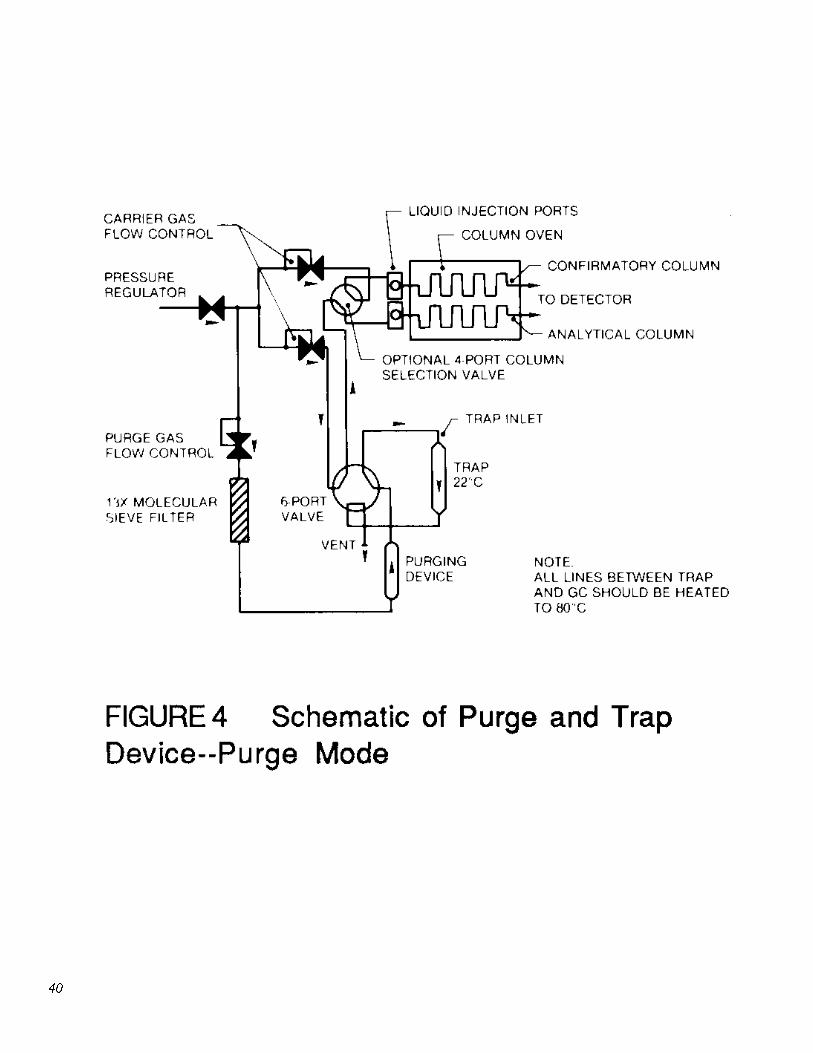
5.2.4 The purge and trap device may be a separate unit, or coupled to a GC as shown in Figures 4 and 5.
5.3 Gas chromatograph: Shall be linearly temperature programmable with initial and final holds, shall contain a glass jet separator as the MS interface, and shall produce results which meet the calibration (Section 7), quality assurance (Section 8), and performance tests (Section 11) of this method.
5.3.1 Column: 2.8 · 0.4 m x 2 · 0.5 mm I.D. glass, packed with 1% SP-1000 on Carbopak B, 60/80 mesh, or equivalent.
5.4 Mass spectrometer: 70 eV electron impact ionization; shall repetitively scan from 20 to 250 amu every 2 to 3 seconds, and produce a unit resolution (valleys between m/z 174 to 176 less than 10% of the height of the m/z 175 peak), background corrected mass spectrum from 50 ng 4-bromofluorobenzene (BFB) injected into the GC. The BFB spectrum shall meet the mass-intensity criteria in Table 4. All portions of the GC column, transfer lines, and separator which connect the GC column to the ion source shall remain at or above the column temperature during analysis to preclude condensation of less volatile compounds.
5.5 Data system: Shall collect and record MS data, store mass-intensity data in spectral libraries, process GCMS data and generate reports, and shall calculate and record response factors.
11
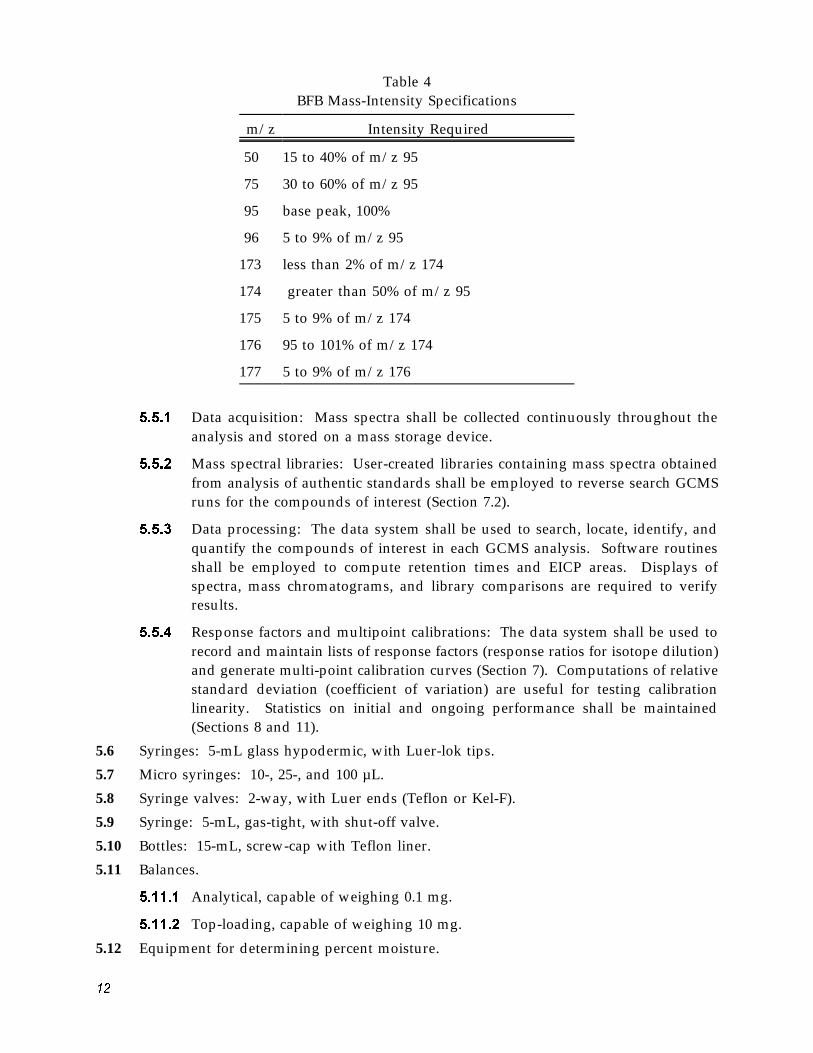
Table 4 BFB Mass-Intensity Specifications
m/z Intensity Required
50 15 to 40% of m/z 95
75 30 to 60% of m/z 95
95 base peak, 100%
96 5 to 9% of m/z 95
173 less than 2% of m/z 174
174 greater than 50% of m/z 95
175 5 to 9% of m/z 174
176 95 to 101% of m/z 174
177 5 to 9% of m/z 176
5.5.1 Data acquisition: Mass spectra shall be collected continuously throughout the analysis and stored on a mass storage device.
5.5.2 Mass spectral libraries: User-created libraries containing mass spectra obtained from analysis of authentic standards shall be employed to reverse search GCMS runs for the compounds of interest (Section 7.2).
5.5.3 Data processing: The data system shall be used to search, locate, identify, and quantify the compounds of interest in each GCMS analysis. Software routines shall be employed to compute retention times and EICP areas. Displays of spectra, mass chromatograms, and library comparisons are required to verify results.
5.5.4 Response factors and multipoint calibrations: The data system shall be used to record and maintain lists of response factors (response ratios for isotope dilution) and generate multi-point calibration curves (Section 7). Computations of relative standard deviation (coefficient of variation) are useful for testing calibration linearity. Statistics on initial and ongoing performance shall be maintained (Sections 8 and 11).
5.6 Syringes: 5-mL glass hypodermic, with Luer-lok tips.
5.7 Micro syringes: 10-, 25-, and 100 µL.
5.8 Syringe valves: 2-way, with Luer ends (Teflon or Kel-F).
5.9 Syringe: 5-mL, gas-tight, with shut-off valve.
5.10 Bottles: 15-mL, screw-cap with Teflon liner.
5.11 Balances.
5.11.1 Analytical, capable of weighing 0.1 mg.
5.11.2 Top-loading, capable of weighing 10 mg.
5.12 Equipment for determining percent moisture.
1�
5.12.1 Oven,capable of being temperature-controlled at 110°C (±5°C).
5.12.2 Dessicator.
5.12.3 Beakers: 50 to 100-mL.
6. REAGENTS AND STANDARDS
6.1 Reagent water: Water in which the compounds of interest and interfering compounds are not detected by this method (Section 11.7). It may be generated by any of the following methods:
6.1.1 Activated carbon: pass tap water through a carbon bed (Calgon Filtrasorb-300, or equivalent).
6.1.2 Water purifier: Pass tap water through a purifier (Millipore Super Q, or equivalent).
6.1.3 Boil and purge: Heat tap water to between 90 and 100°C and bubble contaminant free inert gas through it for approximately 1 hour. While still hot, transfer the water to screw-cap bottles and seal with a Teflon-lined cap.
6.2 Sodium thiosulfate: ACS granular.
6.3 Methanol: Pesticide-quality or equivalent.
6.4 Standard solutions: Purchased as solutions or mixtures with certification to their purity, concentration, and authenticity, or prepared from materials of known purity and composition. If compound purity is 96% or greater, the weight may be used without correction to calculate the concentration of the standard.
6.5 Preparation of stock solutions: Prepare in methanol using liquid or gaseous standards per the steps below. Observe the safety precautions given in Section 4.
6.5.1 Place approximately 9.8 mL of methanol in a 10-mL ground-glass-stoppered volumetric flask. Allow the flask to stand unstoppered for approximately 10 minutes or until all methanol wetted surfaces have dried. In each case, weigh the flask, immediately add the compound, then immediately reweigh to prevent evaporation losses from affecting the measurement.
6.5.1.1 Liquids: Using a 100 µL syringe, permit 2 drops of liquid to fall into the methanol without contacting the neck of the flask. Alternatively, inject a known volume of the compound into the methanol in the flask using a micro-syringe.
6.5.1.2 Gases (chloromethane, bromomethane, chloroethane, vinyl chloride): Fill a valved 5-mL gas-tight syringe with the compound. Lower the needle to approximately 5 mm above the methanol meniscus. Slowly introduce the compound above the surface of the meniscus. The gas will dissolve rapidly in the methanol.
6.5.2 Fill the flask to volume, stopper, then mix by inverting several times. Calculate the concentration in mg/mL (µg/µL) from the weight gain (or density if a known volume was injected).
13
6.5.3 Transfer the stock solution to a Teflon−sealed screw-cap bottle. Store, with minimal headspace, in the dark at −10 to −20°C.
6.5.4 Prepare fresh standards weekly for the gases and 2-chloroethylvinyl ether. All other standards are replaced after one month, or sooner if comparison with check standards indicate a change in concentration. Quality control check standards that can be used to determine the accuracy of calibration standards are available from the US Environmental Protection Agency, Environmental Monitoring and Support Laboratory, Cincinnati, Ohio.
6.6 Labeled compound spiking solution: From stock standard solutions prepared as above, or from mixtures, prepare the spiking solution to contain a concentration such that a 5-to 10- µL spike into each 5-mL sample, blank, or aqueous standard analyzed will result in a concentration of 20 ug/L of each labeled compound. For the gases and for the water soluble compounds (acrolein, acrylonitrile, acetone, diethyl ether, p-dioxane, and MEK), a concentration of 100 ug/L may be used. Include the internal standards (Section 7.5) in this solution so that a concentration of 20 ug/L in each sample, blank, or aqueous standard will be produced.
6.7 Secondary standards: Using stock solutions, prepare a secondary standard in methanol to contain each pollutant at a concentration of 500 µg/mL. For the gases and water soluble compounds (Section 6.6), a concentration of 2.5 mg/mL may be used.
6.7.1 Aqueous calibration standards: Using a 25-µL syringe, add 20 µL of the secondary standard (Section 6.7) to 50, 100, 200, 500, and 1000 mL of reagent water to produce concentrations of 200, 100, 50, 20, and 10 µg/L, respectively. If the higher concentration standard for the gases and water soluble compounds was chosen (Section 6.6), these compounds will be at concentrations of 1000, 500, 250, 100, and 50 µg/L in the aqueous calibration standards.
6.7.2 Aqueous performance standard: An aqueous standard containing all pollutants, internal standards, labeled compounds, and BFB is prepared daily, and analyzed each shift to demonstrate performance (Section 11). This standard shall contain either 20 or 100 µg/L of the labeled and pollutant gases and water soluble compounds, 10 µg/L BFB, and 20 µg/L of all other pollutants, labeled compounds, and internal standards. It may be the nominal 20 µg/L aqueous calibration standard (Section 6.7.1).
6.7.3 A methanolic standard containing all pollutants and internal standards is prepared to demonstrate recovery of these compounds when syringe injection and purge-and-trap analyses are compared. This standard shall contain either 100 µg/mL or 500 µg/mL of the gases and water soluble compounds, and 100 µg/mL of the remaining pollutants and internal standards (consistent with the amounts in the aqueous performance standard in 6.7.2).
6.7.4 Other standards which may be needed are those for test of BFB performance (Section 7.1) and for collection of mass spectra for storage in spectral libraries (Section 7.2).
7. CALIBRATION
1�
Calibration of the GCMS system is performed by purging the compounds of interest and their labeled analogs from reagent water at the temperature to be used for analysis of samples.
7.1 Assemble the gas chromatographic apparatus and establish operating conditions given in Table 3. By injecting standards into the GC, demonstrate that the analytical system meets the minimum levels in Table 3 for the compounds for which calibration is to be performed, and the mass-intensity criteria in Table 4 for 50 ng BFB.
7.2 Mass spectral libraries: Detection and identification of the compounds of interest are dependent upon the spectra stored in user created libraries.
7.2.1 For the compounds in Table 1 and other compounds for which the GCMS is to be calibrated, obtain a mass spectrum of each pollutant and labeled compound and each internal standard by analyzing an authentic standard either singly or as part of a mixture in which there is no interference between closely eluted components. Examine the spectrum to determine that only a single compound is present. Fragments not attributable to the compound under study indicate the presence of an interfering compound. Adjust the analytical conditions and scan rate (for this test only) to produce an undistorted spectrum at the GC peak maximum. An undistorted spectrum will usually be obtained if five complete spectra are collected across the upper half of the GC peak. Software algorithms designed to "enhance" the spectrum may eliminate distortion, but may also eliminate authentic m/z's or introduce other distortion.
7.2.2 The authentic reference spectrum is obtained under BFB tuning conditions (Section 7.1 and Table 4) to normalize it to spectra from other instruments.
7.2.3 The spectrum is edited by saving the five most intense mass spectral peaks and all other mass spectral peaks greater than 10% of the base peak. The spectrum may be further edited to remove common interfering masses. If five mass spectral peaks cannot be obtained under the scan conditions given in Section 5.4, the mass spectrometer may be scanned to an m/z lower than 20 to gain additional spectral information. The spectrum obtained is stored for reverse search and for compound confirmation.
7.2.4 For the compounds in Table 2 and other compounds for which the mass spectra, quantitation m/z's, and retention times are known but the instrument is not to be calibrated, add the retention time and reference compound (Table 3); the response factor and the quantitation m/z (Table 5); and spectrum (Appendix A) to the reverse search library. Edit the spectrum per Section 7.2.3, if necessary.
7.3 Assemble the purge-and-trap device. Pack the trap as shown in Figure 3 and condition overnight at 170 to 180°C by backflushing with an inert gas at a flow rate of 20 to 30 mL/min. Condition traps daily for a minimum of 10 minutes prior to use.
7.3.1 Analyze the aqueous performance standard (Section 6.7.2) according to the purge−and−trap procedure in Section 10. Compute the area at the primary m/z (Table 5) for each compound. Compare these areas to those obtained by injecting 1 µL of the methanolic standard (Section 6.7.3) to determine compound recovery. The recovery shall be greater than 20% for the water soluble compounds (Section 6.6), and 60 to 110% for all other compounds. This recovery is demonstrated initially for each purge-and-trap GCMS system. The test is repeated only if the
15
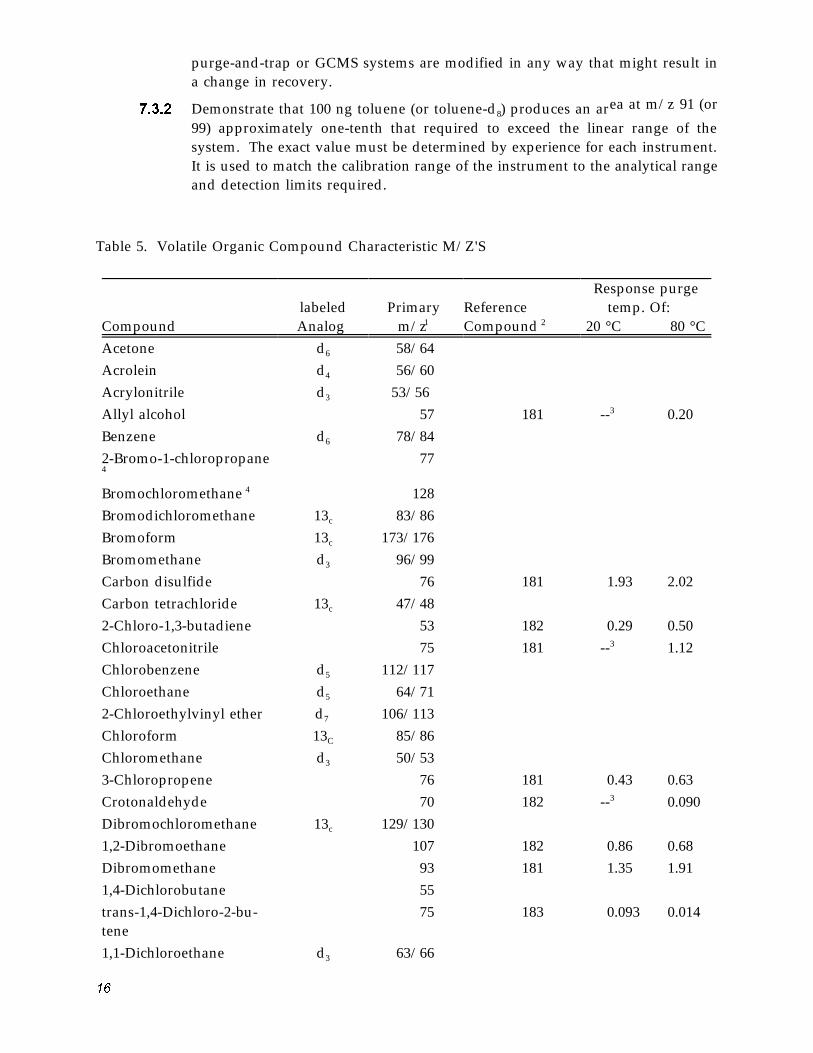
purge-and-trap or GCMS systems are modified in any way that might result in a change in recovery.
ea at m/z 91 (or7.3.2 Demonstrate that 100 ng toluene (or toluene-d ) produces an ar8
99) approximately one-tenth that required to exceed the linear range of the system. The exact value must be determined by experience for each instrument. It is used to match the calibration range of the instrument to the analytical range and detection limits required.
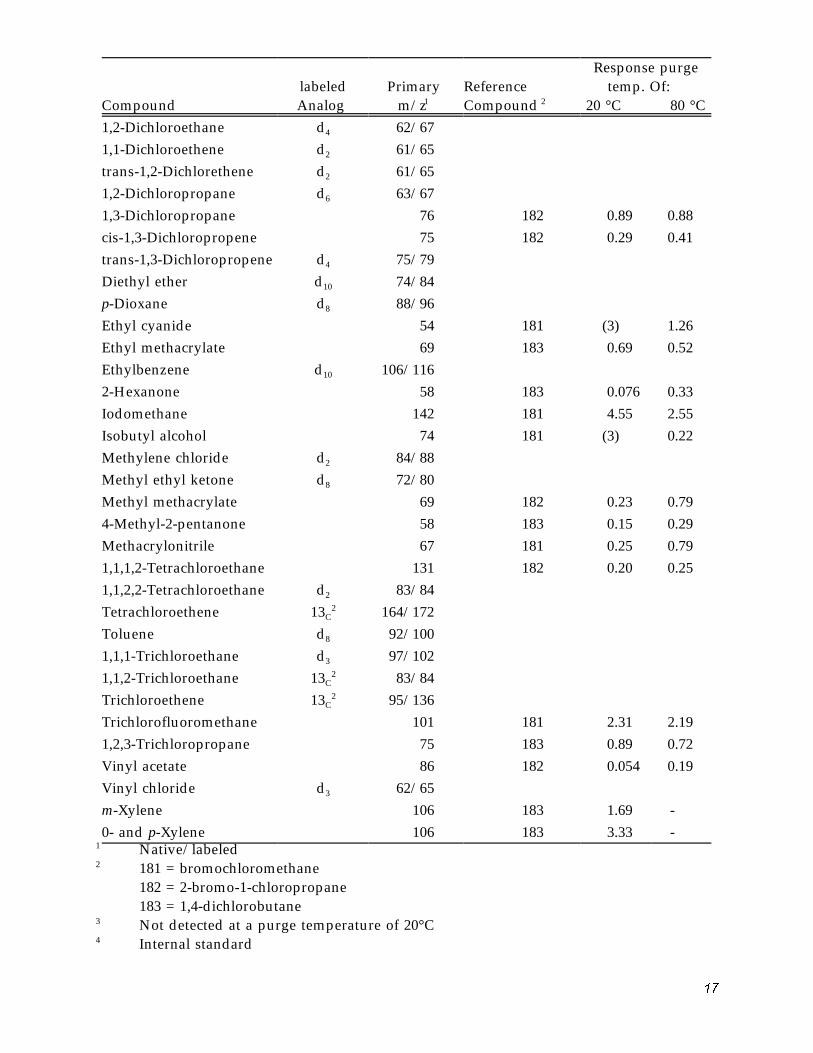
Table 5. Volatile Organic Compound Characteristic M/Z'S
1�
Response purge labeled Primary Reference temp. Of:
Compound Analog 1 m/z Compound 2 20 °C 80 °C Acetone d6 58/64 Acrolein d4 56/60 Acrylonitrile d3 53/56 Allyl alcohol 57 181 3 -- 0.20Benzene d6 78/84 2-Bromo-1-chloropropane4
77
Bromochloromethane 4 128Bromodichloromethane 13c 83/86 Bromoform 13c 173/176 Bromomethane d3 96/99 Carbon disulfide 76 181 1.93 2.02 Carbon tetrachloride 13c 47/48 2-Chloro-1,3-butadiene 53 182 0.29 0.50 Chloroacetonitrile 75 181 3 -- 1.12 Chlorobenzene d5 112/117 Chloroethane d5 64/71 2-Chloroethylvinyl ether d7 106/113 Chloroform 13C 85/86 Chloromethane d3 50/53 3-Chloropropene 76 181 0.43 0.63 Crotonaldehyde 70 182 3 -- 0.090 Dibromochloromethane 13c 129/130 1,2-Dibromoethane 107 182 0.86 0.68 Dibromomethane 93 181 1.35 1.91 1,4-Dichlorobutane 55 trans-1,4-Dichloro-2-bu- 75 183 0.093 0.014 tene 1,1-Dichloroethane d3 63/66
Response purge temp. Of: labeled
Analog Primary
m/z 1Reference Compound 2 Compound 20 °C 80 °C
1,2-Dichloroethane d4 62/67 1,1-Dichloroethene d2 61/65 trans-1,2-Dichlorethene d2 61/65 1,2-Dichloropropane d6 63/67 1,3-Dichloropropane 76 182 0.89 0.88 cis-1,3-Dichloropropene 75 182 0.29 0.41 trans-1,3-Dichloropropene d4 75/79 Diethyl ether d10 74/84 p-Dioxane d8 88/96 Ethyl cyanide 54 181 (3) 1.26 Ethyl methacrylate 69 183 0.69 0.52 Ethylbenzene d10 106/116 2-Hexanone 58 183 0.076 0.33 Iodomethane 142 181 4.55 2.55 Isobutyl alcohol 74 181 (3) 0.22 Methylene chloride d2 84/88 Methyl ethyl ketone d8 72/80 Methyl methacrylate 69 182 0.23 0.79 4-Methyl-2-pentanone 58 183 0.15 0.29 Methacrylonitrile 67 181 0.25 0.79 1,1,1,2-Tetrachloroethane 131 182 0.20 0.25 1,1,2,2-Tetrachloroethane d2 83/84 Tetrachloroethene 13C
2 164/172 Toluene d8 92/100 1,1,1-Trichloroethane d3 97/102 1,1,2-Trichloroethane 13C
2 83/84 Trichloroethene 13C
2 95/136 Trichlorofluoromethane 101 181 2.31 2.19 1,2,3-Trichloropropane 75 183 0.89 0.72 Vinyl acetate 86 182 0.054 0.19 Vinyl chloride d3 62/65 m-Xylene 106 183 1.69 -0- and p-Xylene 106 183 3.33 -
1 Native/labeled 2 181 = bromochloromethane
182 = 2-bromo-1-chloropropane 183 = 1,4-dichlorobutane
3 Not detected at a purge temperature of 20°C 4 Internal standard
17
Note: Because the composition and purity of commercially-supplied isotopically labeled stan-dard's may vary, the primary m/z of the labeled analogs given in this table should be used as guidance. The appropriate m/z of the labeled analogs should be determined prior to use for sample analysis. Deviations from the m/z's listed here must be documented by the laboratory and submitted with the data.
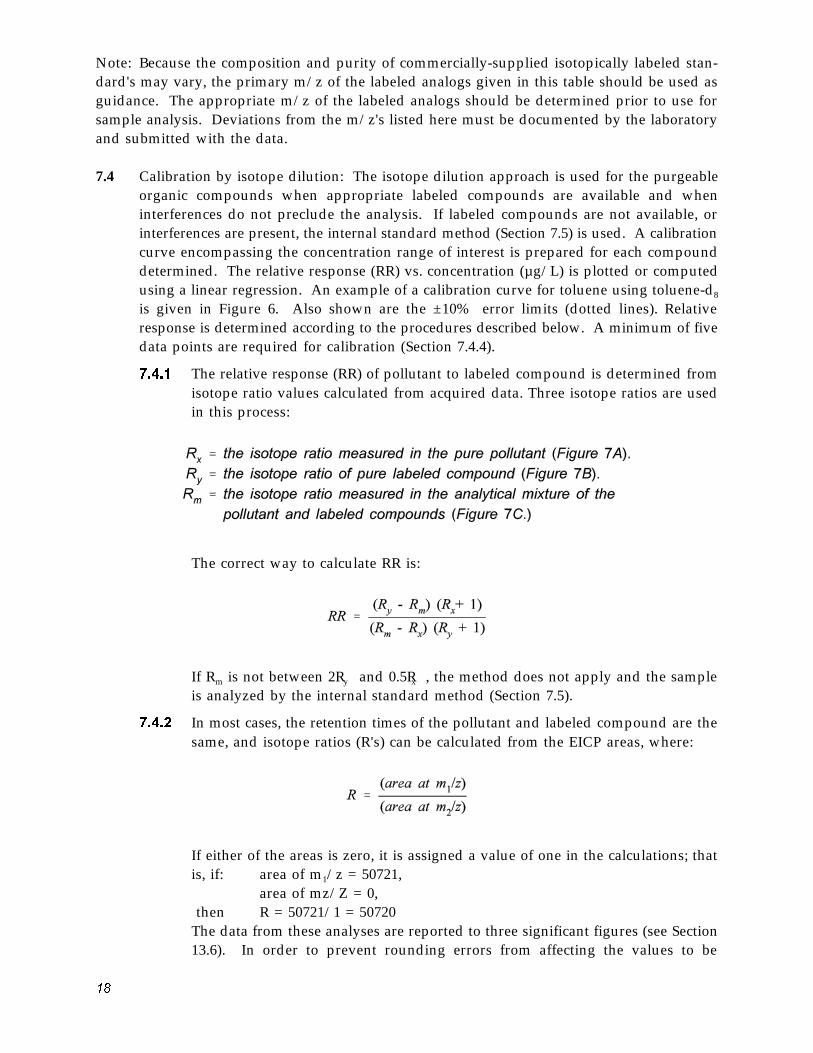
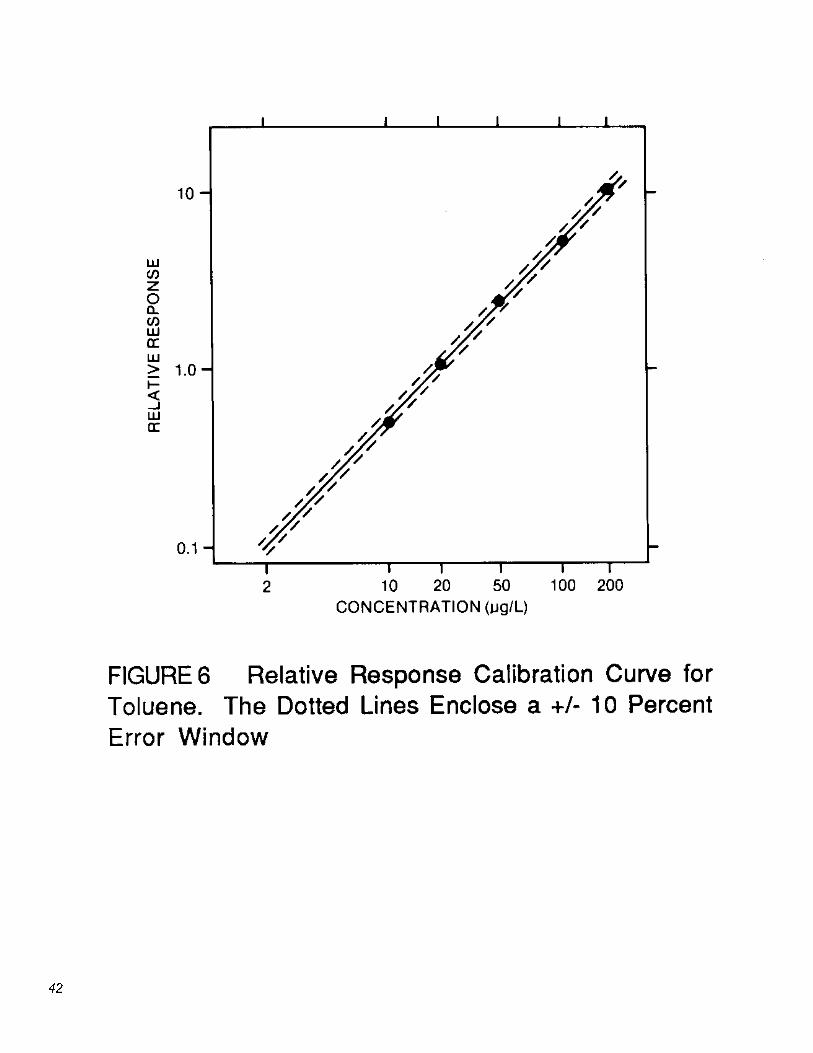
7.4 Calibration by isotope dilution: The isotope dilution approach is used for the purgeable organic compounds when appropriate labeled compounds are available and when interferences do not preclude the analysis. If labeled compounds are not available, or interferences are present, the internal standard method (Section 7.5) is used. A calibration curve encompassing the concentration range of interest is prepared for each compound determined. The relative response (RR) vs. concentration (µg/L) is plotted or computed using a linear regression. An example of a calibration curve for toluene using toluene-d8
is given in Figure 6. Also shown are the ±10% error limits (dotted lines). Relative response is determined according to the procedures described below. A minimum of five data points are required for calibration (Section 7.4.4).
7.4.1 The relative response (RR) of pollutant to labeled compound is determined from isotope ratio values calculated from acquired data. Three isotope ratios are used in this process:
The correct way to calculate RR is:
If R is not between 2R and 0.5R , the method does not apply and the sample m y x
is analyzed by the internal standard method (Section 7.5).
7.4.2 In most cases, the retention times of the pollutant and labeled compound are the same, and isotope ratios (R's) can be calculated from the EICP areas, where:
If either of the areas is zero, it is assigned a value of one in the calculations; that is, if: area of m /z = 50721, 1
area of mz/Z = 0, then R = 50721/1 = 50720 The data from these analyses are reported to three significant figures (see Section 13.6). In order to prevent rounding errors from affecting the values to be
1�
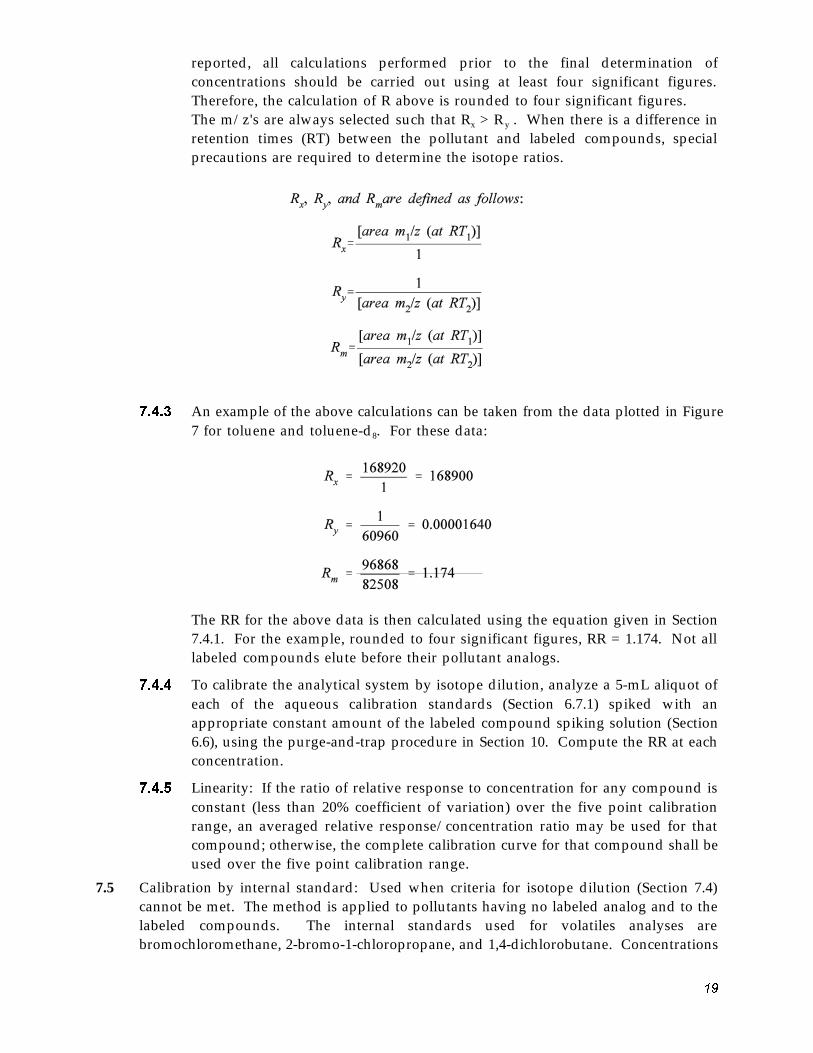
reported, all calculations performed prior to the final determination of concentrations should be carried out using at least four significant figures. Therefore, the calculation of R above is rounded to four significant figures. The m/z's are always selected such that Rx > Ry . When there is a difference in retention times (RT) between the pollutant and labeled compounds, special precautions are required to determine the isotope ratios.
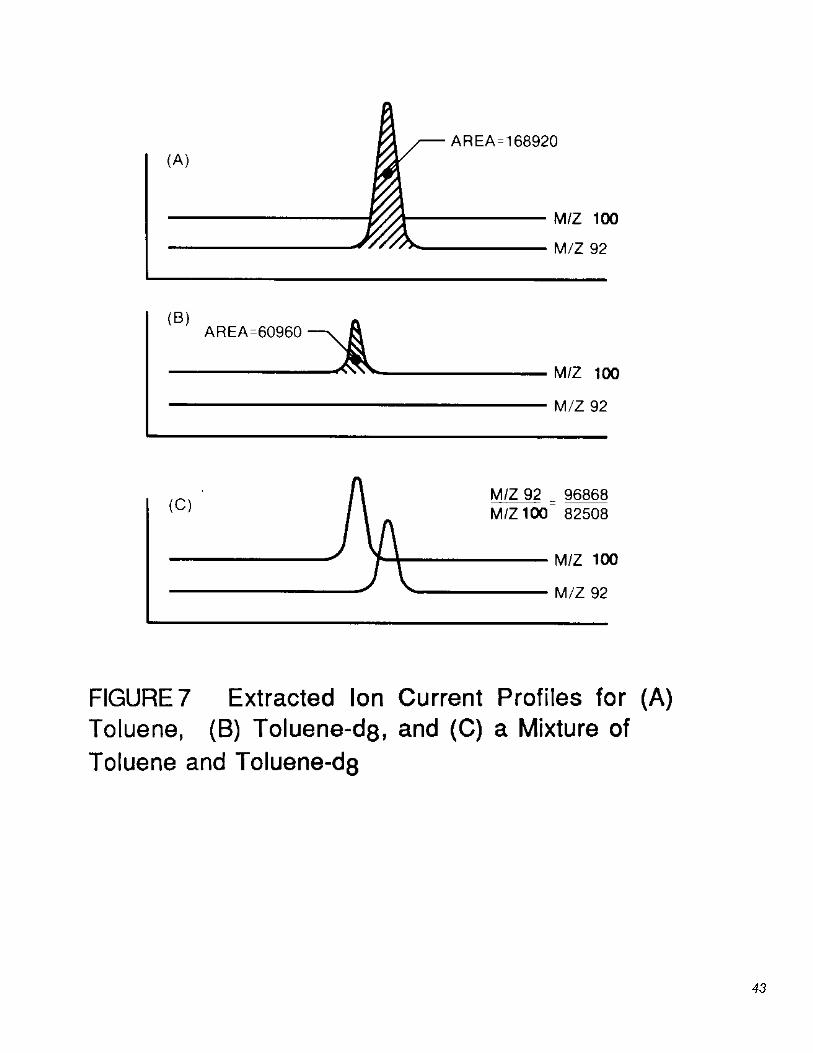
7.4.3 An example of the above calculations can be taken from the data plotted in Figure 7 for toluene and toluene-d . 8 For these data:
The RR for the above data is then calculated using the equation given in Section 7.4.1. For the example, rounded to four significant figures, RR = 1.174. Not all labeled compounds elute before their pollutant analogs.
7.4.4 To calibrate the analytical system by isotope dilution, analyze a 5-mL aliquot of each of the aqueous calibration standards (Section 6.7.1) spiked with an appropriate constant amount of the labeled compound spiking solution (Section 6.6), using the purge-and-trap procedure in Section 10. Compute the RR at each concentration.
7.4.5 Linearity: If the ratio of relative response to concentration for any compound is constant (less than 20% coefficient of variation) over the five point calibration range, an averaged relative response/concentration ratio may be used for that compound; otherwise, the complete calibration curve for that compound shall be used over the five point calibration range.
7.5 Calibration by internal standard: Used when criteria for isotope dilution (Section 7.4) cannot be met. The method is applied to pollutants having no labeled analog and to the labeled compounds. The internal standards used for volatiles analyses are bromochloromethane, 2-bromo-1-chloropropane, and 1,4-dichlorobutane. Concentrations
19
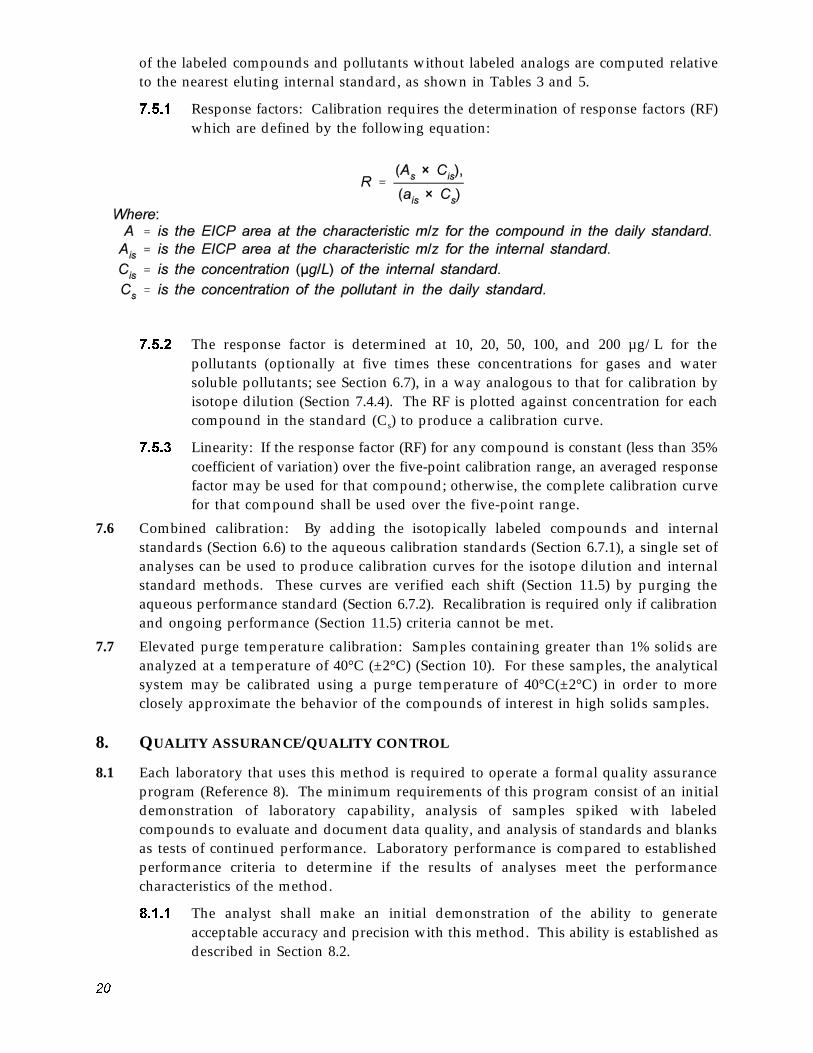
of the labeled compounds and pollutants without labeled analogs are computed relative to the nearest eluting internal standard, as shown in Tables 3 and 5.
7.5.1 Response factors: Calibration requires the determination of response factors (RF) which are defined by the following equation:
7.5.2 The response factor is determined at 10, 20, 50, 100, and 200 µg/L for the pollutants (optionally at five times these concentrations for gases and water soluble pollutants; see Section 6.7), in a way analogous to that for calibration by isotope dilution (Section 7.4.4). The RF is plotted against concentration for each compound in the standard (C ) to produce a calibration curve.s
7.5.3 Linearity: If the response factor (RF) for any compound is constant (less than 35% coefficient of variation) over the five-point calibration range, an averaged response factor may be used for that compound; otherwise, the complete calibration curve for that compound shall be used over the five-point range.
7.6 Combined calibration: By adding the isotopically labeled compounds and internal standards (Section 6.6) to the aqueous calibration standards (Section 6.7.1), a single set of analyses can be used to produce calibration curves for the isotope dilution and internal standard methods. These curves are verified each shift (Section 11.5) by purging the aqueous performance standard (Section 6.7.2). Recalibration is required only if calibration and ongoing performance (Section 11.5) criteria cannot be met.
7.7 Elevated purge temperature calibration: Samples containing greater than 1% solids are analyzed at a temperature of 40°C (±2°C) (Section 10). For these samples, the analytical system may be calibrated using a purge temperature of 40°C(±2°C) in order to more closely approximate the behavior of the compounds of interest in high solids samples.
8. QUALITY ASSURANCE/QUALITY CONTROL
8.1 Each laboratory that uses this method is required to operate a formal quality assurance program (Reference 8). The minimum requirements of this program consist of an initial demonstration of laboratory capability, analysis of samples spiked with labeled compounds to evaluate and document data quality, and analysis of standards and blanks as tests of continued performance. Laboratory performance is compared to established performance criteria to determine if the results of analyses meet the performance characteristics of the method.
�.1.1 The analyst shall make an initial demonstration of the ability to generate acceptable accuracy and precision with this method. This ability is established as described in Section 8.2.
�0
�.1.2 The analyst is permitted to modify this method to improve separations or lower the costs of measurements, provided all performance specifications are met. Each time a modification is made to the method, the analyst is required to repeat the procedure in Section 8.2 to demonstrate method performance.
8.1.3 Analyses of blanks are required to demonstrate freedom from contamination and that the compounds of interest and interfering compounds have not been carried over from a previous analysis (Section 3). The procedures and criteria for analysis of a blank are described in Section 8.5.
�.1.4 The laboratory shall spike all samples with labeled compounds to monitor method performance. This test is described in Section 8.3. When results of these spikes indicate atypical method performance for samples, the samples are diluted to bring method performance within acceptable limits (Section 14.2).
�.1.5 The laboratory shall, on an ongoing basis, demonstrate through the analysis of the aqueous performance standard (Section 6.7.2) that the analysis system is in control. This procedure is described in Sections 11.1 and 11.5.
�.1.6 The laboratory shall maintain records to define the quality of data that is generated. Development of accuracy statements is described in Sections 8.4 and 11.5.2.
�1
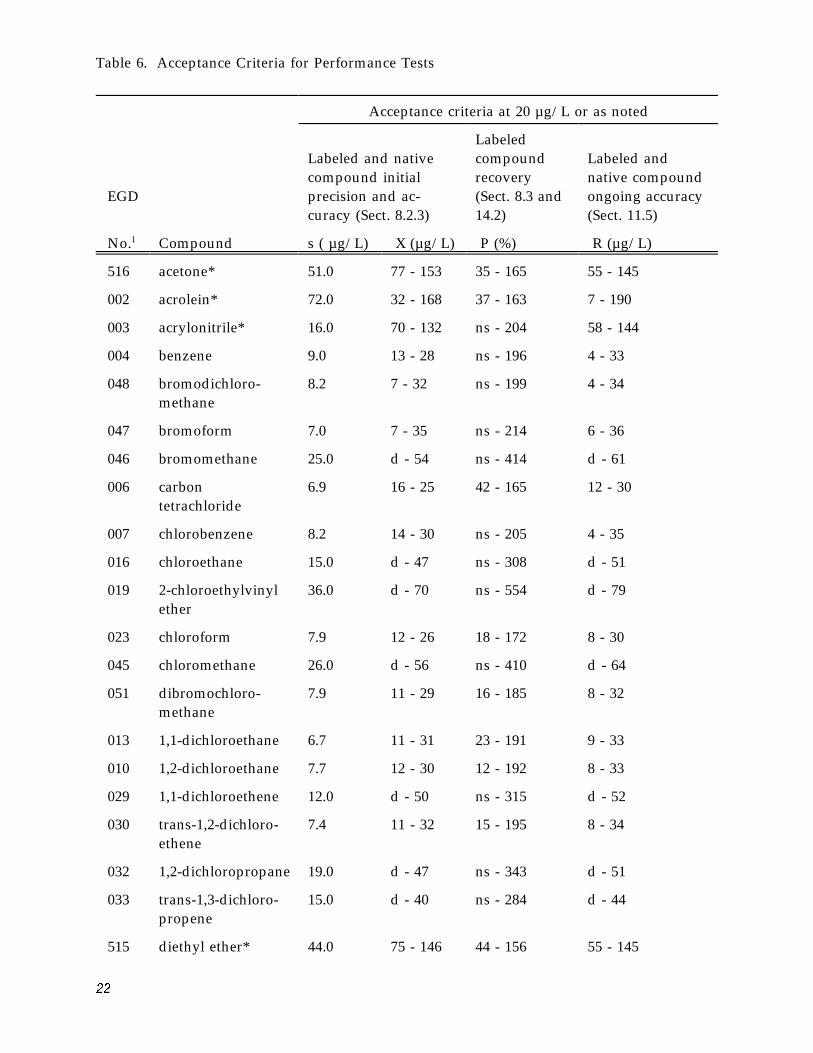
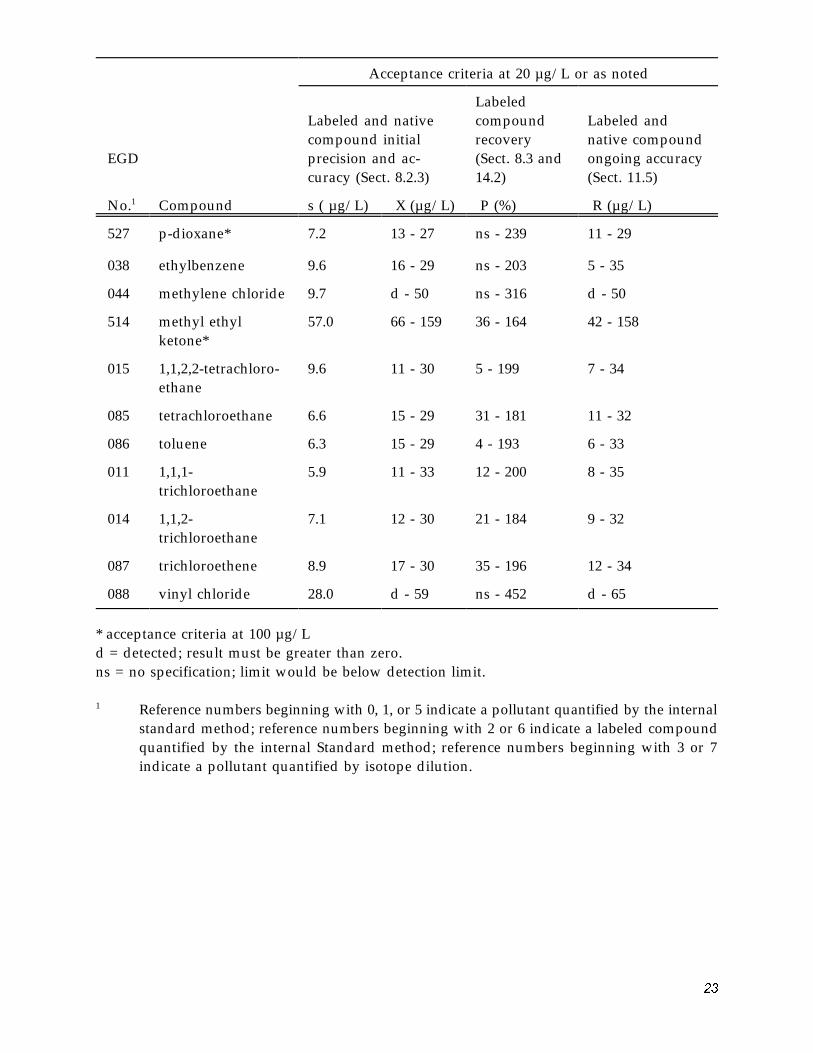
Table 6. Acceptance Criteria for Performance Tests
Acceptance criteria at 20 µg/L or as noted
Labeled compound recovery (Sect. 8.3 and 14.2)
P (%)
Labeled and native compound initial precision and ac-curacy (Sect. 8.2.3)
Labeled and native compound ongoing accuracy (Sect. 11.5)
R (µg/L)
EGD
No.1
516
Compound
acetone*
s ( µg/L)
51.0
X (µg/L)
77 - 153 35 - 165 55 - 145
002 acrolein* 72.0 32 - 168 37 - 163 7 - 190
003 acrylonitrile* 16.0 70 - 132 ns - 204 58 - 144
004 benzene 9.0 13 - 28 ns - 196 4 - 33
048 bromodichloro-methane
8.2 7 - 32 ns - 199 4 - 34
047 bromoform 7.0 7 - 35 ns - 214 6 - 36
046 bromomethane 25.0 d - 54 ns - 414 d - 61
006 carbon tetrachloride
6.9 16 - 25 42 - 165 12 - 30
007 chlorobenzene 8.2 14 - 30 ns - 205 4 - 35
016 chloroethane 15.0 d - 47 ns - 308 d - 51
019 2-chloroethylvinyl ether
36.0 d - 70 ns - 554 d - 79
023 chloroform 7.9 12 - 26 18 - 172 8 - 30
045 chloromethane 26.0 d - 56 ns - 410 d - 64
051 dibromochloro-methane
7.9 11 - 29 16 - 185 8 - 32
013 1,1-dichloroethane 6.7 11 - 31 23 - 191 9 - 33
010 1,2-dichloroethane 7.7 12 - 30 12 - 192 8 - 33
029 1,1-dichloroethene 12.0 d - 50 ns - 315 d - 52
030 trans-1,2-dichloro-ethene
7.4 11 - 32 15 - 195 8 - 34
032 1,2-dichloropropane 19.0 d - 47 ns - 343 d - 51
033 trans-1,3-dichloro-propene
15.0 d - 40 ns - 284 d - 44
515 diethyl ether* 44.0 75 - 146 44 - 156 55 - 145
��
1
Acceptance criteria at 20 µg/L or as noted
Labeled compound recovery (Sect. 8.3 and 14.2)
P (%)
Labeled and native compound initial precision and ac-curacy (Sect. 8.2.3)
Labeled and native compound ongoing accuracy (Sect. 11.5)
R (µg/L)
EGD
No.1
527
Compound
p-dioxane*
s ( µg/L)
7.2
X (µg/L)
13 - 27 ns - 239 11 - 29
038 ethylbenzene 9.6 16 - 29 ns - 203 5 - 35
044 methylene chloride 9.7 d - 50 ns - 316 d - 50
514 methyl ethyl ketone*
57.0 66 - 159 36 - 164 42 - 158
015 1,1,2,2-tetrachloro-ethane
9.6 11 - 30 5 - 199 7 - 34
085 tetrachloroethane 6.6 15 - 29 31 - 181 11 - 32
086 toluene 6.3 15 - 29 4 - 193 6 - 33
011 1,1,1-trichloroethane
5.9 11 - 33 12 - 200 8 - 35
014 1,1,2-trichloroethane
7.1 12 - 30 21 - 184 9 - 32
087 trichloroethene 8.9 17 - 30 35 - 196 12 - 34
088 vinyl chloride 28.0 d - 59 ns - 452 d - 65
* acceptance criteria at 100 µg/L d = detected; result must be greater than zero. ns = no specification; limit would be below detection limit.
Reference numbers beginning with 0, 1, or 5 indicate a pollutant quantified by the internal standard method; reference numbers beginning with 2 or 6 indicate a labeled compound quantified by the internal Standard method; reference numbers beginning with 3 or 7 indicate a pollutant quantified by isotope dilution.
�3
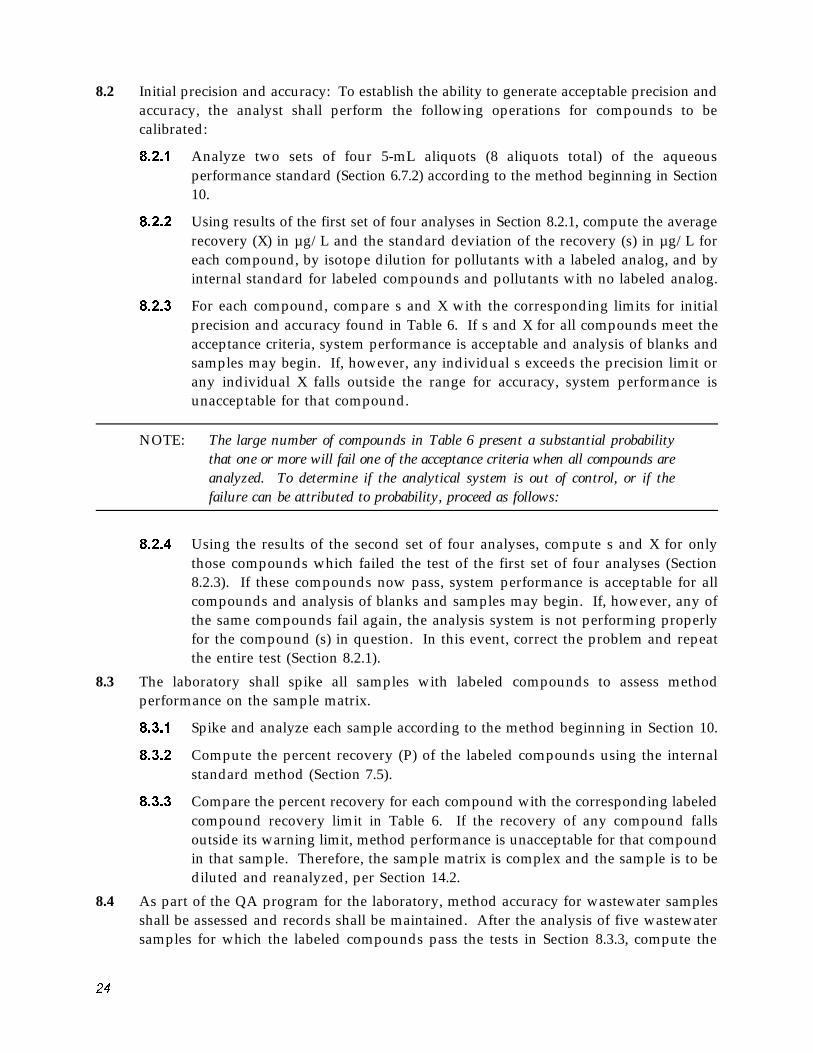
8.2 Initial precision and accuracy: To establish the ability to generate acceptable precision and accuracy, the analyst shall perform the following operations for compounds to be calibrated:
�.2.1 Analyze two sets of four 5-mL aliquots (8 aliquots total) of the aqueous performance standard (Section 6.7.2) according to the method beginning in Section 10.
�.2.2 Using results of the first set of four analyses in Section 8.2.1, compute the average recovery (X) in µg/L and the standard deviation of the recovery (s) in µg/L for each compound, by isotope dilution for pollutants with a labeled analog, and by internal standard for labeled compounds and pollutants with no labeled analog.
�.2.3 For each compound, compare s and X with the corresponding limits for initial precision and accuracy found in Table 6. If s and X for all compounds meet the acceptance criteria, system performance is acceptable and analysis of blanks and samples may begin. If, however, any individual s exceeds the precision limit or any individual X falls outside the range for accuracy, system performance is unacceptable for that compound.
NOTE: The large number of compounds in Table 6 present a substantial probability that one or more will fail one of the acceptance criteria when all compounds are analyzed. To determine if the analytical system is out of control, or if the failure can be attributed to probability, proceed as follows:
�.2.4 Using the results of the second set of four analyses, compute s and X for only those compounds which failed the test of the first set of four analyses (Section 8.2.3). If these compounds now pass, system performance is acceptable for all compounds and analysis of blanks and samples may begin. If, however, any of the same compounds fail again, the analysis system is not performing properly for the compound (s) in question. In this event, correct the problem and repeat the entire test (Section 8.2.1).
8.3 The laboratory shall spike all samples with labeled compounds to assess method performance on the sample matrix.
�.3.1 Spike and analyze each sample according to the method beginning in Section 10.
�.3.2 Compute the percent recovery (P) of the labeled compounds using the internal standard method (Section 7.5).
�.3.3 Compare the percent recovery for each compound with the corresponding labeled compound recovery limit in Table 6. If the recovery of any compound falls outside its warning limit, method performance is unacceptable for that compound in that sample. Therefore, the sample matrix is complex and the sample is to be diluted and reanalyzed, per Section 14.2.
8.4 As part of the QA program for the laboratory, method accuracy for wastewater samples shall be assessed and records shall be maintained. After the analysis of five wastewater samples for which the labeled compounds pass the tests in Section 8.3.3, compute the
��
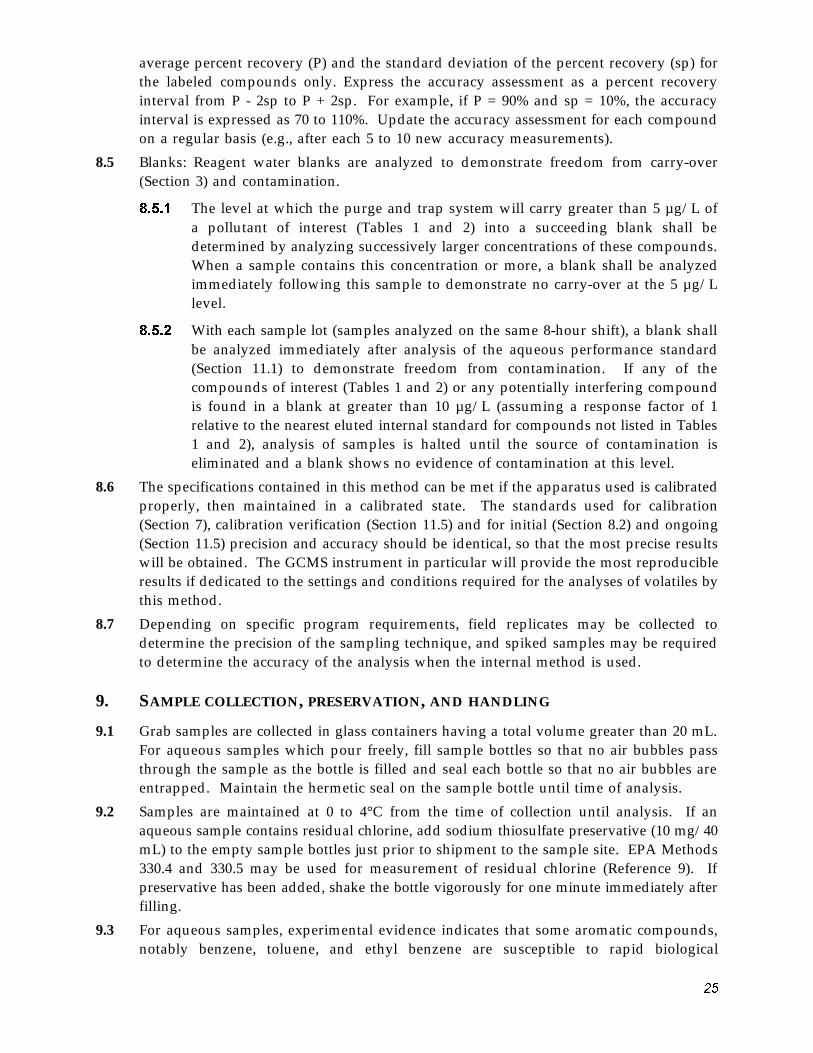
average percent recovery (P) and the standard deviation of the percent recovery (sp) for the labeled compounds only. Express the accuracy assessment as a percent recovery interval from P - 2sp to P + 2sp. For example, if P = 90% and sp = 10%, the accuracy interval is expressed as 70 to 110%. Update the accuracy assessment for each compound on a regular basis (e.g., after each 5 to 10 new accuracy measurements).
8.5 Blanks: Reagent water blanks are analyzed to demonstrate freedom from carry-over (Section 3) and contamination.
�.5.1 The level at which the purge and trap system will carry greater than 5 µg/L of a pollutant of interest (Tables 1 and 2) into a succeeding blank shall be determined by analyzing successively larger concentrations of these compounds. When a sample contains this concentration or more, a blank shall be analyzed immediately following this sample to demonstrate no carry-over at the 5 µg/L level.
�.5.2 With each sample lot (samples analyzed on the same 8-hour shift), a blank shall be analyzed immediately after analysis of the aqueous performance standard (Section 11.1) to demonstrate freedom from contamination. If any of the compounds of interest (Tables 1 and 2) or any potentially interfering compound is found in a blank at greater than 10 µg/L (assuming a response factor of 1 relative to the nearest eluted internal standard for compounds not listed in Tables 1 and 2), analysis of samples is halted until the source of contamination is eliminated and a blank shows no evidence of contamination at this level.
8.6 The specifications contained in this method can be met if the apparatus used is calibrated properly, then maintained in a calibrated state. The standards used for calibration (Section 7), calibration verification (Section 11.5) and for initial (Section 8.2) and ongoing (Section 11.5) precision and accuracy should be identical, so that the most precise results will be obtained. The GCMS instrument in particular will provide the most reproducible results if dedicated to the settings and conditions required for the analyses of volatiles by this method.
8.7 Depending on specific program requirements, field replicates may be collected to determine the precision of the sampling technique, and spiked samples may be required to determine the accuracy of the analysis when the internal method is used.
9. SAMPLE COLLECTION, PRESERVATION, AND HANDLING
9.1 Grab samples are collected in glass containers having a total volume greater than 20 mL. For aqueous samples which pour freely, fill sample bottles so that no air bubbles pass through the sample as the bottle is filled and seal each bottle so that no air bubbles are entrapped. Maintain the hermetic seal on the sample bottle until time of analysis.
9.2 Samples are maintained at 0 to 4°C from the time of collection until analysis. If an aqueous sample contains residual chlorine, add sodium thiosulfate preservative (10 mg/40 mL) to the empty sample bottles just prior to shipment to the sample site. EPA Methods 330.4 and 330.5 may be used for measurement of residual chlorine (Reference 9). If preservative has been added, shake the bottle vigorously for one minute immediately after filling.
9.3 For aqueous samples, experimental evidence indicates that some aromatic compounds, notably benzene, toluene, and ethyl benzene are susceptible to rapid biological
�5
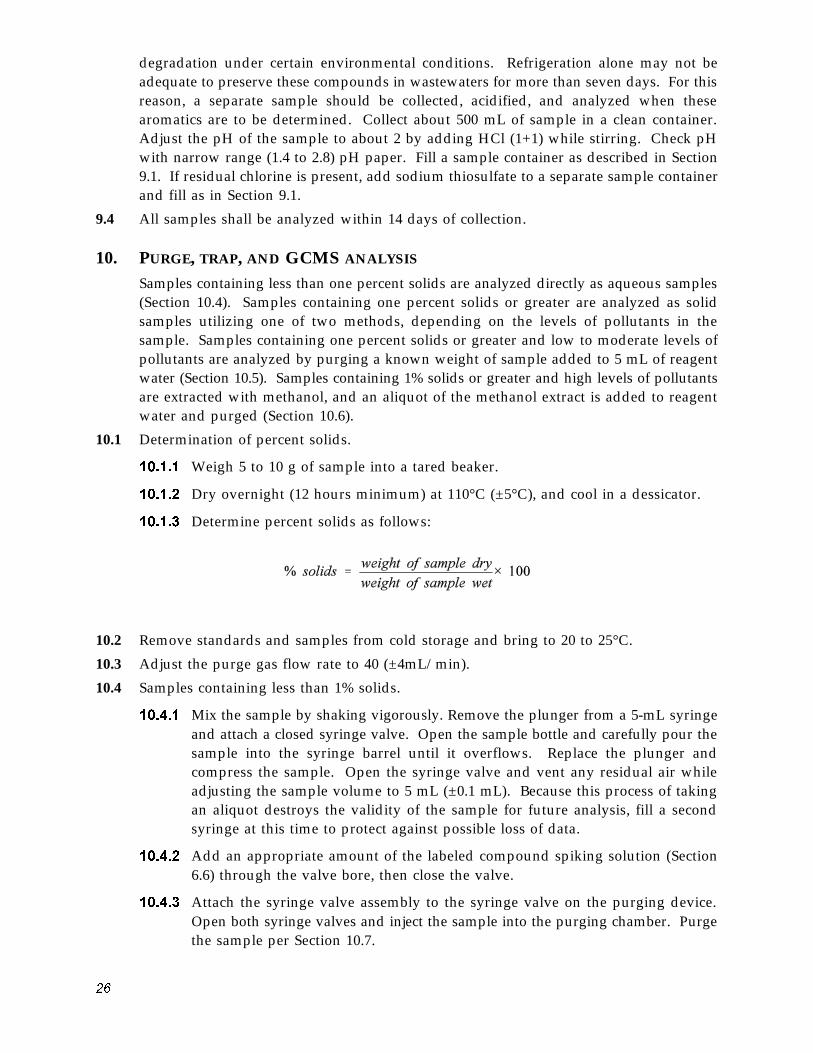
degradation under certain environmental conditions. Refrigeration alone may not be adequate to preserve these compounds in wastewaters for more than seven days. For this reason, a separate sample should be collected, acidified, and analyzed when these aromatics are to be determined. Collect about 500 mL of sample in a clean container. Adjust the pH of the sample to about 2 by adding HCl (1+1) while stirring. Check pH with narrow range (1.4 to 2.8) pH paper. Fill a sample container as described in Section 9.1. If residual chlorine is present, add sodium thiosulfate to a separate sample container and fill as in Section 9.1.
9.4 All samples shall be analyzed within 14 days of collection.
10. PURGE, TRAP, AND GCMS ANALYSIS
Samples containing less than one percent solids are analyzed directly as aqueous samples (Section 10.4). Samples containing one percent solids or greater are analyzed as solid samples utilizing one of two methods, depending on the levels of pollutants in the sample. Samples containing one percent solids or greater and low to moderate levels of pollutants are analyzed by purging a known weight of sample added to 5 mL of reagent water (Section 10.5). Samples containing 1% solids or greater and high levels of pollutants are extracted with methanol, and an aliquot of the methanol extract is added to reagent water and purged (Section 10.6).
10.1 Determination of percent solids.
10.1.1 Weigh 5 to 10 g of sample into a tared beaker.
10.1.2 Dry overnight (12 hours minimum) at 110°C (±5°C), and cool in a dessicator.
10.1.3 Determine percent solids as follows:
10.2 Remove standards and samples from cold storage and bring to 20 to 25°C.
10.3 Adjust the purge gas flow rate to 40 (±4mL/min).
10.4 Samples containing less than 1% solids.
10.4.1 Mix the sample by shaking vigorously. Remove the plunger from a 5-mL syringe and attach a closed syringe valve. Open the sample bottle and carefully pour the sample into the syringe barrel until it overflows. Replace the plunger and compress the sample. Open the syringe valve and vent any residual air while adjusting the sample volume to 5 mL (±0.1 mL). Because this process of taking an aliquot destroys the validity of the sample for future analysis, fill a second syringe at this time to protect against possible loss of data.
10.4.2 Add an appropriate amount of the labeled compound spiking solution (Section 6.6) through the valve bore, then close the valve.
10.4.3 Attach the syringe valve assembly to the syringe valve on the purging device. Open both syringe valves and inject the sample into the purging chamber. Purge the sample per Section 10.7.
��
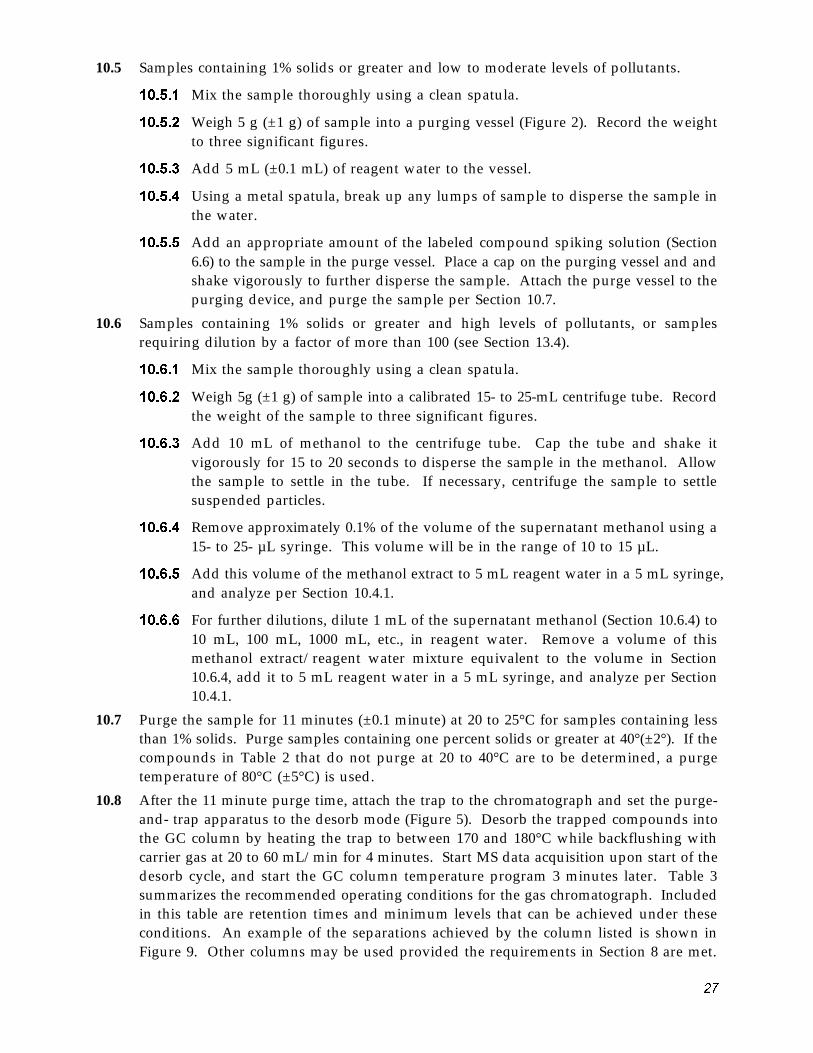
10.5 Samples containing 1% solids or greater and low to moderate levels of pollutants.
10.5.1 Mix the sample thoroughly using a clean spatula.
10.5.2 Weigh 5 g (±1 g) of sample into a purging vessel (Figure 2). Record the weight to three significant figures.
10.5.3 Add 5 mL (±0.1 mL) of reagent water to the vessel.
10.5.4 Using a metal spatula, break up any lumps of sample to disperse the sample in the water.
10.5.5 Add an appropriate amount of the labeled compound spiking solution (Section 6.6) to the sample in the purge vessel. Place a cap on the purging vessel and and shake vigorously to further disperse the sample. Attach the purge vessel to the purging device, and purge the sample per Section 10.7.
10.6 Samples containing 1% solids or greater and high levels of pollutants, or samples requiring dilution by a factor of more than 100 (see Section 13.4).
10.6.1 Mix the sample thoroughly using a clean spatula.
10.6.2 Weigh 5g (±1 g) of sample into a calibrated 15- to 25-mL centrifuge tube. Record the weight of the sample to three significant figures.
10.6.3 Add 10 mL of methanol to the centrifuge tube. Cap the tube and shake it vigorously for 15 to 20 seconds to disperse the sample in the methanol. Allow the sample to settle in the tube. If necessary, centrifuge the sample to settle suspended particles.
10.6.4 Remove approximately 0.1% of the volume of the supernatant methanol using a 15- to 25- µL syringe. This volume will be in the range of 10 to 15 µL.
10.6.5 Add this volume of the methanol extract to 5 mL reagent water in a 5 mL syringe, and analyze per Section 10.4.1.
10.6.6 For further dilutions, dilute 1 mL of the supernatant methanol (Section 10.6.4) to 10 mL, 100 mL, 1000 mL, etc., in reagent water. Remove a volume of this methanol extract/reagent water mixture equivalent to the volume in Section 10.6.4, add it to 5 mL reagent water in a 5 mL syringe, and analyze per Section 10.4.1.
10.7 Purge the sample for 11 minutes (±0.1 minute) at 20 to 25°C for samples containing less than 1% solids. Purge samples containing one percent solids or greater at 40°(±2°). If the compounds in Table 2 that do not purge at 20 to 40°C are to be determined, a purge temperature of 80°C (±5°C) is used.
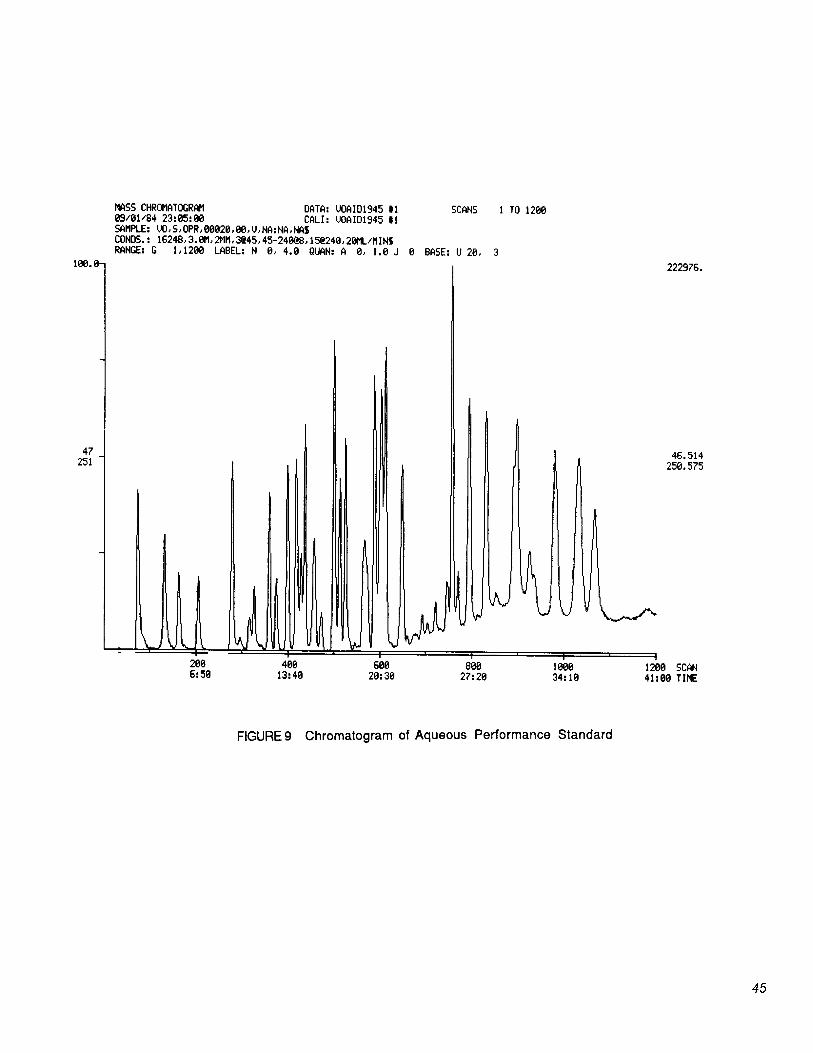
10.8 After the 11 minute purge time, attach the trap to the chromatograph and set the purge-and- trap apparatus to the desorb mode (Figure 5). Desorb the trapped compounds into the GC column by heating the trap to between 170 and 180°C while backflushing with carrier gas at 20 to 60 mL/min for 4 minutes. Start MS data acquisition upon start of the desorb cycle, and start the GC column temperature program 3 minutes later. Table 3 summarizes the recommended operating conditions for the gas chromatograph. Included in this table are retention times and minimum levels that can be achieved under these conditions. An example of the separations achieved by the column listed is shown in Figure 9. Other columns may be used provided the requirements in Section 8 are met.
�7
If the priority pollutant gases produce GC peaks so broad that the precision and recovery specifications (Section 8.2) cannot be met, the column may be cooled to ambient or subambient temperatures to sharpen these peaks.
10.9 After desorbing the sample for four minutes, recondition the trap by purging with purge gas while maintaining the trap temperature at between 170 and 180°C. After approximately 7 minutes, turn off the trap heater to stop the gas flow through the trap. When cool, the trap is ready for the next sample.
10.10 While analysis of the desorbed compounds proceeds, remove and clean the purge device. Rinse with tap water, clean with detergent and water, rinse with tap and distilled water, and dry for aminimum of 1 hour in an oven at a temperature greater than 150°C.
11. SYSTEM PERFORMANCE
11.1 At the beginning of each 8 hour shift during which analyses are performed, system calibration and performance shall be verified for the pollutants and labeled compounds (Table 1). For these tests, analysis of the aqueous performance standard (Section 6.7.2) shall be used to verify all performance criteria. Adjustment and/or recalibration (per Section 7) shall be performed until all performance criteria are met. Only after all performance criteria are met may blanks and samples be analyzed.
11.2 BFB spectrum validity: The criteria in Table 4 shall be met.
11.3 Retention times: The absolute retention times of the internal standards shall be as follows: bromochloromethane: 653 to 782 seconds; 2-bromo-1-chloropropane: 1270 to 1369 seconds; 1,4-dichlorobutane: 1510 to 1605 seconds. The relative retention times of all pollutants and labeled compounds shall fall within the limits given in Table 3.
91 and 9911.4 GC resolution: The valley height between toluene and toluene-d (at m/z 8
plotted on the same graph) shall be less than 10% of the taller of the two peaks.
11.5 Calibration verification and ongoing precision and accuracy: Compute the concentration of each pollutant (Table 1) by isotope dilution (Section 7.4) for those compounds which have labeled analogs. Compute the concentration of each pollutant which has no labeled analog by the internal standard method (Section 7.5). Compute the concentrations of the labeled compounds themselves by the internal standard method. These concentrations are computed based on the calibration data determined in Section 7.
11.5.1 For each pollutant and labeled compound, compare the concentration with the corresponding limit for ongoing accuracy in Table 6. If all compounds meet the acceptance criteria, system performance is acceptable and analysis of blanks and samples may continue. If any individual value falls outside the range given, system performance is unacceptable for that compound.
NOTE: The large number of compounds in Table 6 present a substantial probability that one or more will fail the acceptance criteria when all compounds are analyzed. To determine if the analytical system is out of control, or if the failure may be attributed to probability, proceed as follows:
11.5.1.1 Analyze a second aliquot of the aqueous performance standard (Section 6.7.2).
��
11.5.1.2 Compute the concentration for only those compounds which failed the first test (Section 11.5.1). If these compounds now pass, system performance is acceptable for all compounds, and analyses of blanks and samples may proceed. If, however, any of the compounds fail again, the measurement system is not performing properly for these compounds. In this event, locate and correct the problem or recalibrate the system (Section 7), and repeat the entire test (Section 11.1) for all compounds.
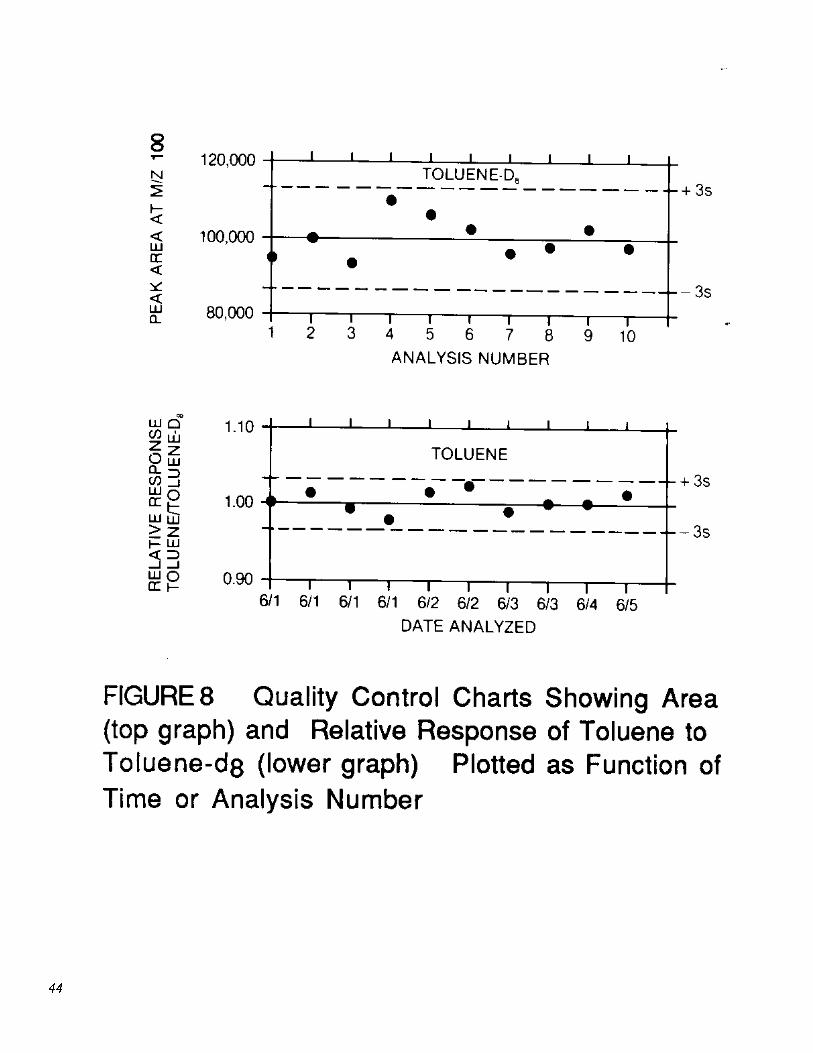
11.5.2 Add results which pass the specification in Section 11.5.1.2 to initial (Section 8.2) and previous on-going data. Update QC charts to form a graphic representation of laboratory performance (Figure 8). Develop a statement of accuracy for each pollutant and labeled compound by calculating the average percent recovery (R) and the standard deviation of percent recovery (sr). Express the accuracy as a recovery interval from R − 2sr to R + 2sr. For example, if R = 95% and sr = 5%, the accuracy is 85 to 105%.
12. QUALITATIVE DETERMINATION
Identification is accomplished by comparison of data from analysis of a sample or blank with data stored in the mass-spectral libraries. For compounds for which the relative retention times and mass spectra are known, identification is confirmed per Sections 12.1 and 12.2. For unidentified GC peaks, the spectrum is compared to spectra in the EPA/NIH mass spectral file per Section 12.3.
12.1 Labeled compounds and pollutants having no labeled analog (Tables 1 and 2):
12.1.1 The signals for all characteristic m/z's stored in the spectral library (Section 7.2.3) shall be present and shall maximize within the same two consecutive scans.
12.1.2 Either (1) the background corrected EICP areas or (2) the corrected relative intensities of the mass spectral peaks at the GC peak maximum shall agree within a factor of 2 (0.5 to 2 times) for all masses stored in the library.
12.1.3 In order for the compounds for which the system has been calibrated (Table 1) to be identified, their relative retention times shall be within the retention-time windows specified in Table 3.
12.1.4 The system has not been calibrated for the compounds listed in Table 2; however, the relative retention times and mass spectra of these compounds are known. Therefore, for a compound in Table 2 to be identified, its relative retention time must fall within a retention-time window of ±60 seconds or ±20 scans (whichever is greater) of the nominal retention time of the compound specified in Table 3.
12.2 Pollutants having a labeled analog (Table 1):
12.2.1 The signals for all characteristic m/z's stored in the spectral library (Section 7.2.3) shall be present and shall maximize within the same two consecutive scans.
12.2.2 Either (1) the background corrected EICP areas or (2) the corrected relative intensities of the mass spectral peaks at the GC peak maximum shall agree within a factor of two for all masses stored in the spectral library.
�9
12.2.3 The relative retention time between the pollutant and its labeled analog shall be within the windows specified in Table 3.
12.3 Unidentified GC peaks.
12.3.1 The signals for m/z's specific to a GC peak shall all maximize within the same two consecutive scans.
12.3.2 Either (1) the background corrected EICP areas or (2) the corrected relative intensities of the mass spectral peaks at the GC peak maximum shall agree within a factor of 2 with the masses stored in the EPA/NIH mass-spectral file.
12.4 The m/z's present in the sample mass spectrum that are not present in the reference mass spectrum shall be accounted for by contaminant or background ions. If the sample mass spectrum is contaminated, or if identification is ambiguous, an experienced spectrometrist (Section 1.4) is to determine the presence or absence of the compound.
13. QUANTITATIVE DETERMINATION
13.1 Isotope dilution: Because the pollutant and its labeled analog exhibit the same effects upon purging, desorption, and gas chromatography, correction for recovery of the pollutant can be made by adding a known amount of a labeled compound to every sample prior to purging. Relative response (RR) values for sample mixtures are used in conjunction with the calibration curves described in Section 7.4 to determine concentrations directly, so long as labeled compound spiking levels are constant. For the toluene example given in Figure 7 (Section 7.4.3), RR would be equal to 1.174. For this RR value, the toluene calibration curve given in Figure 6 indicates a concentration of 31.8 µg/L.
13.2 Internal standard: For the compounds for which the system was calibrated (Table 1) according to Section 7.5, use the response factor determined during the calibration to calculate the concentration from the following equation.
where the terms are as defined in Section 7.5.1. For the compounds for which the system was not calibrated (Table 2), use the response factors in Table 5 to calculate the concentration.
13.3 The concentration of the pollutant in the solid phase of the sample is computed using the concentration of the pollutant detected in the aqueous solution, as follows:
13.4 Dilution of samples: If the EICP area at the quantitation m/z exceeds the calibration range of the system, samples are diluted by successive factors of 10 until the area is within the calibration range.
30
13.4.1 For aqueous samples, bring 0.50 mL, 0.050 mL, 0.0050 mL, etc., to 5-mL volume with reagent water and analyze per Section 10.4.
13.4.2 For samples containing high solids, substitute 0.50 or 0.050 g in Section 10.5.2 to achieve a factor of 10 or 100 dilution, respectively.
13.4.3 If dilution of high solids samples by greater than a factor of 100 is required, then extract the sample with methanol, as described in Section 10.6.
13.5 Dilution of samples containing high concentrations of compounds not in Table 1: When the EICP area of the quantitation m/z of a compound to be identified per Section 12.3 exceeds the linear range of the GCMS system, or when any peak in the mass spectrum is saturated, dilute the sample per Sections 13.4.1 through 13.4.3.
13.6 Report results for all pollutants, labeled compounds, and tentatively identified compounds found in all standards, blanks, and samples to three significant figures. For samples containing less than 1% solids, the units are µg/L; and for undiluted samples containing 1% solids or greater, units are µg/kg.
13.6.1 Results for samples which have been diluted are reported at the least dilute level at which the area at the quantitation m/z is within the calibration range (Section 13.4), or at which no m/z in the spectrum is saturated (Section 13.5). For compounds having a labeled analog, results are reported at the least dilute level at which the area at the quantitation m/z is within the calibration range (Section 13.4) and the labeled compound recovery is within the normal range for the method (Section 14.2).
14. ANALYSIS OF COMPLEX SAMPLES
14.1 Some samples may contain high levels (>1000 µg/kg) of the compounds of interest and of interfering compounds. Some samples will foam excessively when purged. Others will overload the trap or the GC column.
14.2 When the recovery of any labeled compound is outside the range given in Table 6, dilute 0.5 mL of samples containing less than 1% solids, or 0.5 g of samples containing 1% solids or greater, with 4.5 mL of reagent water and analyze this diluted sample. If the recovery remains outside of the range for this diluted sample, the aqueous performance standard shall be analyzed (Section 11) and calibration verified (Section 11.5). If the recovery for the labeled compound in the aqueous performance standard is outside the range given in Table 6, the analytical system is out of control. In this case, the instrument shall be repaired, the performance specifications in Section 11 shall be met, and the analysis of the undiluted sample shall be repeated. If the recovery for the aqueous performance standard is within the range given in Table 6, then the method does not apply to the sample being analyzed, and the result may not be reported for regulatory compliance purposes.
14.3 When a high level of the pollutant is present, reverse search computer programs may misinterpret the spectrum of chromatographically unresolved pollutant and labeled compound pairs with overlapping spectra. Examine each chromatogram for peaks greater than the height of the internal standard peaks. These peaks can obscure the compounds of interest.
31
15. METHOD PERFORMANCE
15.1 The specifications for this method were taken from the interlaboratory validation of EPA Method 624 (Reference 10). Method 1624 has been shown to yield slightly better performance on treated effluents than method 624. Results of initial tests of this method at a purge temperature of 80°C can be found in Reference 11 and results of initial tests of this method on municipal sludge can be found in Reference 12.
15.2 A chromatogram of the 20 µg/L aqueous performance standards (Sections 6.7.2 and 11.1) is shown in Figure 9.
Reference
1. "Performance Tests for the Evaluation of Computerized Gas Chromatography/MassSpectrometry Equipment and Laboratories," USEPA, EMSL Cincinnati, OH 45268,EPA-600/4-80-025 (April 1980).
2. Bellar, T. A. and Lichtenberg, J. J., "Journal American Water Works Association," 66, 739(1974).
3. Bellar, T. A. and Lichtenberg, J. J., "Semi-Automated Headspace Analysis of DrinkingWaters and Industrial Waters for Purgeable Volatile Organic Compounds," in Measurementof Organic Pollutants in Water and Wastewater, C. E. VanHall, ed., American Society forTesting Materials, Philadelphia, PA, Special Technical Publication 686, (1978).
4. National Standard Reference Data System, "Mass Spectral Tape Format," U.S. NationalBureau of Standards (1979 and later attachments).
5. "Working with Carcinogens," DHEW, PHS, NIOSH, Publication 77-206 (1977).6. "OSHA Safety and Health Standards, General Industry," 29 CFR 1910, OSHA 2206, (1976).7. "Safety in Academic Chemistry Laboratories," American Chemical Society Publication,
Committee on Chemical Safety (1979).8. "Handbook of Analytical Quality Control in Water and Wastewater Laboratories," USEPA,
EMSL Cincinnati, OH 45268, EPA-4-79-019 (March 1979).9. "Methods 330.4 and 330.5 for Total Residual Chlorine," USEPA, EMSL Cincinnati, OH
45268, EPA-4-79-020 (March 1979).10. "Method 624--Purgeables", 40 CFR Part 136 (49 FR 43234), 26 October 1984.11. "Narrative for SAS 106: Development of an Isotope Dilution GC/MS Method for Hot
Purge and-Trap Volatiles Analysis," S-CUBED Division of Maxwell Laboratories, Inc.,Prepared for W. A. Telliard, Industrial Technology Division (WH-552), USEPA, 401 M St.SW, Washington DC 20460 (July 1986).
12. Colby, Bruce N. and Ryan, Philip W., "Initial Evaluation of Methods 1634 and 1635 for theAnalysis of Municipal Wastewater Treatment Sludges by Isotope Dilution GCMS," PacificAnalytical Inc., Prepared for W. A. Telliard, Industrial Technology Division (WH-552),USEPA, 401 M St. SW, Washington DC 20460 (July 1986).
3�
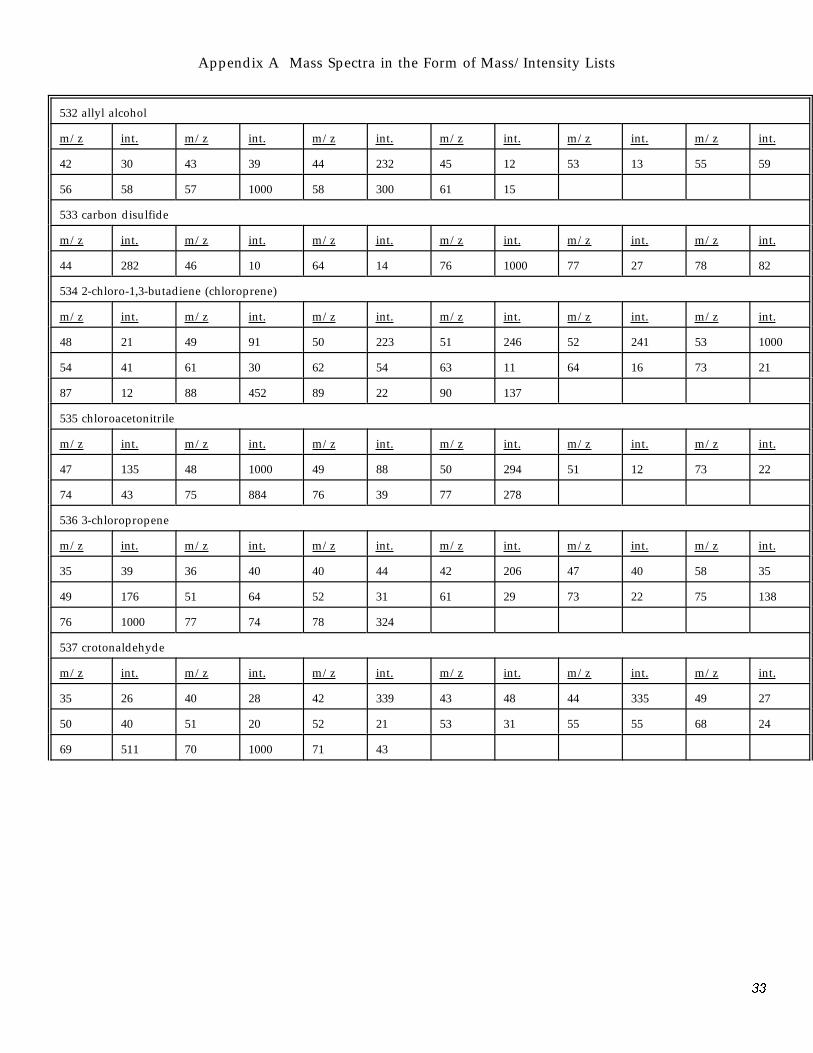
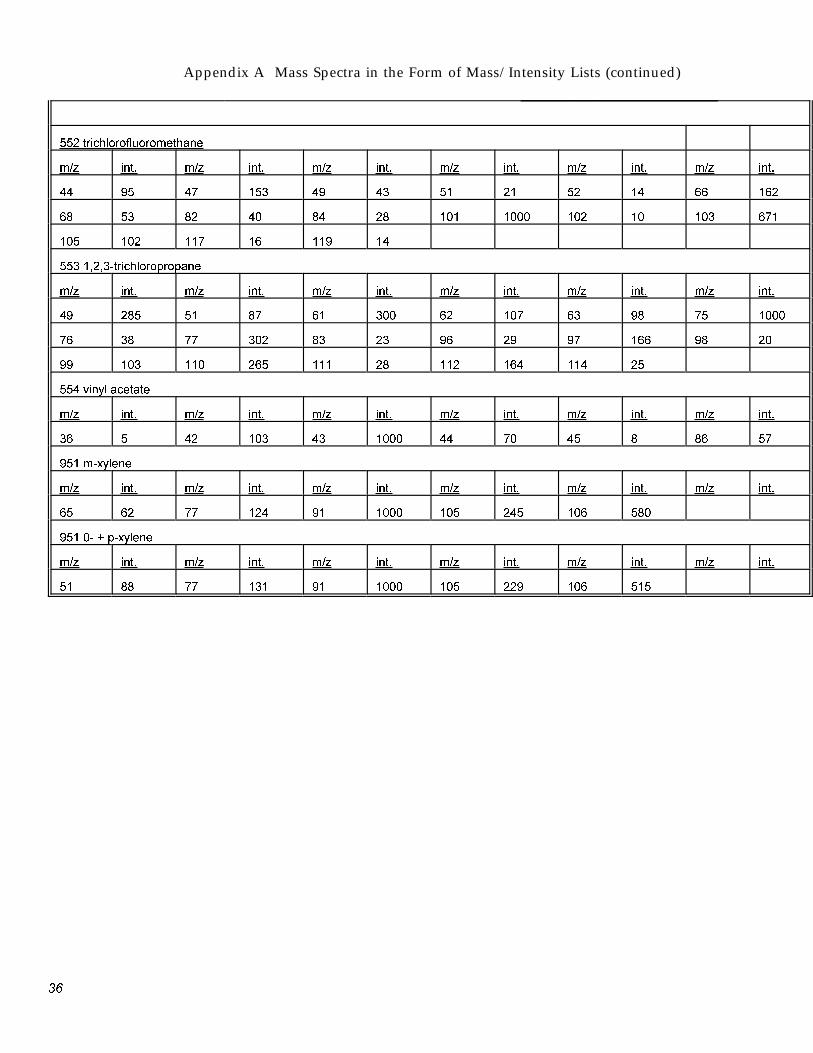
Appendix A Mass Spectra in the Form of Mass/Intensity Lists
532 allyl alcohol
m/z int. m/z int. m/z int. m/z int. m/z int. m/z int.
42 30 43 39 44 232 45 12 53 13 55 59
56 58 57 1000 58 300 61 15
533 carbon disulfide
m/z int. m/z int. m/z int. m/z int. m/z int. m/z int.
44 282 46 10 64 14 76 1000 77 27 78 82
534 2-chloro-1,3-butadiene (chloroprene)
m/z int. m/z int. m/z int. m/z int. m/z int. m/z int.
48 21 49 91 50 223 51 246 52 241 53 1000
54 41 61 30 62 54 63 11 64 16 73 21
87 12 88 452 89 22 90 137
535 chloroacetonitrile
m/z int. m/z int. m/z int. m/z int. m/z int. m/z int.
47 135 48 1000 49 88 50 294 51 12 73 22
74 43 75 884 76 39 77 278
536 3-chloropropene
m/z int. m/z int. m/z int. m/z int. m/z int. m/z int.
35 39 36 40 40 44 42 206 47 40 58 35
49 176 51 64 52 31 61 29 73 22 75 138
76 1000 77 74 78 324
537 crotonaldehyde
m/z int. m/z int. m/z int. m/z int. m/z int. m/z int.
35 26 40 28 42 339 43 48 44 335 49 27
50 40 51 20 52 21 53 31 55 55 68 24
69 511 70 1000 71 43
33
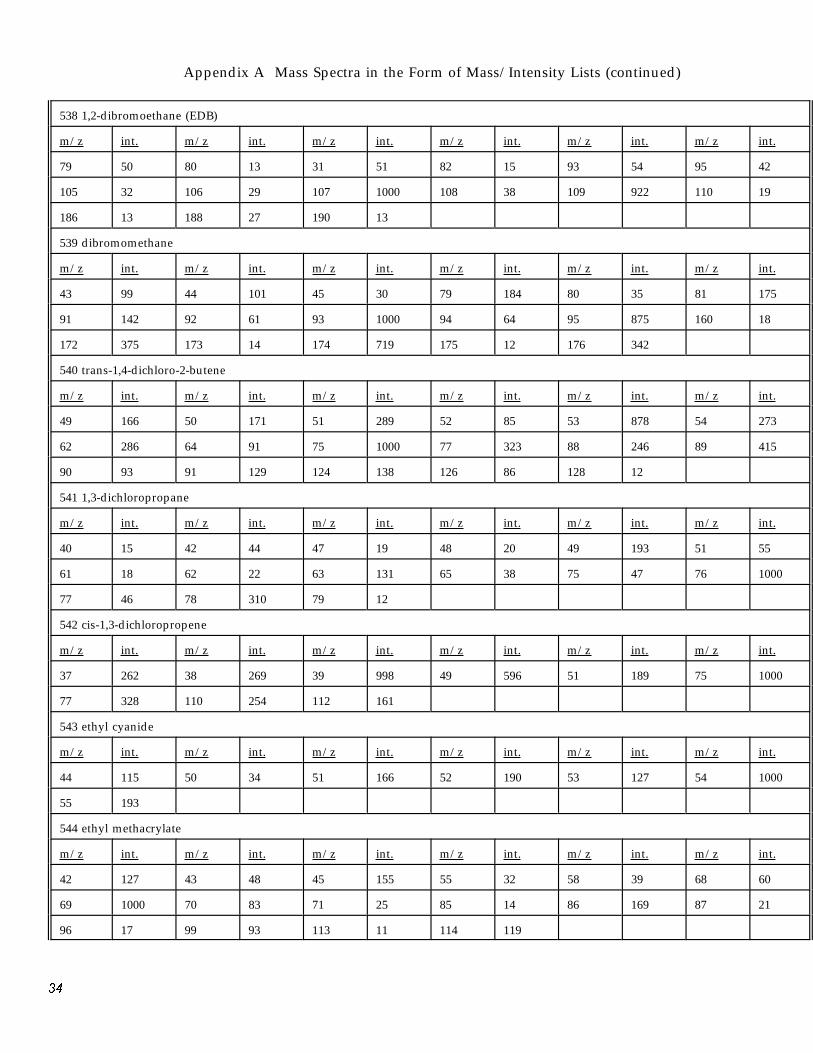
Appendix A Mass Spectra in the Form of Mass/Intensity Lists (continued)
538 1,2-dibromoethane (EDB)
m/z int. m/z int. m/z int. m/z int. m/z int. m/z int.
79 50 80 13 31 51 82 15 93 54 95 42
105 32 106 29 107 1000 108 38 109 922 110 19
186 13 188 27 190 13
539 dibromomethane
m/z int. m/z int. m/z int. m/z int. m/z int. m/z int.
43 99 44 101 45 30 79 184 80 35 81 175
91 142 92 61 93 1000 94 64 95 875 160 18
172 375 173 14 174 719 175 12 176 342
540 trans-1,4-dichloro-2-butene
m/z int. m/z int. m/z int. m/z int. m/z int. m/z int.
49 166 50 171 51 289 52 85 53 878 54 273
62 286 64 91 75 1000 77 323 88 246 89 415
90 93 91 129 124 138 126 86 128 12
541 1,3-dichloropropane
m/z int. m/z int. m/z int. m/z int. m/z int. m/z int.
40 15 42 44 47 19 48 20 49 193 51 55
61 18 62 22 63 131 65 38 75 47 76 1000
77 46 78 310 79 12
542 cis-1,3-dichloropropene
m/z int. m/z int. m/z int. m/z int. m/z int. m/z int.
37 262 38 269 39 998 49 596 51 189 75 1000
77 328 110 254 112 161
543 ethyl cyanide
m/z int. m/z int. m/z int. m/z int. m/z int. m/z int.
44 115 50 34 51 166 52 190 53 127 54 1000
55 193
544 ethyl methacrylate
m/z int. m/z int. m/z int. m/z int. m/z int. m/z int.
42 127 43 48 45 155 55 32 58 39 68 60
69 1000 70 83 71 25 85 14 86 169 87 21
96 17 99 93 113 11 114 119
3�
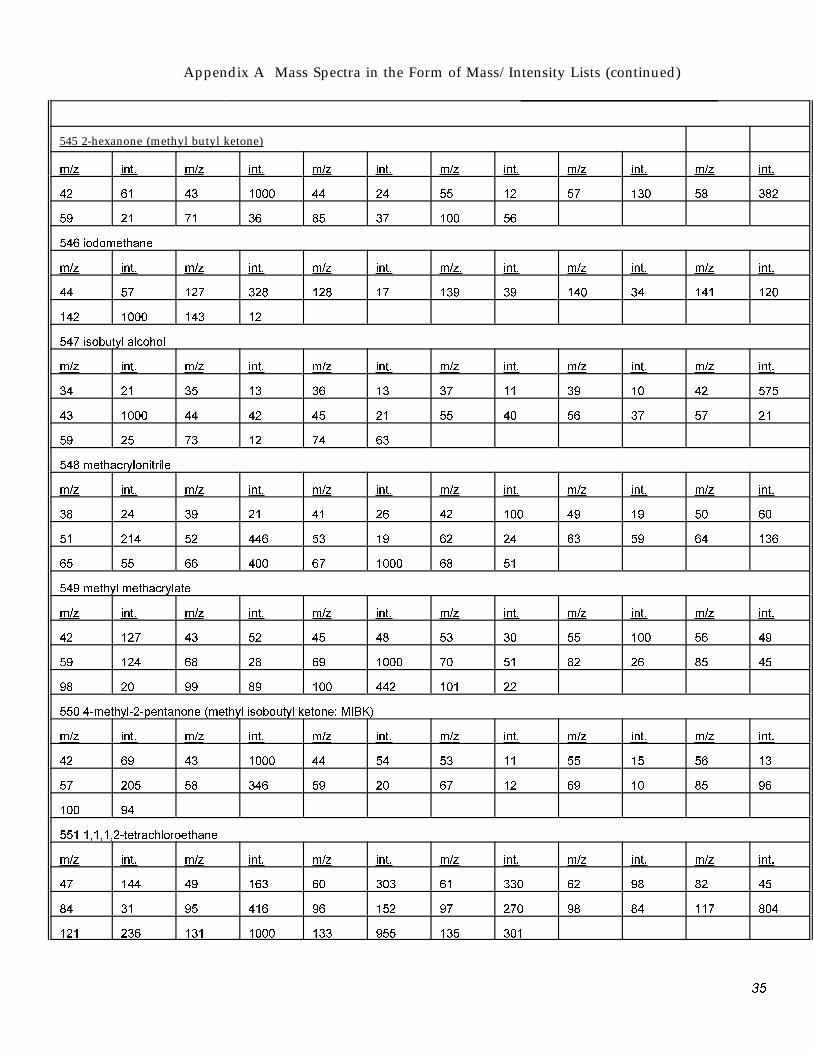
Appendix A Mass Spectra in the Form of Mass/Intensity Lists (continued)
545 2-hexanone (methyl butyl ketone)
m/z int. m/z int. m/z int. m/z int. m/z int. m/z int.
42 61 43 1000 44 24 55 12 57 130 58 382
59 21 71 36 85 37 100 56
546 iodomethane
m/z int. m/z int. m/z int. m/z. int. m/z int. m/z int.
44 57 127 328 128 17 139 39 140 34 141 120
142 1000 143 12
547 isobutvl alcohol
m/z int. m/z int. m/z int. m/z int. m/z int. m/z int.
34 21 35 13 36 13 37 11 39 10 42 575
43 1000 44 42 45 21 55 40 56 37 57 21
59 25 73 12 74 63
548 methacrvlonitrile
m/z int. m/z int. m/z int. m/z int. m/z int. m/z int.
38 24 39 21 41 26 42 100 49 19 50 60
51 214 52 446 53 19 62 24 63 59 64 136
65 55 66 400 67 1000 68 51
549 methvl methacrvlate
m/z int. m/z int. m/z int. m/z int. m/z int. m/z int.
42 127 43 52 45 48 53 30 55 100 56 49
59 124 68 28 69 1000 70 51 82 26 85 45
98 20 99 89 100 442 101 22
550 4-methvl-2-pentanone (methvl isoboutvl ketone; MIBK)
m/z int. m/z int. m/z int. m/z int. m/z int. m/z int.
42 69 43 1000 44 54 53 11 55 15 56 13
57 205 58 346 59 20 67 12 69 10 85 96
100 94
551 1,1,1,2-tetrachloroethane
m/z int. m/z int. m/z int. m/z int. m/z int. m/z int.
47 144 49 163 60 303 61 330 62 98 82 45
84 31 95 416 96 152 97 270 98 84 117 804
121 236 131 1000 133 955 135 301
35
Appendix A Mass Spectra in the Form of Mass/Intensity Lists (continued)
552 trichlorofluoromethane
m/z int. m/z int. m/z int. m/z int. m/z int. m/z int.
44 95 47 153 49 43 51 21 52 14 66 162
68 53 82 40 84 28 101 1000 102 10 103 671
105 102 117 16 119 14
553 1,2,3-trichloropropane
m/z int. m/z int. m/z int. m/z int. m/z int. m/z int.
49 285 51 87 61 300 62 107 63 98 75 1000
76 38 77 302 83 23 96 29 97 166 98 20
99 103 110 265 111 28 112 164 114 25
554 vinvl acetate
m/z int. m/z int. m/z int. m/z int. m/z int. m/z int.
36 5 42 103 43 1000 44 70 45 8 86 57
951 m-xvlene
m/z int. m/z int. m/z int. m/z int. m/z int. m/z int.
65 62 77 124 91 1000 105 245 106 580
951 0- + p-xvlene
m/z int. m/z int. m/z int. m/z int. m/z int. m/z int.
51 88 77 131 91 1000 105 229 106 515
3�
37
3�

39
�0

�1
��
�3
��
�5