metabolism - cf.linnbenton.educf.linnbenton.edu/mathsci/bio/jacobsr/upload/24 - metabolism.pdf ·...
TRANSCRIPT
Metabolism
Metabolism
• All the biochemical reactions occurring in the body
• Generating, storing and expending energy
• ATP
• Supports body activities
• Assists in constructing new tissue
Metabolism
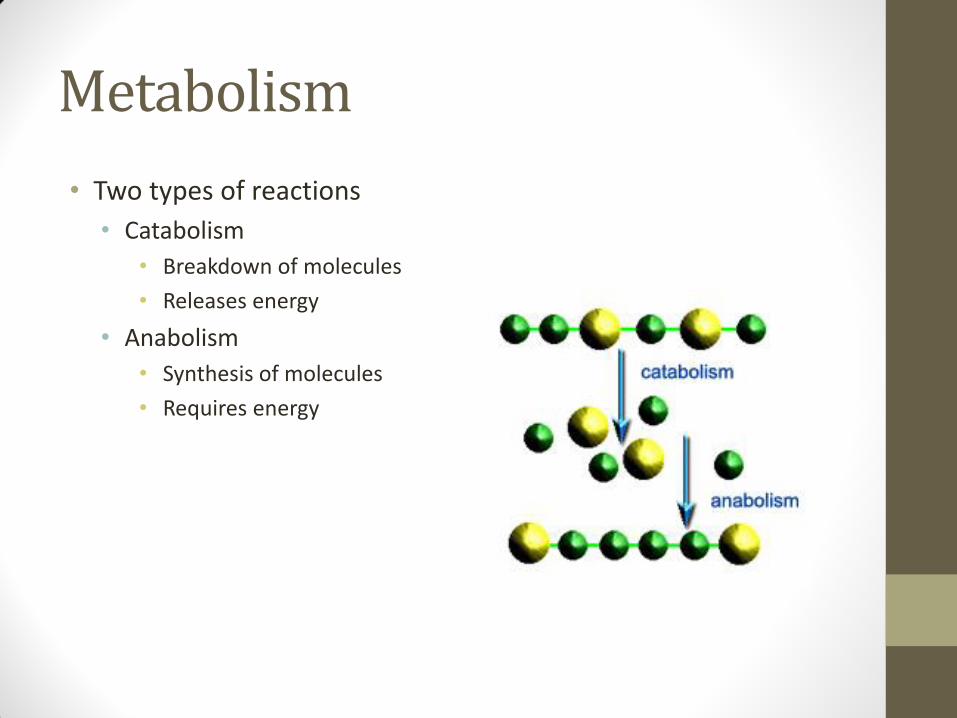
• Two types of reactions
• Catabolism
• Breakdown of molecules
• Releases energy
• Anabolism
• Synthesis of molecules
• Requires energy
Energy
• Capacity to do work
• Force x distance
• Types of energy
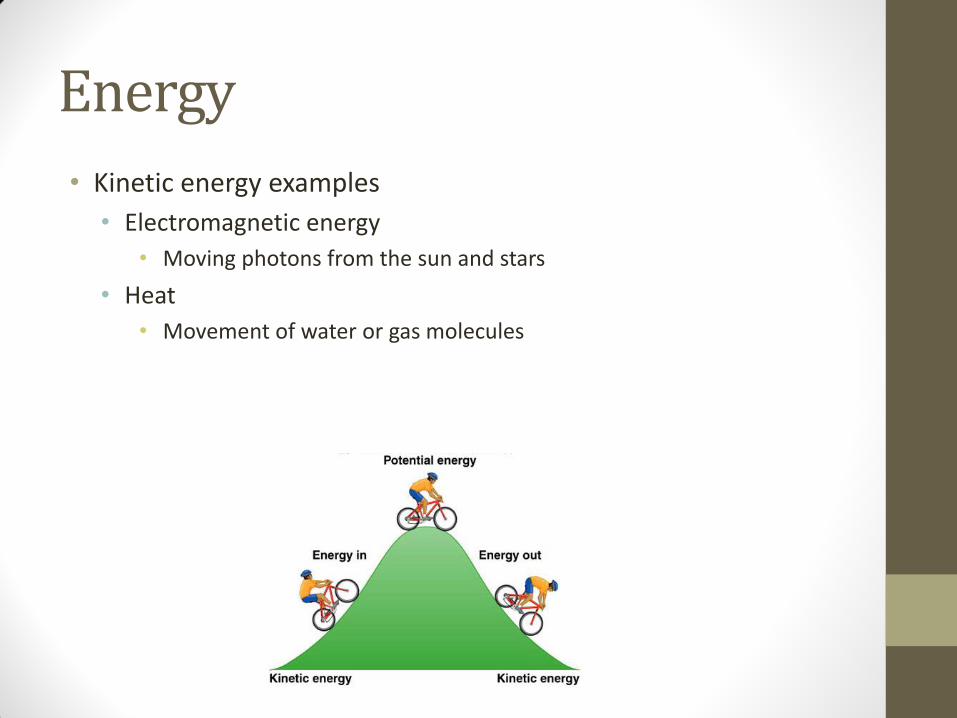
• Kinetic
• Objects are moving
• Potential
• Stored (inactive) energy
• Chemical energy
• Potential energy stored in bonds of chemical substances
Energy
• Kinetic energy examples
• Electromagnetic energy
• Moving photons from the sun and stars
• Heat
• Movement of water or gas molecules
Energy
• Chemical energy • Moving atoms may collide and form bonds
• Increased complexity increases stored potential energy
Energy
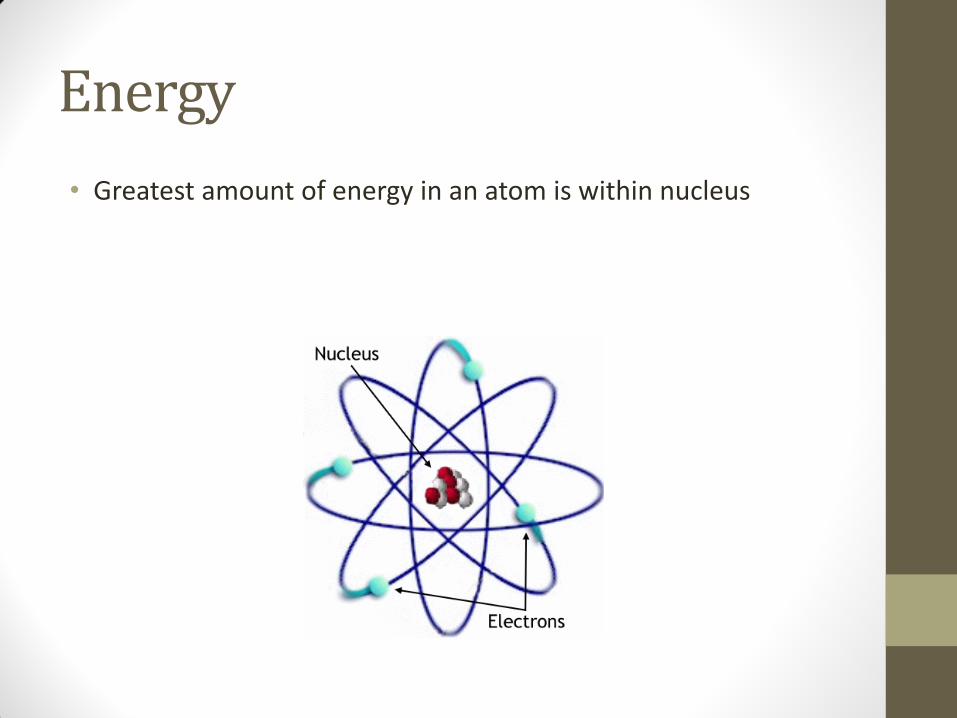
• Greatest amount of energy in an atom is within nucleus
Bonds and Bond Energy
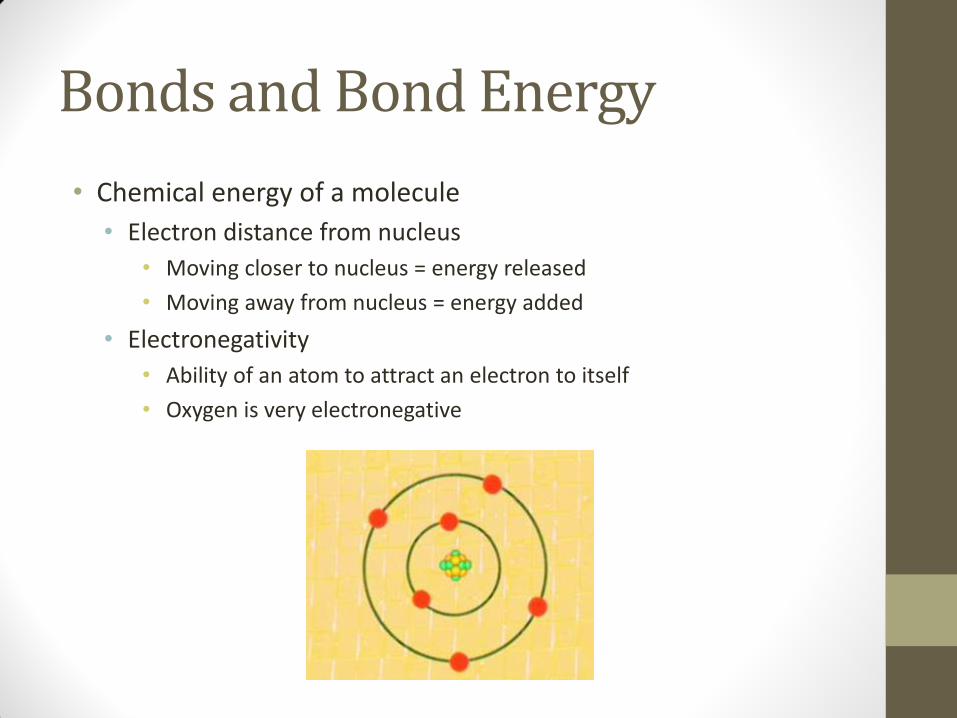
• Chemical energy of a molecule
• Electron distance from nucleus
• Moving closer to nucleus = energy released
• Moving away from nucleus = energy added
• Electronegativity
• Ability of an atom to attract an electron to itself
• Oxygen is very electronegative
Bonds and Bond Energy
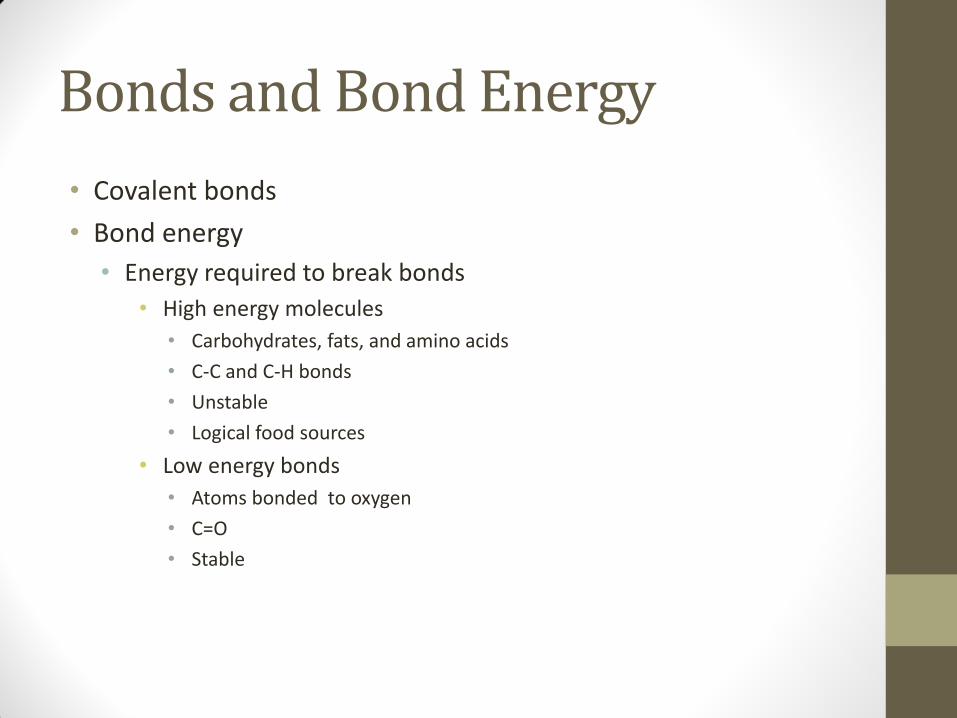
• Covalent bonds
• Bond energy
• Energy required to break bonds
• High energy molecules
• Carbohydrates, fats, and amino acids
• C-C and C-H bonds
• Unstable
• Logical food sources
• Low energy bonds
• Atoms bonded to oxygen
• C=O
• Stable
Bonds and Bond Energy
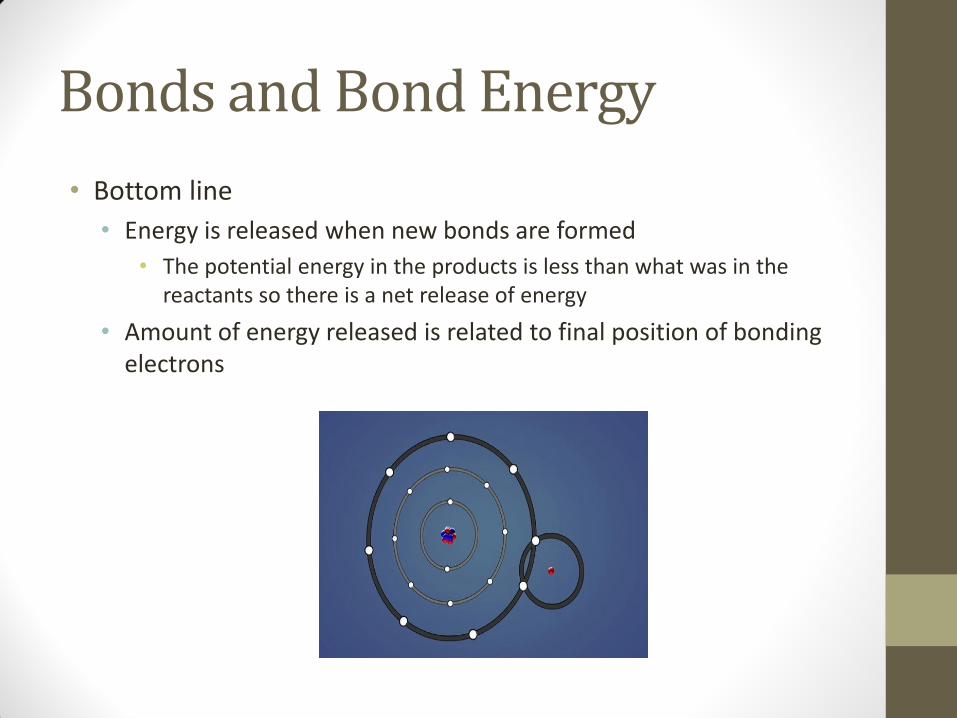
• Bottom line
• Energy is released when new bonds are formed
• The potential energy in the products is less than what was in the reactants so there is a net release of energy
• Amount of energy released is related to final position of bonding electrons
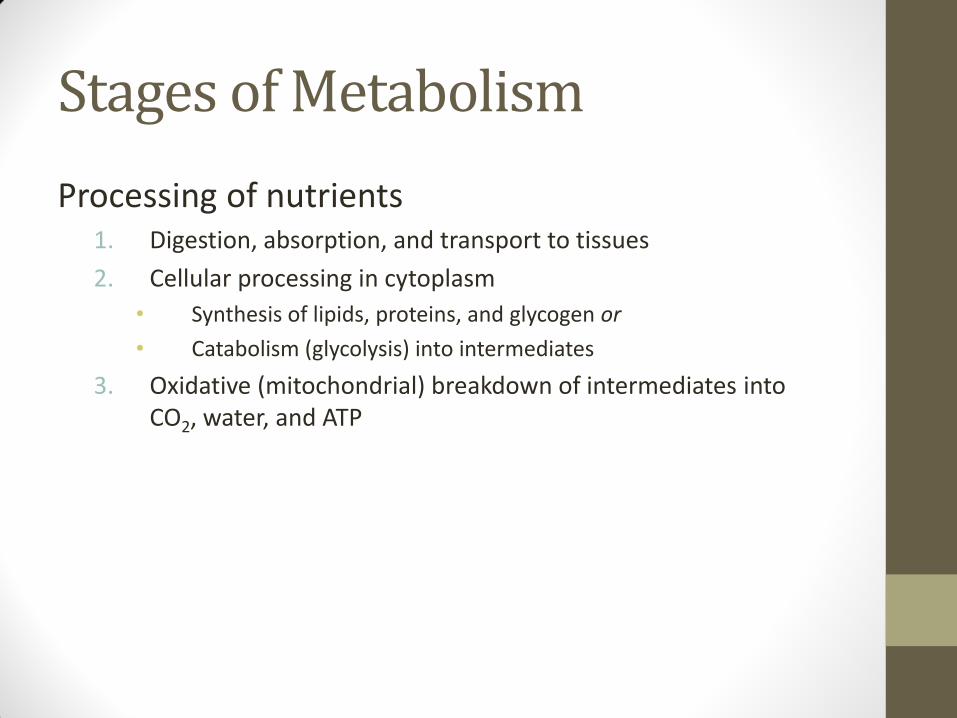
Stages of Metabolism
Processing of nutrients 1. Digestion, absorption, and transport to tissues
2. Cellular processing in cytoplasm
• Synthesis of lipids, proteins, and glycogen or
• Catabolism (glycolysis) into intermediates
3. Oxidative (mitochondrial) breakdown of intermediates into CO2, water, and ATP
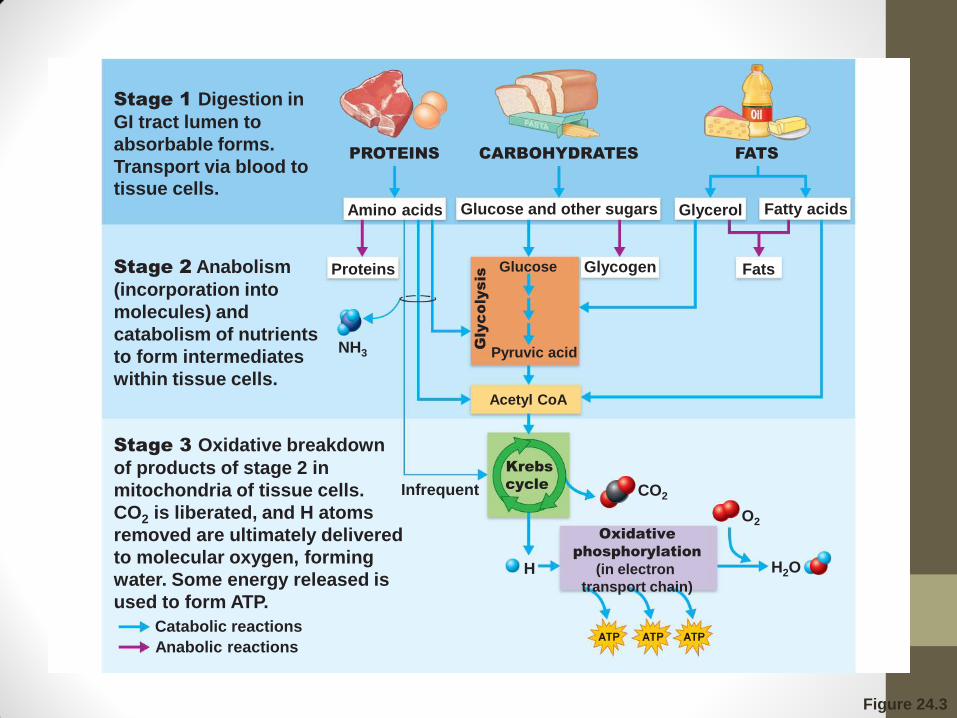
Figure 24.3
Stage 1 Digestion in
GI tract lumen to
absorbable forms.
Transport via blood to tissue cells.
Stage 2 Anabolism
(incorporation into
molecules) and
catabolism of nutrients
to form intermediates
within tissue cells.
Stage 3 Oxidative breakdown
of products of stage 2 in
mitochondria of tissue cells.
CO2 is liberated, and H atoms
removed are ultimately delivered
to molecular oxygen, forming
water. Some energy released is
used to form ATP.
Catabolic reactions
Anabolic reactions
Glycogen
PROTEINS
Proteins Fats
CARBOHYDRATES
Glucose
FATS
Amino acids Glucose and other sugars Glycerol Fatty acids
Pyruvic acid
Acetyl CoA
Infrequent CO2
NH3
H
Krebs
cycle
Oxidative
phosphorylation
(in electron
transport chain)
O2
H2O
Carbohydrate Metabolism
• Body’s preferred energy source
• All cells possess enzymes to metabolize it
• Galactose, fructose, and glucose may be directly absorbed
• Galactose and fructose must be converted to glucose for cellular metabolism
Carbohydrate Metabolism
• Glucose is catabolized in three pathways
• Glycolysis
• Krebs cycle
• Electron transport chain
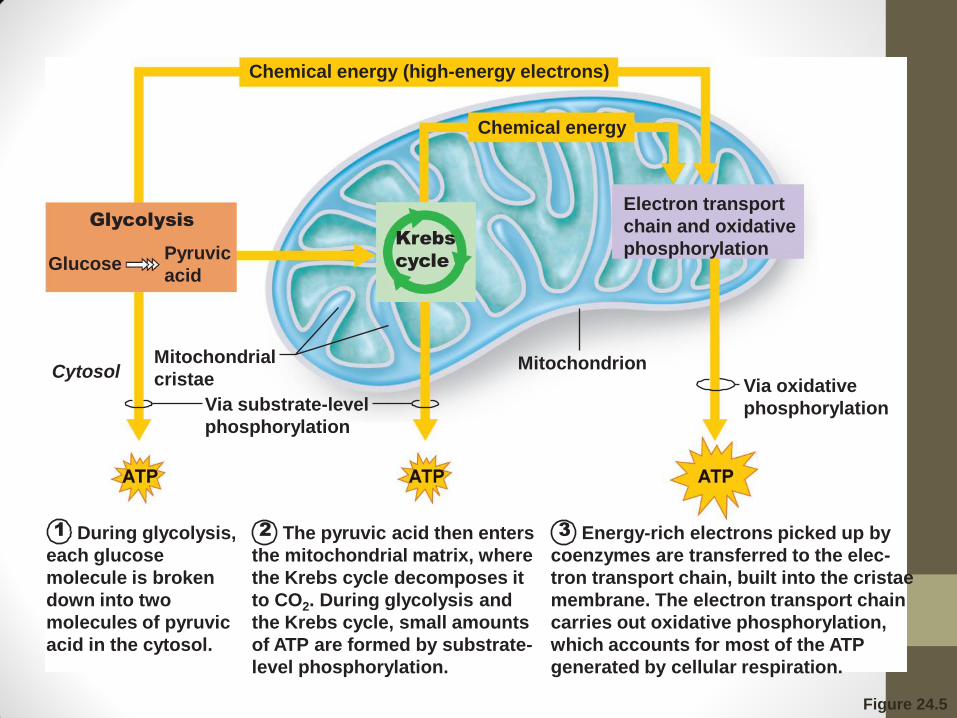
Figure 24.5
Via oxidative
phosphorylation Via substrate-level
phosphorylation
Mitochondrion Mitochondrial
cristae Cytosol
Krebs
cycle Glucose
Glycolysis
Pyruvic
acid
Electron transport
chain and oxidative
phosphorylation
Chemical energy (high-energy electrons)
1 During glycolysis,
each glucose
molecule is broken
down into two
molecules of pyruvic
acid in the cytosol.
2 The pyruvic acid then enters
the mitochondrial matrix, where
the Krebs cycle decomposes it
to CO2. During glycolysis and
the Krebs cycle, small amounts
of ATP are formed by substrate-
level phosphorylation.
3 Energy-rich electrons picked up by
coenzymes are transferred to the elec-
tron transport chain, built into the cristae
membrane. The electron transport chain
carries out oxidative phosphorylation,
which accounts for most of the ATP
generated by cellular respiration.
Chemical energy
Carbohydrate Metabolism
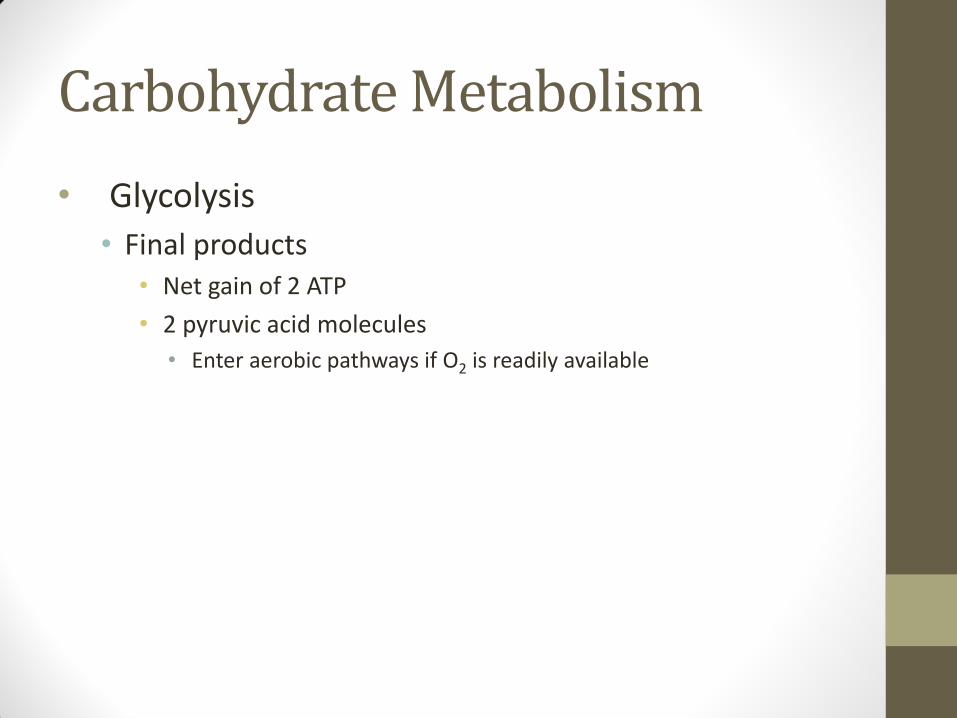
• Glycolysis
• 10-step pathway
• Anaerobic
• Occurs in the cytosol
• Glucose 2 pyruvic acid molecules
Carbohydrate Metabolism
• Glycolysis
• Final products • Net gain of 2 ATP
• 2 pyruvic acid molecules
• Enter aerobic pathways if O2 is readily available
Copyright © 2010 Pearson Education, Inc.
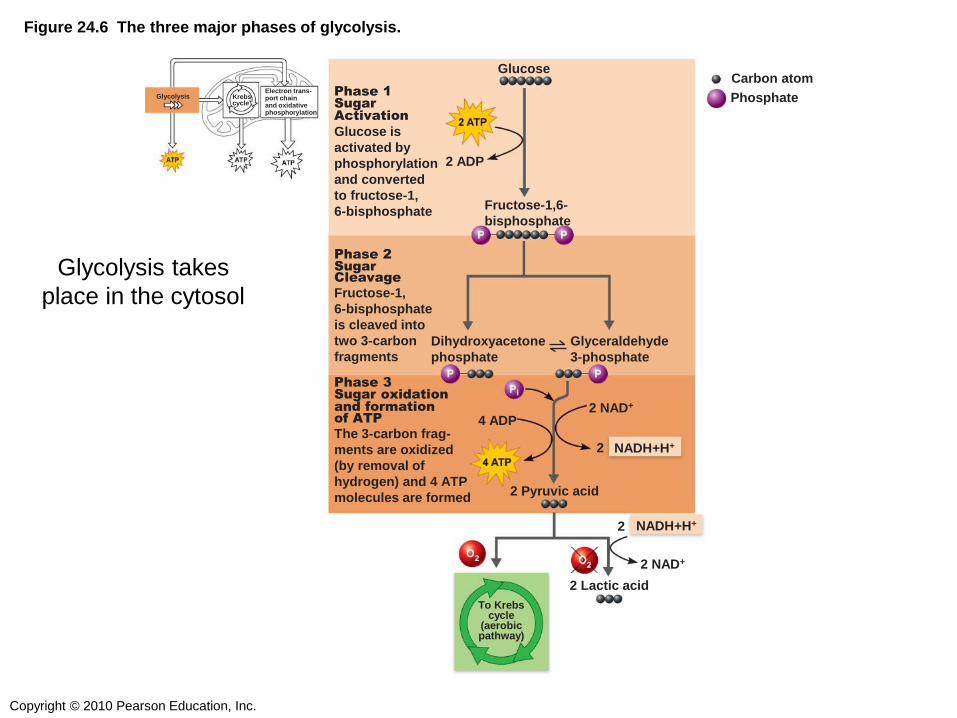
Figure 24.6 The three major phases of glycolysis.
To Krebs cycle
(aerobic pathway)
2
2
Glucose
4 ADP
2 Lactic acid
2 Pyruvic acid
Phase 1
Sugar Activation
Glucose is
activated by
phosphorylation
and converted
to fructose-1,
6-bisphosphate Fructose-1,6-
bisphosphate
Dihydroxyacetone
phosphate
Glyceraldehyde
3-phosphate
Phase 2
Sugar Cleavage
Fructose-1,
6-bisphosphate
is cleaved into
two 3-carbon
fragments
Phase 3
Sugar oxidation and formation of ATP
The 3-carbon frag-
ments are oxidized
(by removal of
hydrogen) and 4 ATP
molecules are formed
2 ADP
Carbon atom
Phosphate
2 NAD+
2 NAD+
NADH+H+
NADH+H+
Glycolysis Electron trans- port chain and oxidative phosphorylation
Krebs cycle
Glycolysis takes
place in the cytosol
Carbohydrate Metabolism
• Krebs cycle • Occurs in mitochondrial matrix
• Fueled by pyruvic acid and fatty acids
• Some amino acids can also form pyruvic acid
• Also called citric acid cycle
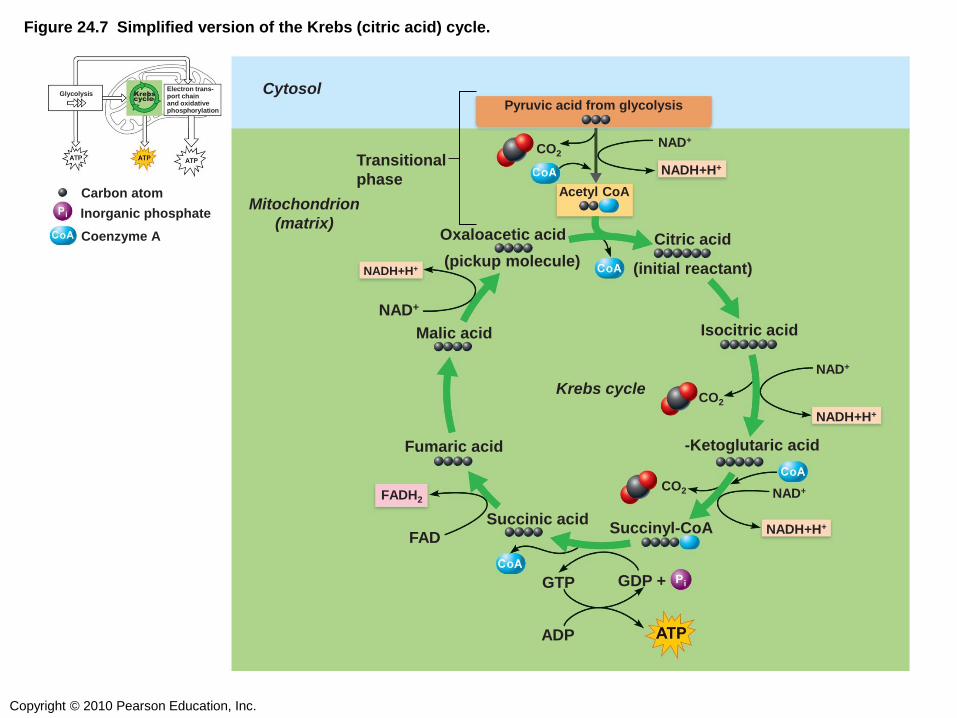
Carbohydrate Metabolism
• Krebs cycle summary • Occurs in the presence of oxygen • Pyruvic acid molecules enter mitochondrion
• Catabolized to acetyl CoA • Acetyl Co A citric acid • Each citric acid generates
• 2 CO2 • 1 ATP
• Electrons are transferred to coenzymes which fuel the electron transport system
Copyright © 2010 Pearson Education, Inc.
Figure 24.7 Simplified version of the Krebs (citric acid) cycle.
Krebs cycle
NAD+
NAD+
GDP +
NAD+
FAD
NAD+
NADH+H+
Cytosol
Mitochondrion
(matrix)
NADH+H+
FADH2
NADH+H+
Citric acid
(initial reactant)
Isocitric acid
Oxaloacetic acid
(pickup molecule)
Malic acid
Succinic acid Succinyl-CoA
GTP
ADP
Carbon atom
Inorganic phosphate
Coenzyme A
Acetyl CoA
Pyruvic acid from glycolysis
Transitional
phase
Fumaric acid
NADH+H+
CO2
CO2
CO2
-Ketoglutaric acid
Electron trans- port chain and oxidative phosphorylation
Glycolysis Krebs
cycle
Carbohydrate Metabolism
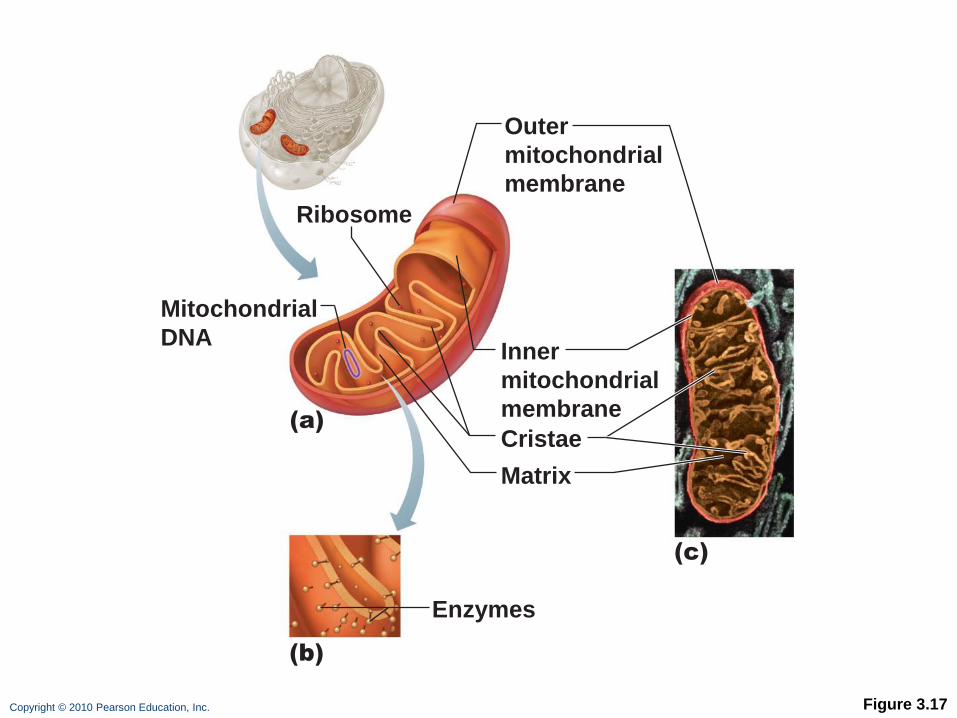
• Electron transport chain • Cytochromes
• Proteins bound to iron atoms on inner mitochondrial membrane
• Electrons passed from cytochrome to cytochrome
• Release energy during transfer
Copyright © 2010 Pearson Education, Inc. Figure 3.17
Enzymes
Matrix
Cristae
Mitochondrial
DNA
Ribosome
Outer
mitochondrial
membrane
Inner
mitochondrial
membrane
(b)
(a)
(c)

Carbohydrate Metabolism
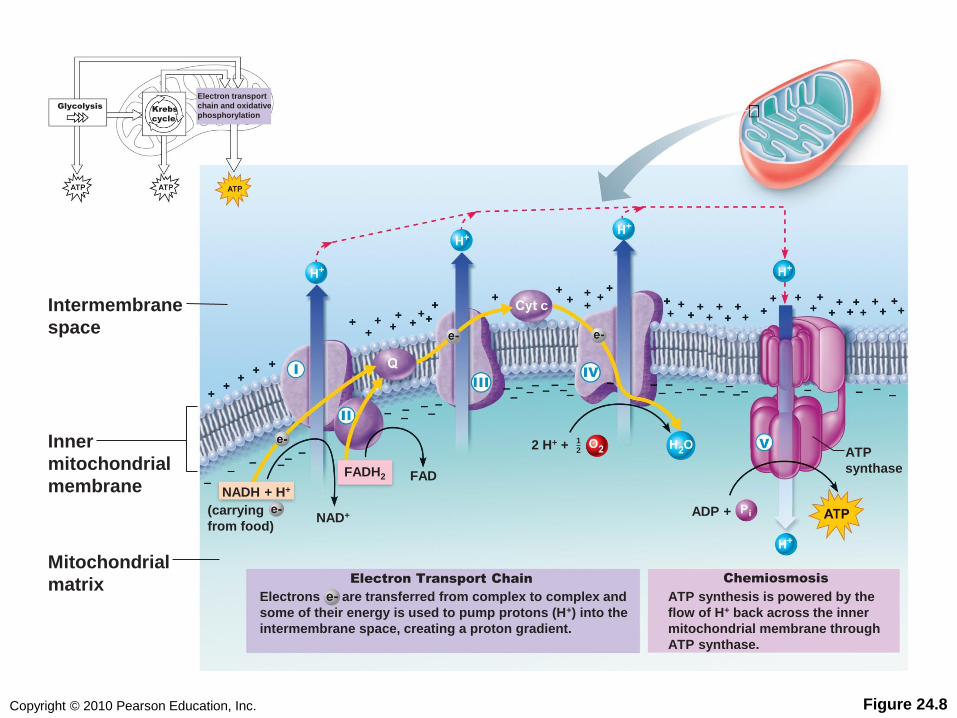
• Electron transport chain • Hydrogen atoms are split into H+ and electrons
• Electrons are shuttled along the inner mitochondrial membrane, losing energy at each step
• Released energy is used to pump H+ into the intermembrane space
• Diffusion of H+ back through membrane is coupled to ATP production system
Copyright © 2010 Pearson Education, Inc. Figure 24.8
Intermembrane
space
Inner
mitochondrial
membrane
Mitochondrial
matrix
NADH + H+
NAD+
FAD
(carrying
from food)
FADH2
Krebs
cycle
Glycolysis
Electron transport
chain and oxidative
phosphorylation
Electron Transport Chain Chemiosmosis
ADP +
2 H+ +
Electrons are transferred from complex to complex and
some of their energy is used to pump protons (H+) into the
intermembrane space, creating a proton gradient.
ATP synthesis is powered by the
flow of H+ back across the inner
mitochondrial membrane through
ATP synthase.
ATP
synthase
1
2
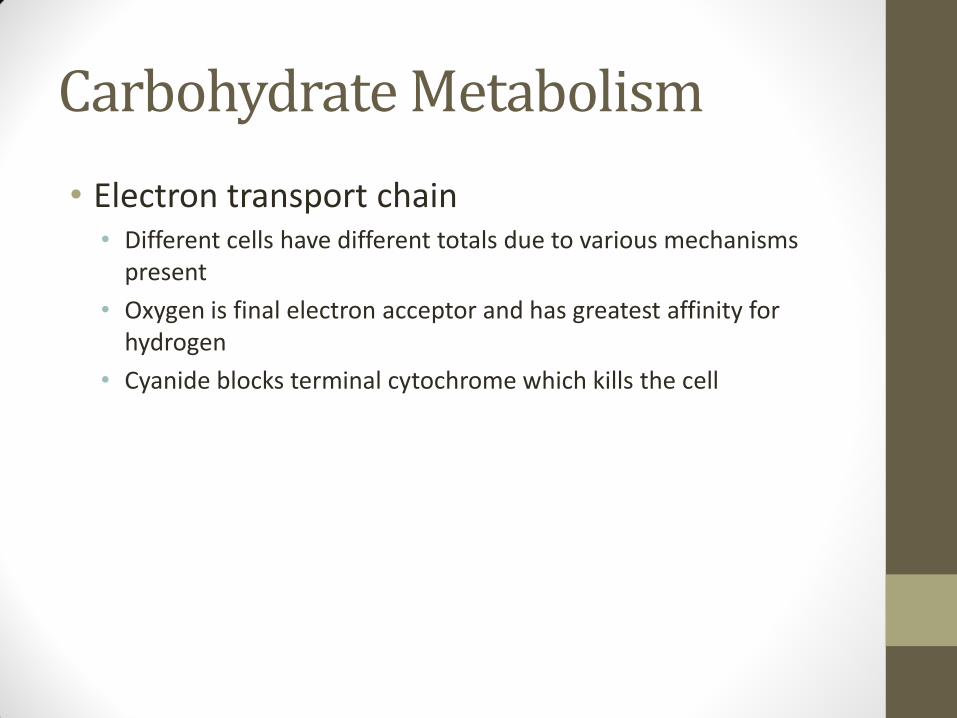
Carbohydrate Metabolism
• Electron transport chain • Different cells have different totals due to various mechanisms
present
• Oxygen is final electron acceptor and has greatest affinity for hydrogen
• Cyanide blocks terminal cytochrome which kills the cell

Copyright © 2010 Pearson Education, Inc. Figure 24.8
Intermembrane
space
Inner
mitochondrial
membrane
Mitochondrial
matrix
NADH + H+
NAD+
FAD
(carrying
from food)
FADH2
Krebs
cycle
Glycolysis
Electron transport
chain and oxidative
phosphorylation
Electron Transport Chain Chemiosmosis
ADP +
2 H+ +
Electrons are transferred from complex to complex and
some of their energy is used to pump protons (H+) into the
intermembrane space, creating a proton gradient.
ATP synthesis is powered by the
flow of H+ back across the inner
mitochondrial membrane through
ATP synthase.
ATP
synthase
1
2
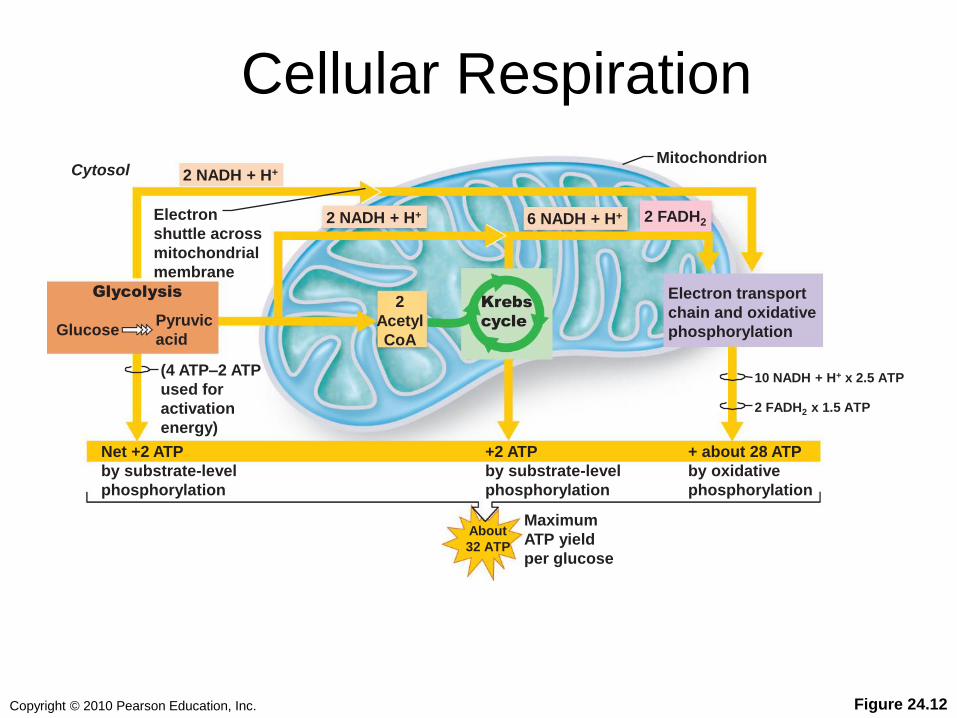
Copyright © 2010 Pearson Education, Inc. Figure 24.12
Mitochondrion Cytosol
2
Acetyl
CoA
Electron transport
chain and oxidative
phosphorylation Glucose
Glycolysis
Pyruvic
acid
Net +2 ATP
by substrate-level
phosphorylation
+ about 28 ATP
by oxidative
phosphorylation
+2 ATP
by substrate-level
phosphorylation
Electron
shuttle across
mitochondrial
membrane
Krebs
cycle
(4 ATP–2 ATP
used for
activation
energy)
2 NADH + H+
2 NADH + H+ 6 NADH + H+ 2 FADH2
About
32 ATP
Maximum
ATP yield
per glucose
10 NADH + H+ x 2.5 ATP
2 FADH2 x 1.5 ATP
Cellular Respiration
Cellular Respiration
• Oxidation of glucose
• Glycolysis
• Kreb’s Cycle
• ETC
• Grand total…
Anaerobic Metabolism
• Production of ATP in the absence of oxygen
• Lactic acid fermentation
glucose →→→→ 2 pyruvic acid → lactic acid
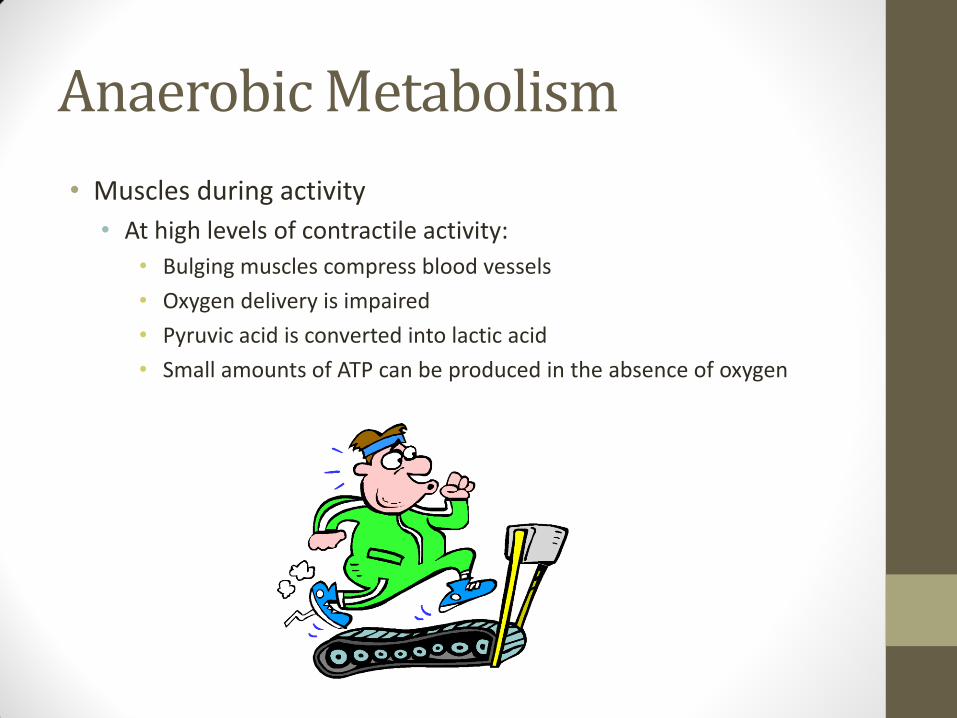
Anaerobic Metabolism
• Muscles during activity
• At high levels of contractile activity:
• Bulging muscles compress blood vessels
• Oxygen delivery is impaired
• Pyruvic acid is converted into lactic acid
• Small amounts of ATP can be produced in the absence of oxygen
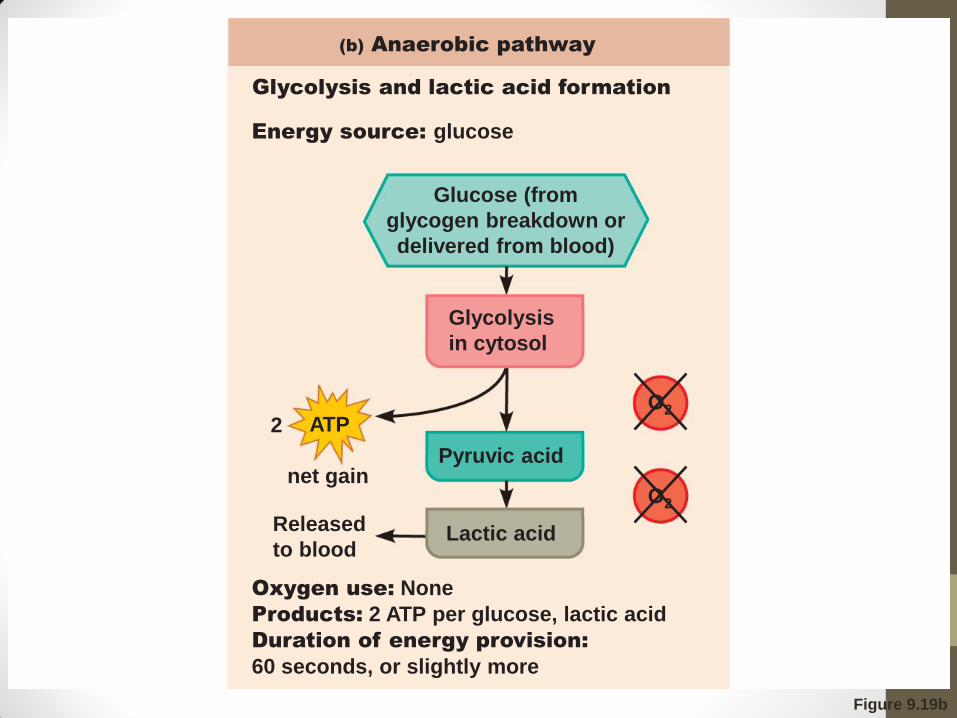
Figure 9.19b
Energy source: glucose
Glycolysis and lactic acid formation
(b) Anaerobic pathway
Oxygen use: None
Products: 2 ATP per glucose, lactic acid
Duration of energy provision:
60 seconds, or slightly more
Glucose (from
glycogen breakdown or
delivered from blood)
Glycolysis
in cytosol
Pyruvic acid
Released
to blood
net gain
2
Lactic acid
O2
O2 ATP
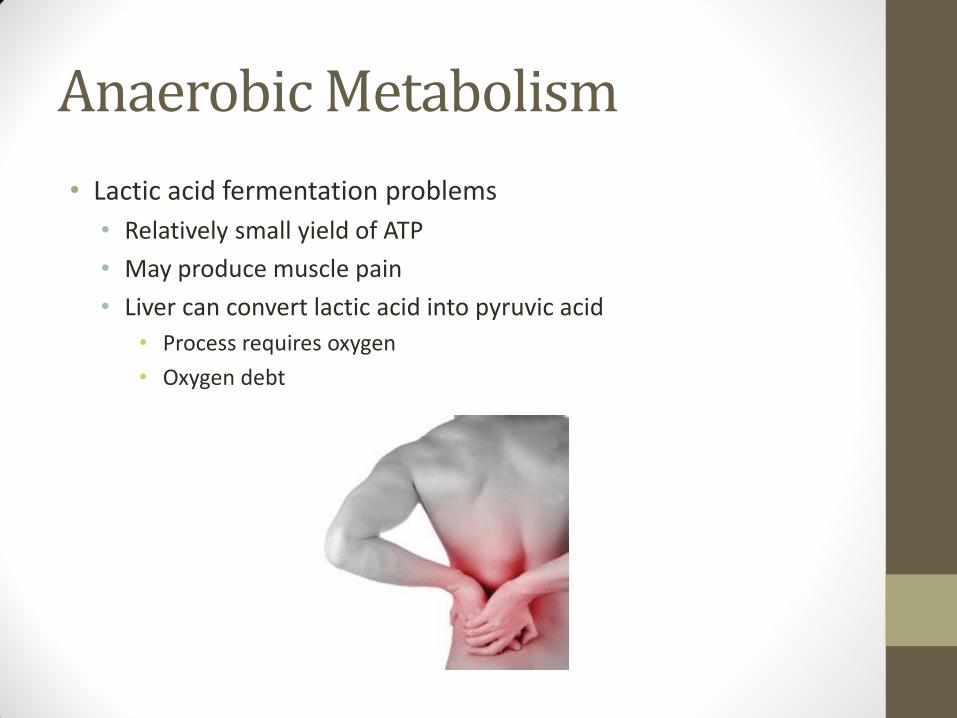
Anaerobic Metabolism
• Lactic acid fermentation problems
• Relatively small yield of ATP
• May produce muscle pain
• Liver can convert lactic acid into pyruvic acid
• Process requires oxygen
• Oxygen debt
Questions?
Due in Lab
• PreLab #9
• Glucose Metabolism HW
Week 10
• HW 21 Due Tuesday 6/4/13