met 112 1 met 112 global climate change: lecture 12 controls on climate change professor menglin jin...
Post on 22-Dec-2015
220 views
TRANSCRIPT
MET 112
1
MET 112 Global Climate Change: Lecture 12
Controls on Climate ChangeProfessor Menglin Jin
Outline:Outline: IPCC CA Efforts on Energy Kyoto Treat

The UN Framework Convention on Climate Change
‘stabilization of greenhouse gas concentrations in the atmosphere at a level that would prevent dangerous
anthropogenic human induced interference with the climate system. Such a level should be achieved within a time-
frame sufficient to allow ecosystems to adapt naturally to climate change, to ensure that food production is not threatened and to enable economic development to
proceed in a sustainable manner’

MET 112
3
Figure: Courtesy of IPCC

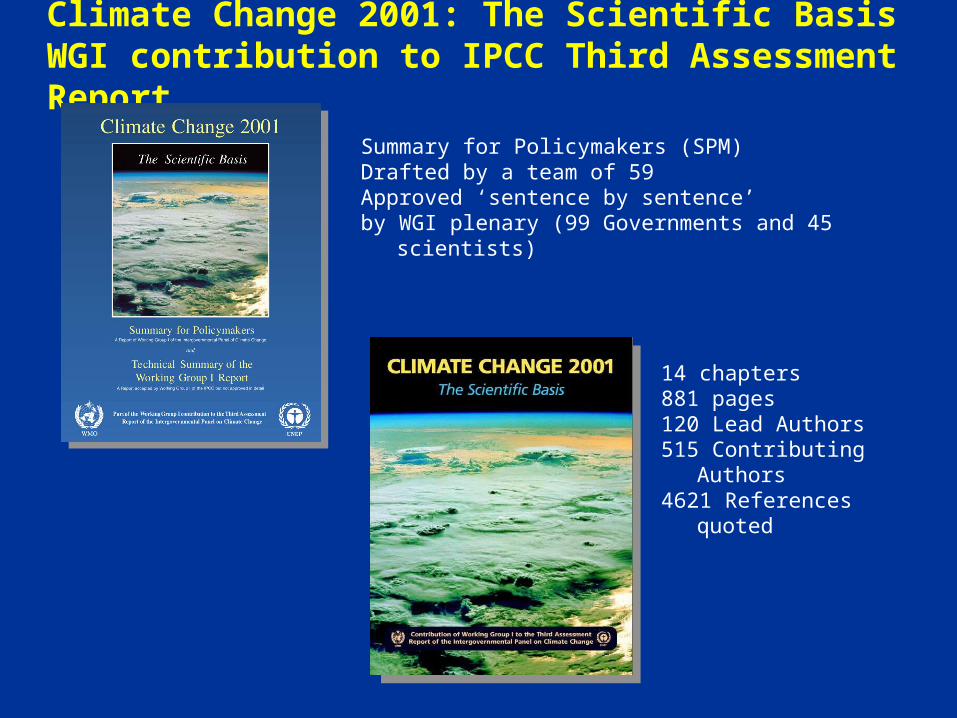
Climate Change 2001: The Scientific BasisWGI contribution to IPCC Third Assessment Report
Summary for Policymakers (SPM)Drafted by a team of 59Approved ‘sentence by sentence’by WGI plenary (99 Governments and 45 scientists)
14 chapters881 pages120 Lead Authors515 Contributing Authors4621 References quoted
MET 112
6
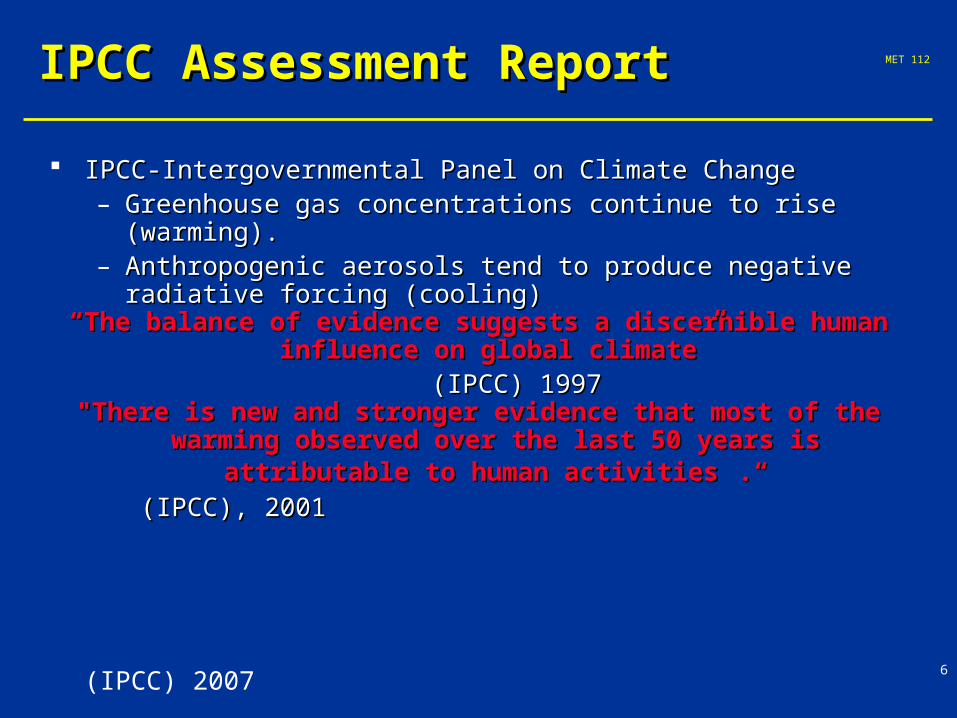
IPCC Assessment ReportIPCC Assessment Report
IPCC-Intergovernmental Panel on Climate Change IPCC-Intergovernmental Panel on Climate Change – Greenhouse gas concentrations continue to rise (warming).Greenhouse gas concentrations continue to rise (warming).– Anthropogenic aerosols tend to produce negative radiative forcing Anthropogenic aerosols tend to produce negative radiative forcing
(cooling)(cooling)““The balance of evidence suggests a discernible human influence The balance of evidence suggests a discernible human influence
on global climate”on global climate”(IPCC) 1997(IPCC) 1997
"There is new and stronger evidence that most of the warming "There is new and stronger evidence that most of the warming observed over the last 50 years is attributable to human observed over the last 50 years is attributable to human
activitiesactivities .“.“ (IPCC),(IPCC), 20012001
(IPCC) 2007
MET 112
7
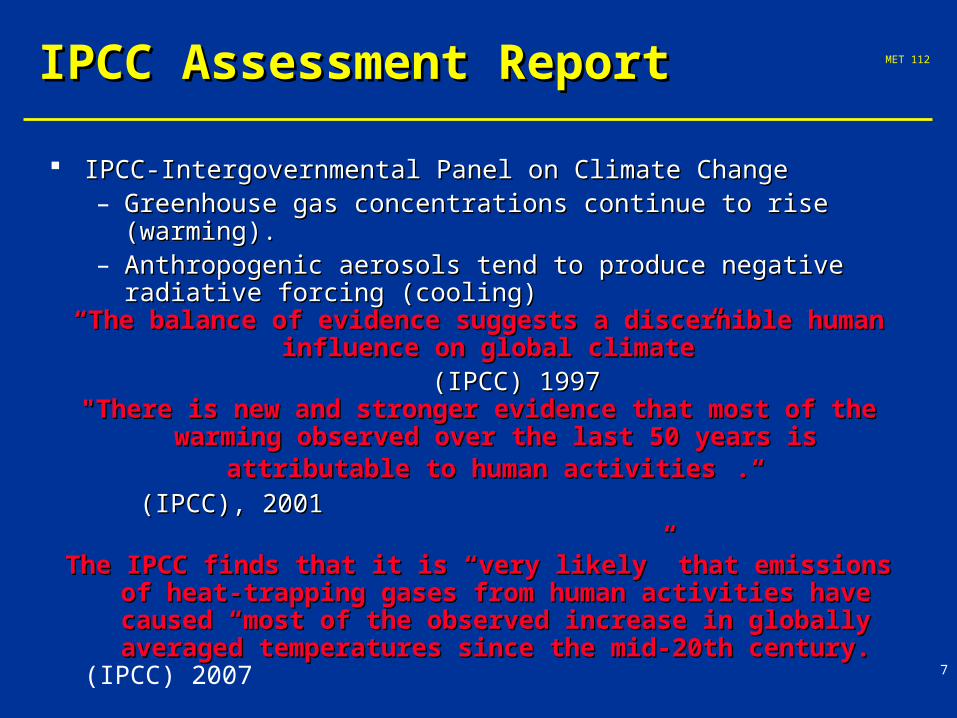
IPCC Assessment ReportIPCC Assessment Report
IPCC-Intergovernmental Panel on Climate Change IPCC-Intergovernmental Panel on Climate Change – Greenhouse gas concentrations continue to rise (warming).Greenhouse gas concentrations continue to rise (warming).– Anthropogenic aerosols tend to produce negative radiative forcing Anthropogenic aerosols tend to produce negative radiative forcing
(cooling)(cooling)““The balance of evidence suggests a discernible human influence The balance of evidence suggests a discernible human influence
on global climate”on global climate”(IPCC) 1997(IPCC) 1997
"There is new and stronger evidence that most of the warming "There is new and stronger evidence that most of the warming observed over the last 50 years is attributable to human observed over the last 50 years is attributable to human
activitiesactivities .“.“ (IPCC),(IPCC), 20012001
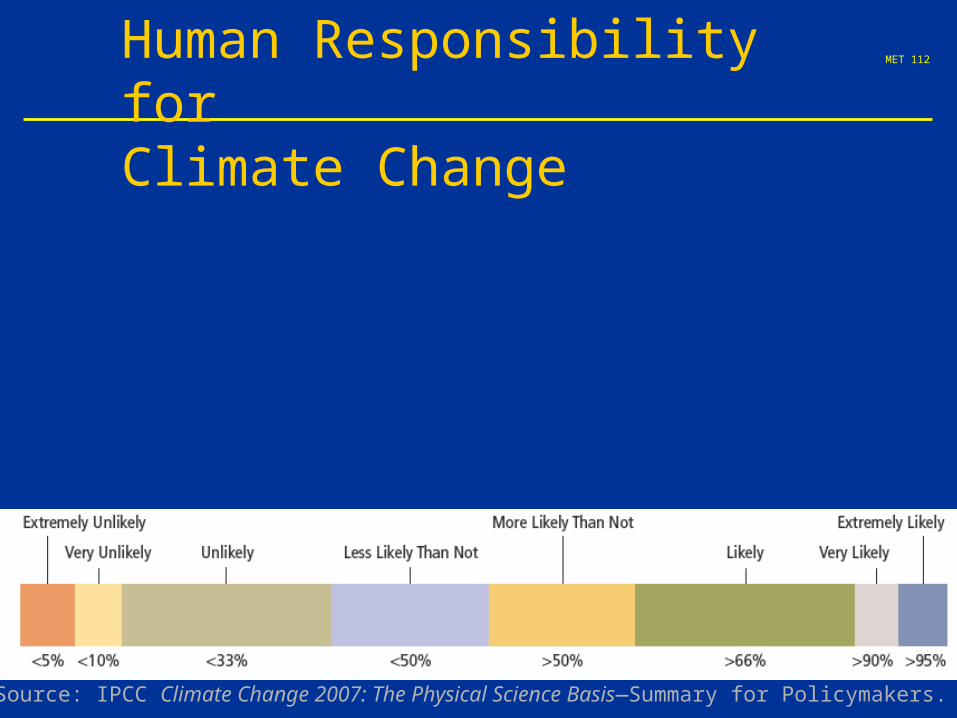
The IPCC finds that it is “very likely” that emissions of heat-The IPCC finds that it is “very likely” that emissions of heat-trapping gases from human activities have caused “most of the trapping gases from human activities have caused “most of the observed increase in globally averaged temperatures since the observed increase in globally averaged temperatures since the
mid-20th century.mid-20th century.(IPCC) 2007
MET 112
8
The IPCC finds that it is “very likely” that emissions of heat-trapping gases from human activities have caused “most of the observed increase in globally averaged temperatures sincethe mid-20th century.”
Human Responsibility forClimate Change
Source: IPCC Climate Change 2007: The Physical Science Basis—Summary for Policymakers.
MET 112
9
Model Sensitivity
Models (like the atmosphere) are sensitive systems.
They can respond differently to the same radiative forcing, e.g., a doubling of CO2
– This means that different models give different answers to the same problem
– Thus, we use a range of models to determine the range of possible future scenarios.
MET 112
10
Model Sensitivity
Models (like the atmosphere) are sensitive systems.
They can respond differently to the same radiative forcing, e.g., a doubling of CO2
–
– Thus, we use a range of models to determine the range of possible future scenarios.

MET 112
11
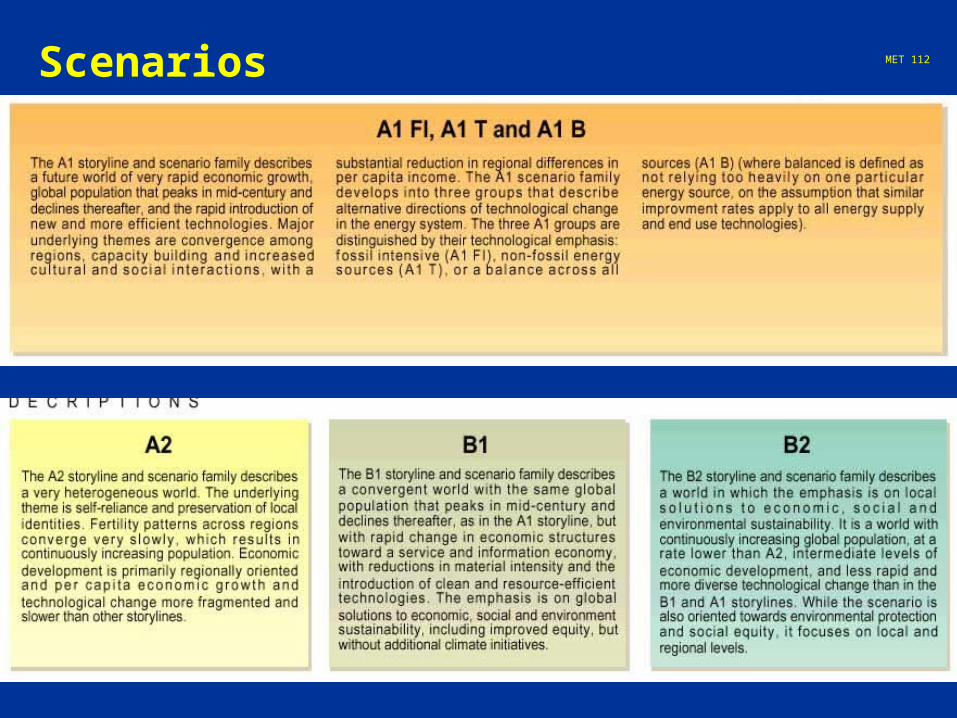
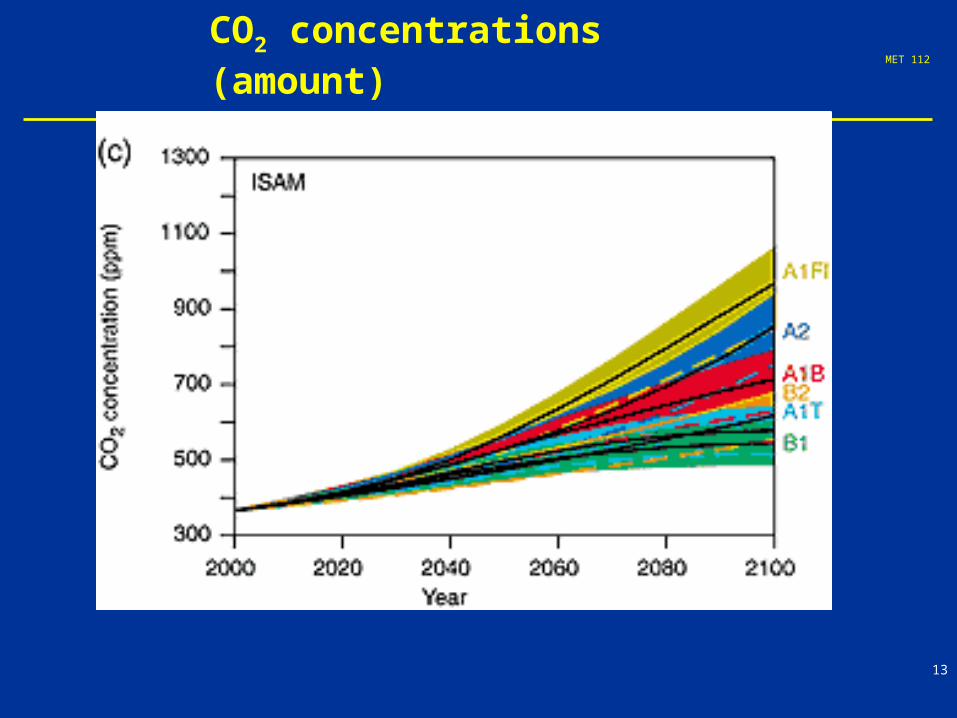
Emission Scenarios
SRES (special report on emission scenarios)
MET 112
12
Scenarios
MET 112
13
CO2 concentrations (amount)

MET 112
14
Future Predictions: Temperature
MET 112
16
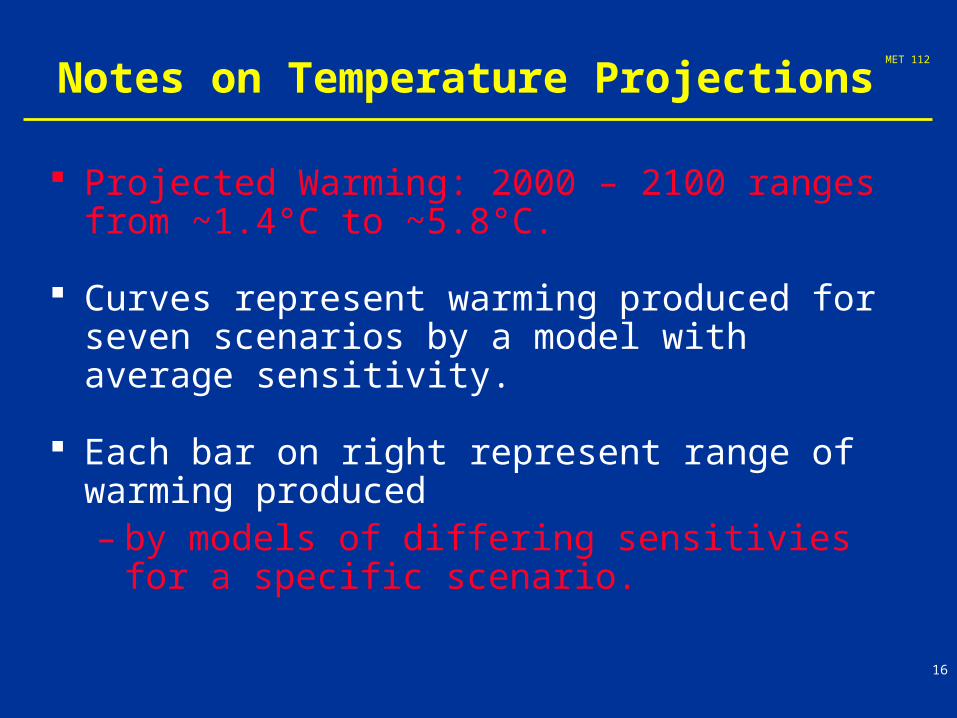
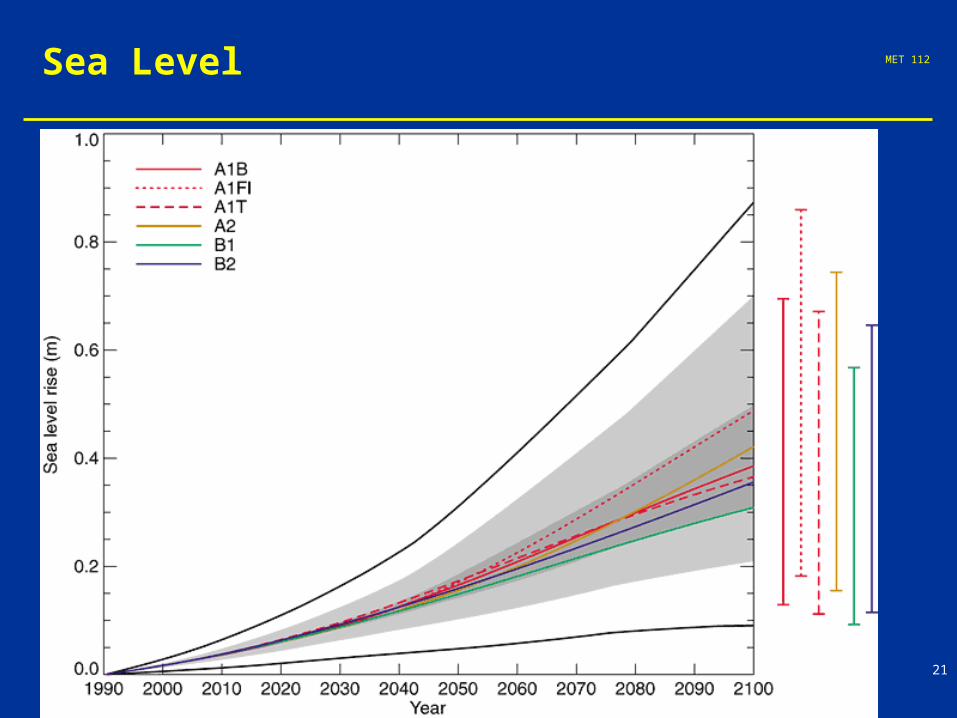
Notes on Temperature Projections
Projected Warming: 2000 – 2100 ranges from ~1.4°C to ~5.8°C.
Curves represent warming produced for seven scenarios by a model with average sensitivity.
Each bar on right represent range of warming produced – by models of differing sensitivies for a
specific scenario.
MET 112
18
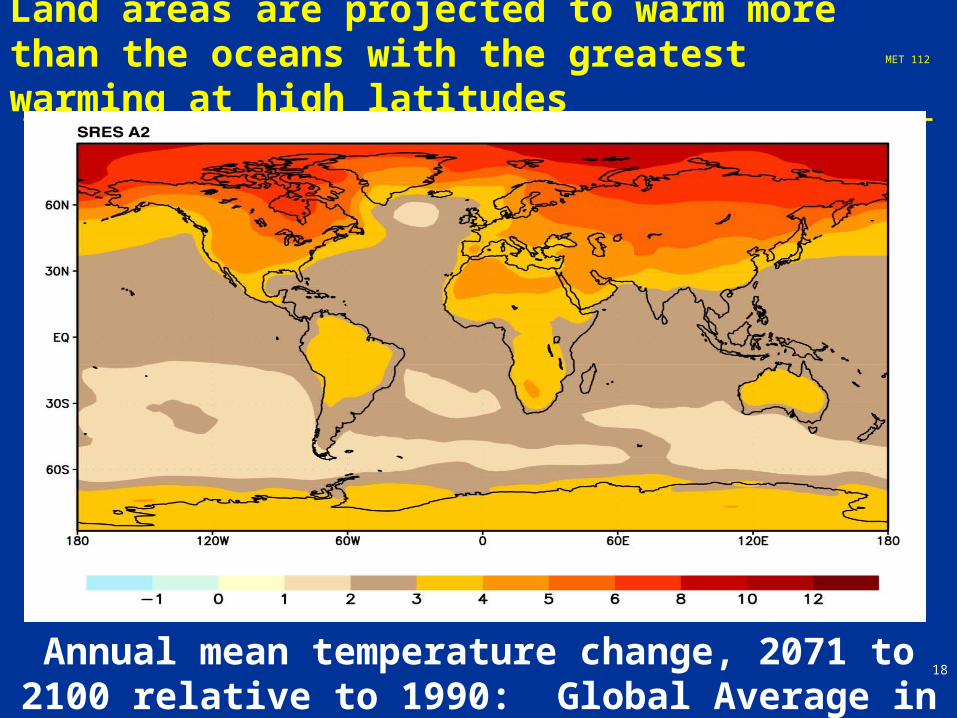
Land areas are projected to warm more than the oceans with the greatest warming at high latitudes
Annual mean temperature change, 2071 to 2100 relative to 1990: Global Average in 2085 = 3.1oC
MET 112
20
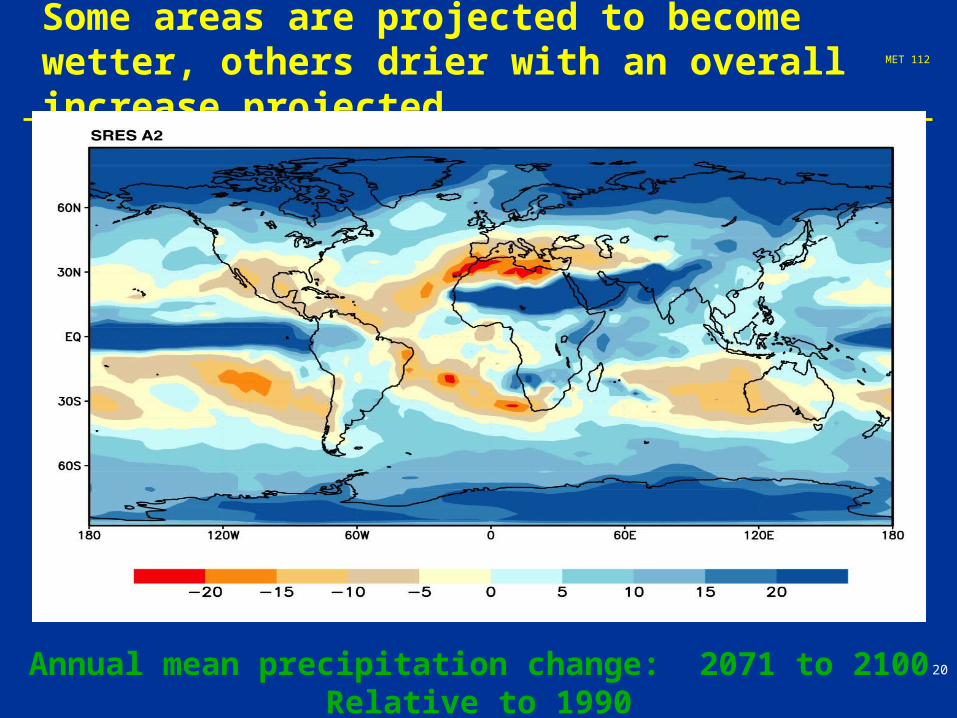
Some areas are projected to become wetter, others drier with an overall increase projected
Annual mean precipitation change: 2071 to 2100 Relative to 1990
MET 112
21
Sea Level
MET 112
22
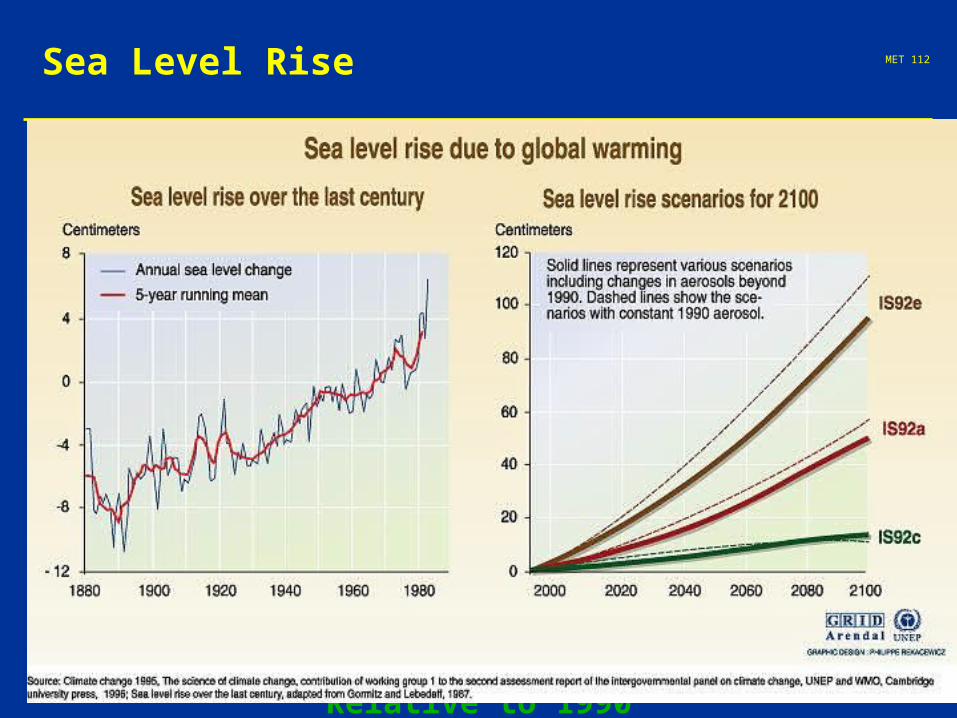
Sea Level Rise
Annual mean precipitation change: 2071 to 2100 Relative to 1990
MET 112
23

MET 112
24
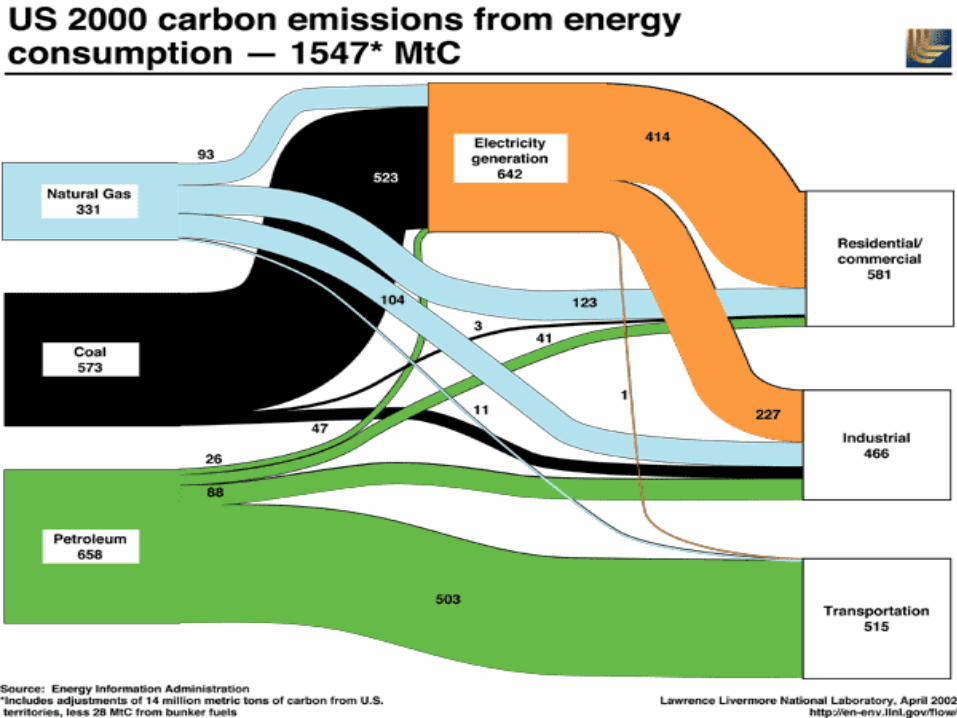
1. What percentage of electricity generation comes from the burning of natural gas?
2. What percentage of transportation energy comes from natural gas burning?
3. What percentage of transportation energy use comes from coal?
4. If you buy an electric car, what is the mostly likely source of energy?
5. Where does most residential energy come from?
Questions
MET 112
25
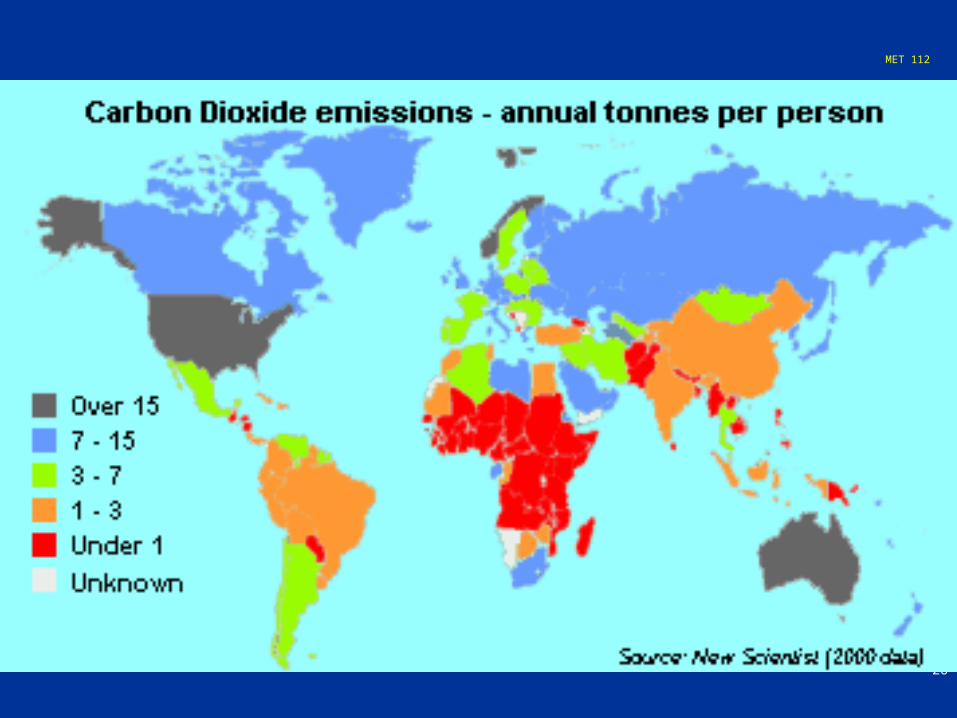
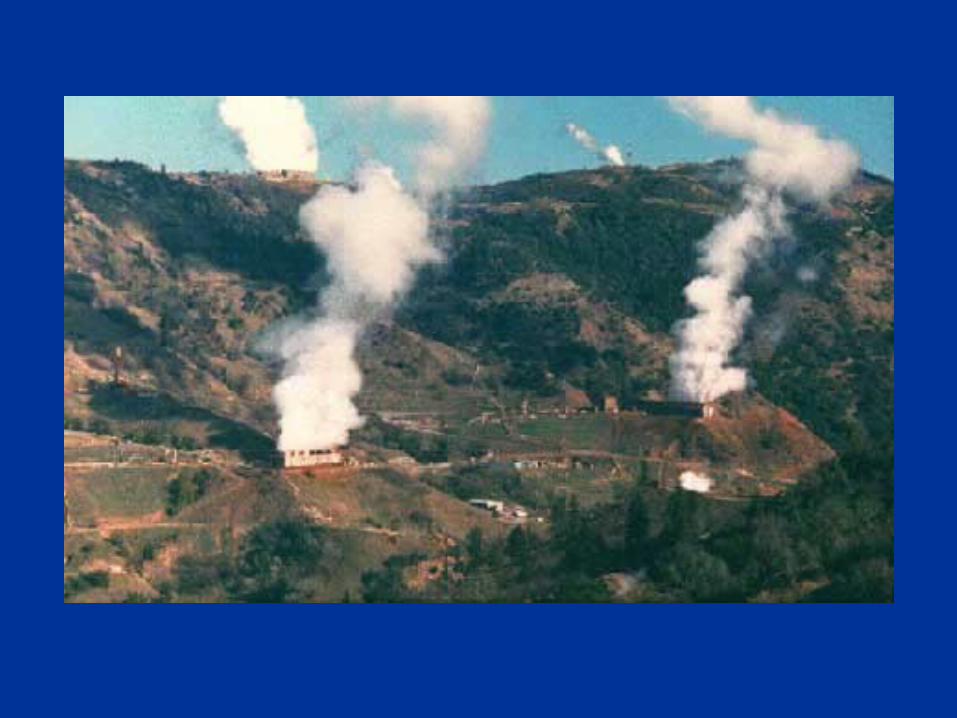
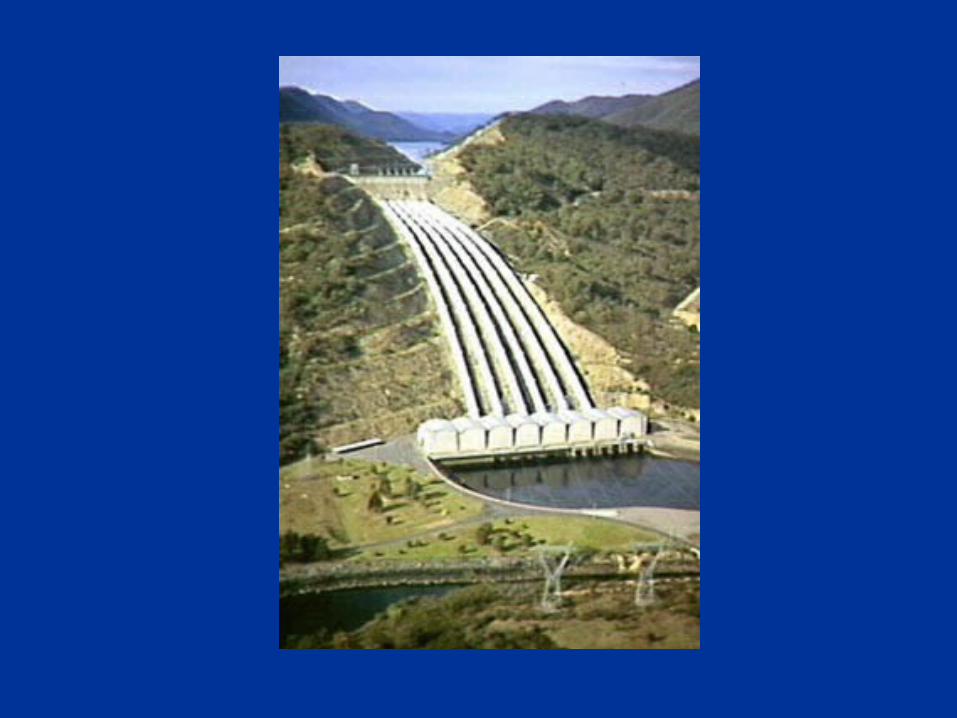
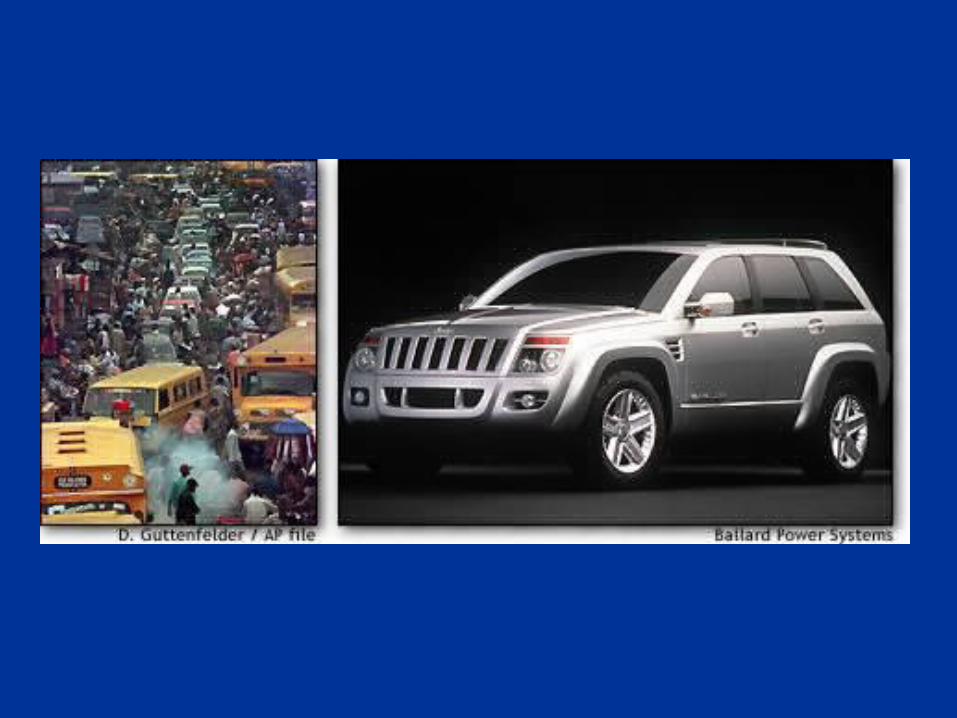
Obviously, one of the main issues related to climate change is the burning of fossil fuels
Thus, energy use, and the continuing demand for energy are central to the challenges of climate change.
Energy and Climate Change
MET 112
26
MET 112
27
MET 112
28
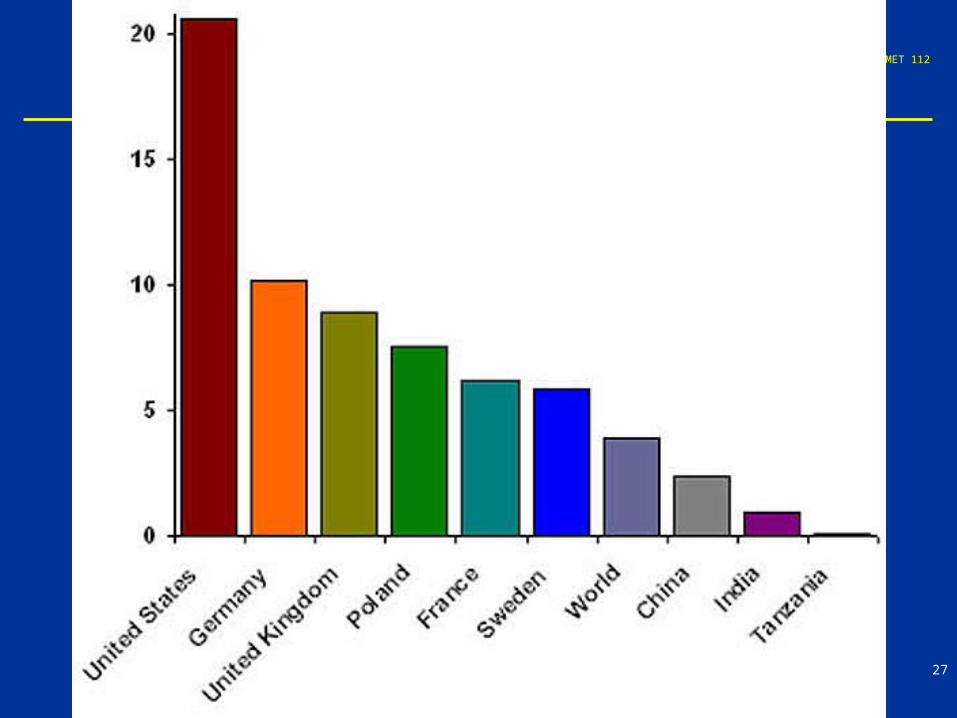
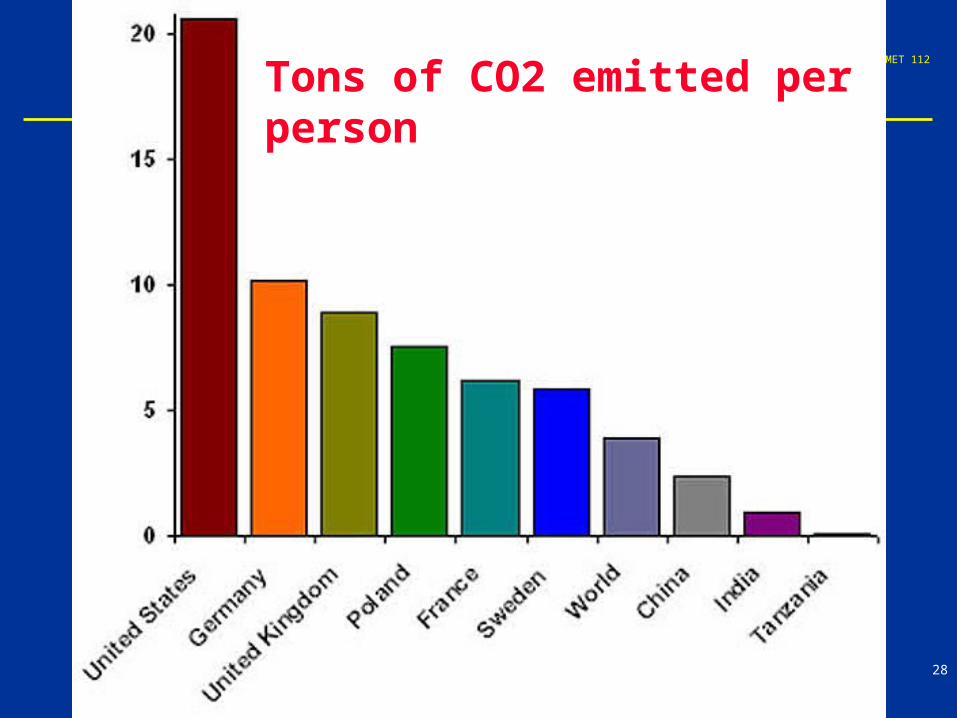
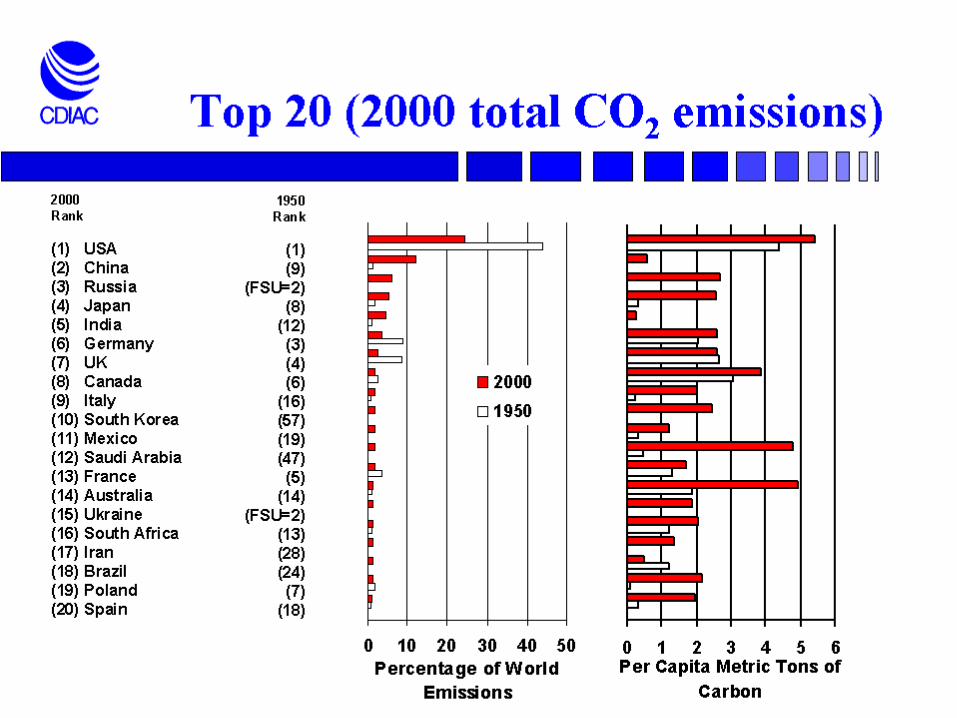
Tons of CO2 emitted per person
MET 112
29
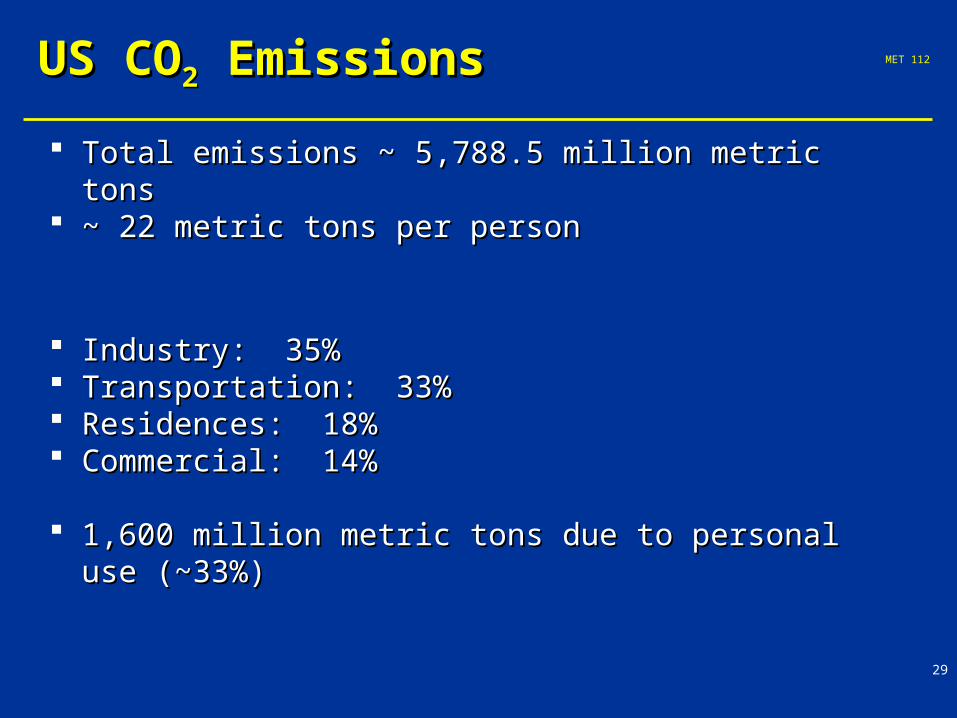
US COUS CO22 Emissions Emissions
Total emissions ~ Total emissions ~ 5,788.5 million metric tons5,788.5 million metric tons ~ 22 metric tons per person ~ 22 metric tons per person
Industry: 35% Industry: 35% Transportation: 33%Transportation: 33% Residences: 18%Residences: 18% Commercial: 14%Commercial: 14%
1,600 million metric tons due to personal use (~33%)1,600 million metric tons due to personal use (~33%)
MET 112
30
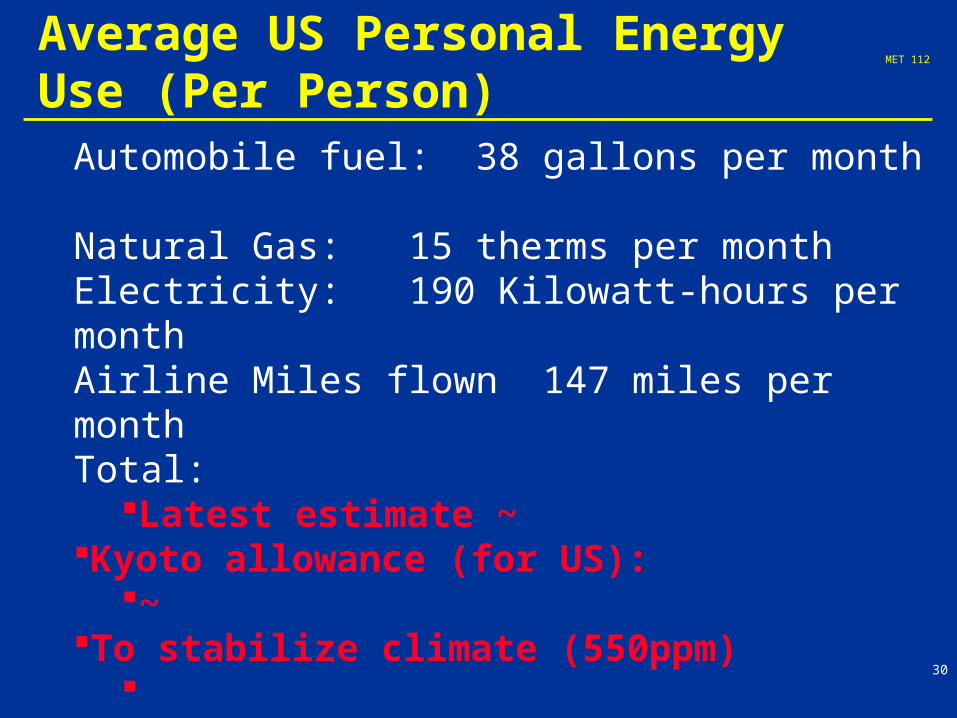
Automobile fuel: 38 gallons per month Natural Gas: 15 therms per monthElectricity: 190 Kilowatt-hours per monthAirline Miles flown 147 miles per monthTotal:
Latest estimate ~ Kyoto allowance (for US):
~ To stabilize climate (550ppm)
Average US Personal Energy Use (Per Person)
MET 112
31
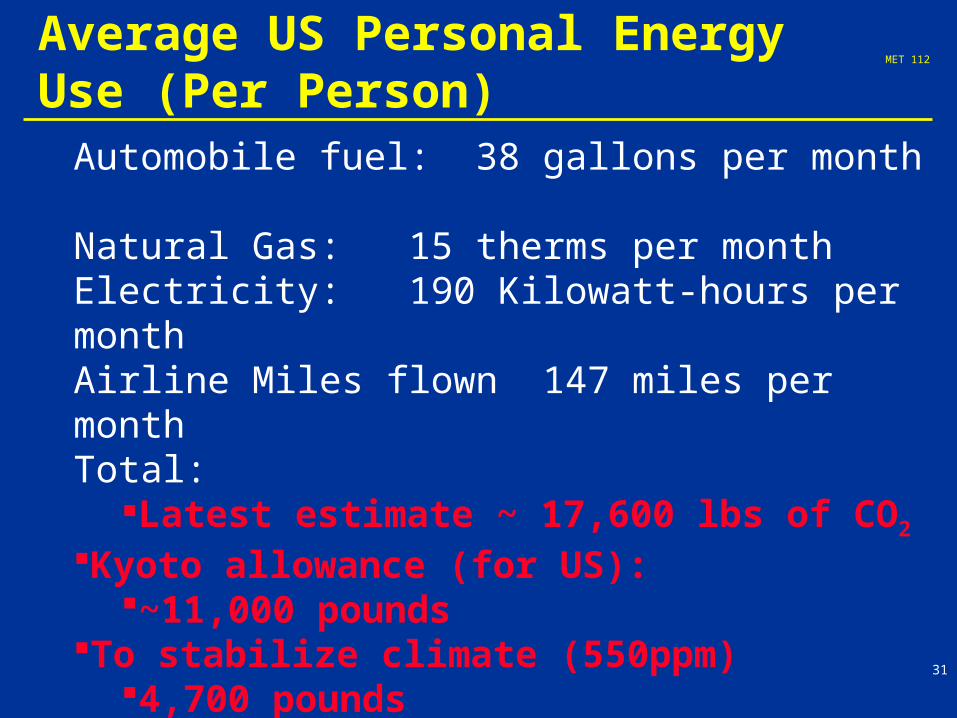
Automobile fuel: 38 gallons per month Natural Gas: 15 therms per monthElectricity: 190 Kilowatt-hours per monthAirline Miles flown 147 miles per monthTotal:
Latest estimate ~ 17,600 lbs of CO2 Kyoto allowance (for US):
~11,000 pounds To stabilize climate (550ppm)
4,700 pounds
Average US Personal Energy Use (Per Person)
MET 112
32

MET 112
33
Mitigation of climate changeMitigation of climate change
Mitigation: Mitigation: – Steps taken to avoid or minimize negative Steps taken to avoid or minimize negative
environmental impacts. environmental impacts.
Mitigation can includeMitigation can include: : • avoiding the impact by not taking a certain action;avoiding the impact by not taking a certain action;
• minimizing impacts by limiting the degree or minimizing impacts by limiting the degree or magnitude of the action; magnitude of the action;
• rectifying the impact by repairing or rectifying the impact by repairing or restoring the affected environmentrestoring the affected environment
MET 112
34
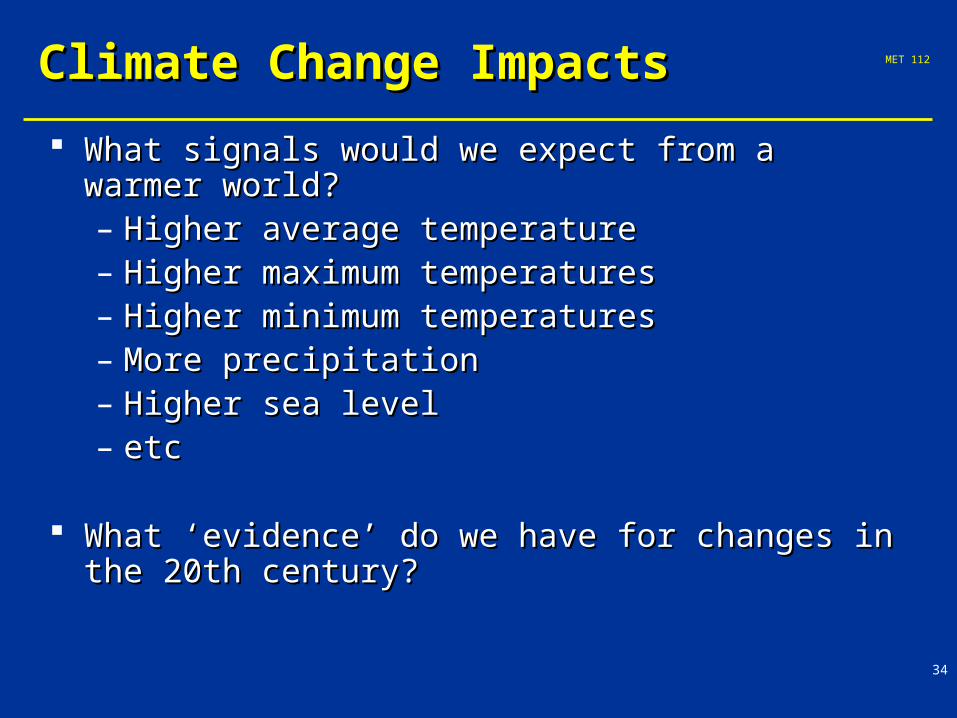
Climate Change ImpactsClimate Change Impacts
What signals would we expect from a warmer world?What signals would we expect from a warmer world?– Higher average temperatureHigher average temperature– Higher maximum temperaturesHigher maximum temperatures– Higher minimum temperaturesHigher minimum temperatures– More precipitationMore precipitation– Higher sea levelHigher sea level– etcetc
What ‘evidence’ do we have for changes in the 20th What ‘evidence’ do we have for changes in the 20th century?century?
The Kyoto Protocol is an international agreement linked to The Kyoto Protocol is an international agreement linked to the United Nations Framework Convention on Climate Change. the United Nations Framework Convention on Climate Change. The major feature of the Kyoto Protocol is that it sets binding The major feature of the Kyoto Protocol is that it sets binding targets for 37 industrialized countries and the European communitytargets for 37 industrialized countries and the European community for reducing greenhouse gas (GHG) emissions.for reducing greenhouse gas (GHG) emissions.These amount to an average of five per cent against 1990 levelsThese amount to an average of five per cent against 1990 levels over the five-year period 2008-2012. over the five-year period 2008-2012.
The Kyoto Protocol was adopted The Kyoto Protocol was adopted in Kyoto, Japan, in Kyoto, Japan, on 11 December 1997 andon 11 December 1997 and entered into force on entered into force on 16 February 2005 16 February 2005
MET 112
36
The Kyoto ProtocolThe Kyoto Protocol A United Nations sponsored effort:A United Nations sponsored effort:
– Calls for Calls for reductionsreductions of greenhouse gas emissions by of greenhouse gas emissions by industrialized countriesindustrialized countries of of 5.2 per cent below 1990 levels5.2 per cent below 1990 levels. .
– The Protocol will go into force after The Protocol will go into force after 1.1. The protocol has been ratified by a minimum of 55 countries.The protocol has been ratified by a minimum of 55 countries.2.2. The ratifying nations comprise 55% of global greenhouse The ratifying nations comprise 55% of global greenhouse
gas emissions.gas emissions.– Current status:Current status:
156 countries have signed accounting for 61% of global CO156 countries have signed accounting for 61% of global CO22.. US not planning on signing protocol (US accounts for 36% of US not planning on signing protocol (US accounts for 36% of
COCO22 emitted) emitted) Kyoto protocol went into force in Feb 2005Kyoto protocol went into force in Feb 2005

MET 112
37
Kyoto ProtocolKyoto Protocol
Aim:– Ways to reduce increasing GHG
Goals:
– Enhancement of energy efficiency in relevant sectors of the national economy
MET 112
38
MET 112
39
Kyoto ProtocolKyoto Protocol
Aim:– Ways to reduce increasing GHG
Goals:
– Enhancement of energy efficiency in relevant sectors of the national economy
– Protection and enhancement of sinks

MET 112
40
MET 112
41
Kyoto ProtocolKyoto Protocol
Aim:– Ways to reduce increasing GHG
Goals:
– Enhancement of energy efficiency in relevant sectors of the national economy
– Protection and enhancement of sinks– Promote sustainable agriculture

MET 112
42

MET 112
43
Kyoto ProtocolKyoto Protocol
Aim:– Ways to reduce increasing GHG
Goals:
– Enhancement of energy efficiency in relevant sectors of the national economy
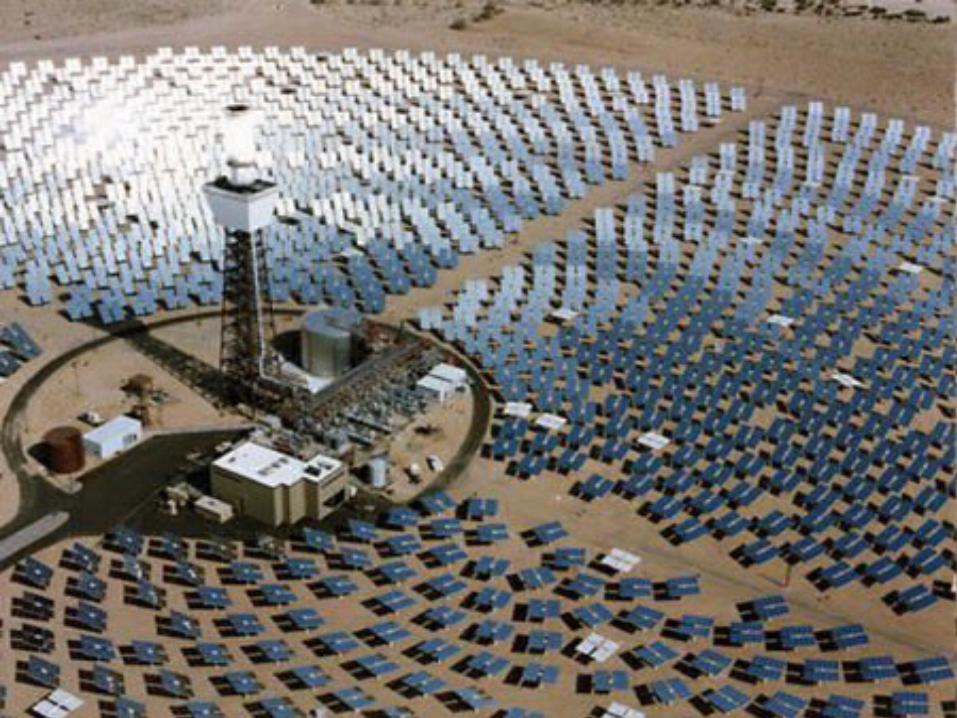
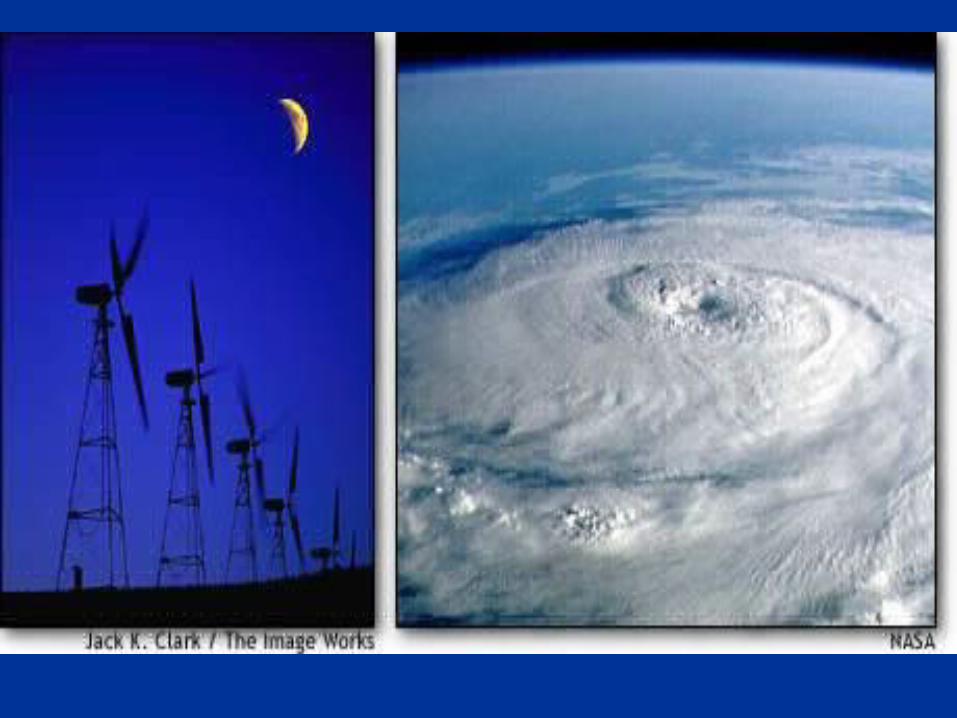
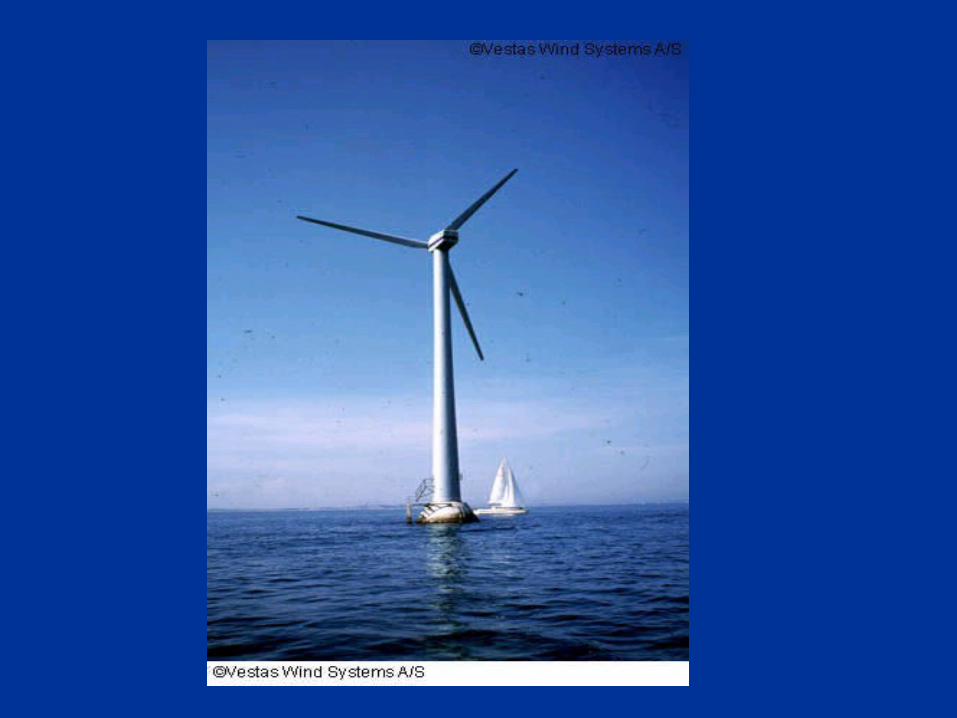
– Protection and enhancement of sinks– Promote sustainable agriculture– Research and promote new and renewable energy–
MET 112
50
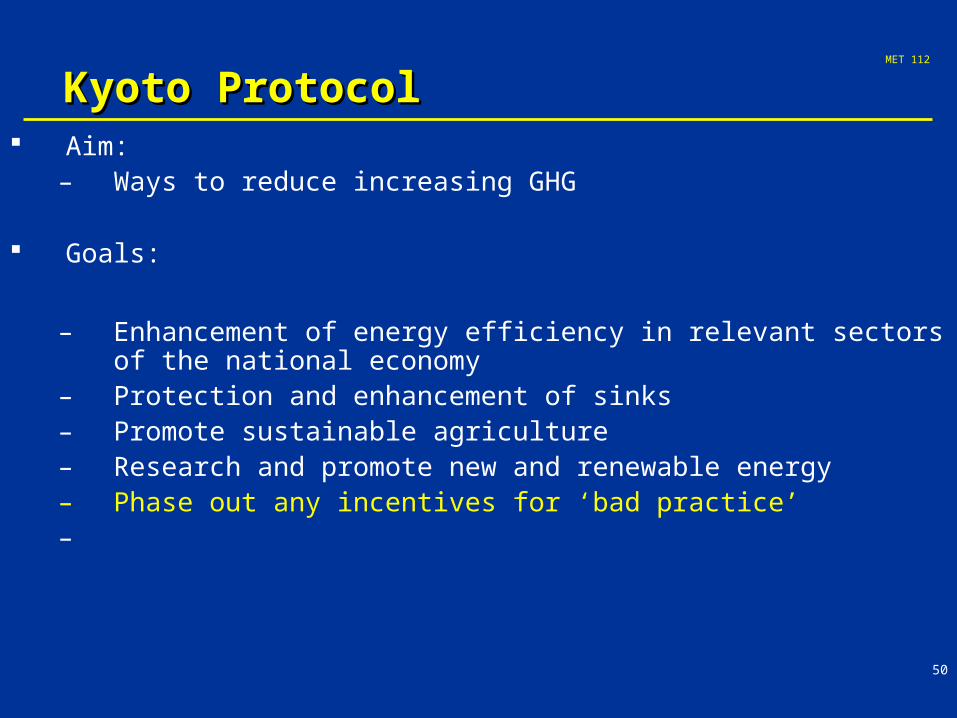
Kyoto ProtocolKyoto Protocol Aim:
– Ways to reduce increasing GHG
Goals:
– Enhancement of energy efficiency in relevant sectors of the national economy
– Protection and enhancement of sinks– Promote sustainable agriculture– Research and promote new and renewable energy– Phase out any incentives for ‘bad practice’–
MET 112
52
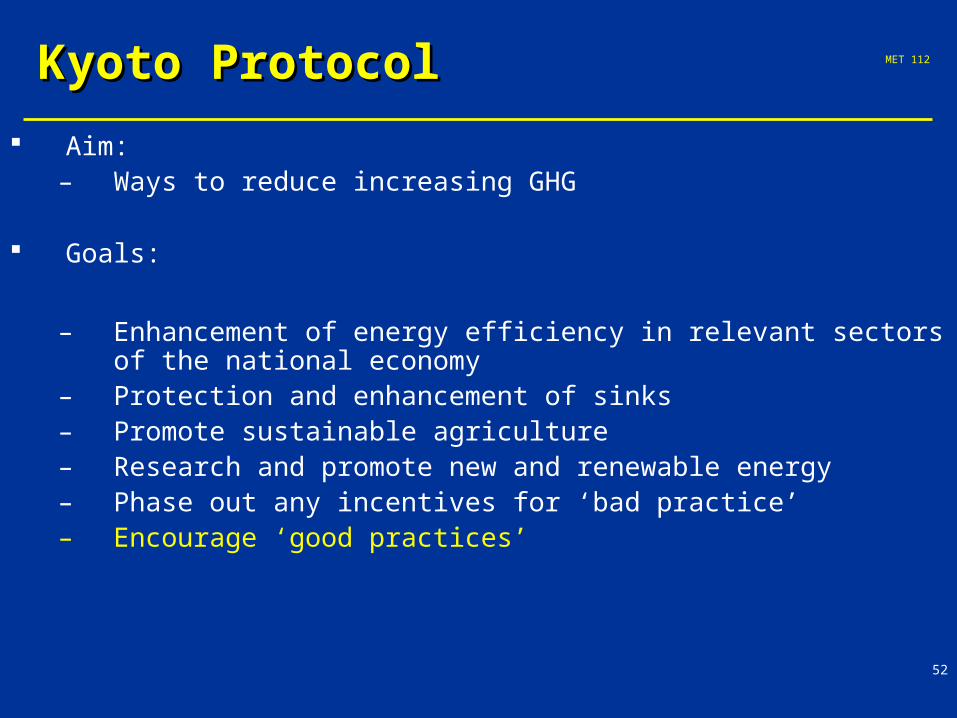
Kyoto ProtocolKyoto Protocol
Aim:– Ways to reduce increasing GHG
Goals:
– Enhancement of energy efficiency in relevant sectors of the national economy
– Protection and enhancement of sinks– Promote sustainable agriculture– Research and promote new and renewable energy– Phase out any incentives for ‘bad practice’– Encourage ‘good practices’
MET 112
55
Kyoto ProtocolKyoto Protocol
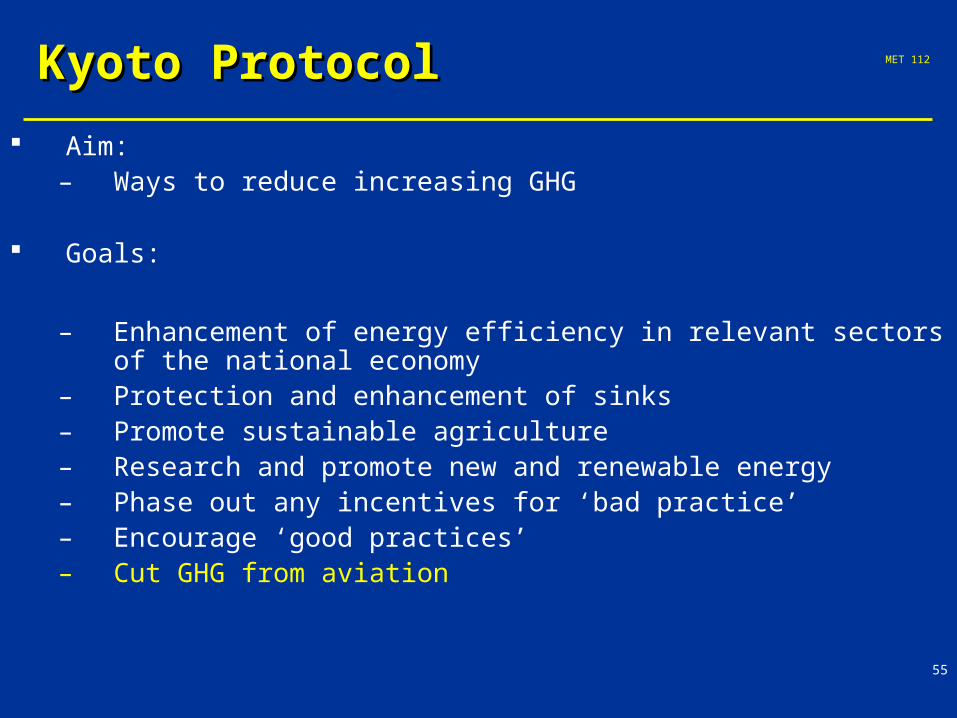
Aim:– Ways to reduce increasing GHG
Goals:
– Enhancement of energy efficiency in relevant sectors of the national economy
– Protection and enhancement of sinks– Promote sustainable agriculture– Research and promote new and renewable energy– Phase out any incentives for ‘bad practice’– Encourage ‘good practices’– Cut GHG from aviation
MET 112
56
Kyoto TargetsKyoto Targets
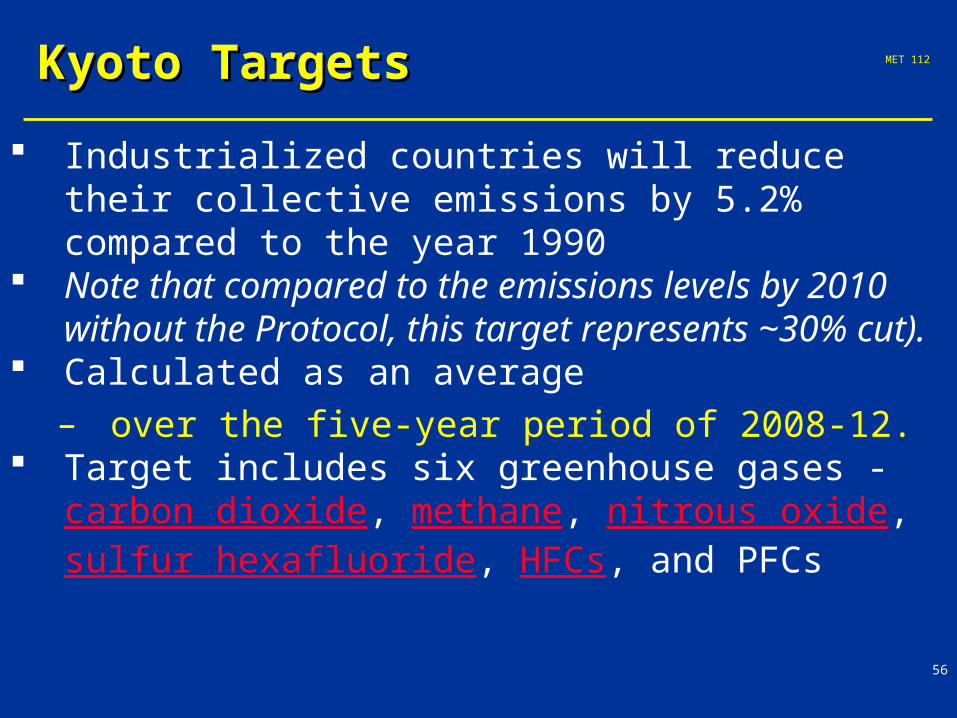
Industrialized countries will reduce their collective emissions by 5.2% compared to the year 1990
Note that compared to the emissions levels by 2010 without the Protocol, this target represents ~30% cut).
Calculated as an average – over the five-year period of 2008-12.
Target includes six greenhouse gases - carbon dioxide, methane, nitrous oxide, sulfur hexafluoride, HFCs, and PFCs

MET 112
57
HFC - Hydrofluorocarbons
PFC- perfluorocarbon, a powerful greenhouse gas emitted during the production of aluminumPFC
MET 112
58
Kyoto TargetsKyoto Targets
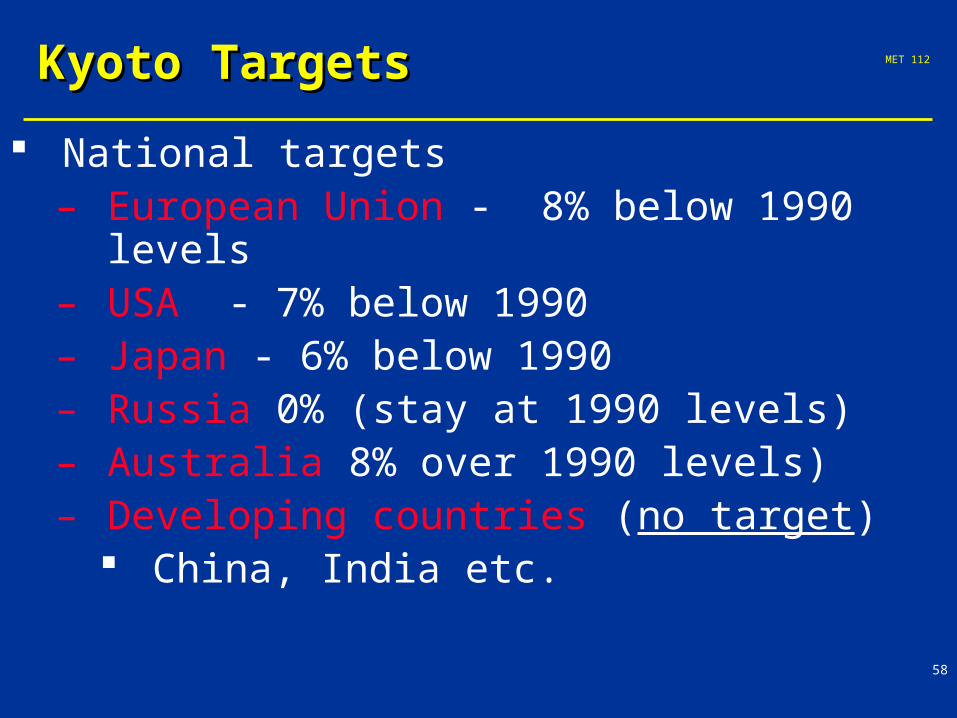
National targets– European Union - 8% below 1990 levels– USA - 7% below 1990– Japan - 6% below 1990– Russia 0% (stay at 1990 levels)– Australia 8% over 1990 levels) – Developing countries (no target)
China, India etc.
MET 112
59
Kyoto Targets: Developing Kyoto Targets: Developing countriescountries
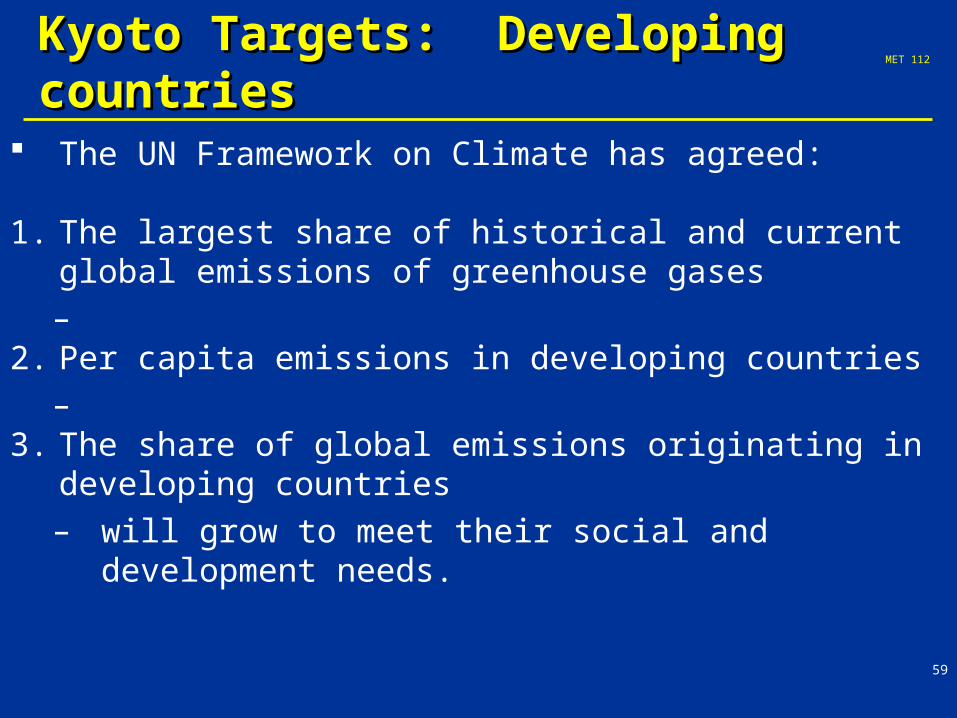
The UN Framework on Climate has agreed:
1. The largest share of historical and current global emissions of greenhouse gases –
2. Per capita emissions in developing countries –
3. The share of global emissions originating in developing countries – will grow to meet their social and development needs.
MET 112
60
Kyoto Targets: Developing Kyoto Targets: Developing countriescountries
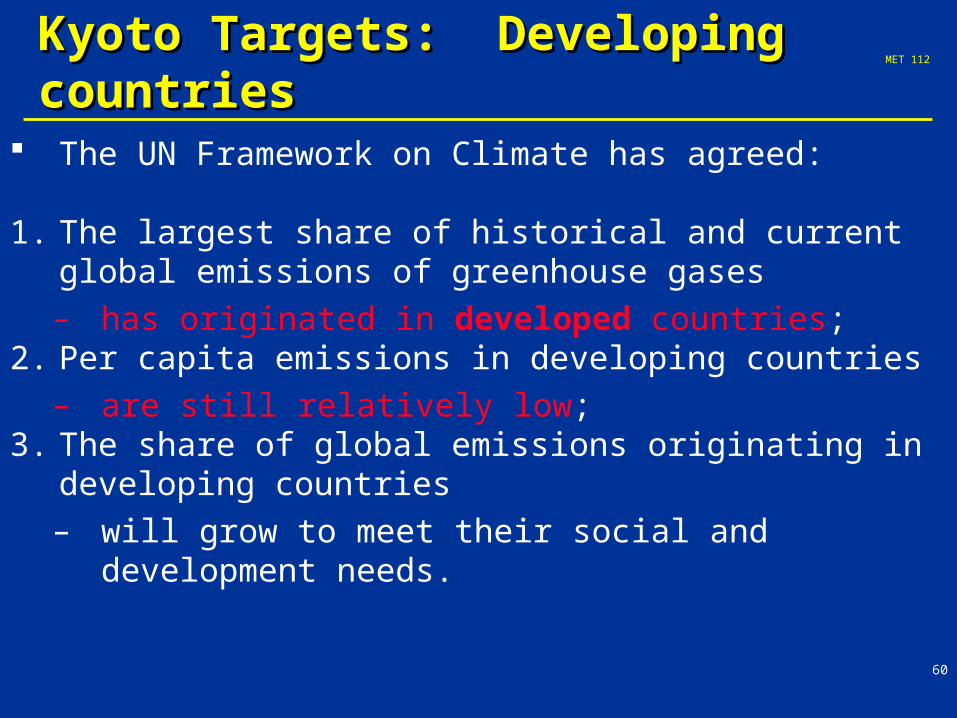
The UN Framework on Climate has agreed:
1. The largest share of historical and current global emissions of greenhouse gases – has originated in developed countries;
2. Per capita emissions in developing countries – are still relatively low;
3. The share of global emissions originating in developing countries – will grow to meet their social and development needs.
MET 112
61
The Kyoto Mechanisms
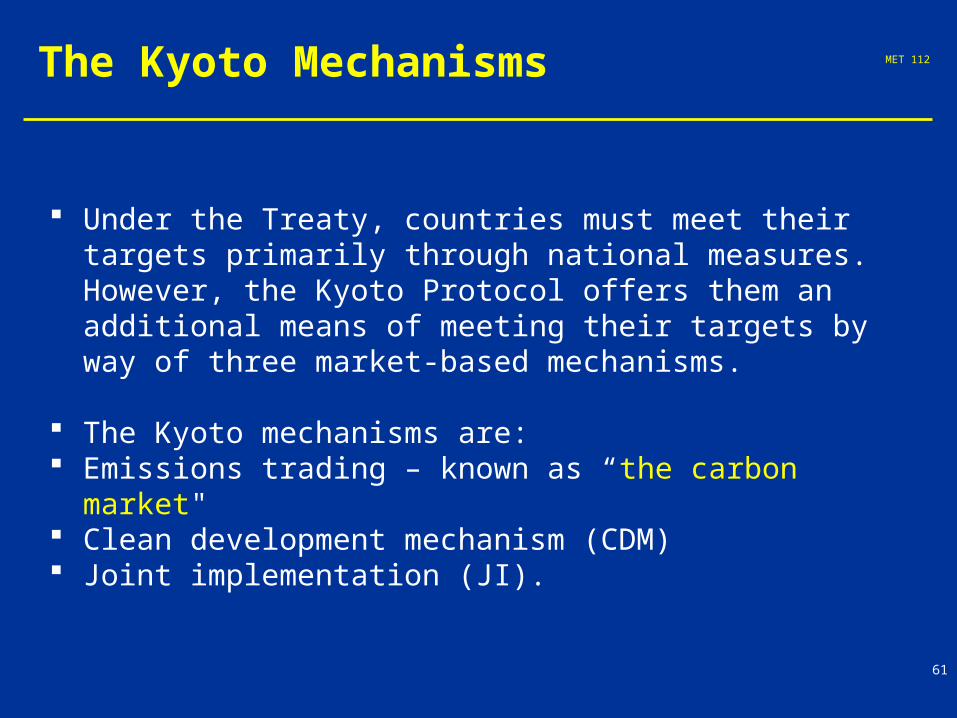
Under the Treaty, countries must meet their targets primarily through national measures. However, the Kyoto Protocol offers them an additional means of meeting their targets by way of three market-based mechanisms.
The Kyoto mechanisms are: Emissions trading – known as “the carbon market" Clean development mechanism (CDM) Joint implementation (JI).

MET 112
62
Kyoto Protocol MechanismsKyoto Protocol Mechanisms
Keep to assigned amounts of GHG with overall worldwide reduction by at least 5% below 1990 levels by 2008-2012
Countries can meet their commitments together
Joint implementation -Countries can work together to meet their emission reduction targets.
Richer (annex 1) countries can help developing countries to achieve sustainable development and limit GHG increases and then claim some emission reductions for their own targets
Emissions trading - countries can trade in ‘emission units’
MET 112
63
Emissions TradingEmissions Trading
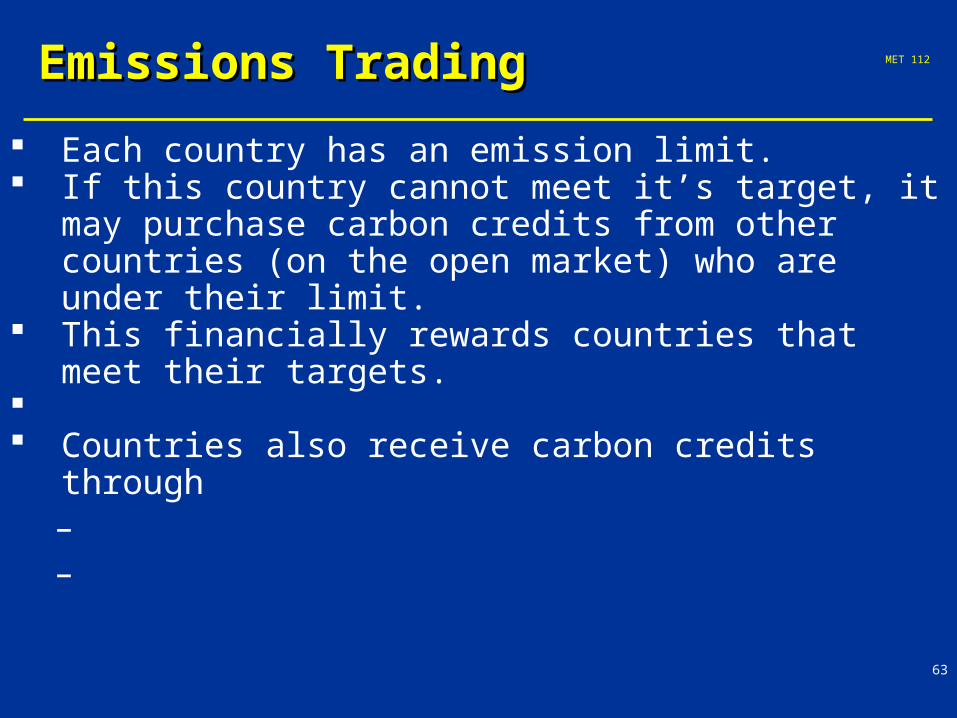
Each country has an emission limit. If this country cannot meet it’s target, it may
purchase carbon credits from other countries (on the open market) who are under their limit.
This financially rewards countries that meet their targets.
Countries also receive carbon credits through
– –
MET 112
64
Emissions TradingEmissions Trading
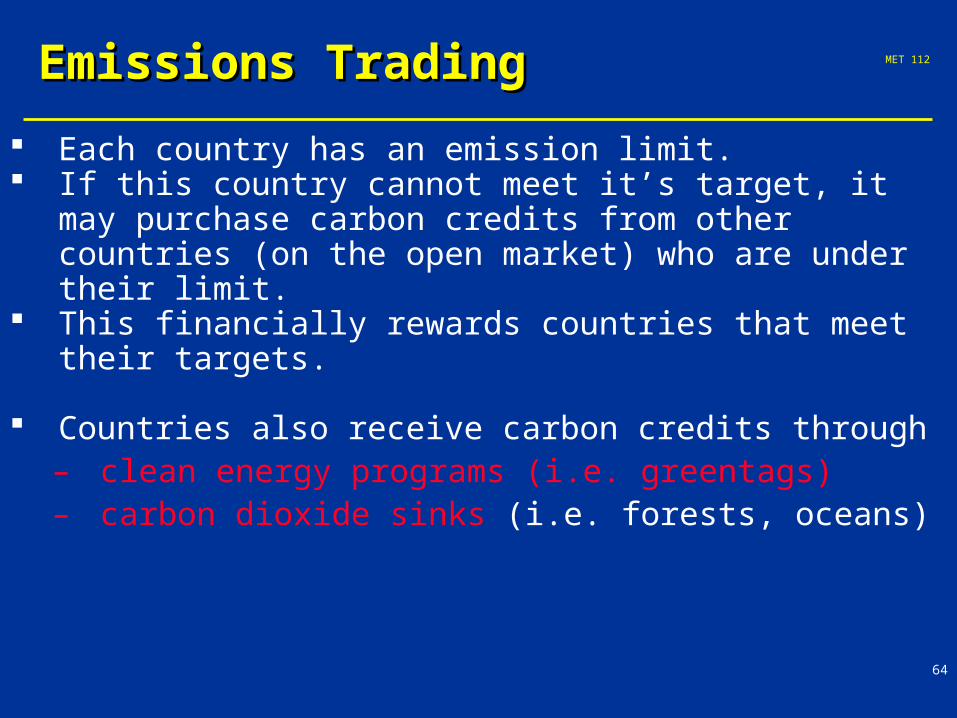
Each country has an emission limit. If this country cannot meet it’s target, it may
purchase carbon credits from other countries (on the open market) who are under their limit.
This financially rewards countries that meet their targets.
Countries also receive carbon credits through – clean energy programs (i.e. greentags) – carbon dioxide sinks (i.e. forests, oceans)
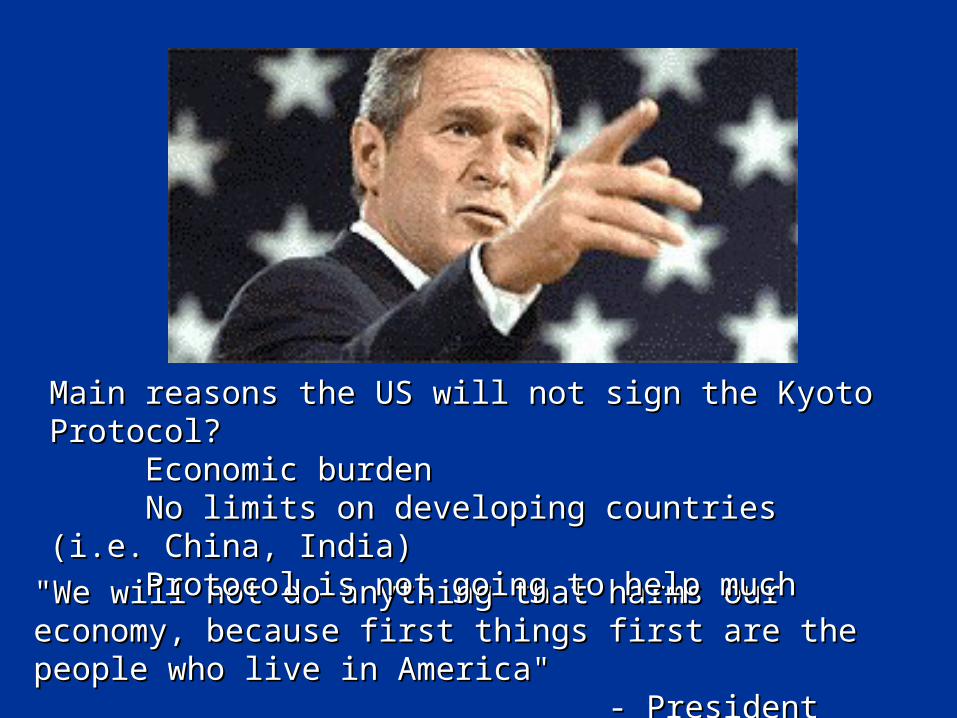
"We will not do anything that harms our economy, because first "We will not do anything that harms our economy, because first things first are the people who live in America" things first are the people who live in America"
- President Bush- President Bush
Main reasons the US will not sign the Kyoto Protocol?Main reasons the US will not sign the Kyoto Protocol?Economic burdenEconomic burdenNo limits on developing countries (i.e. China, India)No limits on developing countries (i.e. China, India)Protocol is not going to help muchProtocol is not going to help much
MET 112
67
Solutions - government
Kyoto Protocol
California potential leader

MET 112
69
MET 112
70
MET 112
71
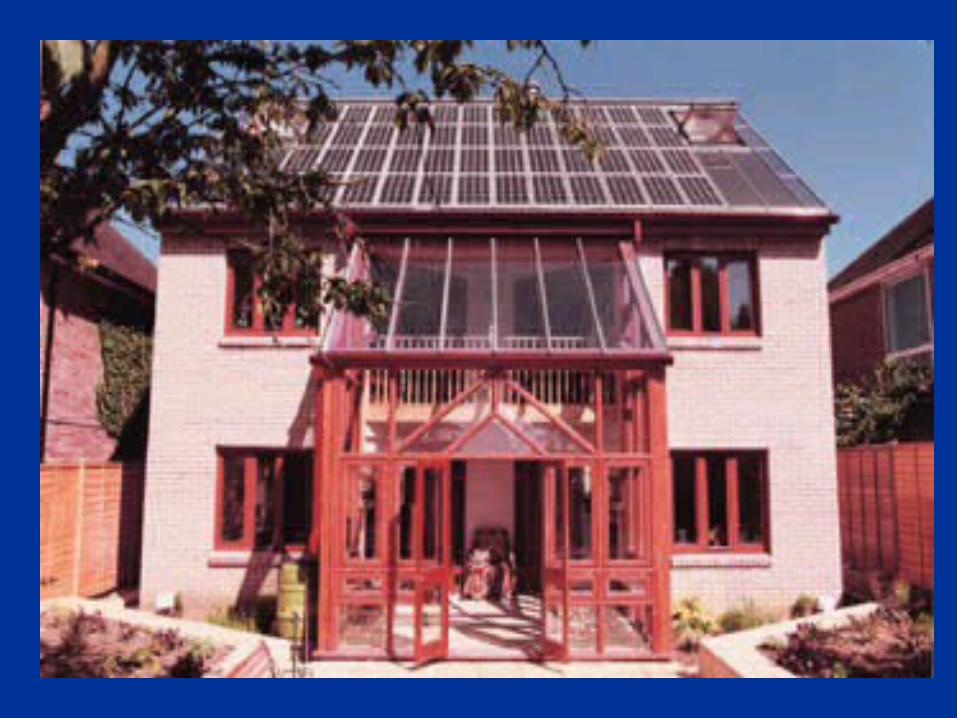
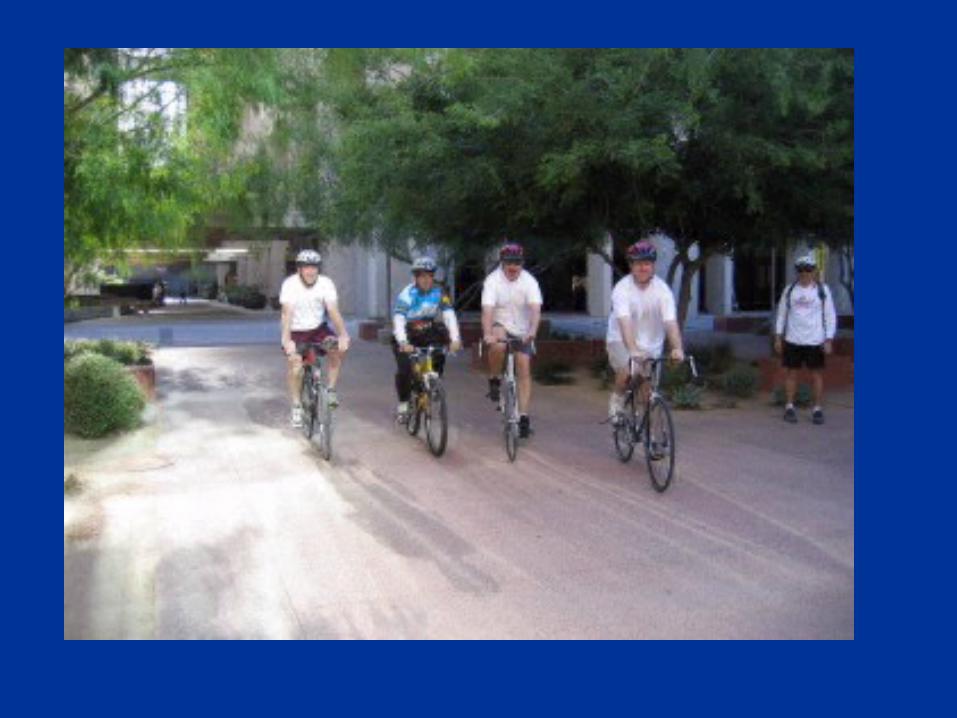
Solutions - personal Transportation Home Food Consumption
www.earthday.net : Top 10 Actions; Ecological Footprint

MET 112
72

MET 112
73
Four R’s
1. Rethink
2. Reduce
3. Reuse
4. Recycle
MET 112
75
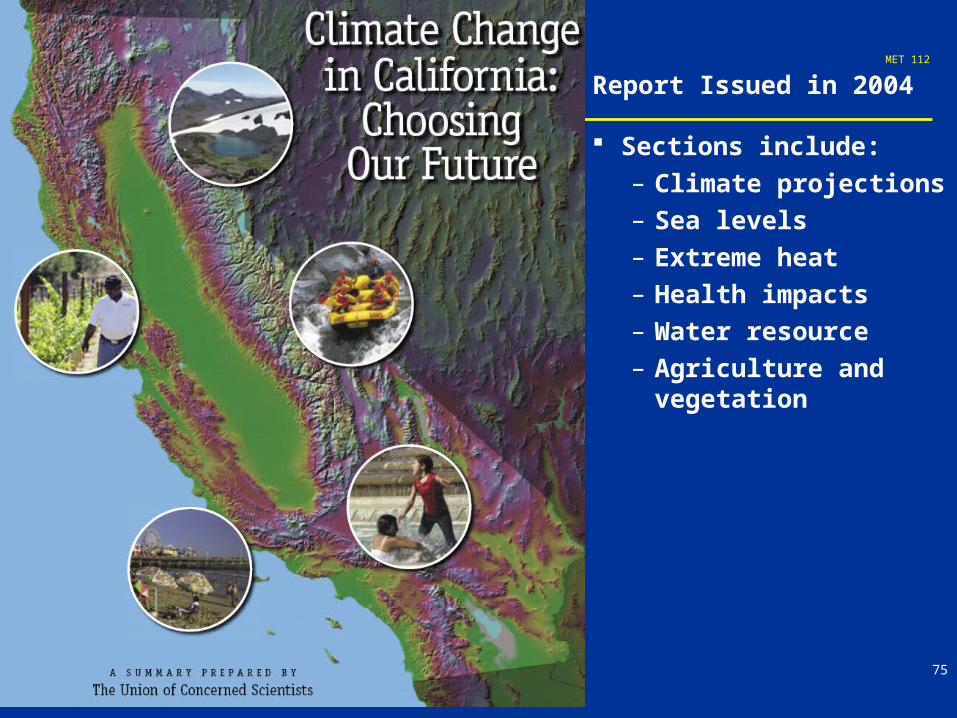
Report Issued in 2004
Sections include:– Climate projections– Sea levels– Extreme heat– Health impacts– Water resource – Agriculture and
vegetation
MET 112
76

MET 112
77
What is Heat Wave?
A heat wave is a prolonged period of excessively hot weather
may be accompanied by high humidity
Definition recommended by WMOThe definition recommended by the World Meteorological
Organization is when the daily maximum temperature of more than five consecutive days exceeds the average maximum temperature by 5 °C (9 °F), the normal period being 1961 - 1990.
MET 112
78

MET 112
79
Class Participation
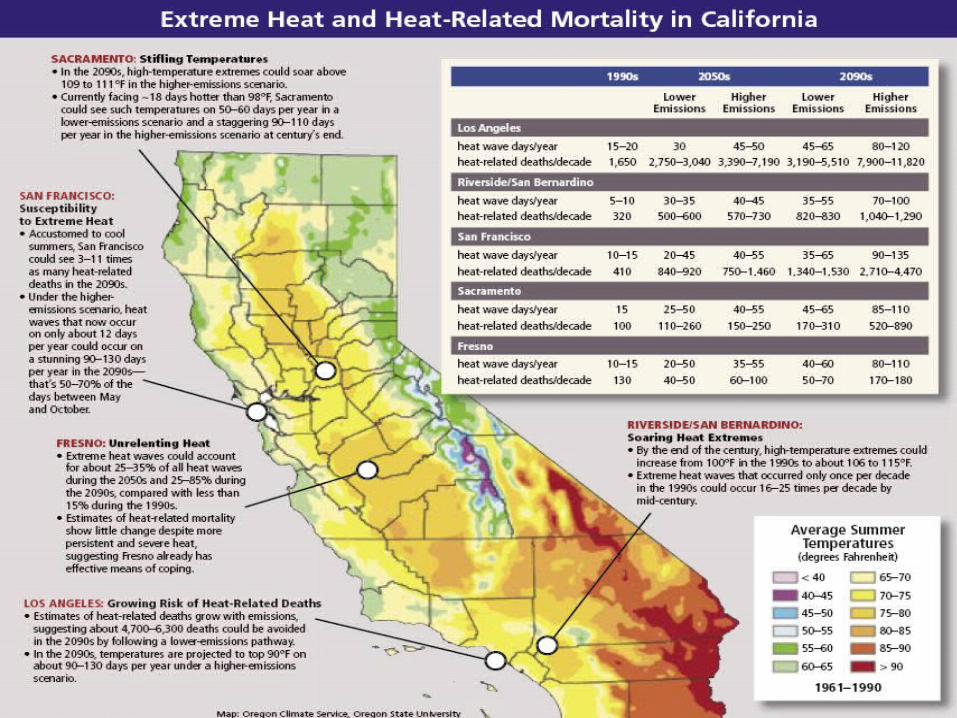
By 2050, which city has the longest heat wave days? Why?
What are the differences between the low emission and high emission cases in terms of heat wave days by 2090 for city Riverside? How about city LA?
How many people may die due to heat wave in SF in 2050 and 2090?
Your name_________Your name_________
MET 112
80

MET 112
81
MET 112
82
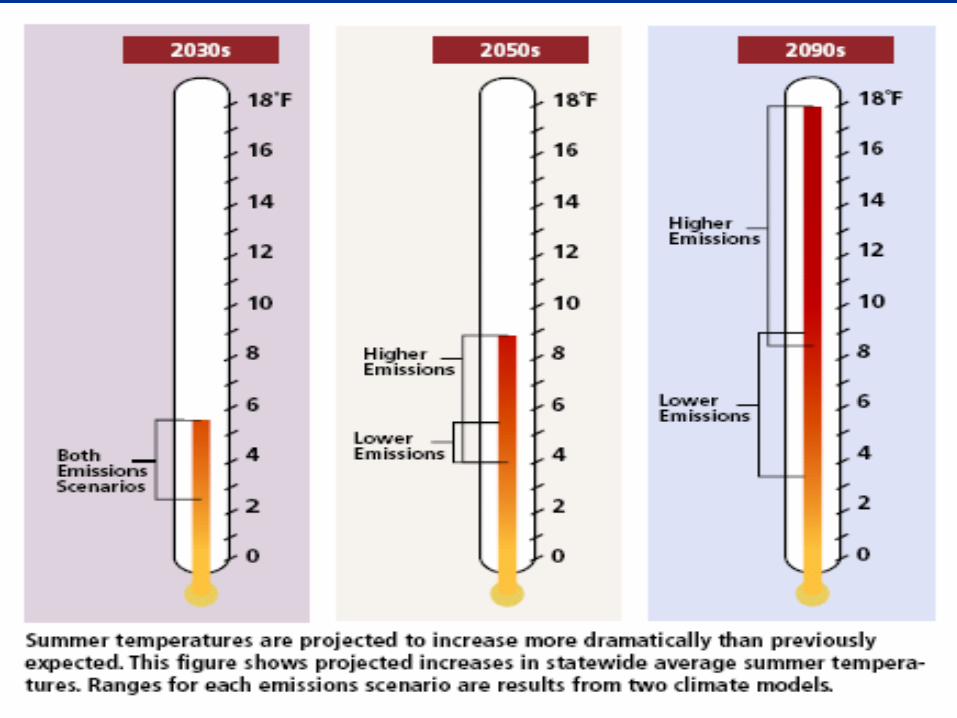
Climate change and CaliforniaAverage Temperature:
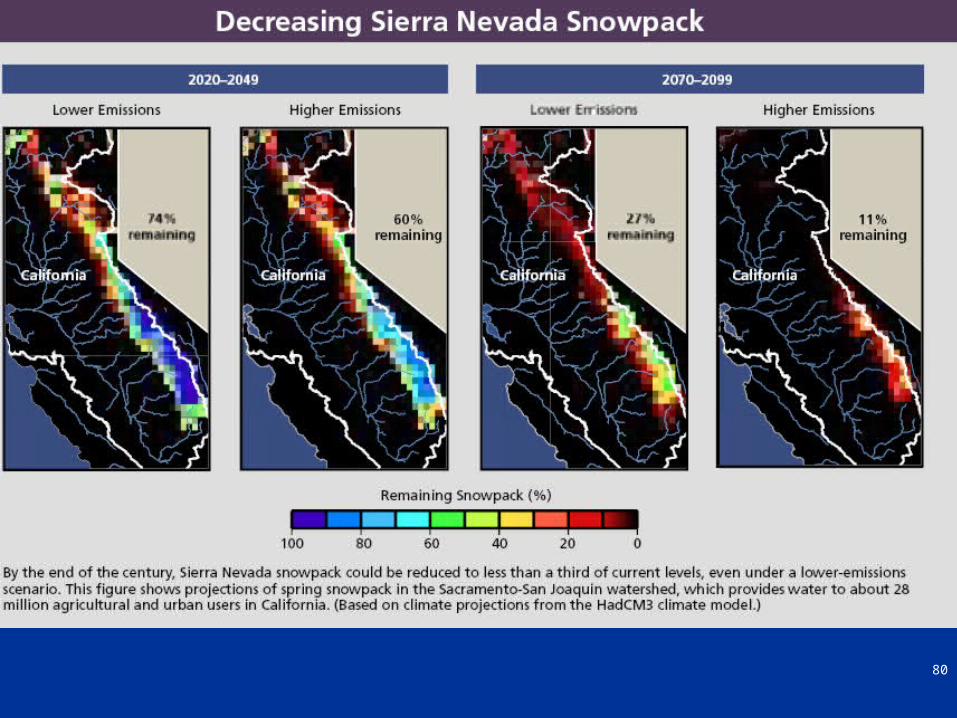
Winter - warmer winters - snowpack declines by 70-90% by 2090
Summer – warmer summers (5-15F by 2090)1. Coastal cities: coastal erosion by sea level rise.2. Human health: Urban air pollution/heat extremes
impact most vulnerable3. Water resources: Total water, but early runoff
from Sierras costly to adapt.4. Agriculture: Major challenge to various crops
industries.