mesozooplankton omnivory in the upper san francisco estuary · (= potamocorbula amurensis)(alpine...
TRANSCRIPT

MARINE ECOLOGY PROGRESS SERIESMar Ecol Prog Ser
Vol. 348: 33–46, 2007doi: 10.3354/meps07003
Published October 25
INTRODUCTION
In the last 2 decades, it has generally becomeaccepted that microzooplankton (heterotrophic/mixo-trophic protists 2 to 200 µm) are important componentsof marine systems (Pierce & Turner 1992, Rollwagen-Bollens & Penry 2003, Calbet & Landry 2004). We nowknow that microzooplankton are abundant, have highgrowth rates and are the major primary consumers inmost marine systems (Pierce & Turner 1992, Leaky etal. 1994, Calbet & Landry 2004). Thus, pelagic foodweb models should consider both microzooplanktonand phytoplankton.
Mesozooplankton are often the trophic intermedi-aries between microbial components (e.g. diatoms, fla-
gellates, ciliates) and higher organisms, and feed on awide variety of prey, including autotrophs, hetero-trophs and mixotrophs (Stoecker & Capuzzo 1990,Turner 2004). The degree to which mesozooplanktonconsume heterotrophic or autotrophic prey is, there-fore, key to understanding the contribution of each tothe upper food web.
The majority of research examining mesozooplank-ton feeding has focused on coastal seas, with relativelyfew studies conducted in estuaries (Turner 2004). Estu-aries are dynamic environments where tidal mixingand freshwater input create large variations in salinity,temperature, turbidity and nutrient concentrations, allof which may affect protist plankton community com-position (Iriarte et al. 2003, David et al. 2005) and
© Inter-Research 2007 · www.int-res.com*Email: [email protected]
Mesozooplankton omnivory in the upper San Francisco Estuary
Scott M. Gifford1,*, Gretchen Rollwagen-Bollens2, Stephen M. Bollens2
1Department of Marine Sciences, University of Georgia, Athens, Georgia 30602-3636, USA2School of Biological Sciences, Washington State University Vancouver, 14204 NE Salmon Creek Avenue, Vancouver,
Washington 98686-9600, USA
ABSTRACT: While many studies have examined mesozooplankton feeding in coastal environments,less attention has been given to this subject in estuaries. We used bottle incubation experiments tomeasure the feeding rates of a cladoceran (Daphnia sp.), a calanoid copepod (Acartia spp.), and 2cyclopoid copepods (Oithona davisae and Limnoithona tetraspina) on the protist plankton (<200 µm)of Suisun Bay, which is located in the upper San Francisco Estuary (SFE). Nanoplankton (2 to 15 µm)prey were highly abundant (2000 to 6000 cells ml–1 and 50 to 600 µg C l–1), whereas microplankton(15 to 200 µm) prey were 1 to 2 orders less abundant (10 to 90 cells ml–1 and 1 to 4 µg C l–1). Therewere few indications that mesozooplankton fed on nanoplankton, while microplankton were oftensignificantly consumed. Daphnia sp. cleared all microplankton prey categories except diatoms at>2 ml predator (pred.)–1 h–1. O. davisae consumed only ciliates in September 2004, while in Novem-ber 2004 it cleared both ciliates and diatoms at similar rates (0.8 ml pred.–1 h–1). L. tetraspina clearedonly aloricate ciliates and flagellates (0.8 to 1.0 ml pred.–1 h–1). Acartia spp. had the highest clearancerates on diatoms of all the predators examined (mean <1.0 ml pred.–1 h–1) but cleared ciliates at evenhigher rates (>2.0 ml pred.–1 h–1). With respect to biomass ingestion, in every experiment mesozoo-plankton were found to ingest ciliate carbon at the highest rates (3 to 29 ng C pred.–1 h–1). Our resultsindicate that while estuarine mesozooplankton are often omnivorous, important species-specific dif-ferences exist, and microzooplankton, especially ciliates, are an important component of the upperSFE food web.
KEY WORDS: Estuary · Mesozooplankton · Microzooplankton · Food web · Ciliates · Diatoms
Resale or republication not permitted without written consent of the publisher

Mar Ecol Prog Ser 348: 33–46, 2007
mesozooplankton feeding (Rollwagen-Bollens & Penry2003, Islam et al. 2005).
Microzooplankton are often highly abundant in estu-aries (Buskey 1993, Rollwagen-Bollens & Penry 2006),providing a potentially important food source to estu-arine mesozooplankton. The high growth rates ofmicrozooplankton allow them to closely track phyto-plankton production in estuaries (Ambler et al. 1985,Cowlishaw 2004), and they are important grazers ofestuarine primary production (Ruiz et al. 1998, Lionardet al. 2005).
Estuarine mesozooplankton have been observed tofeed on both phytoplankton and microzooplankton(Gifford & Dagg 1988, Ohman & Runge 1994, Naka-mura & Turner 1997, Rollwagen-Bollens & Penry 2003).Many of these studies have found seasonal variationsin feeding, particularly during phytoplankton blooms(Fessenden & Cowles 1994, Rollwagen-Bollens &Penry 2003); mesozooplankton often ingest phyto-plankton at higher rates than they ingest microzoo-plankton during such blooms. During non-bloom peri-
ods, phytoplankton production may not be able to fullysupport mesozooplankton and microzooplanktonbecome more important in the diet (Irigoien & Castel1995). However, microzooplankton are often cleared athigher rates than phytoplankton during both bloomand non-bloom periods (Gifford & Dagg 1988, Rollwa-gen-Bollens & Penry 2003). The calanoid copepodAcartia tonsa in a productive Gulf Coast estuary, forexample, cleared ciliates at higher rates (1 to 4 mlpredator [pred.]–1 h–1) than chlorophyll a (chl a; <1 mlpred.–1 h–1), even though phytoplankton representedthe majority of carbon ingested (Gifford & Dagg 1988).While a majority of these studies have focused oncopepods, other fresh and brackish water taxa (includ-ing cladocerans and rotifers) can also be abundant inthe upper estuary and can feed on both phytoplanktonand microzooplankton.
Although several papers have recently described thecomposition of the mesozooplankton of the San Fran-cisco Estuary (SFE) (Kimmerer & Orsi 1996, Bollens etal. 2002, Hooff & Bollens 2004), few studies have exam-ined their feeding on microzooplankton. The goal ofthis study was to understand the relative importance ofphytoplankton and microzooplankton in the diet ofmesozooplankton in the upper SFE over a multiyearperiod. More specifically, we measured clearance andingestion rates of 4 different mesozooplankton taxa(Daphnia sp., Limnoithona tetraspina, Oithona davisaeand Acartia spp.) on the natural prey assemblage ofprotist plankton (<200 µm) to discern seasonal andtaxon specific differences in mesozooplankton feedingrates.
MATERIALS AND METHODS
Study site. Suisun Bay is located in the upperreaches of the SFE (Fig. 1), where freshwater inputfrom the Sacramento and San Joaquin rivers meetssaline coastal waters entering through the GoldenGate (Conomos et al. 1985). Winter rainfall and springsnowmelt increase freshwater flow into Suisun Bay,which creates a low salinity zone (<2) from Decemberto June. During the summer months freshwater inputbecomes highly reduced and the low salinity zonemoves upstream of Suisun Bay.
The considerable size of the Sacramento and SanJoaquin watershed (draining 40% of the surface areaof California) results in the delivery of large amounts ofsediment and organic material into Suisun Bay(Conomos et al. 1985). Bottom interactions sustain highamounts of suspended solids, and the bay is the site ofan estuarine turbidity maximum. These conditionsresult in high nutrient levels and a shallow photicdepth. Primary production is therefore light limited
34
Fig. 1. San Francisco Estuary, California, USA. Sampling Stn 7 (d) is located within Suisun Bay

Gifford et al.: Mesozooplankton omnivory in San Francisco Estuary
rather than nutrient limited (Alpine & Cloern 1988,Cloern & Dufford 2005). Primary production is low(39 g C m–2 yr–1) due to both the light limited environ-ment and grazing by the clam, Corbula amurensis(= Potamocorbula amurensis) (Alpine & Cloern 1992).The bay typically experienced a phytoplankton bloomin the late spring (30 µg chl a l–1), but since the late1980s the bloom has ceased to appear, most probablydue to the invasion of C. amurensis in 1986 (Alpine &Cloern 1992). Chl a now ranges from 1 to 10 µg l–1 withlevels peaking in the spring (see sfbay.wr.usgs.gov/access/wqdata).
Mesozooplankton feeding experiments. We con-ducted 9 feeding experiments that examined the meso-zooplankton impact on nanoplankton (2 to 15 µm) andmicroplankton (15 to 200 µm) between March 2004and August 2005. Experiments were conductedmonthly during the spring (March to May) when chl ais typically elevated, and once in the late summer(August or September) in both 2004 and 2005. Oneadditional experiment was conducted in November2004. We collected samples at the US GeologicalSurvey’s (USGS) Water Quality Monitoring ProgramStn 7 (38° 2.9’ N, 122° 5.8’ W) to use the extensive ar-chive of historical and current hydrographic dataavailable for that site (see sfbay.wr.usgs.gov/access/wqdata).
Temperature and salinity profiles were collected onsite by means of a Seabird SBE 19 CTD. Water samples(2.5 l) were collected in Niskin bottles mounted on theCTD carousel for chl a analysis and to collect preyassemblages. We assessed water column profilesonboard to discern the depth at which to obtain waterwith intermediate temperature, salinity and fluores-cence. We then lowered the CTD rosette to the chosendepth and tripped the Niskin bottles to collect the nat-ural prey assemblage used in the incubations. Thewater was then siphoned via silicon tubing from theNiskin bottles directly into 500 ml polycarbonate incu-bation bottles to ensure the least amount of damage toprey cells. All incubation bottles were sealed andtransported to the lab (approx. 2 h) in a dark containerfilled with bay water to maintain ambient temperature.
Mesozooplankton predators were collected with aring net of 0.5 m diameter and 153 µm mesh by meansof multiple vertical tows and placed into a 20 l bucketfilled with surface bay water.
Chl a samples were filtered onto 47 mm GF/F filtersand stored at 4°C until extraction and analysis. Chloro-phyll retained on the filters was extracted at room tem-perature in 90% acetone in the dark for 24 h. Readingson a Turner 10AU fluorometer were taken before andafter acidification with 3 drops of 10% HCl.
Feeding experiments were conducted using theprotocol described by Gifford & Dagg (1988) and Roll-
wagen-Bollens & Penry (2003). The initial and finalcontrol bottles contained only the natural prey assem-blage, while the treatment bottles contained both theprey assemblage and mesozooplankton predators.Four replicate incubation bottles were used in allexperiments (i.e. 4 initial controls, 4 final controls and 4treatments).
Both the mesozooplankton and prey assemblageswere maintained at ambient temperatures while sort-ing for predators. After initially examining the meso-zooplankton assemblage, we selected 1 or 2 numeri-cally dominant taxa to be used as the predators for thefeeding experiments. These were always copepods,except in March 2004 when the cladoceran Daphniasp. was dominant (Table 1; see Rollwagen-Bollens &Penry 2003 for description of Acartia spp.). Adultfemales of each mesozooplankton taxon were identi-fied and sorted into 50 to 100 ml holding vessels filledwith 20 to 30 ml of filtered (35 µm) bay water. Predatorswere then transferred to the treatment incubation bot-tles. Predator density in the incubation bottles rangedfrom 10 to 50 ind. per 500 ml (Table 1). All incubationbottles were topped off with water containing the nat-ural prey assemblage, sealed with Parafilm and a lid(to eliminate air spaces and turbulence causing bub-bles), and placed on a plankton wheel rotating at1 rpm. Incubations were 12 h long, and began between17:30 and 22:30 h. Temperature (±1°C) and light condi-tions were set to mimic the ambient conditions at thesampling site. Initial control subsamples were pre-served at the beginning of the incubation period (asdescribed below) and final control and treatment sub-samples were preserved at the end of the 12 h incuba-tion period.
35
Taxon n
2004March Daphnia sp. 10
April Limnoithona tetraspina 40Acartia spp. 20
May Limnoithona tetraspina 40
September Oithona davisae 40
November Oithona davisae 40Acartia spp. 20
2005March Limnoithona tetraspina 40
April Limnoithona tetraspina 50Acartia spp. 20
May Limnoithona tetraspina 50
August Acartia spp. 20
Table 1. Mesozooplankton used during feeding experiments. No. of ind. (n) is per 500 ml incubation bottle

Mar Ecol Prog Ser 348: 33–46, 2007
Microplankton subsamples (200 ml) were pre-served in 5% acid Lugols solution and stored in thedark at room temperature until analyzed (usuallywithin 6 mo of collection). Aliquots of 10 ml wereallowed to settle overnight in Utermöhl chambers forenumeration. Cells in the chamber were identifiedand enumerated using an inverted compound micro-scope (Olympus CK-40). Each cell >15 µm was mea-sured for length and width using an ocular microme-ter. In the case of loricate ciliates, both the lorica andcell sizes were recorded. Due to the size distributionof the natural assemblage, we chose to use 15 µm asthe low end of the microplankton size range insteadof the more commonly used 20 µm (see Rollwagen-Bollens & Penry 2003 for justification). A minimumof 100 cells were enumerated per replicate. We as-signed microplankton cells to 1 of 6 categories:diatoms, loricate ciliates, aloricate ciliates, Myrio-necta rubra, flagellates and dinoflagellates. ThoughM. rubra (= Mesodinium rubrum) is an aloricate cili-ate, it was readily identifiable in our samples and isknown to ingest and maintain functional chloroplastswithin its body (Johnson & Stoecker 2005). Whileother aloricate ciliates present in our sample mayalso have been mixotrophic, the Lugols stain madeconfirmation of this impossible; thus, M. rubra wasassigned a separate category from all the other alori-cate ciliates.
Nanoplankton subsamples (100 ml) were preservedin cold 1% glutaraldehyde, and stored at 4°C until pro-cessed. Within 7 d of collection, duplicate 10 to 20 mlaliquots of each sample were stained for 10 min with100 µl of fluorescein isothiocyanate (FITC), filteredonto 25 mm diameter black polycarbonate filters(1.0 µm pore size), mounted on glass slides and kept inthe dark at 0°C until analyzed (Sherr et al. 1993).Stained cells were identified, counted and sized at400 × magnification with an epiflourescence micro-scope (blue light excitation). We assigned nanoplank-ton cells to 4 prey categories: diatoms, dinoflagellates,non-pigmented flagellates and pigmented flagellates.Skeletonema costatum was included in the nanodi-atom category. Although this diatom can form chains>15 µm in length, it was not feasible to count the highabundance of cells (1500 ml–1) during bloom periodswith the Utermöhl and inverted microscope methodused for the microplankton. Fifty randomly selectedfields of view were counted initially for each experi-ment to determine the between field variation. Wethen determined the number of fields of view requiredto achieve uniform variance (usually 30 to 35 fields).The remaining samples were enumerated by examin-ing the determined number of fields. This typicallyresulted in a minimum of 100 cells enumerated persample.
A group comparison t-test with equal variances wasused to determine whether there was a significantdifference between the number of cells in the finalcontrols and treatments. Levene’s test was used totest for equality of the variances. We applied the fol-lowing criteria before accepting any experiment asvalid: (1) a significant reduction (p < 0.05) occurred inat least 1 prey category or taxa, and (2) the signifi-cantly reduced group had 5 or more cells in the finalcontrol.
Micro- and nanoplankton biovolumes were calcu-lated by assigning geometric shapes to each taxon (asdescribed in Wong & Cloern 1982) and converted tocarbon biomass values using equations from Menden-Deuer & Lessard (2000). Clearance rates (ml pred.–1
h–1) and carbon ingestion rates (ng C pred.–1 h–1) werecalculated using equations from Marin et al. (1986).Pearson’s correlation coefficients were used to com-pare feeding rates to prey abundances and hydro-graphic variables.
RESULTS
Hydrography and chlorophyll
Water column temperature increased steadily from~10°C in spring (March) to ~22°C in fall (August orSeptember), and dropped during late fall (November)in both 2004 and 2005 (Fig. 2). Water column salinityalso steadily increased as the seasons progressedfrom the wet spring through the drier late summerand fall period (from 0.2 to 15.6 in 2004 and 4.3 to7.3 in 2005). In general the profiles of temperatureand salinity were relatively uniform with depth,except during April and May 2005 when the watercolumn was more stratified with respect to salinity(Fig. 2)
Since the invasion of Corbula amurensis, high chl alevels have not been observed in the North SFE.However, a clear pattern in chl a abundance can stillbe seen (Cloern 1991; see http://sfbay.wr.usgs.gov/access/wqdata). In winter, chl a levels are low,whereas in spring, peaks in chl a abundance canoften be seen (Fig. 3). Later in the year, chl a levelsdrop, although occasionally levels increase in latefall. In our experiments, the natural prey assemblageswere most often collected near mid-depth (Fig. 2), sowe used the mid-depth chl a as the best proxy forexperimental chl a conditions. Mid-depth chl a levelswere higher in 2005 (0.9 to 3.7 µg chl a l–1) than in2004 (0.7 to 2.7 µg chl a l–1); moreover, the highestchl a values were seen in April of both years (Fig. 2).In addition, we also sampled near the end of a rela-tively high autumn peak in September 2004.
36

Gifford et al.: Mesozooplankton omnivory in San Francisco Estuary
Available prey abundance and composition
Nanoplankton (2 to 15 µm) were very abundant andcontributed a substantial amount of carbon biomass(Fig. 4A,B). Small (2 µm) nonpigmented nanoflagel-lates were highly abundant throughout the year,whereas pigmented flagellates contributed more tothe available carbon biomass. Nanodiatoms were
most abundant in April of both years. Skeletonemacostatum represented 80 to 99% of nanodiatom abun-dance during these peak periods.
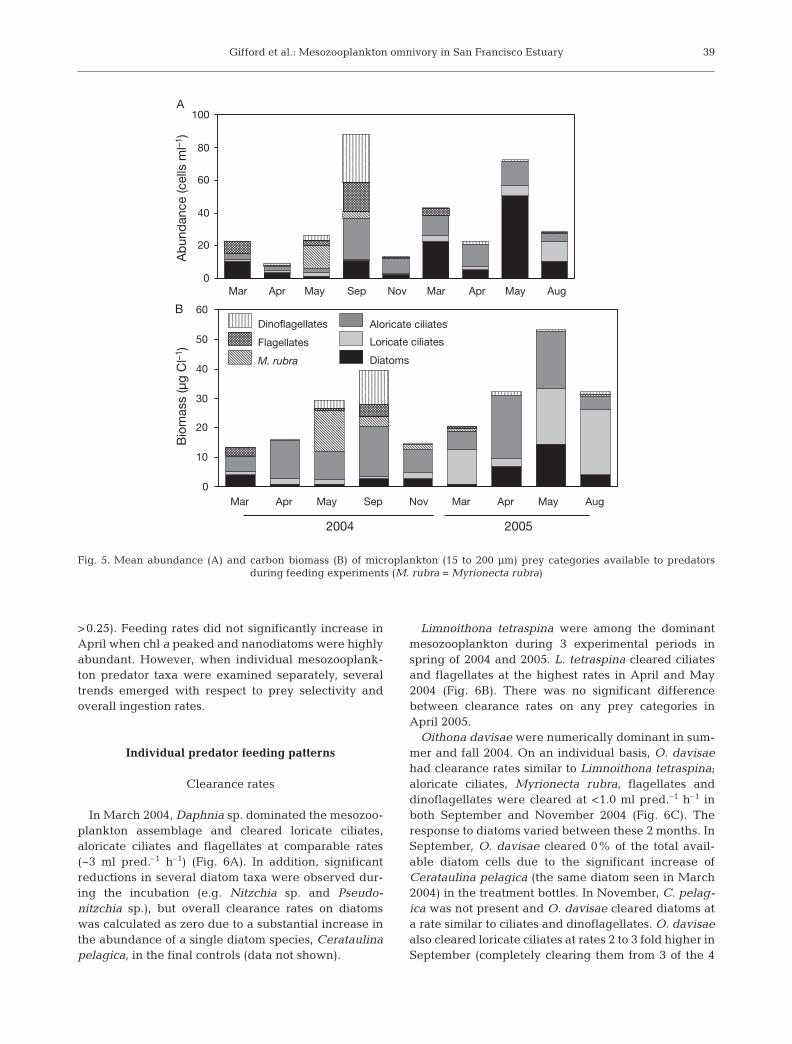
Microplankton (15 to 200 µm) abundances were 1 to2 orders of magnitude lower than nanoplankton(Fig. 5A). Heterotrophic and mixotrophic protists(including Myrionecta rubra) made up an average of73% of the total microplankton abundance; however,
in March and April 2004 and Marchand May 2005, diatoms were propor-tionally the most abundant (Fig. 5A).In May 2004, M. rubra reachedabundances of 14 cells ml–1. All micro-plankton categories, including cili-ates, diatoms, and especially flagel-lates and dinoflagellates, increased inabundance in September 2004. InNovember 2004 and April 2005,diatoms and aloricate ciliates com-prised 85% of the total abundance. InAugust 2005, aloricate ciliate abun-dances were relatively reduced, andloricate ciliates became relativelyabundant (Fig. 5A).
Heterotrophic and mixotrophic pro-tist biomass accounted for an average
37
0 1 2 3 4
16
12
8
4
00 1 2 3 4 0 1 2 3 4 0 1 2 3 4
8 12 16 20 24
0 4 8 12 16
0 1 2 3 4
8 12 16 20 24
16
12
8
4
0
0 4 8 12 16
8 12 16 20 24
0 4 8 12 16
8 12 16 20 24
0 4 8 12 16
8 12 16 20 24
0 4 8 12 16Salinity
Salinity
Salinity Salinity Salinity
MAR APR MAY SEP NOV
MAR APR MAY AUG
2004
2005
Temperature (°C) Temperature (°C) Temperature (°C) Temperature (°C)
Temperature (°C)
Chlorophyll a (µg–1)
Dep
th (m
)D
epth
(m)
Fig. 2. Water columnprofiles of temperature(dashed line), salinity(solid line) and chl a(diamond symbols) atUS Geological SurveyStn 7 at the time of eachsample collection. Hori-zontal line is the depthof prey assemblage
collection
Fig. 3. Calculated chl a data from 2 m at Stn 7 collected by US Geological Survey from May 2002 through November 2006 (see http://sfbay.wr.usgs.
gov/access/wqdata). (d) dates of feeding experiments in the current study

Mar Ecol Prog Ser 348: 33–46, 2007
of 87% of the total microplankton carbon biomass(Fig. 5B). Aloricate ciliates often made the greatestcontribution to this biomass, ranging from 45 to 75% ofall nonautotrophic biomass. Diatoms made relativelysmall contributions (2 to 28%) to the total carbon avail-able. Flagellates and dinoflagellates made few signifi-cant contributions to microplankton biomass, with thenotable exception of September 2004 when dinoflagel-lates (primarily Gymnodinium sp. and Alexandriumsp.) made up 43% of the total carbon available. Lori-cate ciliate biomass was often less than 10% of thetotal microplankton biomass, with the exception ofAugust 2005 when loricate ciliates (primarily Tintin-nopsis sp.) comprised 63% of the total microplanktonbiomass.
Mesozooplankton feeding
Despite nanoplankton dominance in terms of bothabundance and biomass, there was little indicationthat mesozooplankton consumed nanoplankton prey.Nanoplankton prey categories were significantly (p <0.05) reduced between the treatment and the final con-
trol in only 1 feeding experiment (November 2004,nanodiatoms). Feeding was more clearly detected onthe microplankton, which had a total of 17 instances ofsignificant (p < 0.05) reduction in prey categories. Allfeeding rates discussed subsequently refer to micro-plankton unless otherwise stated.
No significant microplankton reductions occurredin the March and May 2005 experiments. Theseexperiments, therefore, did not meet our criteria for avalid experiment and they were not considered fur-ther. In August 2005, no major category was sig-nificantly reduced. However, we did have 2 individ-ual tintinnid taxa that were significantly reduced.One of those taxa had an average of >5 cells inthe final control. Thus, by the criteria laid out in themethods, we included this experiment in our ana-lyses.
Feeding rates were consistent throughout the 2 yrsampling period. Despite substantial seasonal variabil-ity in total (2 to 200 µm) prey abundance and biomass,there was little variability in mesozooplankton feeding.In general, mesozooplankton feeding rates did not cor-relate with changes in prey abundance and biomass oneither a seasonal or interannual basis (all p values
38
0
2000
4000
6000
8000
10 000
12 000
Mar Apr May Sep Nov Mar Apr May Aug
Mar Apr May Sep Nov Mar Apr May Aug
0
100
200
300
400
500
600
2004 2005
Bio
mas
s (µ
g C
l–1)
Diatoms
Pigmented Flagellates
Non-Pigmented Flagellates
Dinoflagellates
A
B
Ab
und
ance
(cel
ls m
l–1)
Fig. 4. Mean abundance (A) and carbon biomass (B) of nanoplankton (2 to 15 µm) prey categories available to predators during feeding experiments
Gifford et al.: Mesozooplankton omnivory in San Francisco Estuary
>0.25). Feeding rates did not significantly increase inApril when chl a peaked and nanodiatoms were highlyabundant. However, when individual mesozooplank-ton predator taxa were examined separately, severaltrends emerged with respect to prey selectivity andoverall ingestion rates.
Individual predator feeding patterns
Clearance rates
In March 2004, Daphnia sp. dominated the mesozoo-plankton assemblage and cleared loricate ciliates,aloricate ciliates and flagellates at comparable rates(~3 ml pred.–1 h–1) (Fig. 6A). In addition, significantreductions in several diatom taxa were observed dur-ing the incubation (e.g. Nitzchia sp. and Pseudo-nitzchia sp.), but overall clearance rates on diatomswas calculated as zero due to a substantial increase inthe abundance of a single diatom species, Cerataulinapelagica, in the final controls (data not shown).
Limnoithona tetraspina were among the dominantmesozooplankton during 3 experimental periods inspring of 2004 and 2005. L. tetraspina cleared ciliatesand flagellates at the highest rates in April and May2004 (Fig. 6B). There was no significant differencebetween clearance rates on any prey categories inApril 2005.
Oithona davisae were numerically dominant in sum-mer and fall 2004. On an individual basis, O. davisaehad clearance rates similar to Limnoithona tetraspina;aloricate ciliates, Myrionecta rubra, flagellates anddinoflagellates were cleared at <1.0 ml pred.–1 h–1 inboth September and November 2004 (Fig. 6C). Theresponse to diatoms varied between these 2 months. InSeptember, O. davisae cleared 0% of the total avail-able diatom cells due to the significant increase ofCerataulina pelagica (the same diatom seen in March2004) in the treatment bottles. In November, C. pelag-ica was not present and O. davisae cleared diatoms ata rate similar to ciliates and dinoflagellates. O. davisaealso cleared loricate ciliates at rates 2 to 3 fold higher inSeptember (completely clearing them from 3 of the 4
39
0
20
40
60
80
100
0
10
20
30
40
50
60
Mar Apr May Sep Nov Mar Apr May Aug
Mar Apr May Sep Nov Mar Apr May Aug
2004 2005
B
A
Diatoms
Loricate ciliates
Aloricate ciliates
M. rubra
Flagellates
Dinoflagellates
Bio
mas
s (µ
g C
l–1)
Ab
und
ance
(cel
ls m
l–1)
Fig. 5. Mean abundance (A) and carbon biomass (B) of microplankton (15 to 200 µm) prey categories available to predators during feeding experiments (M. rubra = Myrionecta rubra)

Mar Ecol Prog Ser 348: 33–46, 2007
treatment bottles) compared with their clearance inNovember; O. davisae cleared loricate ciliates inNovember at rates similar to all other prey categories.
Acartia spp. were observed in 4 of the 9 samplingperiods, particularly in April and November 2004 andApril and August 2005. In each of these experimentsAcartia spp. consistently cleared ciliates at rates higherthan all other prey categories, although the categoryof ciliate preferred varied between experiments(Fig. 6D). Aloricate ciliates were cleared at the highestrates in April 2004, loricate ciliates and Myrionectarubra were cleared at the highest rates in November
2004, and loricate ciliates were cleared at the highestrates in April 2005. In 3 out of the 4 experiments Acar-tia spp. also significantly cleared diatoms, although atmore moderate rates (~1.0 ml pred.–1 h–1) (Fig. 6D).
Ingestion rates
Daphnia sp. ingested aloricate ciliate carbon at 3times the rate of all other prey categories (Fig. 7A).While Cerataulina pelagica comprised 42% of thediatom abundance, it only made up 11% of diatom car-
40
0
1
2
3
4
0
1
2
3
4
0
1
2
3
4
Cle
aran
ce r
ate
(ml p
red
.–1 h
–1)
2004 2005
0
1
2
3
4
Mar Apr May Sep Nov Apr Aug
Daphnia sp.
A
B Limnoithona tetraspina
C Oithona davisae
D Acartia spp.
Diatoms
Loricate ciliates
Aloricate ciliates
M. rubra
Flagellates
Dinoflagellates
Fig. 6. Mean (± SE) mesozooplankton clearance rates on microplankton (15 to 200 µm). (A) Daphnia sp., (B) Limnoithona tetra-spina, (C) Oithona davisae, (D) Acartia spp. (M. rubra = Myrionecta rubra). SE could not be calculated for loricate ciliates in (C)

Gifford et al.: Mesozooplankton omnivory in San Francisco Estuary
bon biomass. Thus, Daphnia sp. overall diatom inges-tion rate was 5.6 ng C pred.–1 h–1, which was similar toDaphnia sp. ingestion of loricate ciliates and flagel-lates. Limnoithona tetraspina ingested ciliate biomassat significantly higher rates than any other prey cate-gory (Fig 7B). In April of both years, aloricate ciliateswere ingested at the highest rates. In May 2004, Myri-onecta rubra biomass was highly abundant and L.tetrapsina ingested them at higher rates than aloricateciliates. Oithona davisae also ingested aloricate ciliatebiomass at the highest rates in both months it was pre-sent, although the rate in September 2004 was 3 timeshigher than in November 2004 (Fig. 7C). Acartia spp.ingested diatom carbon to a much lower degree thanaloricate and loricate ciliates (Fig. 7D). Loricate ciliatebiomass in particular was ingested at especially highrates (29 ng C pred.–1 h–1) in August 2005.
DISCUSSION
The goal of this study was to examine the food pref-erences and feeding rates of mesozooplankton in theupper SFE. Throughout the 2 yr period the prey as-semblage varied, but mesozooplankton consistentlyingested heterotrophic protists, particularly ciliates.Our results are consistent with other studies thatdemonstrate microzooplankton are an integral compo-nent of the mesozooplankton diet.
Seasonal variability
Based on results of copepod feeding experiments inother parts of the SFE, as well as in other North Amer-ican estuaries, we expected to observe a temporal sig-nal in mesozooplankton feeding rates. For instance, insouth San Francisco Bay, Rollwagen-Bollens & Penry(2003) found that during periods of elevated chl a themajority of carbon ingested by Acartia spp. came fromSkeletonema costatum, the same diatom we observedin high abundances in April 2004 and 2005. Gifford &Dagg (1988) also found that Acartia spp. in a GulfCoast estuary would ingest chl a at higher rates thanciliates during periods of high phytoplankton standingstocks. Furthermore, Fessenden & Cowles (1994)found that both clearance and ingestion rates on cili-ates became reduced during times of increased phyto-plankton biomass. In contrast, we did not observe asignificant increase in ingestion rates on phytoplank-ton (or a decrease in ingestion rates on microzooplank-ton) during periods of elevated chl a.
However, the absence of a seasonal pattern inmesozooplankton feeding rates in our study is notsurprising considering we saw few seasonal trends in
microplankton (>15 µm) prey availability despite asubstantial bloom in nanoplankton (especially Skele-tonema costatum) biomass in April of both years.Since mesozooplankton consumed only microplank-ton and never significantly reduced nanoplanktonabundance in any experiment, and microplankton ab-undance showed little temporal variability throughoutthe experimental period, one would expect little sea-sonal or interannual variability in mesozooplanktonfeeding.
Taxa-specific mesozooplankton clearance rates
Our clearance rates suggest that different mesozoo-plankton predators exhibited preferences for differentprey types. Daphnia sp. cleared all prey categoriesexcept diatoms at relatively high rates, suggesting pri-marily carnivorous feeding. However, Daphnia spp.are widely considered to be nonselective omnivoresfeeding on particles <40 µm in size (Mueller-Solger etal. 2002). They feed on a variety of prey types, in-cluding aloricate ciliates, flagellates, bacteria, detritusand diatoms. Upstream of Suisun Bay, in theSacramento–San Joaquin delta, Daphnia sp. growthhas been correlated to chl a (Mueller-Solger et al.2002) and phytoplankton have been suggested as theprimary component of its diet (Sobczak et al. 2002).Thus, it is likely that the lack of grazing by Daphnia sp.on diatoms in the March 2004 experiment was ananomaly. Indeed, diatoms were cleared by Daphnia sp.in this study, but the significant growth of Cerataulinapelagica in the treatment bottles obscured the feedingsignal on other diatoms. When C. pelagica wasremoved from the diatom category, we calculated aclearance rate of 1.1 ml pred.–1 h–1. In addition, wehave observed Daphnia sp. from Suisun Bay to clearSkeletonema costatum at 1.7 ml pred.–1 h–1 in March2004 (S. M. Gifford unpubl. data), further supportingthe idea that it has an omnivorous diet. These diatomclearance rates, however, were only half the rates atwhich Daphnia sp. cleared microzooplankton, sug-gesting that although Daphnia sp. most probably dofeed on diatoms, they may have a preference forheterotrophic protists in Suisun Bay.
Oithona davisae clearance rates indicate that itexhibited different prey preferences in September andNovember 2004. In September, O. davisae cleared cili-ates at high rates while diatom abundances increasedin the treatment bottles. While the increase in diatomabundances was similar to the Daphnia experiment inMarch 2004, the main difference was that when Cer-ataulina pelagica was removed from the diatom cate-gory, clearance and ingestion rates did not become sig-nificantly greater than zero, indicating that O. davisae
41

Mar Ecol Prog Ser 348: 33–46, 2007
avoided all diatoms during September. These resultssupport the idea that members of the Oithonidae,including both O. davisae and Limnoithona tetraspina,are primarily carnivorous, feeding raptorially on motileprey (Turner 2004). Though this family is highly abun-dant throughout the world, relatively few studies haveexamined its feeding ecology, especially for O.davisae. Its congener, O. similis has received moreattention. In Buzzards Bay, Massachusetts, O. similispreferred ciliates and dinoflagellates, with clearancerates similar to our observations for O. davisae (<1.0 ml
pred.–1 h–1) (Nakamura & Turner 1997). Furthermore,ciliates have been found to contribute 91% of the car-bon ration in O. similis diet in high latitude waters(Lonsdale et al. 2000).
Atkinson (1996), however, found that during onemidsummer period, phytoplankton contributed 34% tothe carbon diet of Oithona similis. Also, Islam et al.(2005) conducted gut pigment analysis of O. davisae ina Japanese estuary, and found that the diet was basedmostly on chl a. These 2 findings support our Novem-ber 2004 results in which O. davisae cleared all avail-
42
0
5
10
15
2029 ± 8 .5
Inge
stio
n ra
te (n
g C
pre
d.–1
h–1
)
0
5
10
15
20
0
5
10
15
20
0
5
10
15
20
Diatoms
Loricate ciliates
Aloricate ciliates
M. rubra
Flagellates
Dinoflagellates
Daphnia sp.
Limnoithona tetraspina
Oithona davisae
Acartia spp.
A
B
C
D
2004 2005
Mar Apr May Sep Nov Apr Aug
Fig. 7. Mean (± SE) mesozooplankton ingestion rates on microplankton (15 to 200 µm). (A) Daphnia sp., (B) Limnoithonatetraspina, (C) Oithona davisae, (D) Acartia spp. (M. rubra = Myrionecta rubra)

Gifford et al.: Mesozooplankton omnivory in San Francisco Estuary
able prey categories including diatoms at significantlysimilar rates. Our results suggest that in September,during maximum heterotrophic protist abundance, O.davisae preferentially fed on ciliates, and in Novem-ber, when heterotrophic protist availability becamereduced, O. davisae supplemented its diet with dia-toms.
The feeding behavior of Limnoithona tetraspina sug-gests a mainly carnivorous diet, particularly becausewe observed no significant grazing impact on diatoms.Furthermore, clearance rates for April and May 2004indicate that L. tetrapsina highly preferred aloricateciliates and flagellates. Bouley & Kimmerer (2006) alsoconducted feeding experiments with L. tetraspina inthe upper SFE. Both their study and ours found L.tetraspina clearance rates to be low (<1.0 ml pred.–1
h–1) and that it fed almost exclusively on heterotrophicand mixotrophic ciliates with no significant reductionof diatoms or loricate ciliates.
Acartia spp. were the most omnivorous of all preda-tors, clearing both diatoms and ciliates. Our results areconsistent with other experiments showing that Acar-tia spp. will feed on loricate ciliates, aloricate ciliates,Myrionecta rubra, dinoflagellates and diatoms. WhileAcartia spp. will readily ingest both microzooplanktonand phytoplankton, they prefer ciliates (Gifford &Dagg 1988, Rollwagen-Bollens & Penery 2003). AllAcartia spp. experiments in our study resulted in atleast one ciliate category cleared at a higher rate thandiatoms or dinoflagellates.
Direct comparisons between these predators must bedone with caution since they vary in body size andmass. Limnoithona tetraspina and Oithona davisae arerelatively small compared with Acartia spp. and Daph-nia sp. Though we did not weigh our predators, we dohave weight data on related species of Acartia andOithona from San Francisco Bay (Hutchinson 1982).These data allowed us to make at least one weight spe-cific comparison of feeding rates between relativelylarge (Acartia) and small (Oithona) copepod taxa inNovember 2004. These results demonstrate that thereis no change in relative prey preference of eitherpredator when calculated on a weight specific basis(Fig. 8). However, the weight specific feeding rates forO. davisae are equal or higher than for Acartia spp.Thus, on a per unit weight basis, small abundant cope-pods such as L. tetraspina and O. davisae may have agreater feeding impact than the more thoroughly stud-ied large copepod predators. More studies usingweight specific feeding rates are needed to understandthe ecological importance of these small copepods(Turner 2004).
A potential source of error for bottle incubationexperiments is the increase of phytoplankton popula-tions when grazing pressure by microzooplankton is
reduced due to mesozooplankton grazing on microzoo-plankton (Nejstgaard et al. 2001). If this occurs, it willappear as if phytoplankton were not consumed bymesozooplanton and significant negative feeding ratesmay be observed. We probably observed such a phe-nomenon in March and September 2004. However, webelieve the effect was limited to one particular taxa,Cerataulina pelagica, and in the case of the experi-ments conducted in September 2004 proved insubstan-tial. Dilution assays, in which microzooplankton graz-ing rates are quantified, are one way of examiningwhat impact micrzoooplankton have on the phyto-plankton community. We ran concurrent dilutionassays with our bottle incubation experiments, theresults of which will be discussed in another manu-script.
Importance of microzooplankton biomass tomesozooplankton diet
Though a great deal of variation was observedbetween predators in terms of clearance rates and preyselectivity, mesozooplankton always ingested ciliatebiomass at the highest rates. The ciliate ingestion rates(3 to 29 ng C pred.–1 h–1) we observed are comparablewith other studies in estuaries (Ohman & Runge 1994,Nakamura & Turner 1997, reviewed in Calbet & Saiz2005) For example, Rollwagen-Bollens & Penry (2003)observed Acartia spp. to ingest ciliates at 1.0 to 1.6 ngC pred.–1 h–1 in north San Francisco Bay (San PabloBay) and at 0.02 to 20.0 ng C pred.–1 h–1 in southSan Francisco Bay. In Buzzards Bay, Massachusetts,Oithona similis ingested ciliates at a rate of 2.4 to4.1 ng C pred.–1 h–1 (Nakamura & Turner 1997). Similarciliate ingestion rates by copepods have been observedin both laboratory and field experiments (Verity & Paf-fenhofer 1996, Levinsen et al. 2000, Castellani et al.2005). In addition, several studies have found that cili-ates comprise >50% of the carbon diet of mesozoo-plankton (Fessenden & Cowles 1994, Lonsdale et al.2000, Rollwagen-Bollens & Penry 2003), and that cili-ate carbon alone could meet daily respiration require-ments (Fessenden & Cowles 1994).
It is reasonable that ciliates could contribute such alarge portion of carbon to the mesozooplankton diet inan area with low phytoplankton standing stocks, par-ticularly since on average, ciliates are more carbon richthan diatoms of comparable volume (Menden-Deuer &Lessard 2000), and have been reported to have asmuch as 4 times the carbon density of diatoms in thefield (Ohman & Runge 1994). Furthermore, whendiatom biomass was high in our experiments, thediatom community was dominated by cells < 5 µm insize (Skeletonema costatum). Ciliates are able to ingest
43

Mar Ecol Prog Ser 348: 33–46, 2007
these small cells, potentially concentrating the largebut dispersed phytoplankton biomass in particle sizesthat can be consumed by mesozooplankton.
In addition to creating large carbon rich ‘food pack-ets,’ microzooplankton may serve to trophically com-plement phytoplankton biomass. When mesozoo-plankton are fed low quality algae they are unable togrow well unless heterotrophic protists are a trophicintermediate (Klein Breteler et al. 1999). Tang & Taal(2005), for example, found that Acartia sp. feeding onheterotrophic protists (Oxyrrhis marina) had higheregg production rates and hatching success than whenfeeding directly on the algae Dunaliella tertiolecta.The protists were found to produce an essential fattyacid missing in D. tertiolecta, suggesting they werecomplementing the algal biomass and making the dietmore nutritious for Acartia. However, when high qual-ity algae (Isochrysis galbana, Rhodomonas salina)were used instead of the low quality D. tertiolecta, eggproduction in Acartia was actually reduced when pro-tists were used as an intermediate.
It has been hypothesized that during times of highphytoplankton abundances, mesozooplankton activelyselect for microzooplankton due to their higher nutrientcomposition. Tang & Taal’s (2005) findings, however,suggest that this shift to microzooplankton prey may not
always be the most nutritious choice for mesozooplank-ton. The importance of microzooplankton in the diet de-pends on both phytoplankton quality and quantity.When phytoplankton are of high quality and abundance,the best feeding strategy may be to feed directly onphytoplankton. However, if phytoplankton are in highabundance, but of low quality, mesozooplankton mayderive a majority of their carbon requirements fromphytoplankton, but also need to supplement their dietwith microzooplankton containing essential nutrients.The upper SFE represents a third scenario. Phytoplank-ton in this region may be of high quality (Cloern & Duf-ford 2005), but are often in low abundance. Annual pri-mary production in the SFE is <40 g C m–2 yr–1 (Alpine &Cloern 1992) and chl a levels in the upper SFE are often<10 µg l–1 (see http://sfbay.wr.usgs.gov/access/wqdata).Furthermore, both Acartia spp. and Daphnia sp. in theupper SFE are food-limited due to low primary produc-tion as suggested by Mueller-Solger et al. (2002) andKimmerer et al. (2005), and phytoplankton resourcesmay be too low to sustain maximal growth and reproduc-tion.
This low phytoplankton production and standingstock environment limits the contribution phytoplank-ton carbon can make to the mesozooplankton diet andmay increase the importance of microzooplankton as afood source. This may be the reason we observedmicrozooplankton carbon to be ingested at such rela-tively high rates. In areas where primary production islow, microzooplankton are more likely to make greatercontributions to the mesozooplankton diet (Calbet &Saiz 2005).
On the other hand, in estuaries with high phyto-plankton production mesozooplankton may ingestphytoplankton biomass at higher rates than ciliates(Gifford & Dagg 1988). South San Francisco Bay, forexample, experiences water column stratification (Clo-ern 1991), which isolates phytoplankton from the ben-thic grazer Corbula amurensis. Due to this isolationphytoplankton blooms are still seen in south SanFrancisco Bay, even though C. amurensis is present(Rollwagen-Bollens & Penry 2003; see also sfbay.wr.usgs.gov/access/wqdata). Autotrophic plankton inthis region contributed 50% of Acartia spp. diet(Rollwagen-Bollens & Penry 2003). In north San Fran-cisco Bay (adjacent to Suisun Bay, Fig. 1) the watercolumn is well mixed and C. amurensis is believed tosuppress any phytoplankton blooms. Heterotrophic cil-iates in this region made up the majority of biomassingested by Acartia spp. (Rollwagen-Bollens & Penry2003), results similar to this study. Ohman & Runge(1994) compared Calanus finmarchicus ingestion ratesand egg production in the St. Lawrence estuary andthe Gulf of St. Lawrence (open water) and found thatthe importance of diatoms and ciliates to the copepod
44
0
2
4
6
8
0.0
0.4
0.8
1.2
1.6
2.0
2.4
Diatoms Loricate Aloricate M. rubra Flagellates Dinofla-gel lates
(A)
(B)
Cle
aran
ce r
ate
(ml µ
g C
pre
d.–1
h–1
)In
gest
ion
rate
(ng
C p
rey
µg C
pre
d.–1
h–1
)
Oithona davisae
Acartia spp.
Fig. 8. Mean (± SE) weight-specific (A) clearance and(B) ingestion rates on microplankton (15 to 200 µm) for Acar-tia spp. and Oithona davisae in November 2004 (M. rubra =
Myrionecta rubra)

Gifford et al.: Mesozooplankton omnivory in San Francisco Estuary
diet was inversely proportional to the concentration ofchl a. In the chlorophyll rich waters of the estuary C.finmarchicus ingested diatoms at much higher ratesthan ciliates. However, in the waters of the Gulfcontaining relatively low chlorophyll, ciliates wereingested at 4 times the rate of diatoms. Interestingly,there was no significant difference in egg productionby C. finmarchicus between the Gulf and the estuary,suggesting that C. finmarchicus was able to grow andreproduce well on either diatom or ciliate diets.
In summary, this study is the first to simultaneouslyexamine multiple mesozooplankton predators in theSFE over a multiyear period. In doing so, we foundmicrozooplankton may be especially important in theupper SFE, possibly due to relatively low amounts ofphytoplankton. Ciliates in particular were consis-tently consumed at significant rates by all 4 preda-tors. However, important species-specific differencesexist. Our results support the growing body of evi-dence that microzooplankton are an important com-ponent of estuarine systems and that multiple linksbetween phytoplankton, microzooplankton and meso-zooplankton are needed to account for the manypathways that energy and materials may take tohigher trophic levels.
Acknowledgements. Special thanks go to A. Slaughter, whoprovided invaluable help in the laboratory and thoughtfulcomments on the manuscript. Thank you to S. Cohen, S.Avent, D. Gewant, T. Ignoffo, P. Bouley and D. Marcal fortheir help and comments. We also thank D. Bell and D. Mor-gan of the RV ‘Questuary’ and everyone at the RombergTiburon Center. Funding for this study was provided byCALFED Bay-Delta Authority/California Sea Grant award no.R/SF-5 to G.R.-B. and S.M.B.
LITERATURE CITED
Alpine AE, Cloern JE (1988) Phytoplankton growth rates in alight-limited environment, San Francisco Bay. Mar EcolProg Ser 44:167–173
Alpine AE, Cloern JE (1992) Trophic interactions and directphysical effects control phytoplankton biomass and pro-duction in an estuary. Limnol Oceanogr 37:946–955
Ambler JW, Cloern JE, Hutchinson A (1985) Seasonal cyclesof zooplankton from San Francisco Bay. Hydrobiologia129:177–197
Atkinson A (1996) Subantarctic copepods in an oceanic, lowchlorophyll environment: ciliate predation, food selectivityand impact on prey populations. Mar Ecol Prog Ser 130:85–96
Bollens SM, Cordell JR, Avent S, Hooff R (2002) Zooplanktoninvasions: a brief review, plus two case studies from thenortheast Pacific Ocean. Hydrobiologia 480:87–110
Bouley P, Kimmerer W (2006) Ecology of a highly abundant,introduced cyclopoid copepod in a temperate estuary. MarEcol Prog Ser 324:219–228
Buskey EJ (1993) Annual pattern of microzooplankton andmesozooplankton abundance and biomass in a subtropicalestuary. J Plankton Res 15:907–924
Calbet A, Landry MR (2004) Phytoplankton growth, micro-zooplankton grazing, and carbon cycling in marine sys-tems. Limnol Oceanogr 49:51–57
Calbet A, Saiz E (2005) The ciliate–copepod link in marineecosystems. Aquat Microb Ecol 38:157–167
Castellani C, Irigoien X, Harris RP, Lampitt RS (2005) Feedingand egg production of Oithona similis in the NorthAtlantic. Mar Ecol Prog Ser 288:173–182
Cloern JE (1991) Tidal stirring and phytoplankton bloomdynamics in an estuary. J Mar Res 49:203–221
Cloern JE, Dufford R (2005) Phytoplankton community ecol-ogy: principles applied in San Francisco Bay. Mar EcolProg Ser 285:11–28
Conomos TJ, Smith RE, Gartner JW (1985) Environmentalsetting of San Francisco Bay. Hydrobiologia 129:1–12
Cowlishaw RJ (2004) Seasonal coupling between ciliate andphytoplankton standing stocks in the South Slough ofCoos Bay, Oregon. Estuaries 27:539–550
David V, Sautour B, Chardy P, Leconte M (2005) Long-termchanges of the zooplankton variability in a turbid environ-ment: the Gironde estuary (France). Estuar Coast Shelf Sci64:171–184
Fessenden L, Cowles TJ (1994) Copepod predation on phago-trophic ciliates in Oregon coastal waters. Mar Ecol ProgSer 107:103–111
Gifford DJ, Dagg MJ (1988) Feeding of the estuarine copepodAcartia tonsa Dana: carnivory vs. herbivory in naturalmicroplankton assemblages. Bull Mar Sci 43:458–468
Hooff RC, Bollens SM (2004) Functional response and poten-tial predatory impact of Tortanus dextilobatus, a carnivo-rous copepod recently introduced to the San FranciscoEstuary. Mar Ecol Prog Ser 277:167–179
Hutchinson A (1982) Plankton studies in San Francisco Bay.VI. Zooplankton species composition and abundance inthe North Bay, 1979–1980. US Geol Surv Open File Rep82–1003, September
Iriarte A, Madariaga I, Revilla M, Sarobe A (2003) Short-termvariability in microbial food web dynamics in a shallowtidal estuary. Aquat Microb Ecol 31:145–161
Irigoien X, Castel J (1995) Feeding rates and productivity ofthe copepod Acartia bifilosa in a highly turbid estuary–theGironde (SW France). Hydrobiologia 311:115–125
Islam MS, Ueda H, Tanaka M (2005) Spatial distribution andtrophic ecology of dominant copepods associated with tur-bidity maximum along the salinity gradient in a highlyembayed estuarine system in Ariake Sea, Japan. J ExpMar Biol Ecol 316:101–115
Johnson MD, Stoecker DK (2005) Role of feeding in thegrowth and photophysiology of Myrionecta rubra. AquatMicrob Ecol 39:303–312
Kimmerer W, Orsi JJ (1996) Changes in the zooplankton ofthe San Francisco Bay estuary since the introduction of theclam Potamocrobula amurensis. In: Hollibaugh JT (ed)San Francisco Bay: the ecosystem. Pac Div Am Assoc AdvSci, San Francisco, CA
Kimmerer W, Ferm N, Nicolini MH, Penalva C (2005) Chronicfood limitation of egg production in populations of cope-pods of the genus Acartia in the San Francisco Estuary.Estuaries 28:541–550
Klein Breteler W, Schogt N, Baas M, Schouten S, Kraay GW(1999) Trophic upgrading of food quality by protozoansenhancing copepod growth: role of essential lipids. MarBiol 135:191–198
Leakey RJG, Burkill PH, Sleigh MA (1994) Ciliate growthrates from Plymouth Sound: comparison of direct and indi-rect estimates. J Mar Biol Assoc UK 74:849–861
Levinsen H, Turner JT, Nielsen TG, Hansen BW (2000) On the
45

Mar Ecol Prog Ser 348: 33–46, 2007
trophic coupling between protists and copepods in arcticmarine ecosystems. Mar Ecol Prog Ser 204:65–77
Lionard M, Azemar F, Bouletreau S, Muylaert K, Tackx M,Vyverman W (2005) Grazing by meso- and microzoo-plankton on phytoplankton in the upper reaches of theSchelde estuary (Belgium/The Netherlands). Estuar CoastShelf Sci 64:764–774
Lonsdale DJ, Caron DA, Dennett MR, Schaffner R (2000) Pre-dation by Oithona spp. on protozooplankton in the RossSea, Antarctica. Deep-Sea Res II 47:3273–3283
Marin V, Huntley ME, Frost B (1986) Measuring feeding ratesof pelagic herbivores: analysis of experimental design andmethods. Mar Biol 93:49–58
Menden-Deuer S, Lessard EJ (2000) Carbon to volume rela-tionships for dinoflagellates, diatoms, and other protistplankton. Limnol Oceanogr 45:569–579
Mueller-Solger AB, Jassby AD, Mueller-Navarra DC (2002)Nutritional quality of food resources for zooplankton(Daphnia) in a tidal freshwater system (Sacramento–SanJoaquin River Delta). Limnol Oceanogr 47:1468–1476
Nakamura Y, Turner JT (1997) Predation and respiration bythe small cyclopoid copepod Oithona similis: How impor-tant is feeding on ciliates and heterotrophic flagellates?J Plankton Res 19:1275–1288
Nejstegaard JC, Naustvoll LJ, Sazhin A (2001) Correcting forunderestimation of microzooplankton grazing in bottleincubation experiments with mesozooplankton. Mar EcolProg Ser 221:59–75
Ohman MD, Runge JA (1994) Sustained fecundity whenphytoplankton resources are in short supply—omnivoryby Calanus finmarchicus in the Gulf of St. Lawrence. Lim-nol Oceanogr 39:21–36
Pierce RW, Turner JT (1992) Ecology of planktonic ciliates inmarine food webs. Rev Aquat Sci 6:139–181
Rollwagen-Bollens GC, Penry DL (2003) Feeding dynamics ofAcartia spp. copepods in a large, temperate estuary (SanFrancisco Bay, CA). Mar Ecol Prog Ser 257:139–158
Rollwagen-Bollens GC, Penry DL (2006) Vertical distributionof micro- and nanoplankton in the San Francisco Estuaryin relation to hydrography and predators. Aquat MicrobEcol 44:143–163
Ruiz A, Franco J, Villate F (1998) Microzooplankton grazingin the estuary of Mundaka, Spain, and its impact on phyto-plankton distribution along the salinity gradient. AquatMicrob Ecol 14:281–288
Sherr EB, Caron DA, Sherr BF (1993) Staining of hetero-trophic protists for visualization via epifluorescencemicroscopy. In: Kemp PF, Sherr EB, Sherr BF, Cole JJ (eds)Handbook of methods in aquatic microbial ecology. LewisPublishers, Boca Raton, FL
Sobczak WV, Cloern JE, Jassby AD, Mueller-Solger AB(2002) Bioavailability of organic matter in a highly dis-turbed estuary: the role of detrital and algal resources.Proc Natl Acad Sci USA 99:8101–8105
Stoecker DK, Capuzzo JM (1990) Predation on protozoa: itsimportance to zooplankton. J Plankton Res 12:891–908
Tang KW, Taal M (2005) Trophic modification of food qualityby heterotrophic protists: species-specific effects on cope-pod egg production and egg hatching. J Exp Mar Biol Ecol318:85–98
Turner JT (2004) The importance of small planktonic cope-pods and their roles in pelagic marine food webs. ZoolStud 43:255–266
Verity PG, Paffenhofer GA (1996) On assessment of preyingestion by copepods. J Plankton Res 18:1767–1779
Wong PS, Cloern JE (1982) Plankton studies in San FranciscoBay. IV. Phytoplankton abundances and species composi-tion. US Geol Surv Open File Rep 82–443, April
46
Editorial responsibility: Barry Sherr (Contributing Editor),Corvallis, Oregon, USA
Submitted: April 15, 2006; Accepted: April 2, 2007Proofs received from author(s): October 5, 2007