mesoscale precipitation structures accompanying landfalling and transitioning tropical cyclones in...
Post on 22-Dec-2015
215 views
TRANSCRIPT

Mesoscale Precipitation Structures Accompanying
Landfalling and Transitioning Tropical Cyclones in the Northeast United States
Jared Klein, Lance F. Bosart, and Daniel KeyserUniversity at Albany/SUNY; Albany, NY
CSTAR II Grant NA04NWS4680005
David ValleeNWS Weather Forecast Office; Taunton, MA
The Eighth Northeast Regional Operational Workshop
1-2 November 2006

Objectives Examine the distribution of rainfall in relation to
tropical cyclone (TC) track and identify smaller scale areas of enhanced rainfall within the overall precipitation shield.
Better understand how the observed mesoscale distribution of heavy rainfall in landfalling and transitioning TCs is modified by the interactions of mesoscale and synoptic-scale features.
Create a conceptual model applicable to operational forecasters to use once the research is completed.

Motivation• Difficulty in predicting the exact timing and location
of mesoscale features accompanying heavy precipitation.
• Approximately 4 out of every 5 fatalities from landfalling TCs are directly caused by inland flash flooding (Rappaport 2000).
• Recent active TC seasons (2004 and 2005) have led to an increase in the frequency of TC related flooding events over the Northeast U.S.– 1950 – 2003: Approximately 1 event every year– 2004 – 2005: Approximately 5 events every year

Complex Topography of the Northeast United States
http://fermi.jhuaple.edu/states.html

Previous CSTAR Work (DeLuca 2004)
Methodology• Identify TCs which produced ≥100 mm (4 in.) of rainfall
from 1950-2006 (present).
• Construct detailed surface analysis.
• Identify surface mesoscale processes associated with heavy precipitation:– Coastal frontogenesis (CF)– Frontogenesis along a pre-existing synoptic boundary.– Orographic upsloping of low-level warm and moist air over the
Northeast U.S.
• Construct analyses using NCEP NARR gridded datasets.

67 tropical cyclones producing ≥ 4 inches of rainfallin the Northeast U.S. during the period 1950 – 2006
Case list provided by David Vallee, NWS Taunton
1950 Able1950 Dog1952 Able1953 Barbara1953 Carol1954 Carol1954 Dolly1954 Edna1954 Hazel1955 Connie1955 Diane1955 Ione1958 Daisy1958 Helene1959 Cindy1959 Grace1960 Brenda1960 Cleo1960 Donna
1961 Unnamed1961 Esther1961 Frances1961 Gerda1962 Alma1962 Daisy1962 Ella1963 Ginny1968 Gladys1969 Gerda1971 Beth1971 Doria1971 Heidi1972 Agnes1972 Carrie1974 Dolly1975 Blanche1976 Belle1979 David
1985 Gloria1985 Henri1986 Charley1988 Alberto1988 Chris1991 Bob1996 Bertha1996 Edouard1996 Fran1996 Hortense1997 Danny1998 Bonnie1999 Floyd1999 Floyd2001 Allison2001 Allison2002 Isidore2002 Isidore2003 Bill2003 Bill2003 Isabel2003 Isabel2003 Juan2003 Juan2004 Alex2004 Alex
2004 Bonnie2004 Bonnie2004 Charley2004 Charley2004 Frances2004 Frances2004 Gaston/Hermine2004 Gaston/Hermine2004 Ivan2004 Ivan2004 Jeanne2004 Jeanne2005 Cindy2005 Cindy2005 Katrina2005 Katrina2005 Ophelia2005 Ophelia2006 Ernesto2006 Ernesto

Track vs. Precipitation Distribution Analyses • Determine track versus precipitation distribution.
– Rainfall Analyses:• NCEP 24 h daily (1200-1200 UTC) Unified
Precipitation Dataset (UPD) for cases prior to 2004.– Coarse 0.25o x 0.25o resolution.
– Insufficient for identifying mesoscale rainfall structures.
• Archived 6 h and 24 h RFC analysis of QPE from the NWS National Precipitation Verification Unit (NPVU).
– NCEP HPC analyzed 24 h precipitation and storm total precipitation/track maps.
– NHC best-track data to determine tracks of TCs.

UPD vs. HPC Precipitation MapsIsabel (2003)
UPD HPC

Preliminary Results• Enhanced precipitation associated with frontogenesis
along a mesoscale (e.g., a coastal front) or pre-existing synoptic-scale boundary occurred in 16 of 17 cases.– Frontogenesis area generally located left and poleward of
storm track.– Enhanced precipitation region along or in cold sector of
coastal front.– Slight θ gradient of approximately 2-4 oC/100 km
commonly occurred.– θ gradient was stronger when interacting with a synoptic-
scale frontal boundary.
• Orographically enhanced precipitation occurred in 9 of 17 cases where low-level easterly flow was upslope on the eastern sides of the Appalachian Mountains from northern Georgia to New England.

Summary of 17 landfalling and transitioning TCs in the northeast U.S. containing orographic enhancement and/or coastal fronts during 1999-2006.
Mesoscale feature Orographic Enhancement Coastal Frontogenesis
Number of storms 9 16
Individual Storm Name (Year) -
Floyd (1999) - Green Mts. In N VT
Floyd (1999) – N Mid Atlantic/SW New England
Location of meoscale feature
Isabel (2003) - Appalachian Mts. in VA
Allison (2001) - DE/NJ/S New England
Isidore (2002) - Appalachian Mts. in NC Bill (2003) - E SC/ NCFrances (2004) - Appalachian Mts. in N GA, NC, VA, W PA Isabel (2003) - NC/VA
Ivan (2004)- Appalachian Mts. in N GA, NC, W&C PA Alex (2004) – VA/DEJeanne (2004)- W NC/VA border
Bonnie/Charley (2004) - SC/NC/VA
Katrina (2005) - Appalachian Mts. in W NC/
Cindy (2005) - Green Mts. N VT Gaston (2004) - SE VA
Ivan (2004) – SE OH/PA/SE NY
Jeanne (2004) - SE PA/NJ/coastal New England
Cindy (2005) - SE VA/Delmarva
Katrina (2005) - W NY
Ophelia (2005) - extreme E MA
Ernesto (2006) - NC/VA
Bill (2003) - Appalachian Mts. in N GA Kyle (2002) – NC
Frances (2004) - coastal New England/NYC region (out ahead of storm) and W VA/W PA/W NY/E OH
Mesoscale Feature
Number of storms
Individual Storm Name (Year) -
Location of meoscale feature
Orographic Enhancement Frontogenesis

Track map of all 17 storms (1999-2006)
Mesoscale Features:Blue shades- FrontogenesisBlue shades- FrontogenesisGreen- OrographicGreen- OrographicRed/Red/Orange Orange Shades-Shades- Both Both

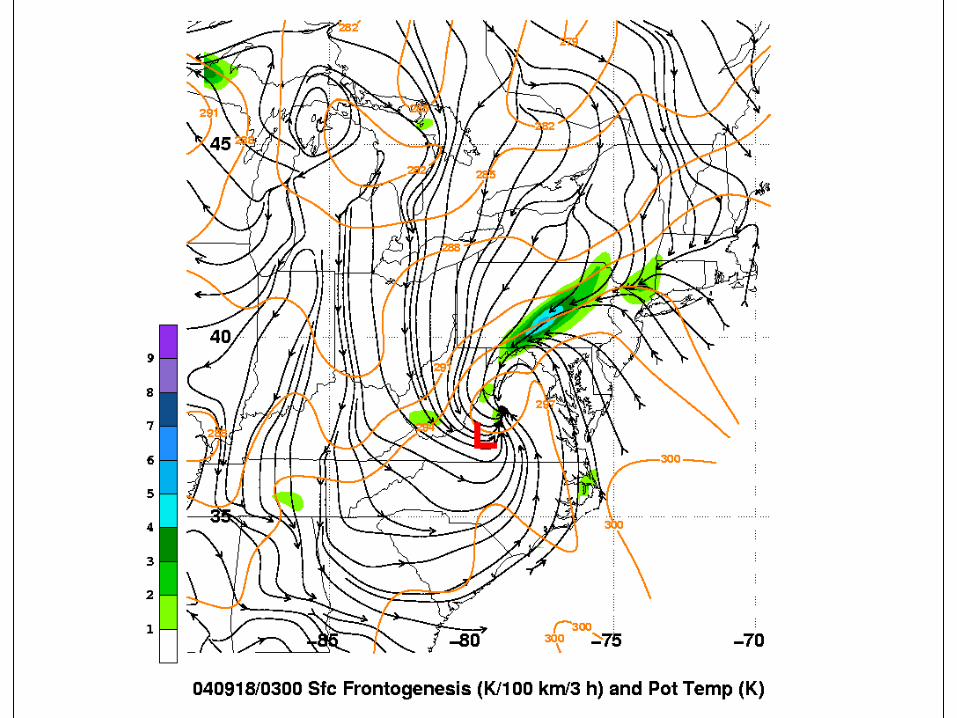
Case Study: Ivan
17-18 September 2004Mesoscale frontogenesis along a pre-existing synoptic
boundary and orographic precipitation enhancement

http://www.hpc.ncep.noaa.gov/tropical/rain/ivan2004.html


Summary of Preliminary Results
• Interaction between a landfalling and transitioning TC, an advancing upper-level trough, and a mesoscale coastal or pre-existing synoptic-scale front occurred in almost every recent heavy rainfall case examined.
• Orographically enhanced precipitation was found in nearly half the cases studied where low-level easterly flow was present over the eastern slopes Appalachian Mountains.
• Ivan’s large circulation induced an influx of tropical air into the pre-existing boundary, which led to both mesoscale frontogenesis and topographic rainfall enhancement.

Future Work
• ‘Go back in time’ and examine earlier cases from 1979-1998.
• Obtain more detailed precipitation data and analyses in order to better locate mesoscale areas of heavy rainfall.
• Examine mesoscale structures in further detail by constructing cross-sectional analyses using the NARR to better understand the key forcing ingredients.

REFERENCES
• DeLuca, D. P., 2004: The distribution of precipitation over the Northeast accompanying landfalling and transitioning tropical cyclones. M.S. Thesis, Department of Earth and Atmospheric Sciences, University at Albany-SUNY, 178 pp.