merit and social selection: from social disparities by design to social disparities by default
DESCRIPTION
Merit and Social Selection: from social disparities by design to social disparities by default. Dr. Joseph A. Soares Wake Forest University [email protected]. - PowerPoint PPT PresentationTRANSCRIPT
Dr. Joseph A. SoaresWake Forest [email protected]
Partial list of chapter authors: Richard Atkinson, former President,
University of California Daniel Golden, Pulitzer Prize Winner for
journalism on admissions Thomas Espenshade, Princeton University,
author of “No longer separate, not yet equal” Charles Murray, Author of best-selling “Bell
Curve,” Fellow at American Enterprise Institute Robert J. Sternberg, Provost of Oklahoma
State University; former Dean, Tufts University
Partial list of chapter authors: Jay Rosner, Vice-President, Princeton Review. Robert Schaeffer, Public Education Director, Fair
Test. Bruce Walker, Vice Provost and Director of
Admissions, University of Texas at Austin. Jeffrey Brenzel, Dean of Admissions, Yale University. Jill Tiefenthaler, Provost, Wake Forest University.
Institutional studies from: Johns Hopkins; University of California;
University of Georgia; University of Texas; Wake Forest University
Approximately 3 million youths graduate high school each year; over 2 million will attend college. Of those over 1.5 million will take the SAT.
Together, those test takers will support a 4 billion dollar test prep industry; a multi-billion dollar ETS test industry.
Scores will be used to rate high schools, real estate, the worth of individuals and their prospects in higher education.
The stakes and the costs, to individuals and to our society, are high.
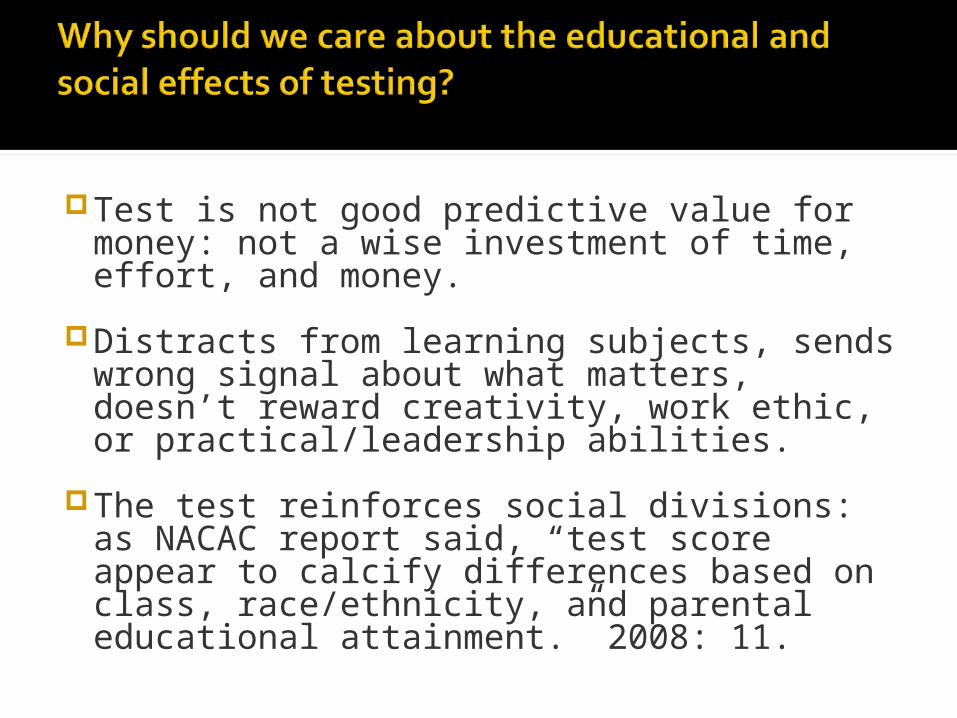
Test is not good predictive value for money: not a wise investment of time, effort, and money.
Distracts from learning subjects, sends wrong signal about what matters, doesn’t reward creativity, work ethic, or practical/leadership abilities.
The test reinforces social divisions: as NACAC report said, “test score appear to calcify differences based on class, race/ethnicity, and parental educational attainment.” 2008: 11.
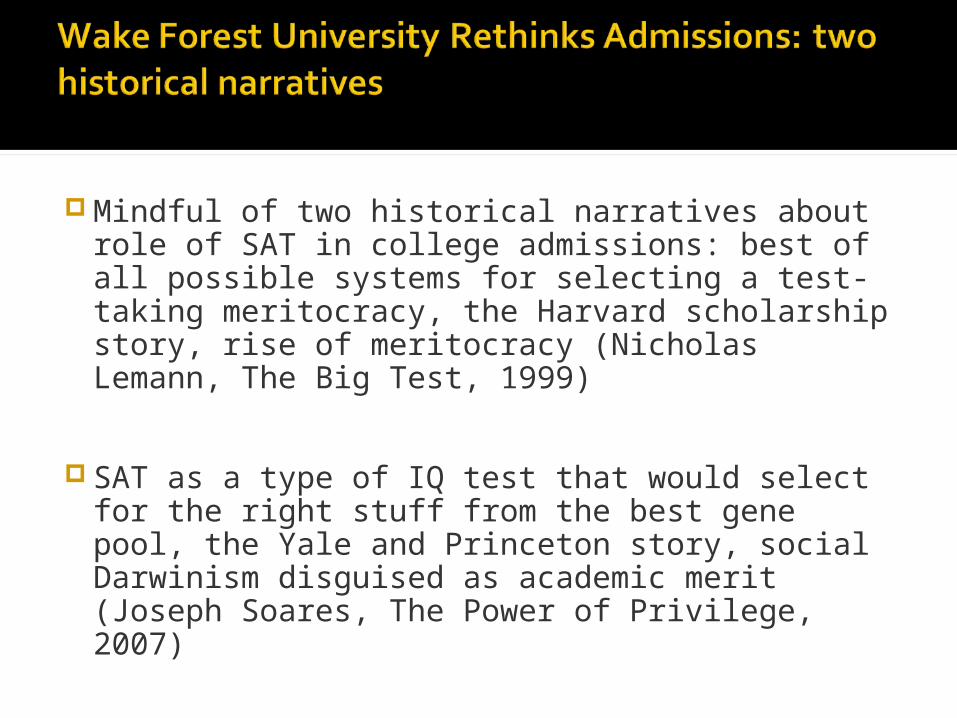
Mindful of two historical narratives about role of SAT in college admissions: best of all possible systems for selecting a test-taking meritocracy, the Harvard scholarship story, rise of meritocracy (Nicholas Lemann, The Big Test, 1999)
SAT as a type of IQ test that would select for the right stuff from the best gene pool, the Yale and Princeton story, social Darwinism disguised as academic merit (Joseph Soares, The Power of Privilege, 2007)
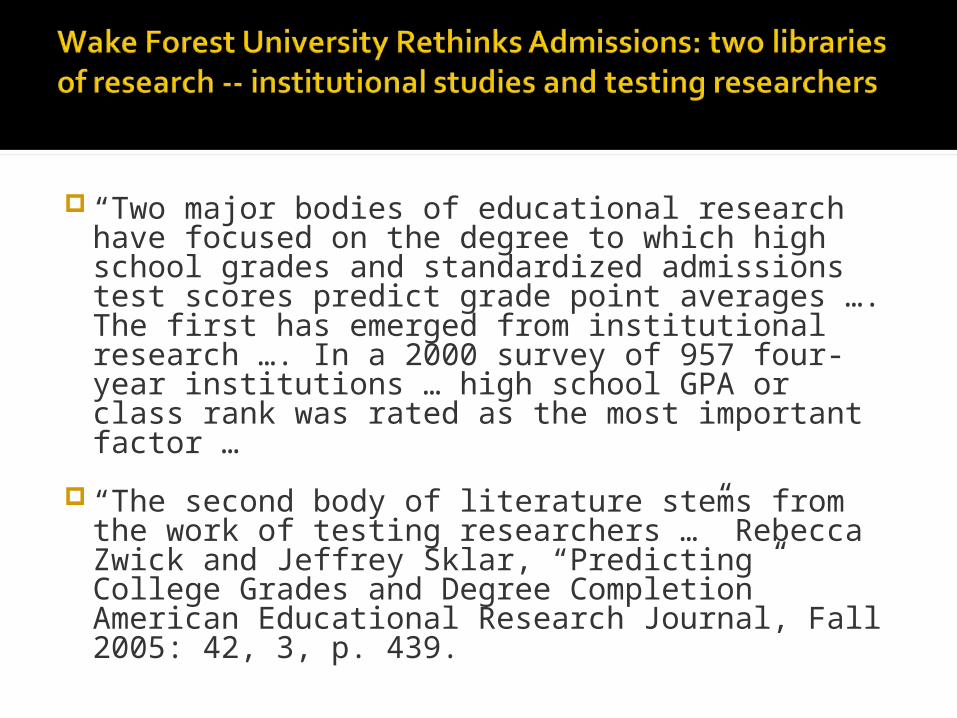
“Two major bodies of educational research have focused on the degree to which high school grades and standardized admissions test scores predict grade point averages …. The first has emerged from institutional research …. In a 2000 survey of 957 four-year institutions … high school GPA or class rank was rated as the most important factor …
“The second body of literature stems from the work of testing researchers …” Rebecca Zwick and Jeffrey Sklar, “Predicting College Grades and Degree Completion” American Educational Research Journal, Fall 2005: 42, 3, p. 439.
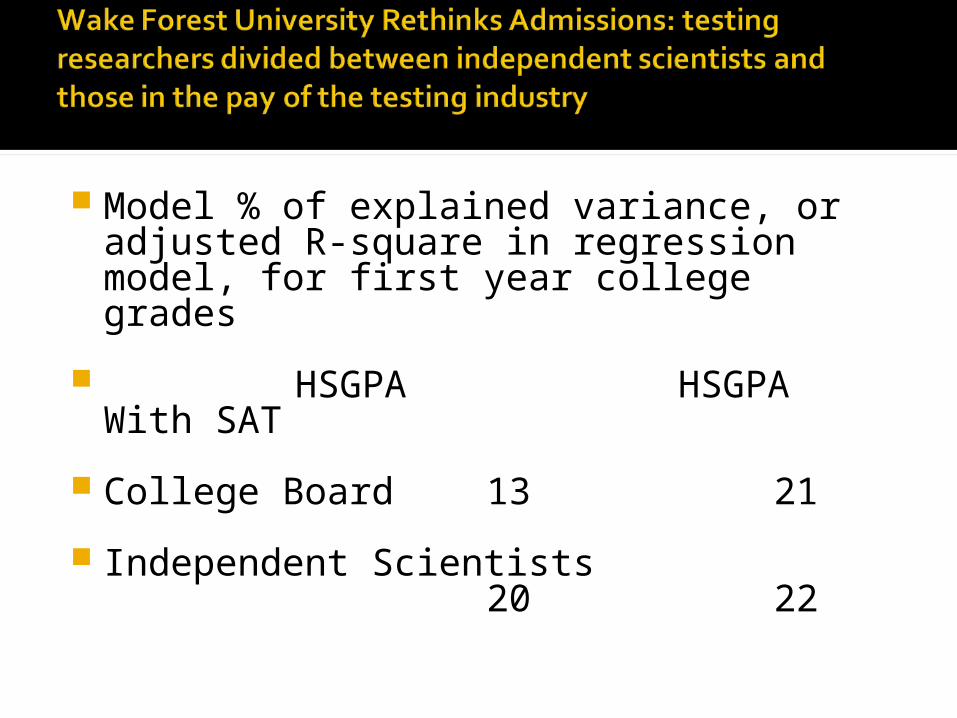
Model % of explained variance, or adjusted R-square in regression model, for first year college grades
HSGPA HSGPA With SAT
College Board 13 21
Independent Scientists 20 22
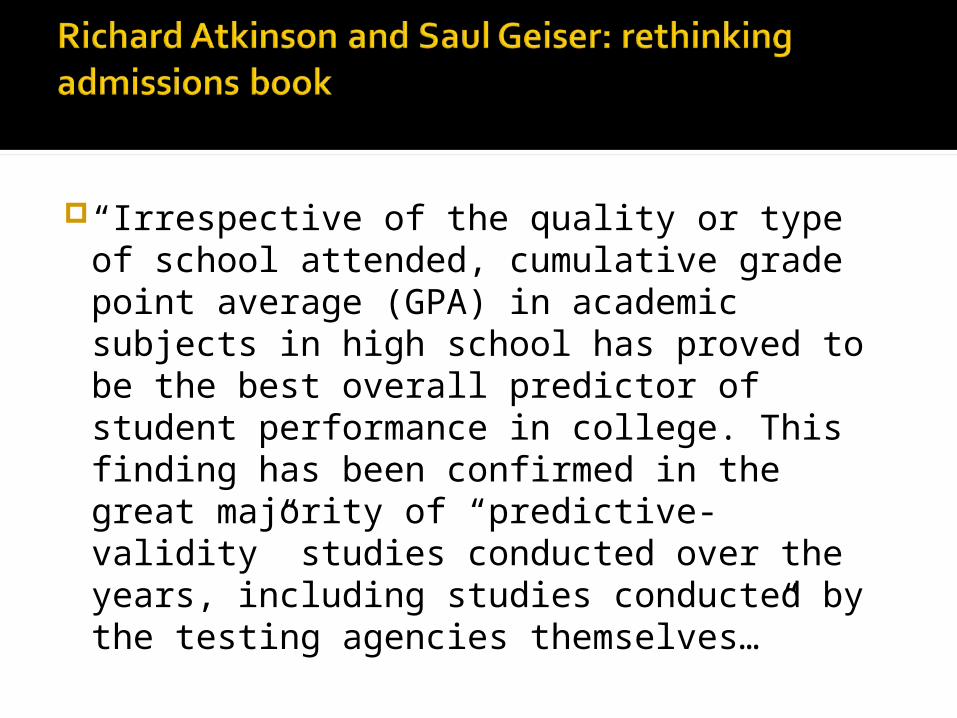
“Irrespective of the quality or type of school attended, cumulative grade point average (GPA) in academic subjects in high school has proved to be the best overall predictor of student performance in college. This finding has been confirmed in the great majority of “predictive-validity” studies conducted over the years, including studies conducted by the testing agencies themselves…”
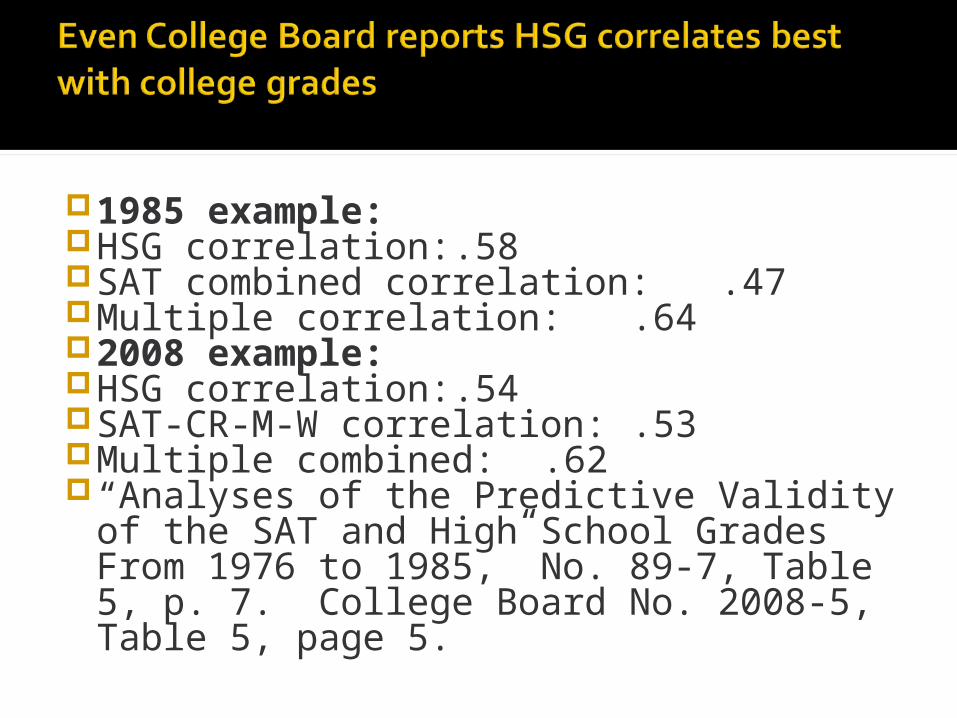
1985 example:HSG correlation: .58SAT combined correlation: .47Multiple correlation: .64 2008 example:HSG correlation: .54SAT-CR-M-W correlation: .53Multiple combined: .62
“Analyses of the Predictive Validity of the SAT and High School Grades From 1976 to 1985,” No. 89-7, Table 5, p. 7. College Board No. 2008-5, Table 5, page 5.
Private colleges growing out of religious diversity, using subject or achievement entrance exams by 1900, and SAT aptitude test by 1926.
Public universities in a decentralized polity, from Land-Grant Acts, linked to public high schools, taking all high school graduates in a state, until ACT in 1950s, and SAT adoption by most in late 1960s.
Official College Board version: dramatic increase in college attendance between 1890 and 1922; colleges were “physically incapable of accommodating all …. One way out … is to limit enrolment …. To develop more adequate means for selecting” SAT Manual 1934: 3.
Unofficial version: fear of Jewish invasion spreading from Columbia, where Jews were 40% of students in 1924, to rest of Ivy League.
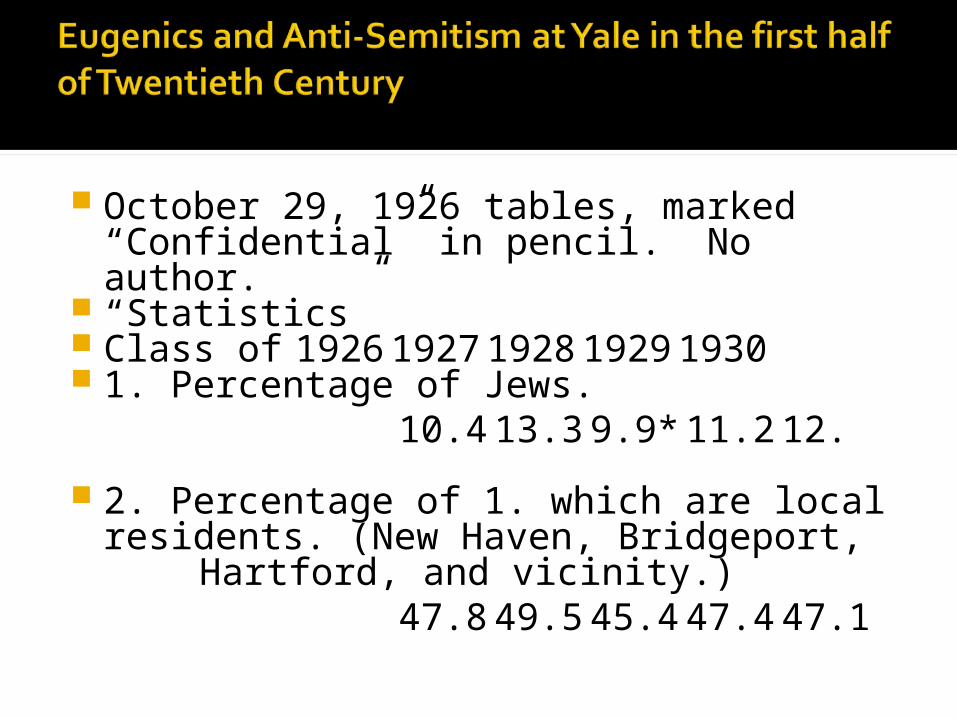
October 29, 1926 tables, marked “Confidential” in pencil. No author.
“Statistics” Class of 19261927192819291930 1. Percentage of Jews.
10.4 13.3 9.9* 11.2 12.
2. Percentage of 1. which are local residents. (New Haven, Bridgeport, Hartford, and vicinity.)
47.8 49.5 45.4 47.4 47.1

“I am extremely interest [sic.] in the Hebraic record which you are kind enough to send me. … if we could have an Armenian massacre confined to the New Haven district, with occasional incursions into Bridgeport and Hartford, we might protect our Nordic stock almost completely.”
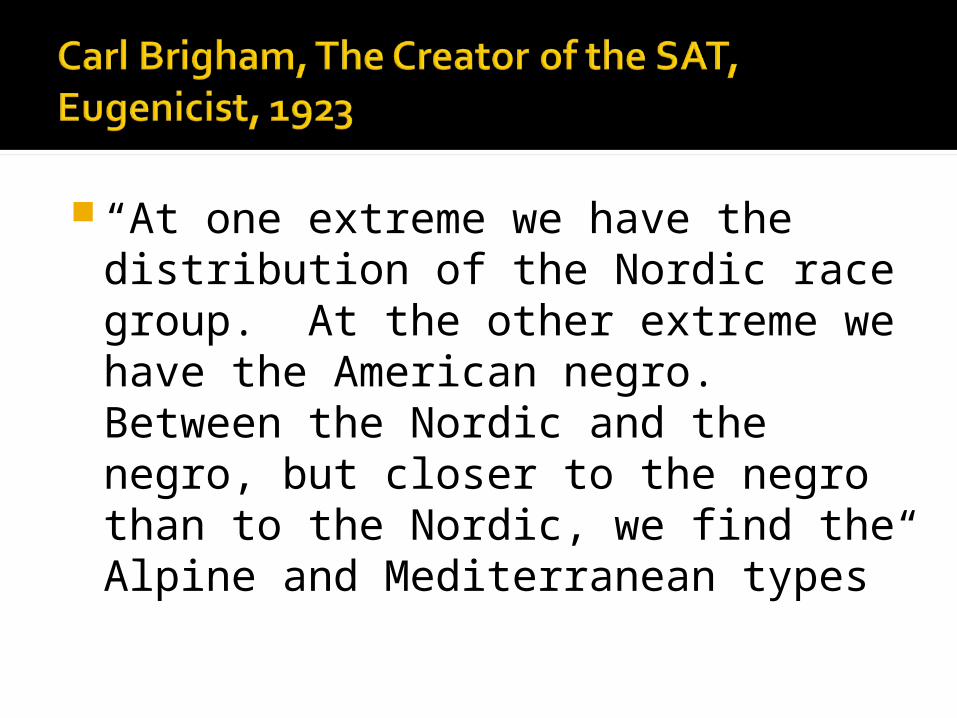
“At one extreme we have the distribution of the Nordic race group. At the other extreme we have the American negro. Between the Nordic and the negro, but closer to the negro than to the Nordic, we find the Alpine and Mediterranean types”
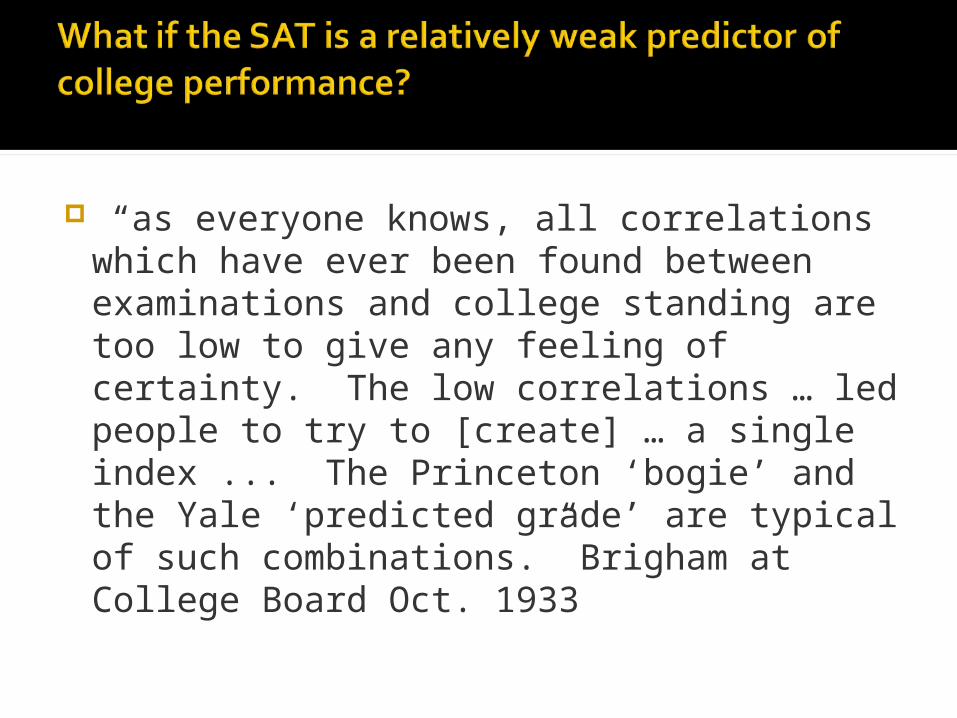
“as everyone knows, all correlations which have ever been found between examinations and college standing are too low to give any feeling of certainty. The low correlations … led people to try to [create] … a single index ... The Princeton ‘bogie’ and the Yale ‘predicted grade’ are typical of such combinations.” Brigham at College Board Oct. 1933
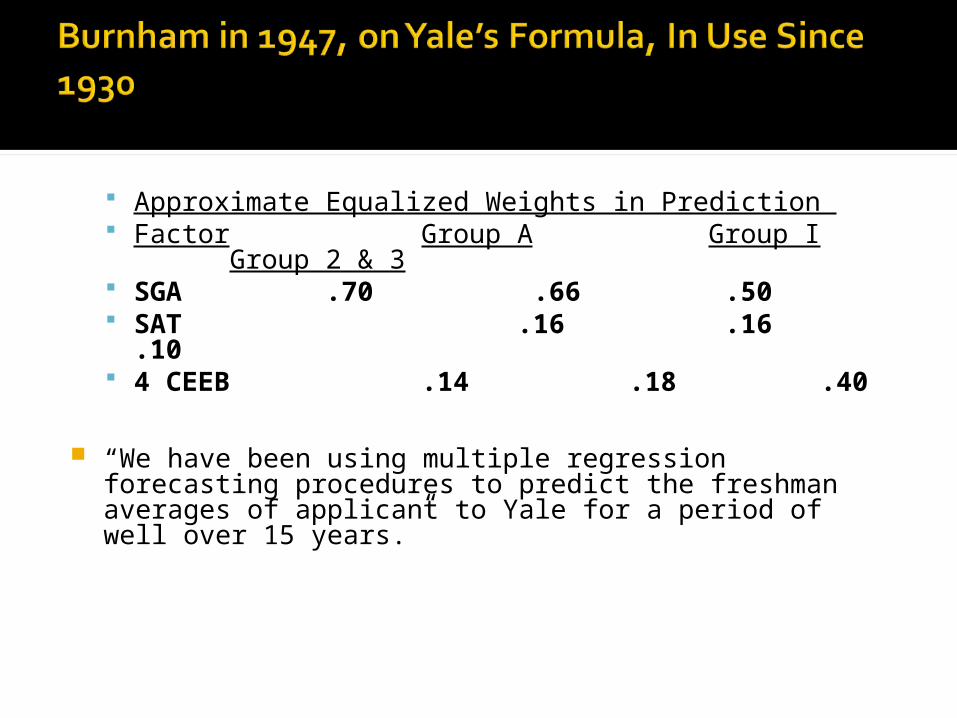
Approximate Equalized Weights in Prediction Factor Group A Group I
Group 2 & 3 SGA .70 .66 .50 SAT .16 .16 .10 4 CEEB .14 .18 .40
“We have been using multiple regression forecasting procedures to predict the freshman averages of applicant to Yale for a period of well over 15 years.”
“adjusted secondary school grade correlates reasonably well with college work. Indeed, the general finding of many years of research … is that the secondary school record, when properly handled, provides the best single indicator of potential success in college.”
“The hard economic reality facing Harvard and many others is that 60% of their undergraduate matriculants must come from families which can from their own resources meet the … annual budget …. therefore the majority of students attending even the best endowed private institutions must be recruited from a narrow segment of the population.”
Arthur Howe in 1961 on the Economics of Yale, Harvard, Princeton
“We have adequate financial aid to provide what help is needed by approximately one-third of each entering class, … the remaining two-thirds of each class must be recruited from approximately the upper 5 per cent of American families in terms of income distribution.”
From 1964 to 2003, the average for all undergraduates on financial aid has been 40% (with a low of 37 and a high of 44, and the most frequent percentage being 38). The 40% prediction of Howe’s in 1963 was quite something.
The SAT’s weak predictive performance for college record was more than off set by its useful correlation with family income
HSGPA had only a weak correlation with family income, but it was always the best predictor of college grades
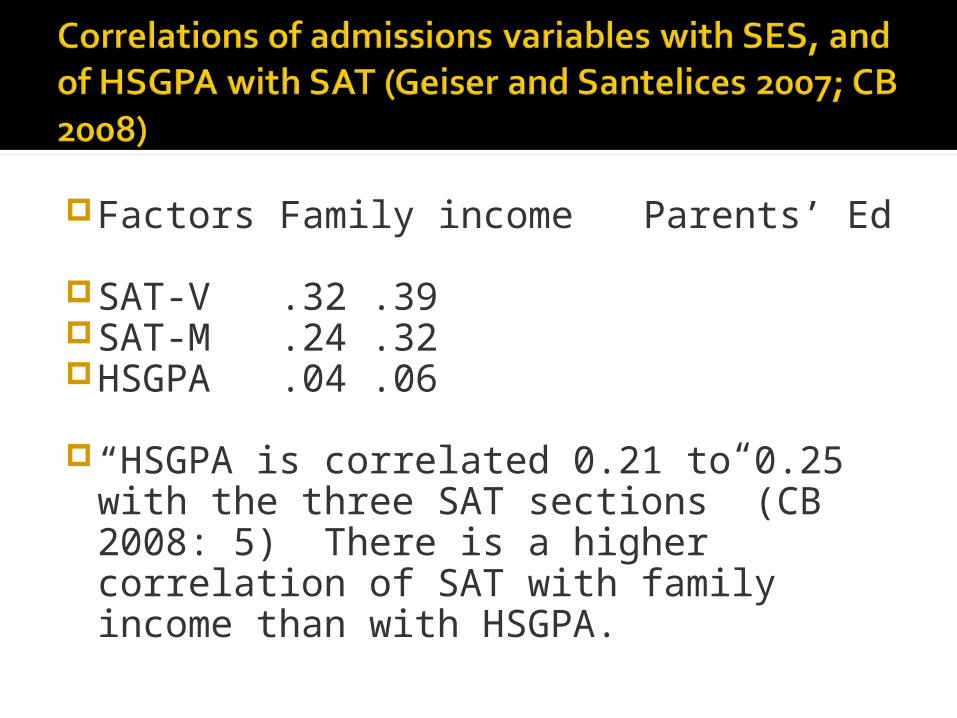
Factors Family incomeParents’ Ed
SAT-V .32 .39SAT-M .24 .32HSGPA .04 .06
“HSGPA is correlated 0.21 to 0.25 with the three SAT sections” (CB 2008: 5) There is a higher correlation of SAT with family income than with HSGPA.
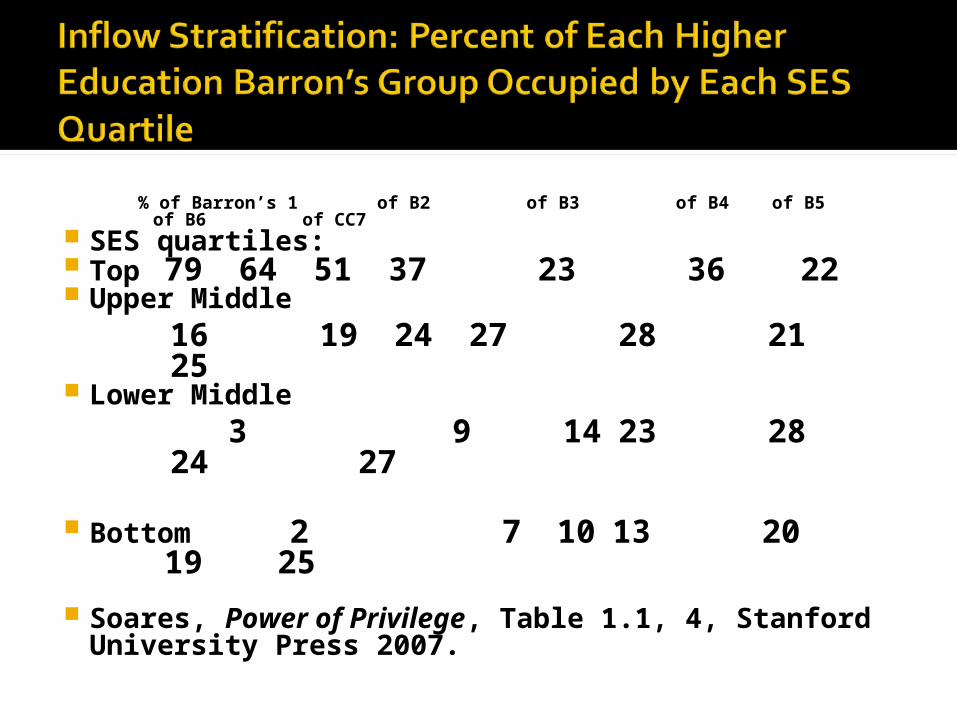
% of Barron’s 1 of B2 of B3 of B4 of B5 of B6 of CC7
SES quartiles: Top 79 64 51 37 23 36 22 Upper Middle
16 19 24 27 28 21 25
Lower Middle 3 9 14 23 28 24 27
Bottom 2 7 10 13 20 19 25
Soares, Power of Privilege, Table 1.1, 4, Stanford University Press 2007.
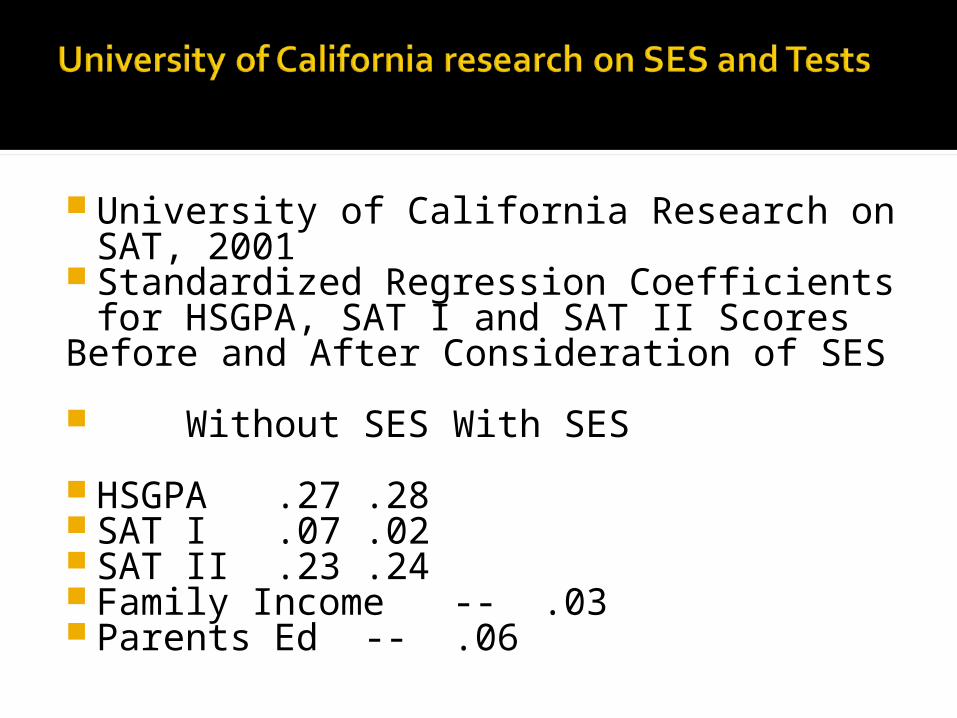
University of California Research on SAT, 2001
Standardized Regression Coefficients for HSGPA, SAT I and SAT II Scores
Before and After Consideration of SES
Without SES With SES
HSGPA .27 .28 SAT I .07 .02 SAT II .23 .24 Family Income -- .03 Parents Ed -- .06
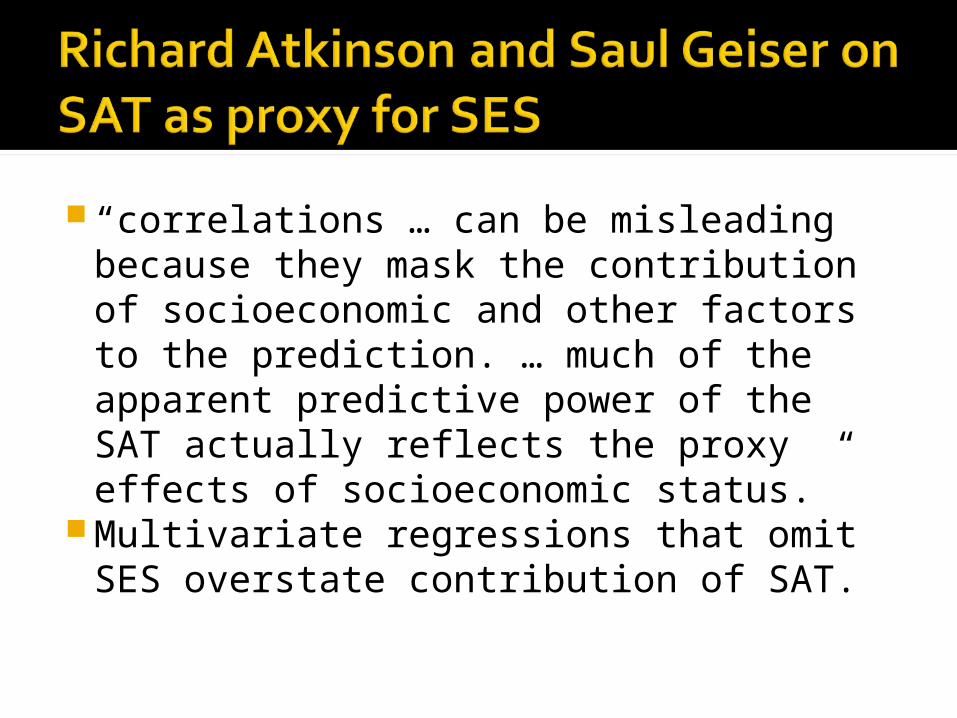
“correlations … can be misleading because they mask the contribution of socioeconomic and other factors to the prediction. … much of the apparent predictive power of the SAT actually reflects the proxy effects of socioeconomic status.”
Multivariate regressions that omit SES overstate contribution of SAT.
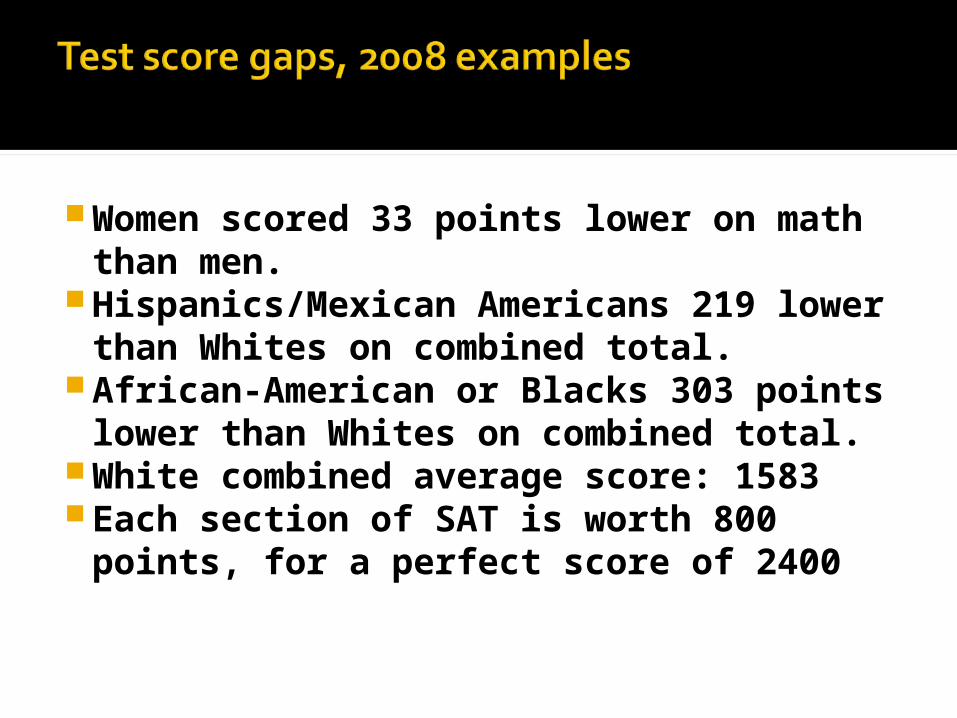
Women scored 33 points lower on math than men.
Hispanics/Mexican Americans 219 lower than Whites on combined total.
African-American or Blacks 303 points lower than Whites on combined total.
White combined average score: 1583Each section of SAT is worth 800
points, for a perfect score of 2400
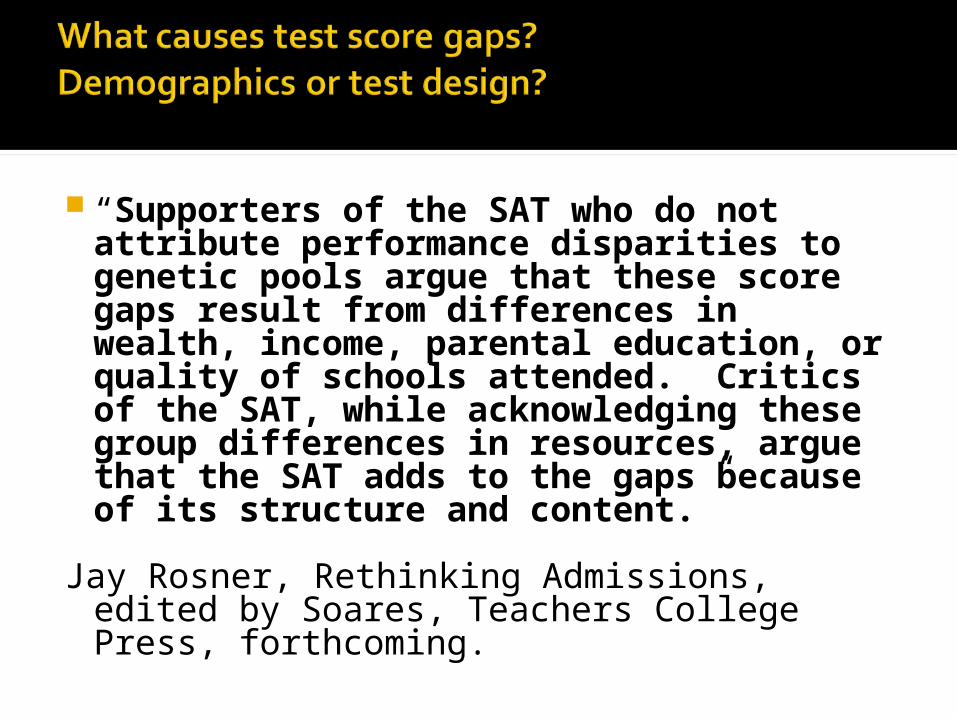
“Supporters of the SAT who do not attribute performance disparities to genetic pools argue that these score gaps result from differences in wealth, income, parental education, or quality of schools attended. Critics of the SAT, while acknowledging these group differences in resources, argue that the SAT adds to the gaps because of its structure and content.”
Jay Rosner, Rethinking Admissions, edited by Soares, Teachers College Press, forthcoming.
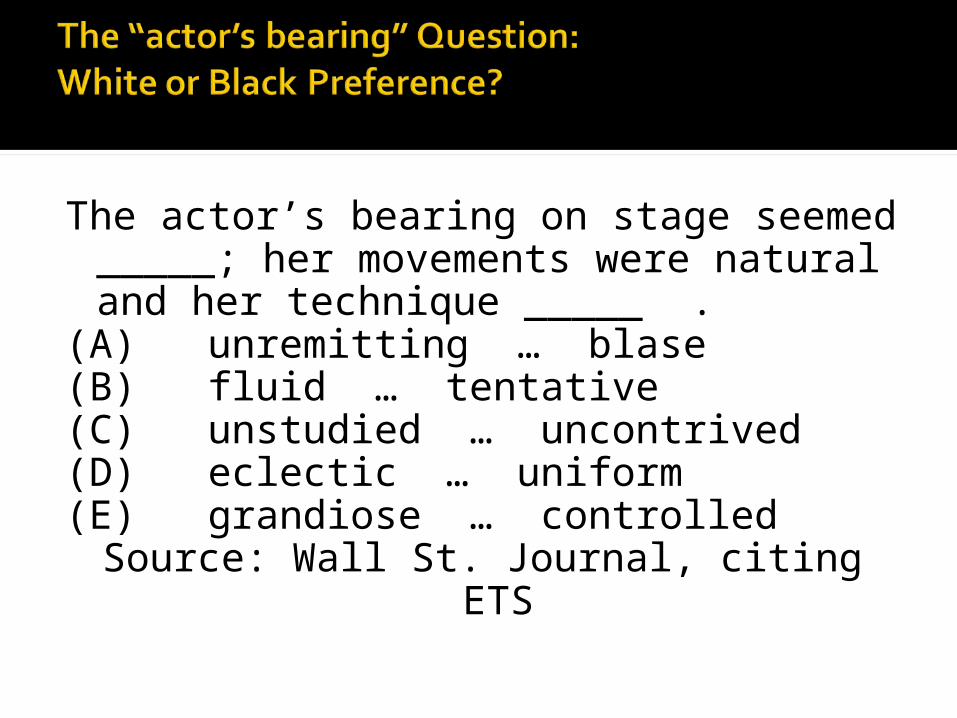
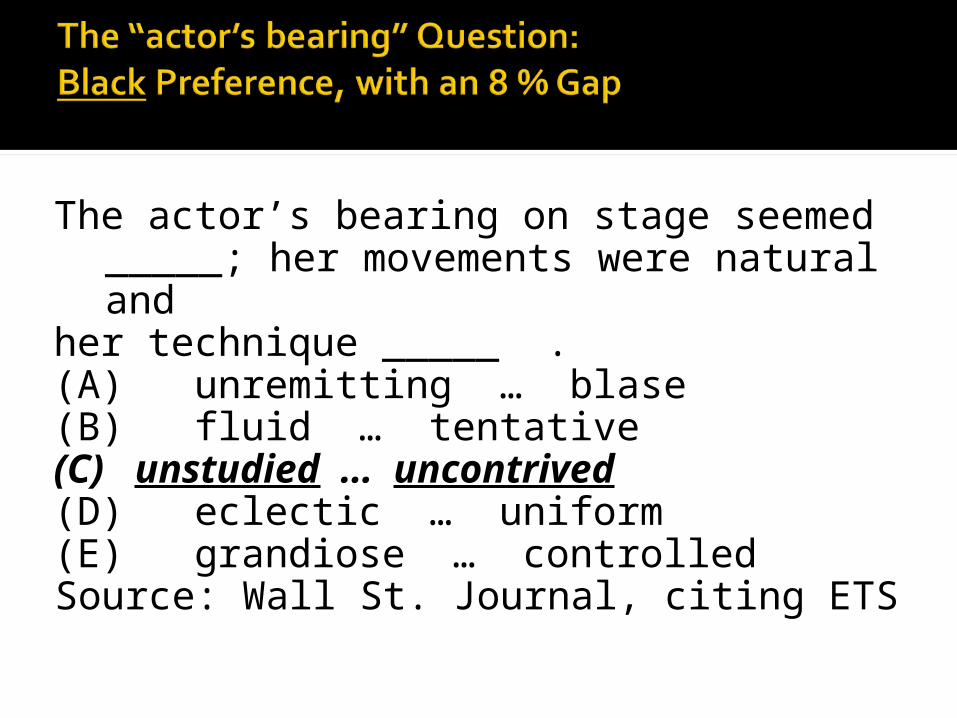
The actor’s bearing on stage seemed _____; her movements were natural
and her technique _____ .(A) unremitting … blase(B) fluid … tentative(C) unstudied … uncontrived(D) eclectic … uniform(E) grandiose … controlled
Source: Wall St. Journal, citing ETS
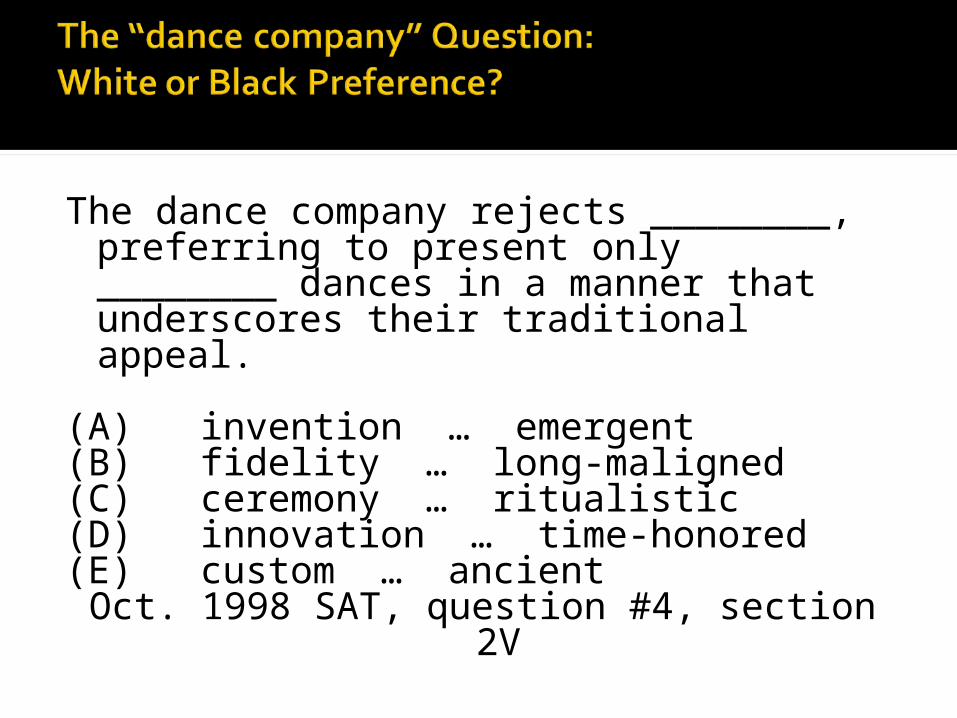
The dance company rejects ________, preferring to present only ________ dances in a manner that underscores their traditional appeal.
(A) invention … emergent(B) fidelity … long-maligned(C) ceremony … ritualistic(D) innovation … time-honored(E) custom … ancientOct. 1998 SAT, question #4, section 2V
The actor’s bearing on stage seemed _____; her movements were natural and
her technique _____ .(A) unremitting … blase(B) fluid … tentative(C) unstudied … uncontrived(D) eclectic … uniform(E) grandiose … controlled
Source: Wall St. Journal, citing ETS
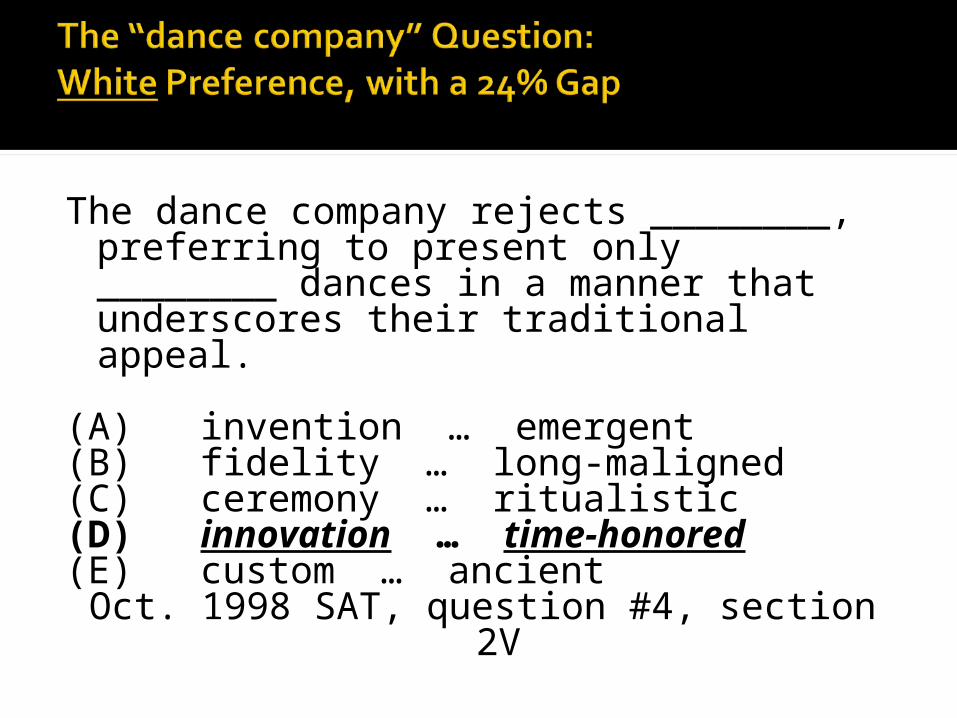
The dance company rejects ________, preferring to present only ________ dances in a manner that underscores their traditional appeal.
(A) invention … emergent(B) fidelity … long-maligned(C) ceremony … ritualistic(D) innovation … time-honored(E) custom … ancientOct. 1998 SAT, question #4, section 2V
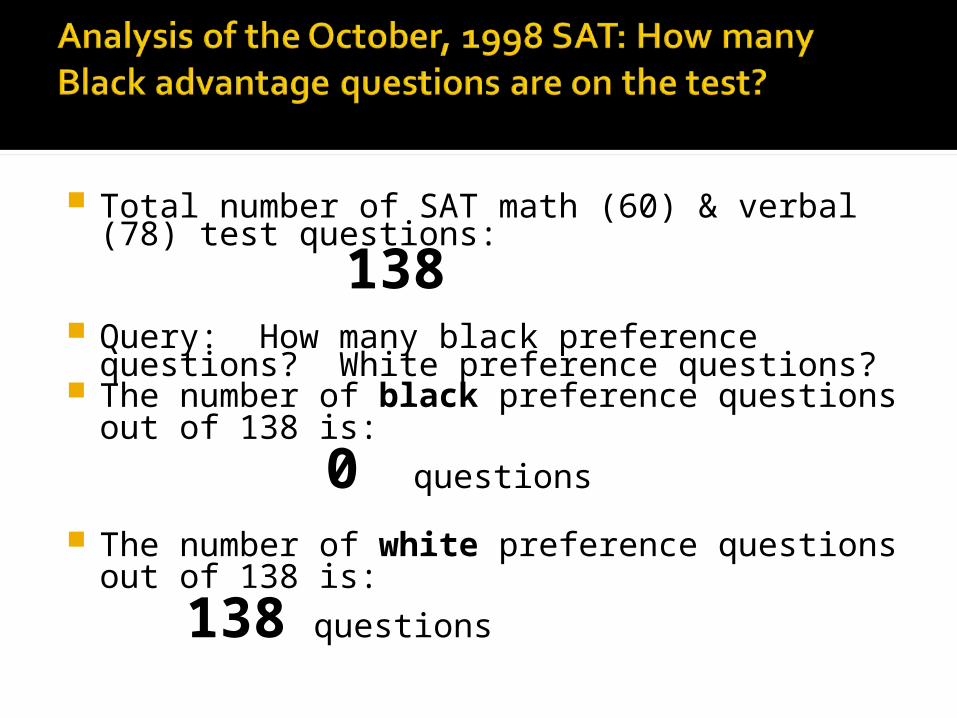
Total number of SAT math (60) & verbal (78) test questions:
138 Query: How many black preference questions?
White preference questions? The number of black preference questions out
of 138 is:
0 questions
The number of white preference questions out of 138 is:
138 questions
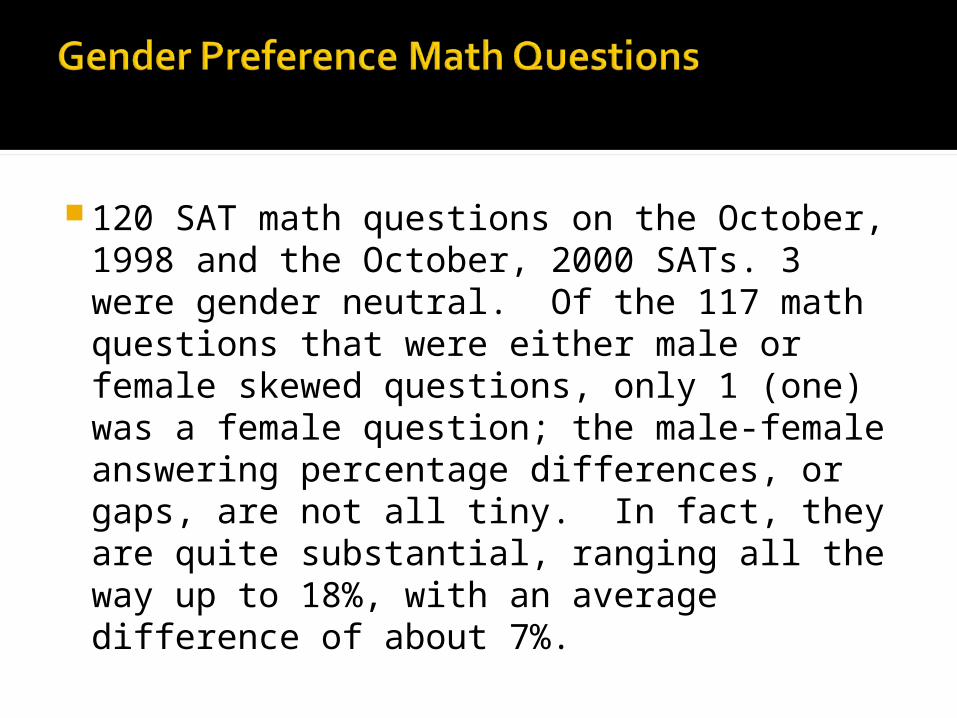
120 SAT math questions on the October, 1998 and the October, 2000 SATs. 3 were gender neutral. Of the 117 math questions that were either male or female skewed questions, only 1 (one) was a female question; the male-female answering percentage differences, or gaps, are not all tiny. In fact, they are quite substantial, ranging all the way up to 18%, with an average difference of about 7%.
The College Board has believed since 1926 that IQ or college ability is distributed in the population according to a bell curve.
Questions are selected when they retain the shape of the bell curve from last year.
This notion of intelligence has been challenged most famously by Howard Gardner, Robert Sternberg, and James Flynn.
“Admissions tests should be criterion referenced rather than norm referenced: Our primary consideration should not be how an applicant compares with others but whether he or she demonstrates sufficient mastery of college preparatory subjects …”
Richard Atkinson and Saul Geiser
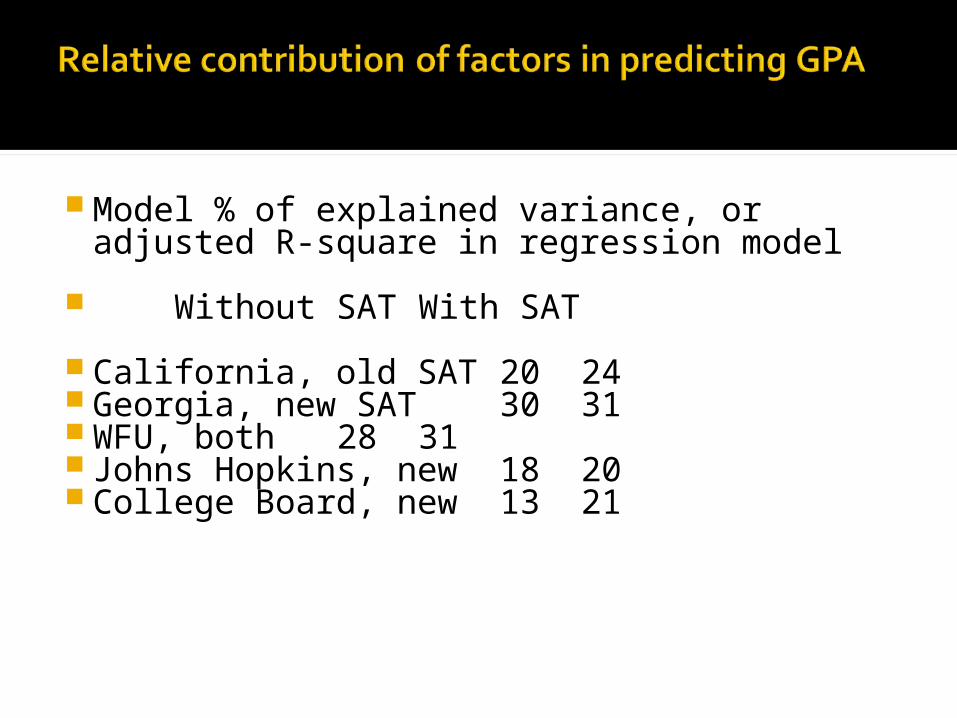
Model % of explained variance, or adjusted R-square in regression model
Without SAT With SAT
California, old SAT 20 24 Georgia, new SAT 30 31 WFU, both 28 31 Johns Hopkins, new 18 20 College Board, new 13 21
Follow NACAC’s advice: take back the conversation out of the hands of the test industry. Colleges should do their own validity study.
If you find, like everyone including the College Board, that HSGPA predicts best, then step back from tests; signal that high school work matters most
Shift to subject or achievement tests, working with Common Core Standards movement to define college ready high school graduates
Dr. Thomas Espenshade, Princeton University, ran simulations using Mellon Foundation data, and found that “test-optional” admissions increases one’s social and racial diversity while enhancing one’s academic standards, as measured by HSGPA and AP exams. (See Wake Forest’s home page for conference link.)
We get a “win-win” result: more social diversity, stronger students.
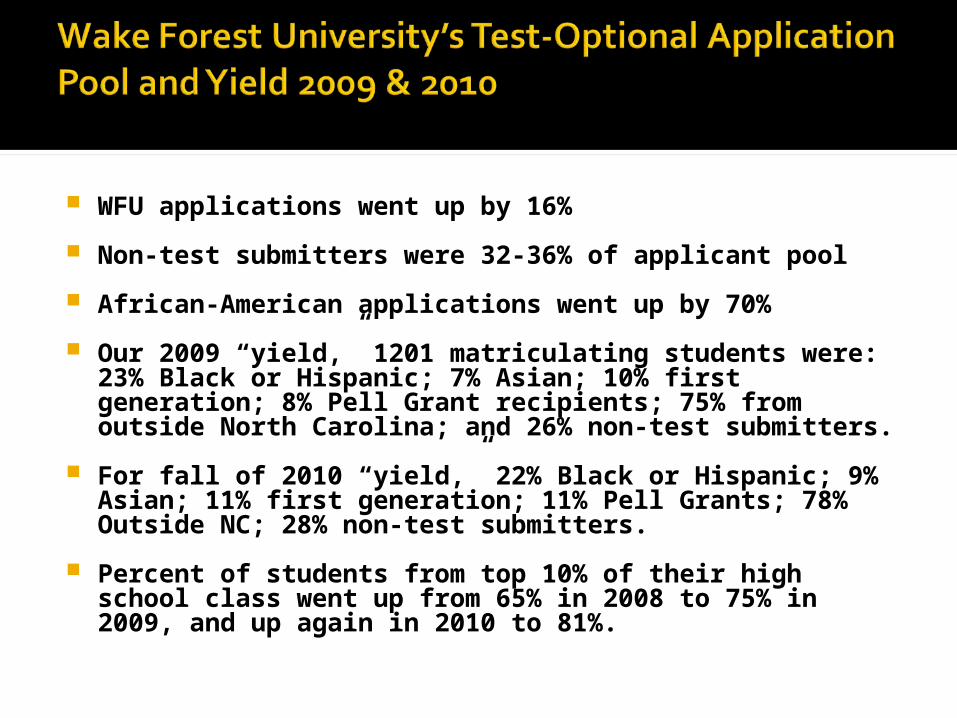
WFU applications went up by 16%
Non-test submitters were 32-36% of applicant pool
African-American applications went up by 70%
Our 2009 “yield,” 1201 matriculating students were: 23% Black or Hispanic; 7% Asian; 10% first generation; 8% Pell Grant recipients; 75% from outside North Carolina; and 26% non-test submitters.
For fall of 2010 “yield,” 22% Black or Hispanic; 9% Asian; 11% first generation; 11% Pell Grants; 78% Outside NC; 28% non-test submitters.
Percent of students from top 10% of their high
school class went up from 65% in 2008 to 75% in 2009, and up again in 2010 to 81%.
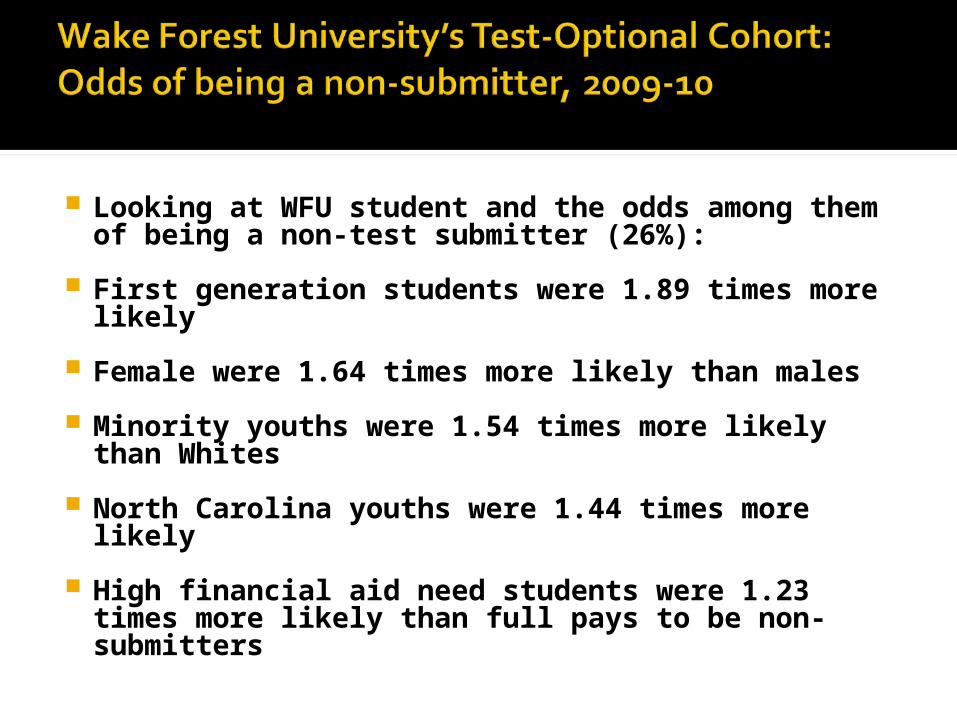
Looking at WFU student and the odds among them of being a non-test submitter (26%):
First generation students were 1.89 times
more likely
Female were 1.64 times more likely than males
Minority youths were 1.54 times more likely than Whites
North Carolina youths were 1.44 times more likely
High financial aid need students were 1.23 times more likely than full pays to be non-submitters
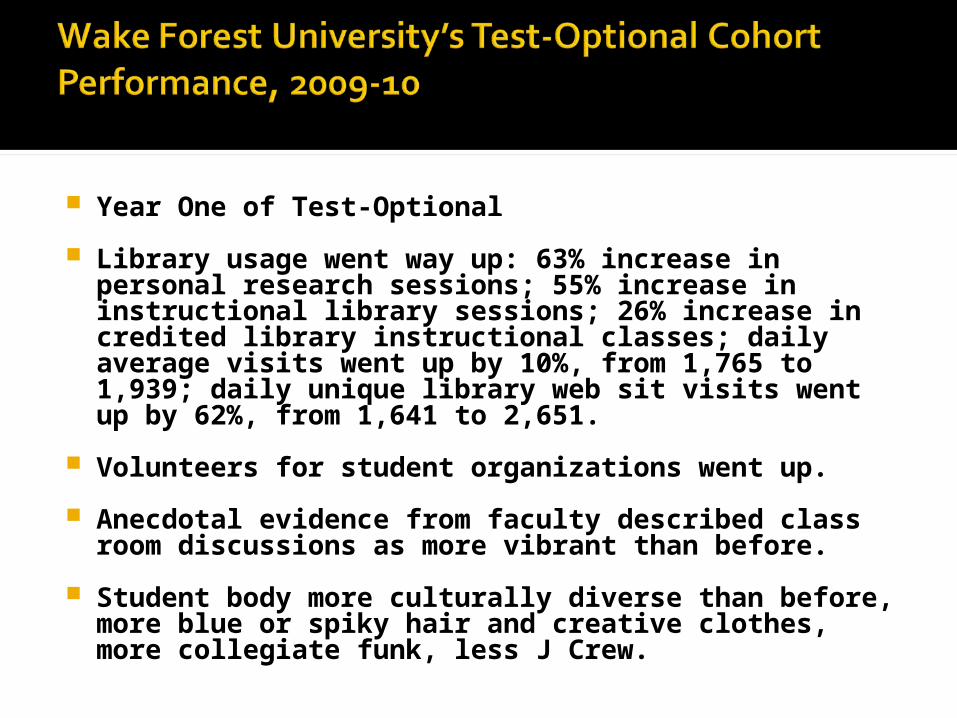
Year One of Test-Optional
Library usage went way up: 63% increase in personal research sessions; 55% increase in instructional library sessions; 26% increase in credited library instructional classes; daily average visits went up by 10%, from 1,765 to 1,939; daily unique library web sit visits went up by 62%, from 1,641 to 2,651.
Volunteers for student organizations went up.
Anecdotal evidence from faculty described class room discussions as more vibrant than before.
Student body more culturally diverse than before, more blue or spiky hair and creative clothes, more collegiate funk, less J Crew.
In terms of retention rate, we had a 94% return of first year students to carry forward into a second year at Wake Forest before, and after we went test-optional.
We looked at the academic performance of non-test score submitters in comparison with test-score submitters for GPA.
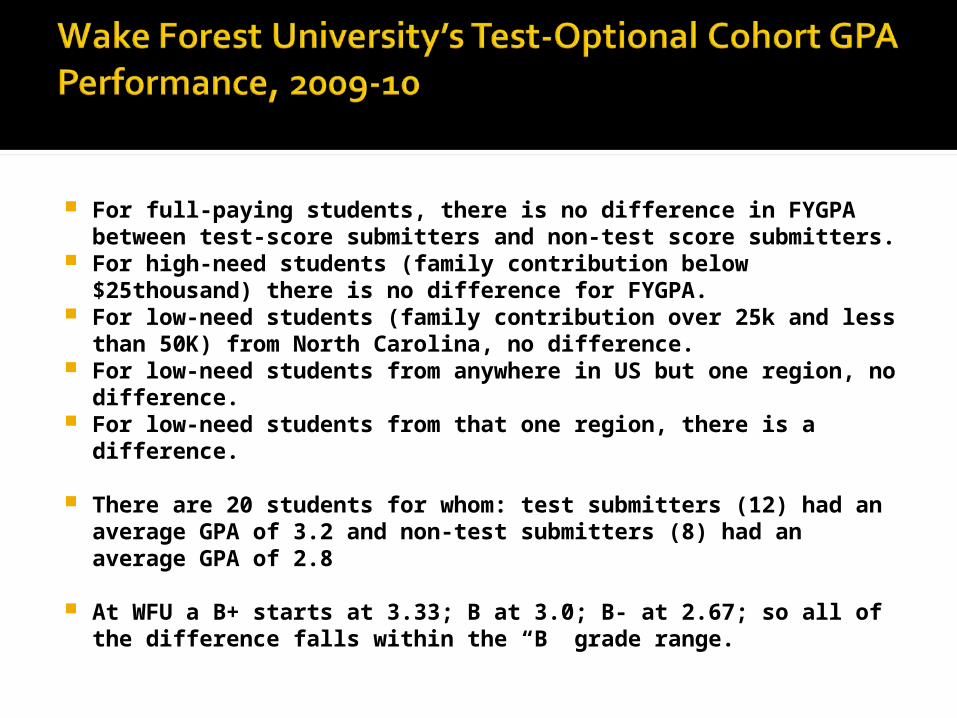
For full-paying students, there is no difference in FYGPA between test-score submitters and non-test score submitters.
For high-need students (family contribution below $25thousand) there is no difference for FYGPA.
For low-need students (family contribution over 25k and less than 50K) from North Carolina, no difference.
For low-need students from anywhere in US but one region, no difference.
For low-need students from that one region, there is a difference.
There are 20 students for whom: test submitters (12) had an
average GPA of 3.2 and non-test submitters (8) had an average GPA of 2.8
At WFU a B+ starts at 3.33; B at 3.0; B- at 2.67; so all of the difference falls within the “B” grade range.
Test Optional When tests are used rely on
achievement- criterion-referenced tests, not bell curve norm-referenced tests
Tests aligned with college preparatory coursework in high schools
Signaling that hard work in school, not test prep, is key to success
De-escalate the rankings competition