mergers & acquisitions insights - piper jaffray · mergers & acquisitions insights middle...
TRANSCRIPT

M E R G E R S & A C Q U I S I T I O N S
MERGERS & ACQUISITIONS INSIGHTS
M I D D L E M A R K E T M & A O U T L O O K 2 0 0 7
D E C E M B E R 2 0 0 6
Jon W. Kreidler, CFA Adam B. Kroll612 303-6328 312 [email protected] [email protected]
Cooper R. Caillier Joseph C. McConnell312 920-3252 612 [email protected] [email protected]
head of middle market m&a:
Jeff A. Rosenkranz312 [email protected]
December 2006
PIPER JAFFRAY M&A INSIGHTS MIDDLE MARKET M&A OUTLOOK 2007 ⏐ 1
T A B L E O F C O N T E N T S
Executive Summary.................................................................................... 3 Part I: M&A Activity – “A Macro Look”
Introduction ...................................................................................... 4 Worldwide M&A Activity ................................................................ 4 Domestic M&A Activity ................................................................... 5 Middle Market M&A Activity ........................................................... 7 European M&A Activity....................................................................10 Emerging Market M&A Activity .......................................................12
Part II: Capital Markets Introduction ......................................................................................15 Debt Markets.....................................................................................15 Initial Public Offering Activity ...........................................................18
Part III: Private Equity/Leveraged Buyouts
Introduction ......................................................................................22 LBO Volume......................................................................................23 Portfolio Company Hold Periods .......................................................25 Private Equity Fundraising .................................................................26 Uninvested Equity Capital..................................................................28 Competitive Environment ..................................................................29
Part IV: Strategic Buyers Introduction ......................................................................................30 Capital Structure................................................................................31 Cash Levels........................................................................................32
Part V: Conclusion .....................................................................................34 Appendix: 2006 Piper Jaffray M&A Sector Analysis
Alternative Energy - Biofuels ...........................................................................................36 Business Services - Employer Services ............................................................................37 - Security & Safety Services ................................................................38 Consumer - Consumer Products..........................................................................39 - Food Processing & Distribution .......................................................40 - Hardlines & Specialty Retail ............................................................41 - Restaurants......................................................................................42 - Softlines Retail, Footwear & Apparel...............................................43
December 2006
2 ⏐ PIPER JAFFRAY M&A INSIGHTS MIDDLE MARKET M&A OUTLOOK 2007
Financial Institutions - Asset Management...........................................................................44 - Broker-Dealer ..................................................................................45 - Depository Institutions ....................................................................46 - Insurance .........................................................................................47 - Specialty Finance .............................................................................48 - Technology & Services ....................................................................49
Health Care - Biopharmaceuticals..........................................................................50 - Health Care Services ........................................................................51 - Info-Driven Health Care ..................................................................52 - Life Sciences Tools & Diagnostics....................................................53 - Medical Technology ........................................................................54
Industrial Growth - Aerospace & Defense.......................................................................55 - Automotive Aftermarket..................................................................56 - Building Products.............................................................................57 - Flow & Process Control...................................................................58 - Industrial Distribution .....................................................................59 - Packaging ........................................................................................60 - Specialty Chemicals .........................................................................61 - Specialty Vehicles.............................................................................62 Technology - Communications Equipment............................................................63 - Hardware & Semiconductors...........................................................64 - Internet............................................................................................65 - IT Services .......................................................................................66 - Software ..........................................................................................67 Restructuring - Distressed M&A Outlook................................................................68
December 2006
PIPER JAFFRAY M&A INSIGHTS MIDDLE MARKET M&A OUTLOOK 2007 ⏐ 3
E X E C U T I V E S U M M A R Y
In our Middle Market M&A Outlook 2006, we predicted that the rapid pace of mergers and acquisitions (“M&A”) activity experienced in 2005, both in terms of the number of announced deals and their respective aggregate value, would continue through 2006. As anticipated, domestic M&A activity has increased year-to-date (as of the end of the third quarter) over last year with 10% more announced transactions and a 13% increase in deal value. The underlying drivers had a lot of steam behind them, as 2005 ended with record levels of uninvested private equity capital and the general economic indicators were also pointing toward continued growth. The economy was like a freight train rolling down the tracks at 100 miles per hour, so there were few people willing to predict it would be able to slow down any time soon. Of course that will not stop us from taking credit for hitting the bulls eye with our prediction. Continuing on a three-year trend, average deal size is expected to increase again in 2006. This trend has been driven by not only an improving M&A environment, but also the growing size of mega-funds in the private equity world. The mega-funds, the largest of which is expected to exceed $20 billion by the end of 2006, are now large enough to swallow the proverbial whale. We also have a great deal of confidence in our outlook for 2007, so let’s see if we can do it again. The current momentum will be driven through at least the first half of 2007 by:
• Strategic acquirors continuing to seek growth opportunities through acquisitions as they focus on “buy” versus “build” strategies, primarily due to improved company performance, strong balance sheets and increased shareholder demands for growth;
• Financial buyers remaining aggressive due to significant uninvested capital and a healthy fundraising environment;
• Credit markets remaining liquid and lending at aggressive multiples; and
• Positive economic growth (domestic and international) along with inflation remaining in check and stability in the interest rate and commodity markets.
The second half of 2007, however, might reflect a typical season for the Chicago Cubs—early success leading to a lot of hope and hype through June … well, you know the rest. There are certainly risks surrounding the longevity of the bull run. The risks have been looming for the last 18 months—natural disasters, terrorist activity, consumer spending declines, pressure on the U.S. dollar, volatile and rising commodity prices, and political uncertainty relating to global conflicts. The core drivers of the M&A market, particularly those in the middle market, are intact for now and provide a strong base for continued momentum into 2007. Like the Cubs, the economy has a new general manager, Federal Reserve Bank Chairman, Ben Bernanke, and we are all hoping he is the guy to keep us in the game through October, and beyond. An informative and in-depth review and preview of the M&A market is included herein. Further, please see the appendix for select industry analyses of Piper Jaffray focus sectors. We hope you enjoy our insights, and we welcome your questions and comments.
December 2006
4 ⏐ PIPER JAFFRAY M&A INSIGHTS MIDDLE MARKET M&A OUTLOOK 2007
P A R T I : M & A A C T I V I T Y — “ A M A C R O L O O K ”
Introduction
The frenetic pace of M&A activity which has taken place over the past two years continued unabated during the first three quarters of 2006. Overall, 2006 M&A activity played out across a wide swath of industries and deal sizes as both buyers and sellers benefited from an abundance of available capital, strong business fundamentals and a supportive global economy. The surprise, however, has been the market’s tremendous resilience, despite the peaks in oil and other commodities, and the large move in short-term interest rates. The astounding magnitude of recent private equity fundraising is a clear indication the pace of mega-deals will not slow anytime soon. The small and middle market however, remain the driving force behind deal volume. These firms have a significantly higher beta than their mid- and large-cap brethren because they tend to be far less diversified. Moreover, small- to mid-size firms do not have access to the capital markets and as a result, are far more dependent on bank debt to support M&A activity. Therefore, the most likely factor to cause a weakening in M&A volume would be a credit tightening triggered by a macroeconomic slowdown. Nonetheless, a substantial overhang of uninvested private equity capital and healthy cash levels among the strategics will provide significant food to keep all the investment bankers and their clients fed for a while. While we expect the pace of M&A activity to continue well into 2007, the day of reckoning is coming. During the boom of the late 1990s we all bought a few tech stocks at 100 times 2010 revenue and forgot the old adage—pigs get fed and hogs get slaughtered. The market often forgets, but the tech bubble is not too far in the rear view mirror. This time investors have gotten smarter with their capital.
Worldwide M&A Activity M&A activity worldwide, through the first three quarters of 2006, totaled more than
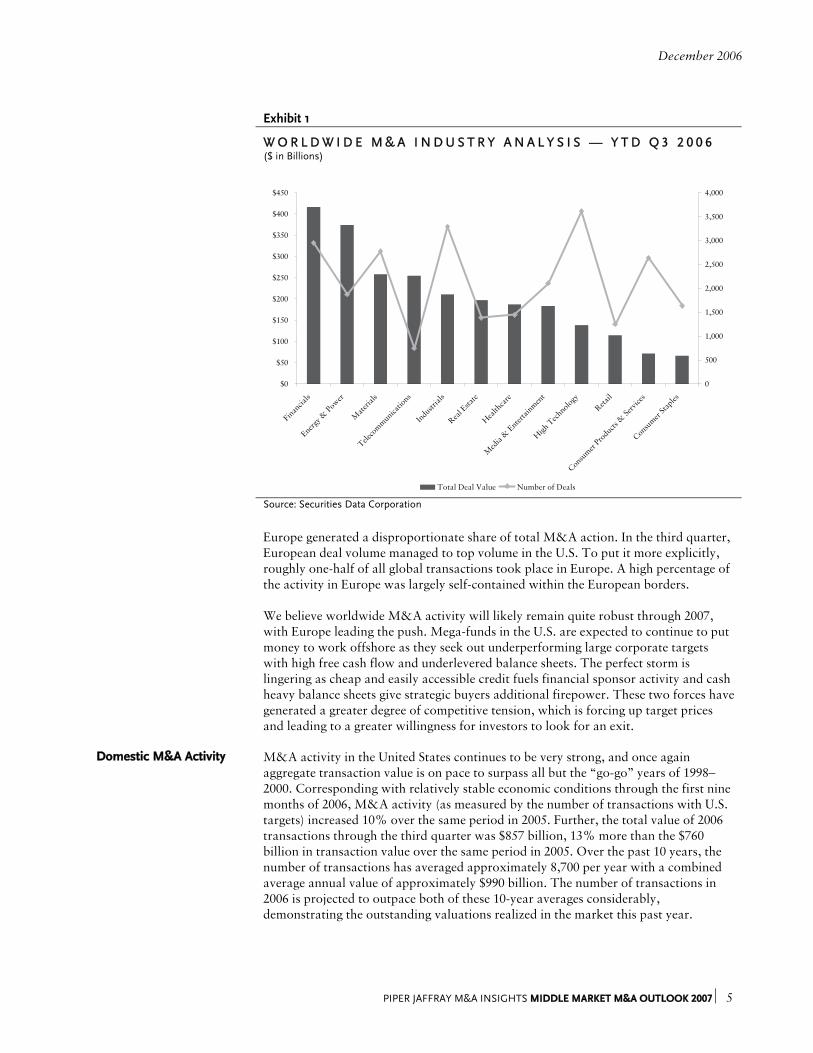
$2.4 trillion. Not surprisingly, the financial sector led the charge with $416 billion in total announced deal values, thus accounting for more than 16% of total value, which represents a 22% increase over the comparable 2005 period. Two strategic mega-deals (one in Europe and one in the U.S.) which certainly contributed to this involved Banca Intesa Spa and its pending $37.6 billion merger with San Paolo IMI Spa and the announced Wachovia marriage to Gold West Financial for $25.0 billion. To put these deals in perspective, the former was the fifth largest global deal announced during the first three quarters, while the latter fell into the number ten spot. The energy and power sector came in a formidable second place with more than $374 billion in total deal value led by the second largest announced global deal as EON AG attempts to takeover Endesa for a reported $57 billion. The material sector rounded out the top three; however, it easily took the most improved player award as the sector saw total deal value jump 104% and volume increase 8.3% over 2005 levels. From a volume perspective, the high-tech sector took the prize with 3,167 announced deals, the second consecutive year that the sector was the leader from an activity standpoint. Not since the bubble days of the late 1990s has technology M&A activity been so robust.
December 2006
PIPER JAFFRAY M&A INSIGHTS MIDDLE MARKET M&A OUTLOOK 2007 ⏐ 5
Exhibit 1
W O R L D W I D E M & A I N D U S T R Y A N A L Y S I S — Y T D Q 3 2 0 0 6 ($ in Billions)
$0
$50
$100
$150
$200
$250
$300
$350
$400
$450
Financia
ls
Energy &
Power
Mate
rials
Teleco
mmunicatio
ns
Industr
ials
Real E
state
Health
care
Med
ia &
Entertai
nment
High T
echnology
Retail
Consumer
Products
& Se
rvice
s
Consumer
Staples
0
500
1,000
1,500
2,000
2,500
3,000
3,500
4,000
Total Deal Value Number of Deals Source: Securities Data Corporation Europe generated a disproportionate share of total M&A action. In the third quarter,
European deal volume managed to top volume in the U.S. To put it more explicitly, roughly one-half of all global transactions took place in Europe. A high percentage of the activity in Europe was largely self-contained within the European borders. We believe worldwide M&A activity will likely remain quite robust through 2007, with Europe leading the push. Mega-funds in the U.S. are expected to continue to put money to work offshore as they seek out underperforming large corporate targets with high free cash flow and underlevered balance sheets. The perfect storm is lingering as cheap and easily accessible credit fuels financial sponsor activity and cash heavy balance sheets give strategic buyers additional firepower. These two forces have generated a greater degree of competitive tension, which is forcing up target prices and leading to a greater willingness for investors to look for an exit.
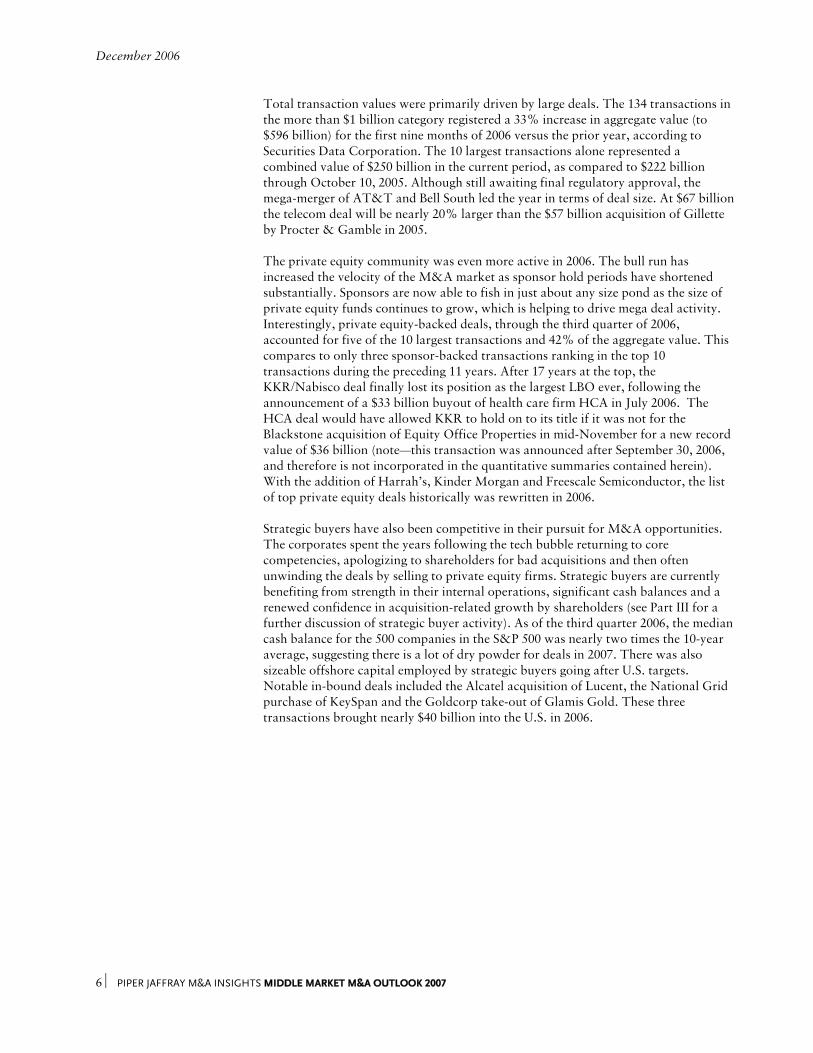
Domestic M&A Activity M&A activity in the United States continues to be very strong, and once again
aggregate transaction value is on pace to surpass all but the “go-go” years of 1998–2000. Corresponding with relatively stable economic conditions through the first nine months of 2006, M&A activity (as measured by the number of transactions with U.S. targets) increased 10% over the same period in 2005. Further, the total value of 2006 transactions through the third quarter was $857 billion, 13% more than the $760 billion in transaction value over the same period in 2005. Over the past 10 years, the number of transactions has averaged approximately 8,700 per year with a combined average annual value of approximately $990 billion. The number of transactions in 2006 is projected to outpace both of these 10-year averages considerably, demonstrating the outstanding valuations realized in the market this past year.
December 2006
6 ⏐ PIPER JAFFRAY M&A INSIGHTS MIDDLE MARKET M&A OUTLOOK 2007
Total transaction values were primarily driven by large deals. The 134 transactions in the more than $1 billion category registered a 33% increase in aggregate value (to $596 billion) for the first nine months of 2006 versus the prior year, according to Securities Data Corporation. The 10 largest transactions alone represented a combined value of $250 billion in the current period, as compared to $222 billion through October 10, 2005. Although still awaiting final regulatory approval, the mega-merger of AT&T and Bell South led the year in terms of deal size. At $67 billion the telecom deal will be nearly 20% larger than the $57 billion acquisition of Gillette by Procter & Gamble in 2005. The private equity community was even more active in 2006. The bull run has increased the velocity of the M&A market as sponsor hold periods have shortened substantially. Sponsors are now able to fish in just about any size pond as the size of private equity funds continues to grow, which is helping to drive mega deal activity. Interestingly, private equity-backed deals, through the third quarter of 2006, accounted for five of the 10 largest transactions and 42% of the aggregate value. This compares to only three sponsor-backed transactions ranking in the top 10 transactions during the preceding 11 years. After 17 years at the top, the KKR/Nabisco deal finally lost its position as the largest LBO ever, following the announcement of a $33 billion buyout of health care firm HCA in July 2006. The HCA deal would have allowed KKR to hold on to its title if it was not for the Blackstone acquisition of Equity Office Properties in mid-November for a new record value of $36 billion (note—this transaction was announced after September 30, 2006, and therefore is not incorporated in the quantitative summaries contained herein). With the addition of Harrah’s, Kinder Morgan and Freescale Semiconductor, the list of top private equity deals historically was rewritten in 2006. Strategic buyers have also been competitive in their pursuit for M&A opportunities. The corporates spent the years following the tech bubble returning to core competencies, apologizing to shareholders for bad acquisitions and then often unwinding the deals by selling to private equity firms. Strategic buyers are currently benefiting from strength in their internal operations, significant cash balances and a renewed confidence in acquisition-related growth by shareholders (see Part III for a further discussion of strategic buyer activity). As of the third quarter 2006, the median cash balance for the 500 companies in the S&P 500 was nearly two times the 10-year average, suggesting there is a lot of dry powder for deals in 2007. There was also sizeable offshore capital employed by strategic buyers going after U.S. targets. Notable in-bound deals included the Alcatel acquisition of Lucent, the National Grid purchase of KeySpan and the Goldcorp take-out of Glamis Gold. These three transactions brought nearly $40 billion into the U.S. in 2006.
December 2006
PIPER JAFFRAY M&A INSIGHTS MIDDLE MARKET M&A OUTLOOK 2007 ⏐ 7
Exhibit 2
U . S . M & A A C T I V I T Y ($ in Billions)
$0
$400
$800
$1,200
$1,600
1990 1991 1992 1993 1994 1995 1996 1997 1998 1999 2000 2001 2002 2003 2004 2005 YTD Q3
2005
YTD Q3
2006
0
3,000
6,000
9,000
12,000
15,000
Total Reported Deal Values Number of Deals Source: Securities Data Corporation
Middle Market M&A Activity
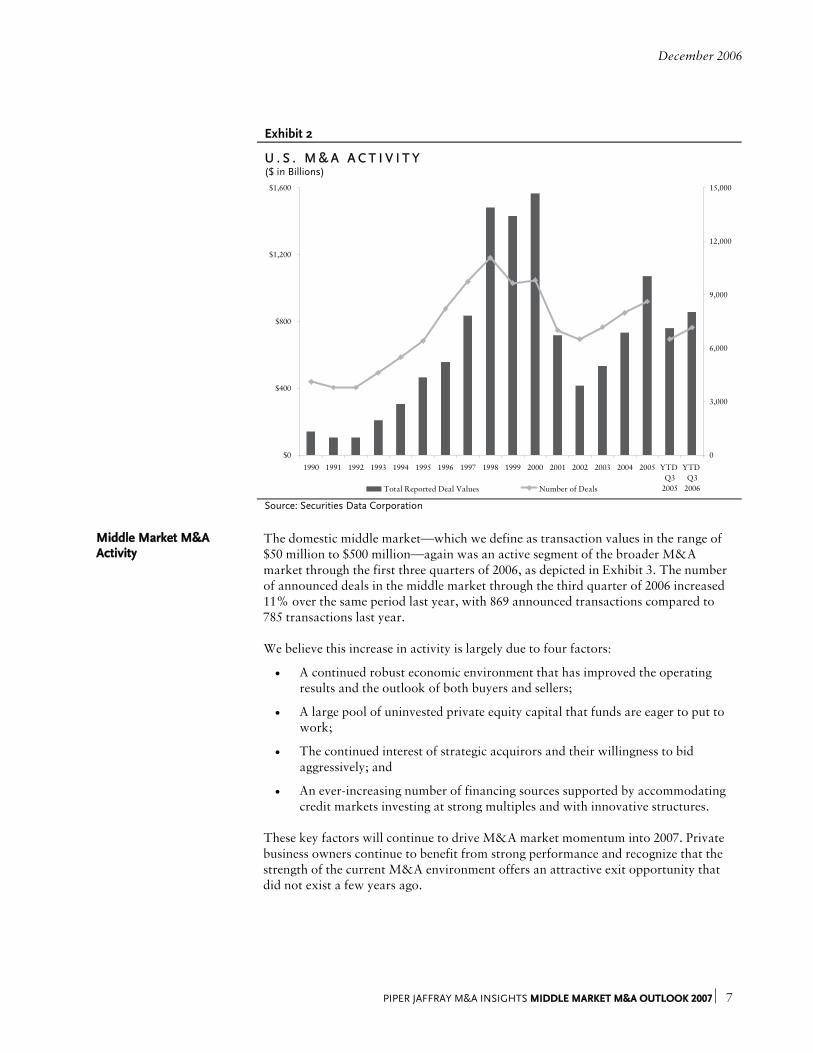
The domestic middle market—which we define as transaction values in the range of $50 million to $500 million—again was an active segment of the broader M&A market through the first three quarters of 2006, as depicted in Exhibit 3. The number of announced deals in the middle market through the third quarter of 2006 increased 11% over the same period last year, with 869 announced transactions compared to 785 transactions last year. We believe this increase in activity is largely due to four factors:
• A continued robust economic environment that has improved the operating results and the outlook of both buyers and sellers;
• A large pool of uninvested private equity capital that funds are eager to put to work;
• The continued interest of strategic acquirors and their willingness to bid aggressively; and
• An ever-increasing number of financing sources supported by accommodating credit markets investing at strong multiples and with innovative structures.
These key factors will continue to drive M&A market momentum into 2007. Private business owners continue to benefit from strong performance and recognize that the strength of the current M&A environment offers an attractive exit opportunity that did not exist a few years ago.
December 2006
8 ⏐ PIPER JAFFRAY M&A INSIGHTS MIDDLE MARKET M&A OUTLOOK 2007
Exhibit 3
U . S . M I D D L E M A R K E T M & A A C T I V I T Y ($ in Billions)
$0
$50
$100
$150
$200
$250
1990 1991 1992 1993 1994 1995 1996 1997 1998 1999 2000 2001 2002 2003 2004 2005 YTD Q3
2005
YTD Q3
2006
0
400
800
1,200
1,600
2,000
Total Reported Deal Values Number of Deals Source: Securities Data Corporation
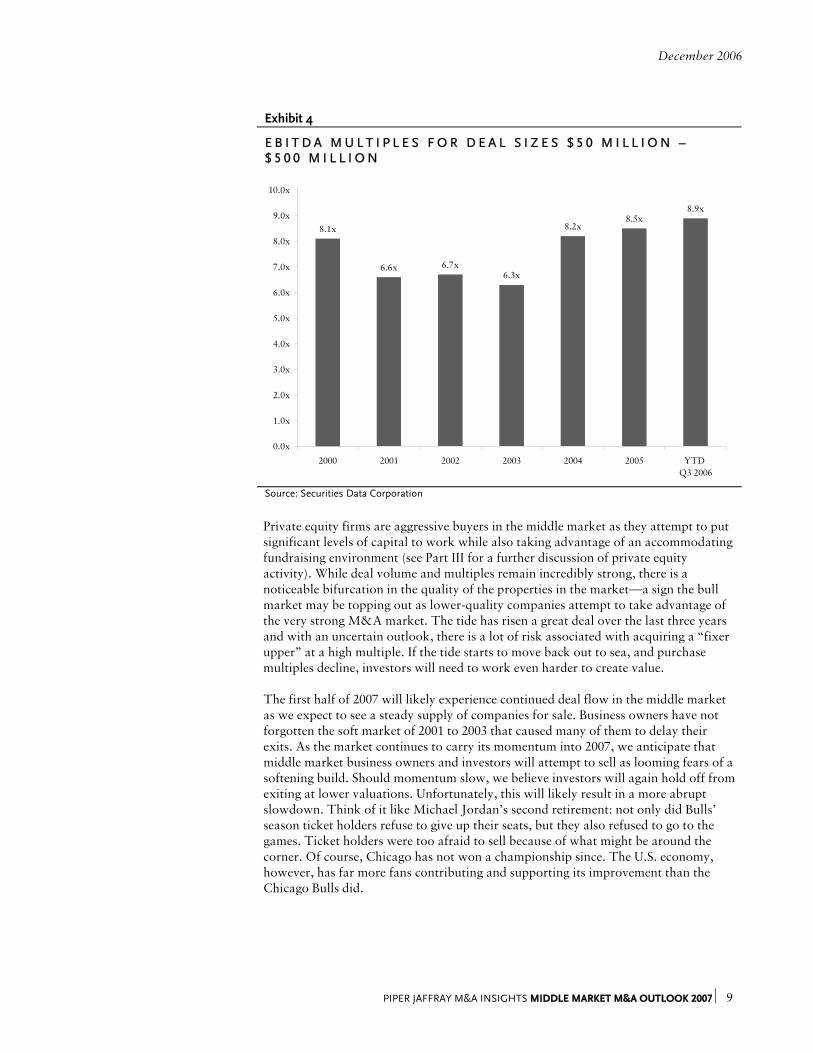
The significant activity clearly has not led to excess supply. Despite all the transaction
volume in the middle market, deal multiples continue to rise to their highest level yet. For reported transactions, the median EBITDA multiple reached 8.9x through the third quarter of 2006, nearly a half turn higher than 2005, as illustrated in Exhibit 4.
December 2006
PIPER JAFFRAY M&A INSIGHTS MIDDLE MARKET M&A OUTLOOK 2007 ⏐ 9
Exhibit 4
E B I T D A M U L T I P L E S F O R D E A L S I Z E S $ 5 0 M I L L I O N – $ 5 0 0 M I L L I O N
8.1x
6.6x 6.7x6.3x
8.2x8.5x
8.9x
0.0x
1.0x
2.0x
3.0x
4.0x
5.0x
6.0x
7.0x
8.0x
9.0x
10.0x
2000 2001 2002 2003 2004 2005 YTD Q3 2006
Source: Securities Data Corporation
Private equity firms are aggressive buyers in the middle market as they attempt to put
significant levels of capital to work while also taking advantage of an accommodating fundraising environment (see Part III for a further discussion of private equity activity). While deal volume and multiples remain incredibly strong, there is a noticeable bifurcation in the quality of the properties in the market—a sign the bull market may be topping out as lower-quality companies attempt to take advantage of the very strong M&A market. The tide has risen a great deal over the last three years and with an uncertain outlook, there is a lot of risk associated with acquiring a “fixer upper” at a high multiple. If the tide starts to move back out to sea, and purchase multiples decline, investors will need to work even harder to create value. The first half of 2007 will likely experience continued deal flow in the middle market as we expect to see a steady supply of companies for sale. Business owners have not forgotten the soft market of 2001 to 2003 that caused many of them to delay their exits. As the market continues to carry its momentum into 2007, we anticipate that middle market business owners and investors will attempt to sell as looming fears of a softening build. Should momentum slow, we believe investors will again hold off from exiting at lower valuations. Unfortunately, this will likely result in a more abrupt slowdown. Think of it like Michael Jordan’s second retirement: not only did Bulls’ season ticket holders refuse to give up their seats, but they also refused to go to the games. Ticket holders were too afraid to sell because of what might be around the corner. Of course, Chicago has not won a championship since. The U.S. economy, however, has far more fans contributing and supporting its improvement than the Chicago Bulls did.
December 2006
10 ⏐ PIPER JAFFRAY M&A INSIGHTS MIDDLE MARKET M&A OUTLOOK 2007
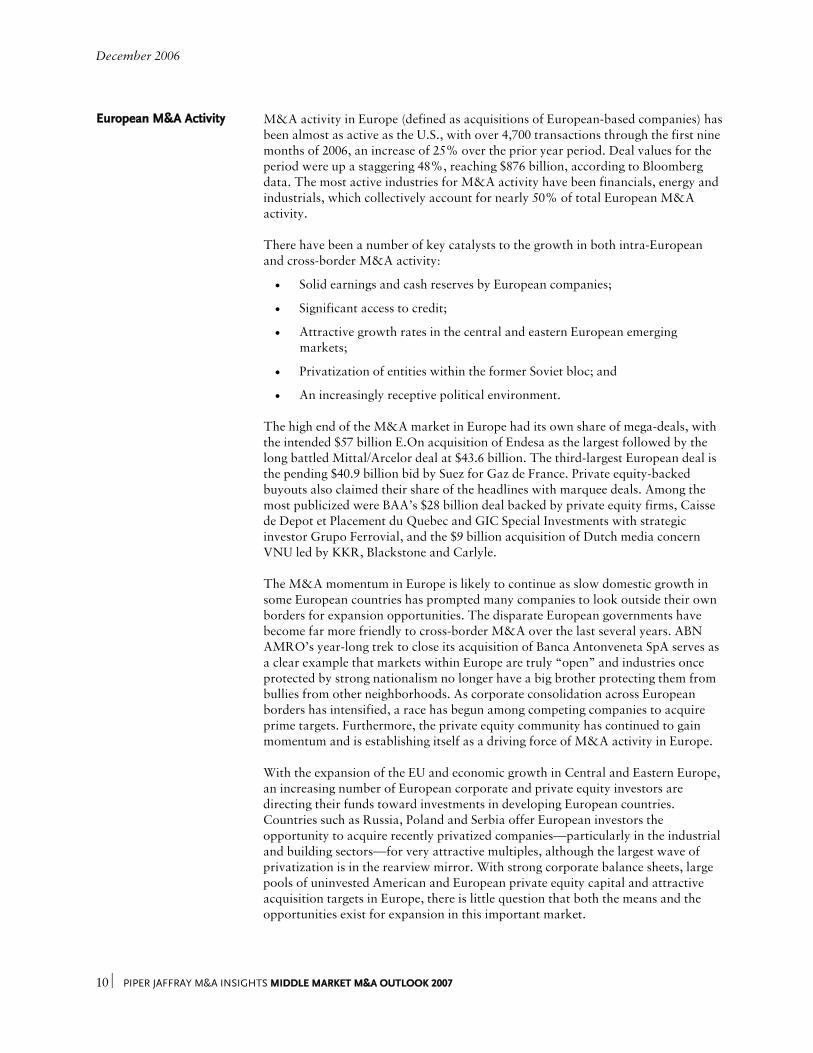
European M&A Activity M&A activity in Europe (defined as acquisitions of European-based companies) has
been almost as active as the U.S., with over 4,700 transactions through the first nine months of 2006, an increase of 25% over the prior year period. Deal values for the period were up a staggering 48%, reaching $876 billion, according to Bloomberg data. The most active industries for M&A activity have been financials, energy and industrials, which collectively account for nearly 50% of total European M&A activity. There have been a number of key catalysts to the growth in both intra-European and cross-border M&A activity:
• Solid earnings and cash reserves by European companies;
• Significant access to credit;
• Attractive growth rates in the central and eastern European emerging markets;
• Privatization of entities within the former Soviet bloc; and
• An increasingly receptive political environment. The high end of the M&A market in Europe had its own share of mega-deals, with the intended $57 billion E.On acquisition of Endesa as the largest followed by the long battled Mittal/Arcelor deal at $43.6 billion. The third-largest European deal is the pending $40.9 billion bid by Suez for Gaz de France. Private equity-backed buyouts also claimed their share of the headlines with marquee deals. Among the most publicized were BAA’s $28 billion deal backed by private equity firms, Caisse de Depot et Placement du Quebec and GIC Special Investments with strategic investor Grupo Ferrovial, and the $9 billion acquisition of Dutch media concern VNU led by KKR, Blackstone and Carlyle. The M&A momentum in Europe is likely to continue as slow domestic growth in some European countries has prompted many companies to look outside their own borders for expansion opportunities. The disparate European governments have become far more friendly to cross-border M&A over the last several years. ABN AMRO’s year-long trek to close its acquisition of Banca Antonveneta SpA serves as a clear example that markets within Europe are truly “open” and industries once protected by strong nationalism no longer have a big brother protecting them from bullies from other neighborhoods. As corporate consolidation across European borders has intensified, a race has begun among competing companies to acquire prime targets. Furthermore, the private equity community has continued to gain momentum and is establishing itself as a driving force of M&A activity in Europe. With the expansion of the EU and economic growth in Central and Eastern Europe, an increasing number of European corporate and private equity investors are directing their funds toward investments in developing European countries. Countries such as Russia, Poland and Serbia offer European investors the opportunity to acquire recently privatized companies—particularly in the industrial and building sectors—for very attractive multiples, although the largest wave of privatization is in the rearview mirror. With strong corporate balance sheets, large pools of uninvested American and European private equity capital and attractive acquisition targets in Europe, there is little question that both the means and the opportunities exist for expansion in this important market.
December 2006
PIPER JAFFRAY M&A INSIGHTS MIDDLE MARKET M&A OUTLOOK 2007 ⏐ 11
Exhibit 5
E U R O P E A N M & A A C T I V I T Y ($ in Billions)
$0
$100
$200
$300
$400
$500
$600
$700
$800
$900
$1,000
1997 1998 1999 2000 2001 2002 2003 2004 2005 YTD Q3 2005
YTD Q3 2006
0
1,000
2,000
3,000
4,000
5,000
6,000
7,000
8,000
9,000
10,000
Total Reported Deal Values Number of Deals
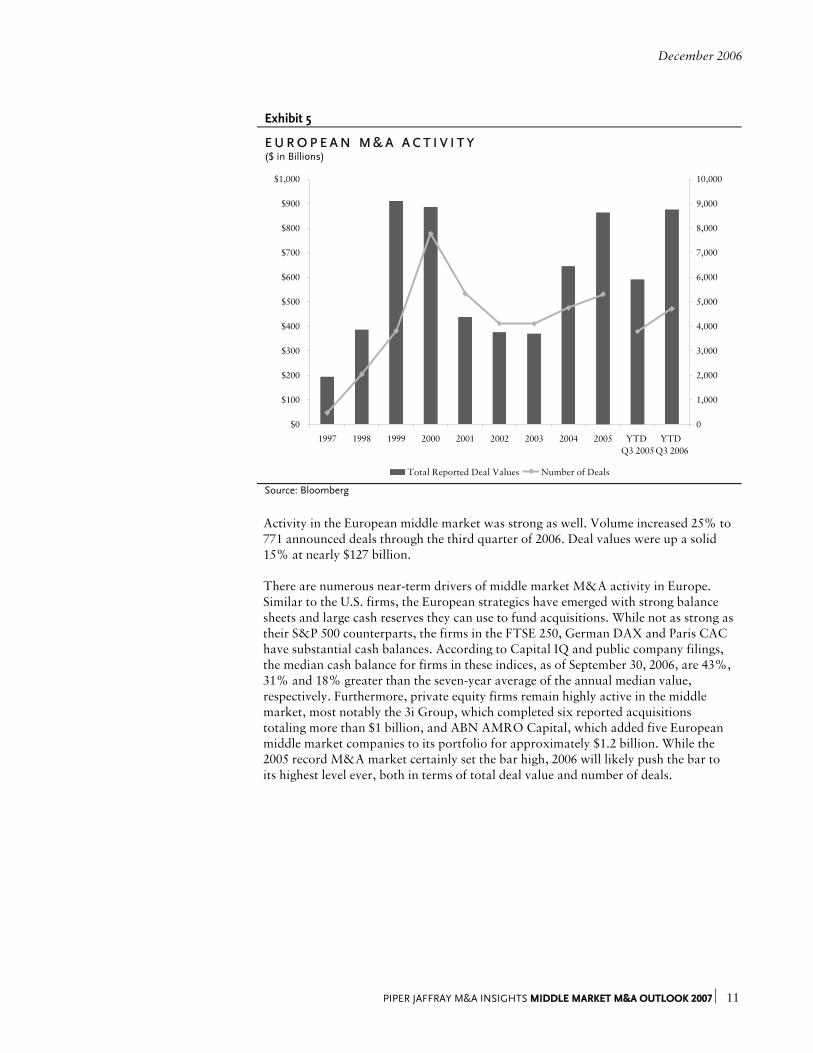
Source: Bloomberg Activity in the European middle market was strong as well. Volume increased 25% to
771 announced deals through the third quarter of 2006. Deal values were up a solid 15% at nearly $127 billion. There are numerous near-term drivers of middle market M&A activity in Europe. Similar to the U.S. firms, the European strategics have emerged with strong balance sheets and large cash reserves they can use to fund acquisitions. While not as strong as their S&P 500 counterparts, the firms in the FTSE 250, German DAX and Paris CAC have substantial cash balances. According to Capital IQ and public company filings, the median cash balance for firms in these indices, as of September 30, 2006, are 43%, 31% and 18% greater than the seven-year average of the annual median value, respectively. Furthermore, private equity firms remain highly active in the middle market, most notably the 3i Group, which completed six reported acquisitions totaling more than $1 billion, and ABN AMRO Capital, which added five European middle market companies to its portfolio for approximately $1.2 billion. While the 2005 record M&A market certainly set the bar high, 2006 will likely push the bar to its highest level ever, both in terms of total deal value and number of deals.
December 2006
12 ⏐ PIPER JAFFRAY M&A INSIGHTS MIDDLE MARKET M&A OUTLOOK 2007
Exhibit 6
E U R O P E A N M I D D L E M A R K E T M & A A C T I V I T Y ($ in Billions)
$0
$25
$50
$75
$100
$125
$150
$175
1997 1998 1999 2000 2001 2002 2003 2004 2005 YTD Q3 2005
YTD Q3 2006
0
200
400
600
800
1,000
1,200
Total Reported Deal Values Number of Deals
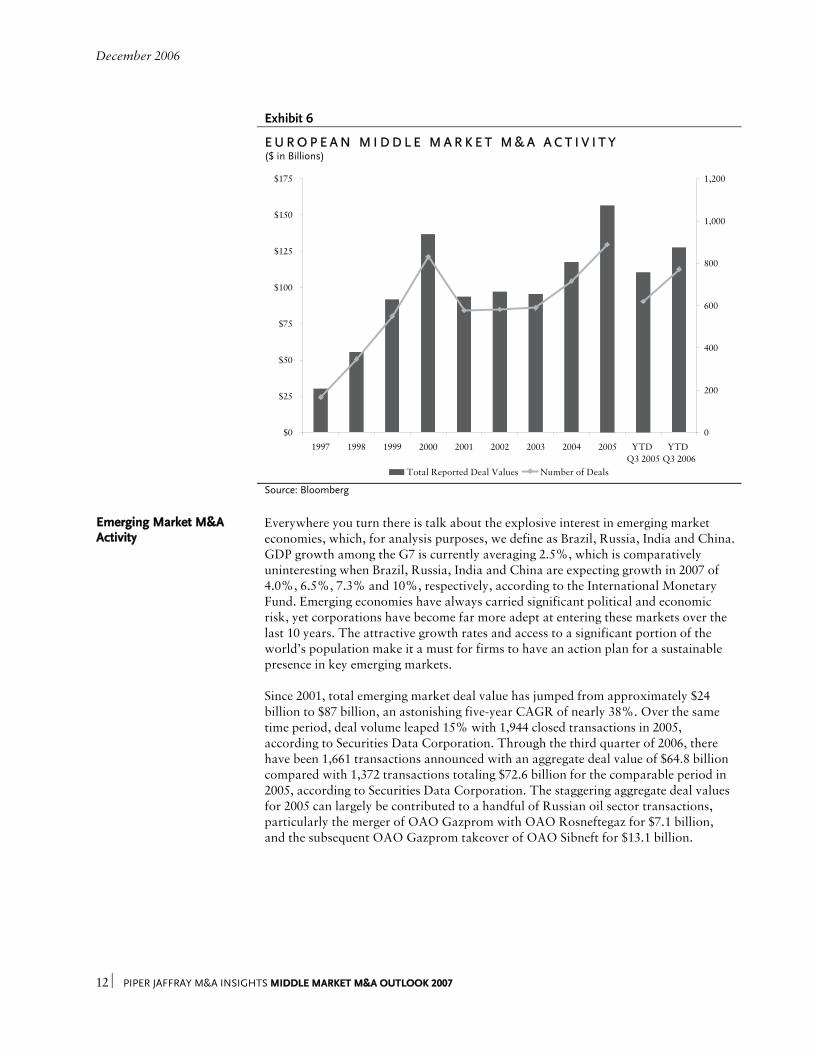
Source: Bloomberg Emerging Market M&A Activity
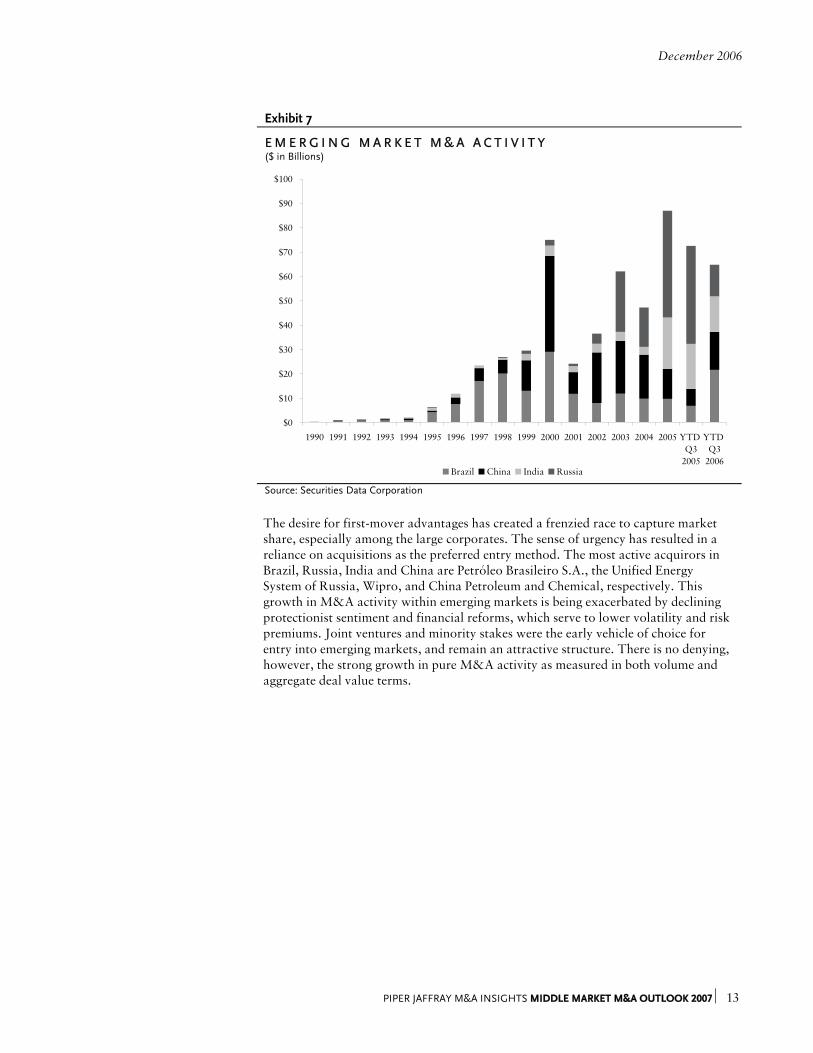
Everywhere you turn there is talk about the explosive interest in emerging market economies, which, for analysis purposes, we define as Brazil, Russia, India and China. GDP growth among the G7 is currently averaging 2.5%, which is comparatively uninteresting when Brazil, Russia, India and China are expecting growth in 2007 of 4.0%, 6.5%, 7.3% and 10%, respectively, according to the International Monetary Fund. Emerging economies have always carried significant political and economic risk, yet corporations have become far more adept at entering these markets over the last 10 years. The attractive growth rates and access to a significant portion of the world’s population make it a must for firms to have an action plan for a sustainable presence in key emerging markets. Since 2001, total emerging market deal value has jumped from approximately $24 billion to $87 billion, an astonishing five-year CAGR of nearly 38%. Over the same time period, deal volume leaped 15% with 1,944 closed transactions in 2005, according to Securities Data Corporation. Through the third quarter of 2006, there have been 1,661 transactions announced with an aggregate deal value of $64.8 billion compared with 1,372 transactions totaling $72.6 billion for the comparable period in 2005, according to Securities Data Corporation. The staggering aggregate deal values for 2005 can largely be contributed to a handful of Russian oil sector transactions, particularly the merger of OAO Gazprom with OAO Rosneftegaz for $7.1 billion, and the subsequent OAO Gazprom takeover of OAO Sibneft for $13.1 billion.
December 2006
PIPER JAFFRAY M&A INSIGHTS MIDDLE MARKET M&A OUTLOOK 2007 ⏐ 13
Exhibit 7
E M E R G I N G M A R K E T M & A A C T I V I T Y ($ in Billions)
$0
$10
$20
$30
$40
$50
$60
$70
$80
$90
$100
1990 1991 1992 1993 1994 1995 1996 1997 1998 1999 2000 2001 2002 2003 2004 2005 YTD Q3
2005
YTD Q3
2006Brazil China India Russia
Source: Securities Data Corporation
The desire for first-mover advantages has created a frenzied race to capture market
share, especially among the large corporates. The sense of urgency has resulted in a reliance on acquisitions as the preferred entry method. The most active acquirors in Brazil, Russia, India and China are Petróleo Brasileiro S.A., the Unified Energy System of Russia, Wipro, and China Petroleum and Chemical, respectively. This growth in M&A activity within emerging markets is being exacerbated by declining protectionist sentiment and financial reforms, which serve to lower volatility and risk premiums. Joint ventures and minority stakes were the early vehicle of choice for entry into emerging markets, and remain an attractive structure. There is no denying, however, the strong growth in pure M&A activity as measured in both volume and aggregate deal value terms.
December 2006
14 ⏐ PIPER JAFFRAY M&A INSIGHTS MIDDLE MARKET M&A OUTLOOK 2007
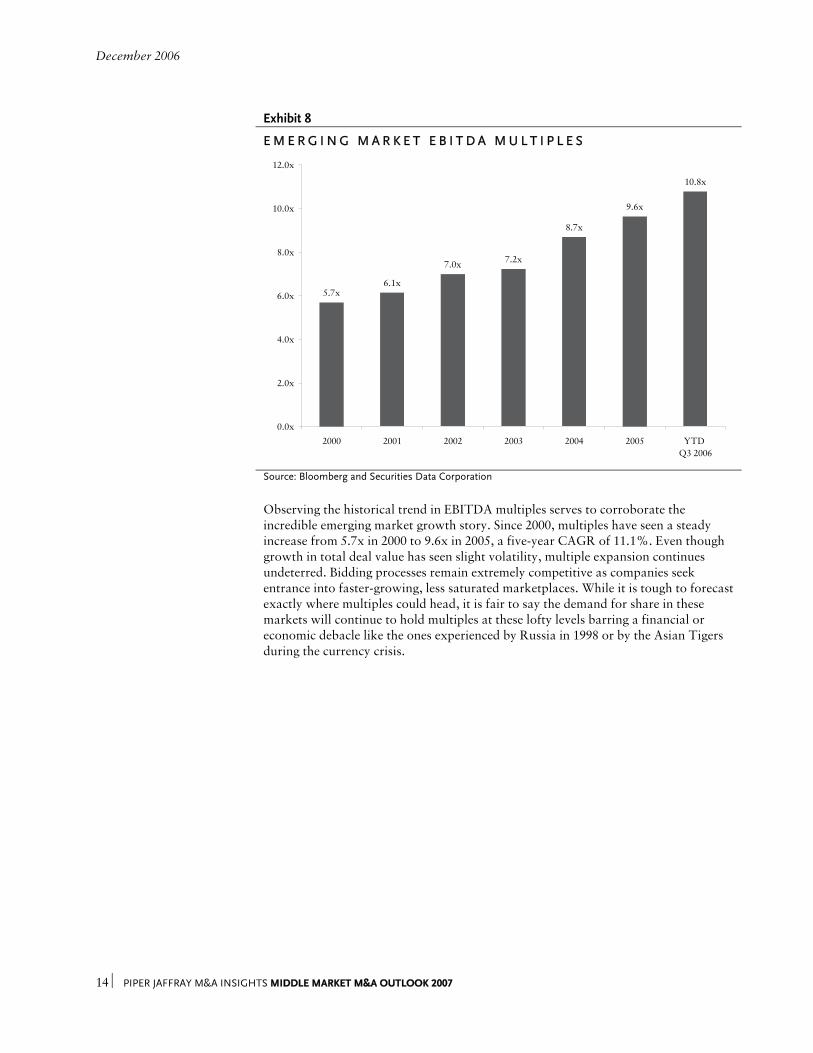
Exhibit 8
E M E R G I N G M A R K E T E B I T D A M U L T I P L E S
5.7x6.1x
7.0x 7.2x
8.7x
9.6x
10.8x
0.0x
2.0x
4.0x
6.0x
8.0x
10.0x
12.0x
2000 2001 2002 2003 2004 2005 YTD Q3 2006
Source: Bloomberg and Securities Data Corporation
Observing the historical trend in EBITDA multiples serves to corroborate the
incredible emerging market growth story. Since 2000, multiples have seen a steady increase from 5.7x in 2000 to 9.6x in 2005, a five-year CAGR of 11.1%. Even though growth in total deal value has seen slight volatility, multiple expansion continues undeterred. Bidding processes remain extremely competitive as companies seek entrance into faster-growing, less saturated marketplaces. While it is tough to forecast exactly where multiples could head, it is fair to say the demand for share in these markets will continue to hold multiples at these lofty levels barring a financial or economic debacle like the ones experienced by Russia in 1998 or by the Asian Tigers during the currency crisis.
December 2006
PIPER JAFFRAY M&A INSIGHTS MIDDLE MARKET M&A OUTLOOK 2007 ⏐ 15
P A R T I I : C A P I T A L M A R K E T S
Introduction
The debt and equity capital markets have a significant impact on M&A activity. The debt markets have remained aggressive and have provided ready capital to support corporate and private equity investor buyouts. Conversely, the equity capital markets offer an alternative exit strategy to a negotiated sale for investors, which takes supply out of the M&A market in the short run. In the long run, however, corporate buyers with ready access to the equity markets can use their stock as currency to foster an increase in M&A. IPO activity in 2006 has continued at a healthy clip from 2005, although it’s down slightly from 2005, and there is a strong backlog of issuances that indicates the early part of 2007 will be active.
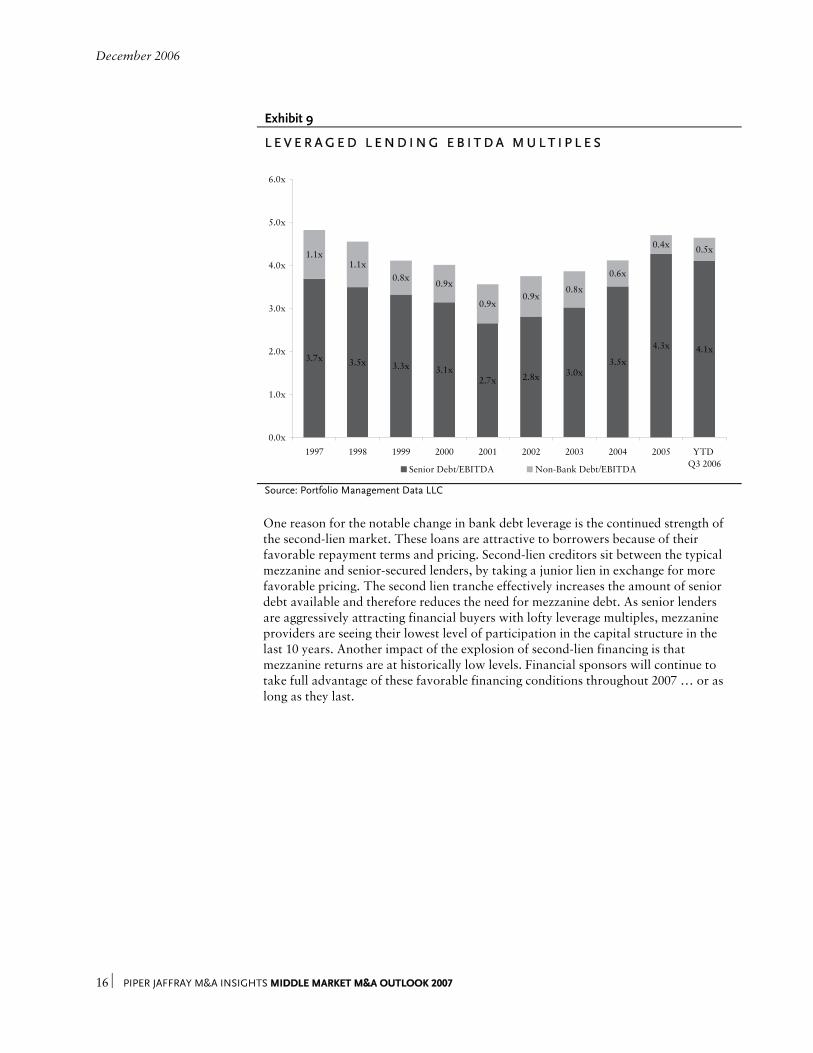
Debt Markets The debt markets have remained strong in 2006 after particularly active years in 2004 and 2005. Sustained improvement in corporate performance has made both bank and high-yield debt available at favorable terms. A significant number of alternative, nonregulated financing sources (aka, hedge funds) have provided a considerable supply of debt capital to the marketplace. This supply has fostered a very competitive and aggressive environment for lenders and provided the much-needed fuel for the buyout fire. Due to the overall strength of the financing environment, we believe that private equity firms will remain competitive and strategic buyers will continue to make acquisitions well into 2007. While total debt multiples were down slightly from the previous year, average senior debt multiples employed in transactions remained at historically high levels, holding above four times EBITDA, while average mezzanine debt multiples strengthened slightly. Another driver in the debt markets over recent years has been the emergence of alternative providers of debt capital, including hedge funds and private investors. Over the last four years there has been a significant increase in collateralized debt/loan obligation funds (“CDOs” or “CLOs”) that have created a liquid market for otherwise illiquid bank loans. The onset of these investment vehicles and the resulting liquidity and trading activity have enabled hedge funds and other alternative sources of capital to invest in middle market firms. These alternative lenders are not faced with the same regulatory oversight of commercial banks and, as a result, they can take on significantly more risk and even view the debt through the eyes of a future equity holder if things go south. The hawkish Federal Reserve policy has led to an attractive coupon of more than 8% on a typical senior secured leveraged loan, which is amplified by the impact of the yield curve compression on corporate bond pricing. Moreover, the fact that middle market leveraged loans are not registered securities and therefore do not come under the purview of Sarbanes-Oxley and SEC reporting requirements, makes the asset class attractive to issuers. The additional influx of willing lenders will continue to support the favorable environment.
December 2006
16 ⏐ PIPER JAFFRAY M&A INSIGHTS MIDDLE MARKET M&A OUTLOOK 2007
Exhibit 9
L E V E R A G E D L E N D I N G E B I T D A M U L T I P L E S
3.7x 3.5x 3.3x 3.1x2.7x 2.8x 3.0x
3.5x
4.3x 4.1x
1.1x1.1x
0.8x0.9x
0.9x0.9x
0.8x
0.6x
0.4x 0.5x
0.0x
1.0x
2.0x
3.0x
4.0x
5.0x
6.0x
1997 1998 1999 2000 2001 2002 2003 2004 2005 YTD Q3 2006Senior Debt/EBITDA Non-Bank Debt/EBITDA
Source: Portfolio Management Data LLC
One reason for the notable change in bank debt leverage is the continued strength of
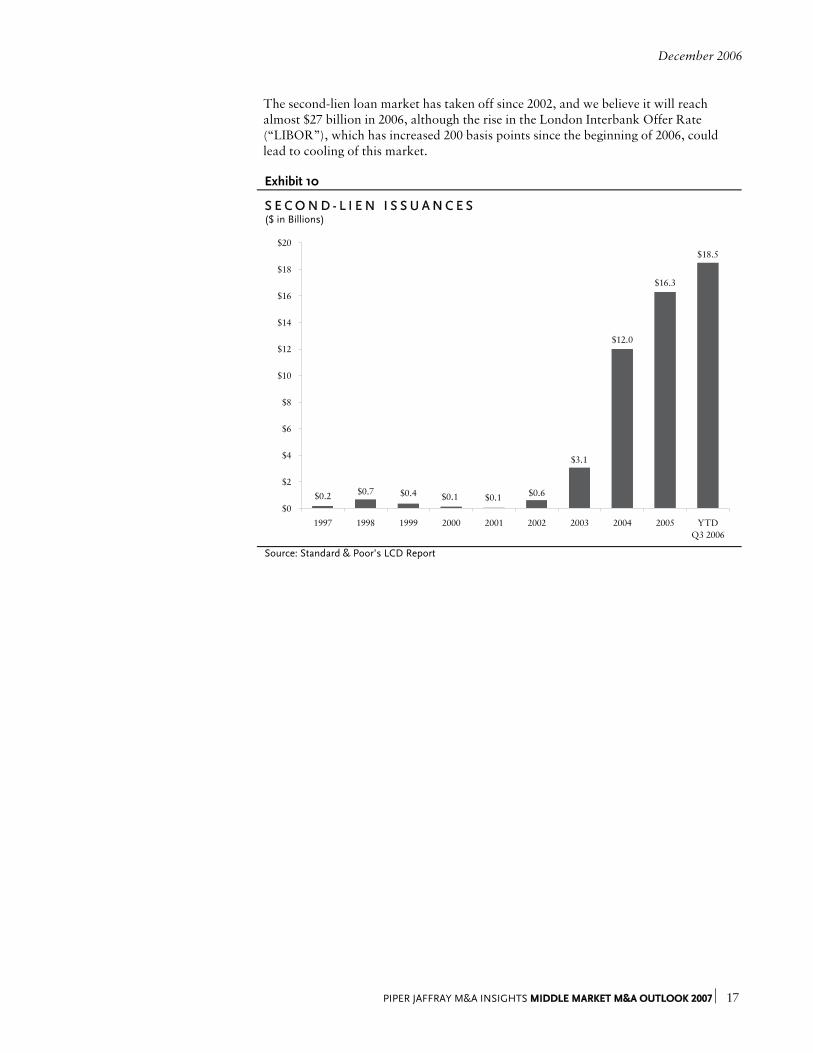
the second-lien market. These loans are attractive to borrowers because of their favorable repayment terms and pricing. Second-lien creditors sit between the typical mezzanine and senior-secured lenders, by taking a junior lien in exchange for more favorable pricing. The second lien tranche effectively increases the amount of senior debt available and therefore reduces the need for mezzanine debt. As senior lenders are aggressively attracting financial buyers with lofty leverage multiples, mezzanine providers are seeing their lowest level of participation in the capital structure in the last 10 years. Another impact of the explosion of second-lien financing is that mezzanine returns are at historically low levels. Financial sponsors will continue to take full advantage of these favorable financing conditions throughout 2007 … or as long as they last.
December 2006
PIPER JAFFRAY M&A INSIGHTS MIDDLE MARKET M&A OUTLOOK 2007 ⏐ 17
The second-lien loan market has taken off since 2002, and we believe it will reach almost $27 billion in 2006, although the rise in the London Interbank Offer Rate (“LIBOR”), which has increased 200 basis points since the beginning of 2006, could lead to cooling of this market.
Exhibit 10
S E C O N D - L I E N I S S U A N C E S ($ in Billions)
$3.1
$0.2 $0.7 $0.4 $0.1 $0.1 $0.6
$12.0
$16.3
$18.5
$0
$2
$4
$6
$8
$10
$12
$14
$16
$18
$20
1997 1998 1999 2000 2001 2002 2003 2004 2005 YTDQ3 2006
Source: Standard & Poor’s LCD Report
December 2006
18 ⏐ PIPER JAFFRAY M&A INSIGHTS MIDDLE MARKET M&A OUTLOOK 2007
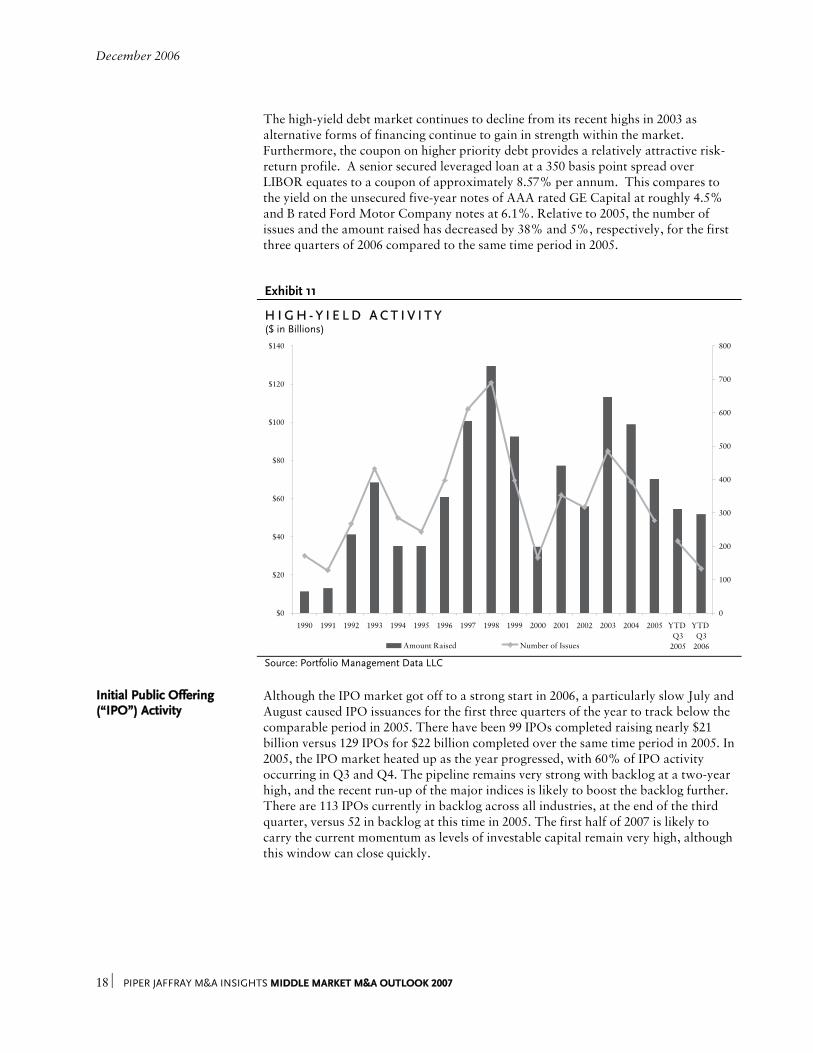
The high-yield debt market continues to decline from its recent highs in 2003 as
alternative forms of financing continue to gain in strength within the market. Furthermore, the coupon on higher priority debt provides a relatively attractive risk-return profile. A senior secured leveraged loan at a 350 basis point spread over LIBOR equates to a coupon of approximately 8.57% per annum. This compares to the yield on the unsecured five-year notes of AAA rated GE Capital at roughly 4.5% and B rated Ford Motor Company notes at 6.1%. Relative to 2005, the number of issues and the amount raised has decreased by 38% and 5%, respectively, for the first three quarters of 2006 compared to the same time period in 2005.
Exhibit 11
H I G H - Y I E L D A C T I V I T Y ($ in Billions)
$0
$20
$40
$60
$80
$100
$120
$140
1990 1991 1992 1993 1994 1995 1996 1997 1998 1999 2000 2001 2002 2003 2004 2005 YTD Q3
2005
YTD Q3
2006
0
100
200
300
400
500
600
700
800
Amount Raised Number of Issues
Source: Portfolio Management Data LLC Initial Public Offering (“IPO”) Activity
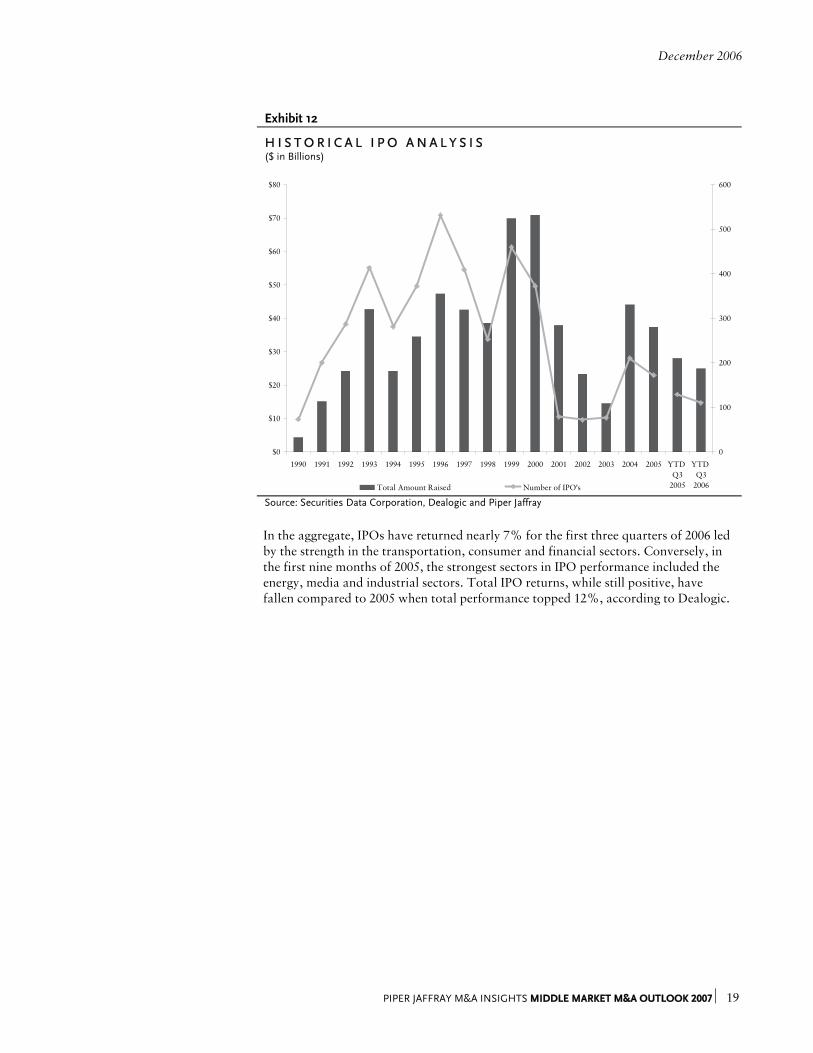
Although the IPO market got off to a strong start in 2006, a particularly slow July and August caused IPO issuances for the first three quarters of the year to track below the comparable period in 2005. There have been 99 IPOs completed raising nearly $21 billion versus 129 IPOs for $22 billion completed over the same time period in 2005. In 2005, the IPO market heated up as the year progressed, with 60% of IPO activity occurring in Q3 and Q4. The pipeline remains very strong with backlog at a two-year high, and the recent run-up of the major indices is likely to boost the backlog further. There are 113 IPOs currently in backlog across all industries, at the end of the third quarter, versus 52 in backlog at this time in 2005. The first half of 2007 is likely to carry the current momentum as levels of investable capital remain very high, although this window can close quickly.
December 2006
PIPER JAFFRAY M&A INSIGHTS MIDDLE MARKET M&A OUTLOOK 2007 ⏐ 19
Exhibit 12
H I S T O R I C A L I P O A N A L Y S I S ($ in Billions)
$0
$10
$20
$30
$40
$50
$60
$70
$80
1990 1991 1992 1993 1994 1995 1996 1997 1998 1999 2000 2001 2002 2003 2004 2005 YTD Q3
2005
YTD Q3
2006
0
100
200
300
400
500
600
Total Amount Raised Number of IPO's Source: Securities Data Corporation, Dealogic and Piper Jaffray
In the aggregate, IPOs have returned nearly 7% for the first three quarters of 2006 led
by the strength in the transportation, consumer and financial sectors. Conversely, in the first nine months of 2005, the strongest sectors in IPO performance included the energy, media and industrial sectors. Total IPO returns, while still positive, have fallen compared to 2005 when total performance topped 12%, according to Dealogic.
December 2006
20 ⏐ PIPER JAFFRAY M&A INSIGHTS MIDDLE MARKET M&A OUTLOOK 2007
Exhibit 13
I P O A N A L Y S I S B Y S E C T O R — Y T D Q 3 2 0 0 6 ($ in Millions)
Number of
IPOs Amount Offered YTD Q3 2006 Performance
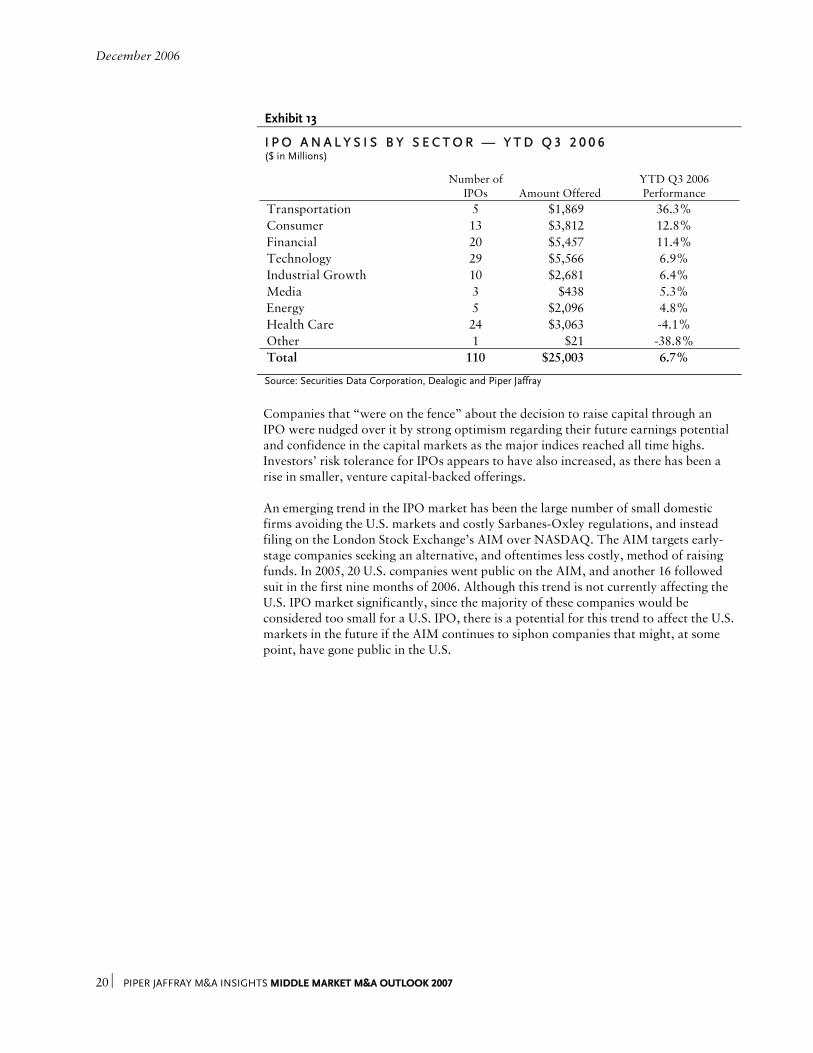
Transportation 5 $1,869 36.3% Consumer 13 $3,812 12.8% Financial 20 $5,457 11.4% Technology 29 $5,566 6.9% Industrial Growth 10 $2,681 6.4% Media 3 $438 5.3% Energy 5 $2,096 4.8% Health Care 24 $3,063 -4.1% Other 1 $21 -38.8% Total 110 $25,003 6.7%
Source: Securities Data Corporation, Dealogic and Piper Jaffray
Companies that “were on the fence” about the decision to raise capital through an IPO were nudged over it by strong optimism regarding their future earnings potential and confidence in the capital markets as the major indices reached all time highs. Investors’ risk tolerance for IPOs appears to have also increased, as there has been a rise in smaller, venture capital-backed offerings. An emerging trend in the IPO market has been the large number of small domestic firms avoiding the U.S. markets and costly Sarbanes-Oxley regulations, and instead filing on the London Stock Exchange’s AIM over NASDAQ. The AIM targets early-stage companies seeking an alternative, and oftentimes less costly, method of raising funds. In 2005, 20 U.S. companies went public on the AIM, and another 16 followed suit in the first nine months of 2006. Although this trend is not currently affecting the U.S. IPO market significantly, since the majority of these companies would be considered too small for a U.S. IPO, there is a potential for this trend to affect the U.S. markets in the future if the AIM continues to siphon companies that might, at some point, have gone public in the U.S.
December 2006
PIPER JAFFRAY M&A INSIGHTS MIDDLE MARKET M&A OUTLOOK 2007 ⏐ 21
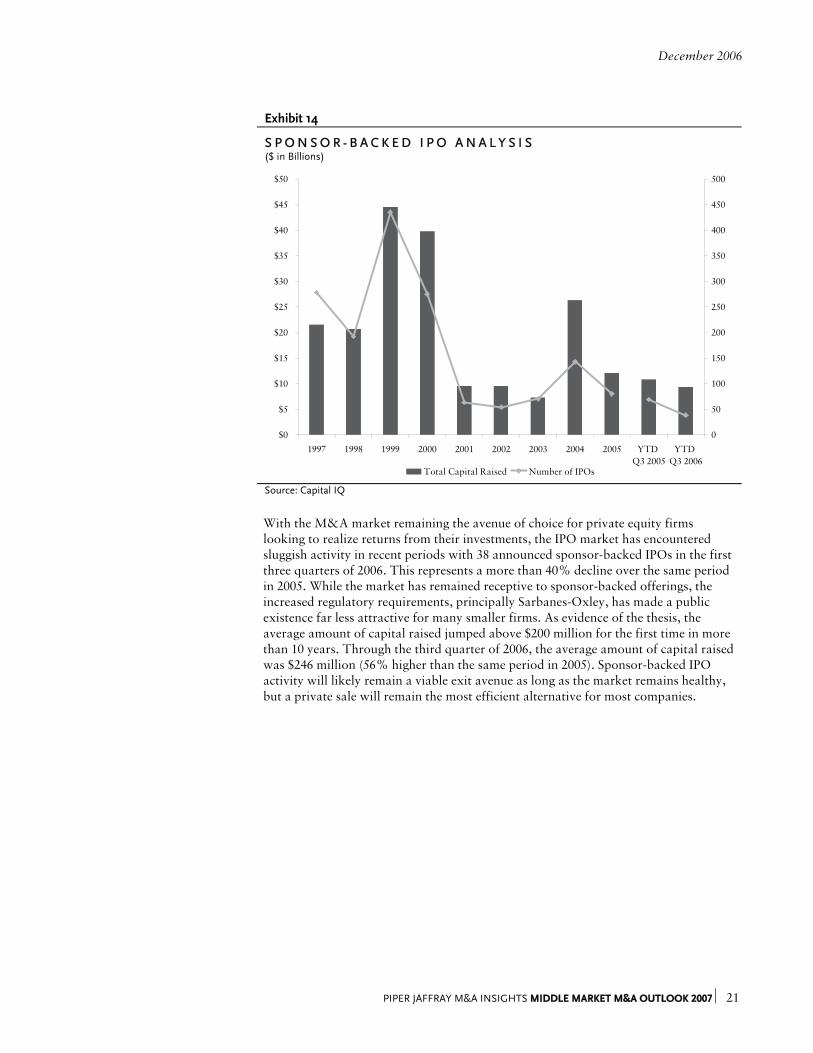
Exhibit 14
S P O N S O R - B A C K E D I P O A N A L Y S I S ($ in Billions)
$0
$5
$10
$15
$20
$25
$30
$35
$40
$45
$50
1997 1998 1999 2000 2001 2002 2003 2004 2005 YTD Q3 2005
YTD Q3 2006
0
50
100
150
200
250
300
350
400
450
500
Total Capital Raised Number of IPOs
Source: Capital IQ With the M&A market remaining the avenue of choice for private equity firms
looking to realize returns from their investments, the IPO market has encountered sluggish activity in recent periods with 38 announced sponsor-backed IPOs in the first three quarters of 2006. This represents a more than 40% decline over the same period in 2005. While the market has remained receptive to sponsor-backed offerings, the increased regulatory requirements, principally Sarbanes-Oxley, has made a public existence far less attractive for many smaller firms. As evidence of the thesis, the average amount of capital raised jumped above $200 million for the first time in more than 10 years. Through the third quarter of 2006, the average amount of capital raised was $246 million (56% higher than the same period in 2005). Sponsor-backed IPO activity will likely remain a viable exit avenue as long as the market remains healthy, but a private sale will remain the most efficient alternative for most companies.
December 2006
22 ⏐ PIPER JAFFRAY M&A INSIGHTS MIDDLE MARKET M&A OUTLOOK 2007
P A R T I I I : P R I V A T E E Q U I T Y / L E V E R A G E D B U Y O U T S
Introduction
2006 is following up the record-setting levels of 2004 and 2005 with another stellar performance. To date, 2006 has been highlighted by one giant take-private after another, with deal sizes that have not been seen since the 1980s. Announcements of $15 billion and $20 billion transactions have become commonplace over the past year, with such behemoths as office building owner Equity Office Properties Trust ($36 billion), hospital operator HCA Inc. ($33 billion), casino operator Harrah’s ($26 billion) and pipeline operator Kinder Morgan ($22 billion), all having been announced in the past year. The new mega-funds (greater than $10 billion) are opening up entirely new sectors of the M&A market, putting deals in play that previously had not been considered. Private equity also continues to play an increasingly important role in cross-border investments, with global flows of foreign direct investment expected to exceed $1 trillion for the first time since 2000. Investments in the Asia-Pacific region continue to grow and gain prominence in the private equity community with China and India increasing their clout and capabilities constantly. The overall growth in deal volume and size has played out across a wide swath of industries, deal sizes and geographies as both buyers and sellers benefited from an abundance of available capital, strong business fundamentals and performances, and a supportive macroeconomic environment. Valuations are healthy, and attractive properties remain widely available in the market. Although all signs continue to point toward further strength, there may be a few clouds on the horizon. In our view, there appears to be a bifurcation of deals coming to the market recently, with many more companies in the market with stories to tell. Financial buyers are pursuing the “A” properties with increasing vigor, investing more time, resources and dollars in the early stages of processes to increase their chances of success. Conversely, “B” properties are finding a much less responsive audience. While these deals are still getting done, private equity interest is more restrained and the processes are more difficult. Shorter hold periods for investments may be an indication that sponsors believe that the market is going to turn and are trying to get liquid. A slight hiccup in the economy or another unforeseen catastrophe, whether man-made or natural, could depress the market rather quickly. Although we expect that the current strength of M&A activity will continue into 2007, it is hard for us to believe that there is room for significant improvement for the whole year versus a robust 2006. A slowdown in the M&A market is somewhere on the horizon; how quickly it approaches, though, is still up for debate.
December 2006
PIPER JAFFRAY M&A INSIGHTS MIDDLE MARKET M&A OUTLOOK 2007 ⏐ 23
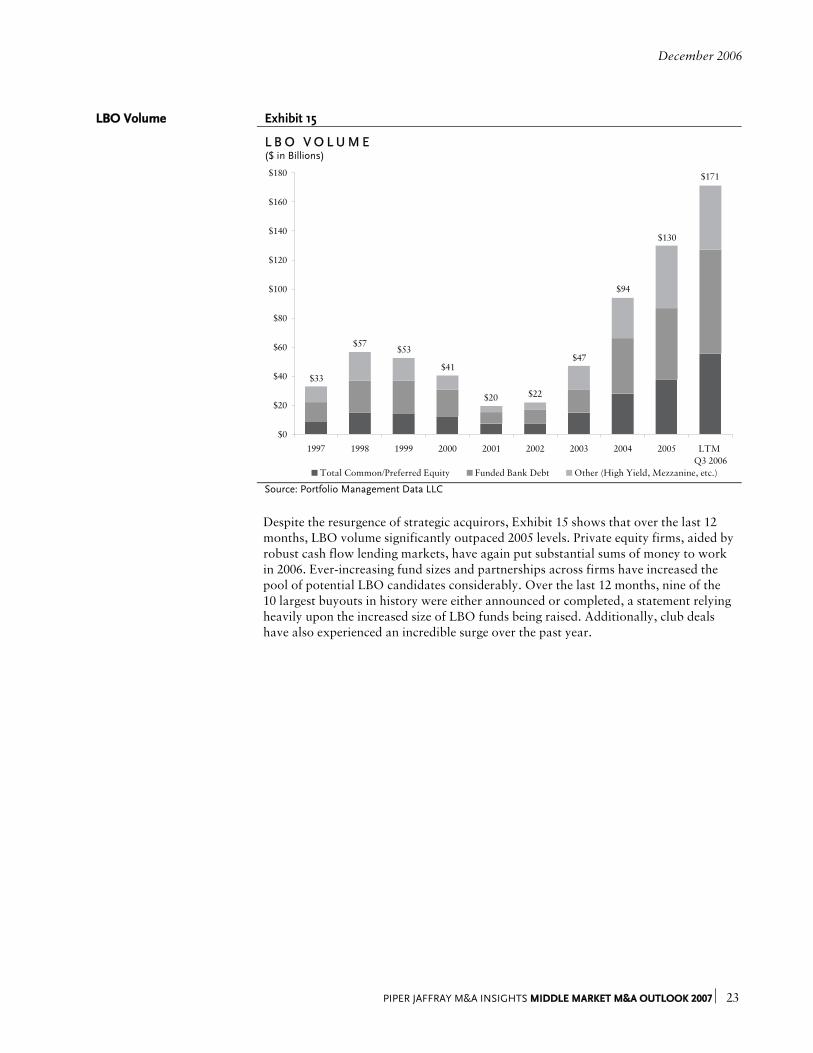
LBO Volume Exhibit 15
L B O V O L U M E ($ in Billions)
$33
$57$53
$41
$20 $22
$47
$94
$130
$171
$0
$20
$40
$60
$80
$100
$120
$140
$160
$180
1997 1998 1999 2000 2001 2002 2003 2004 2005 LTM Q3 2006
Total Common/Preferred Equity Funded Bank Debt Other (High Yield, Mezzanine, etc.) Source: Portfolio Management Data LLC
Despite the resurgence of strategic acquirors, Exhibit 15 shows that over the last 12
months, LBO volume significantly outpaced 2005 levels. Private equity firms, aided by robust cash flow lending markets, have again put substantial sums of money to work in 2006. Ever-increasing fund sizes and partnerships across firms have increased the pool of potential LBO candidates considerably. Over the last 12 months, nine of the 10 largest buyouts in history were either announced or completed, a statement relying heavily upon the increased size of LBO funds being raised. Additionally, club deals have also experienced an incredible surge over the past year.
December 2006
24 ⏐ PIPER JAFFRAY M&A INSIGHTS MIDDLE MARKET M&A OUTLOOK 2007
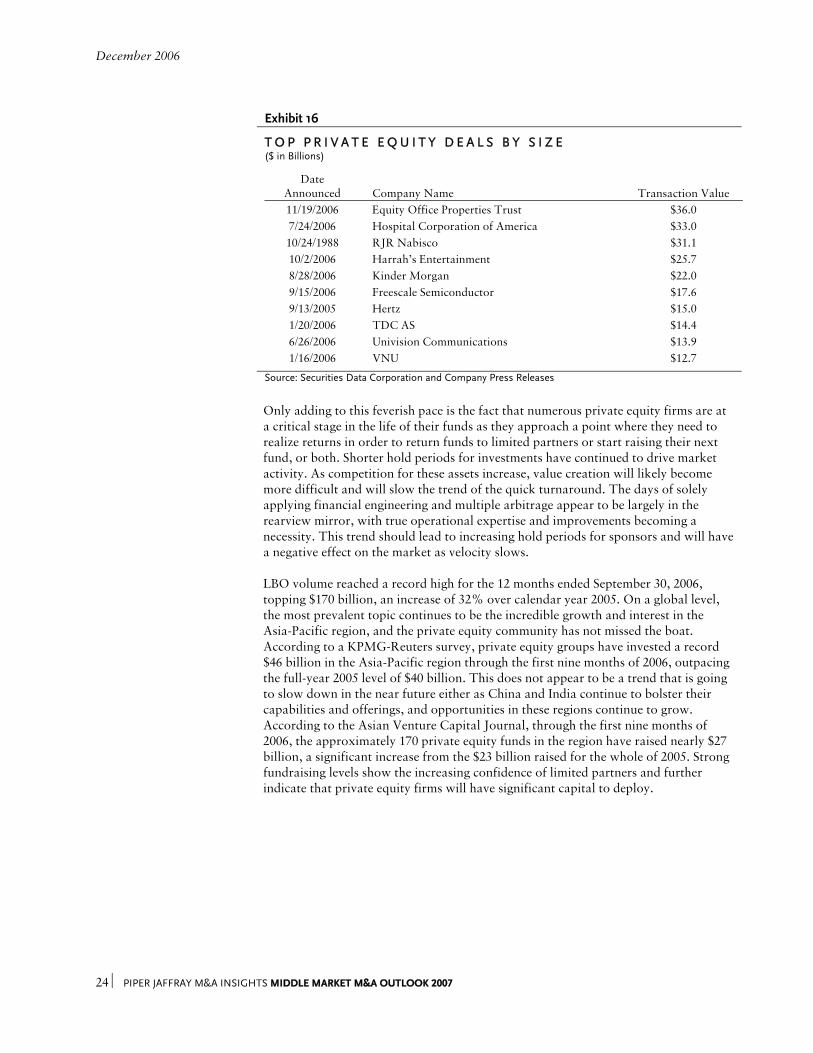
Exhibit 16
T O P P R I V A T E E Q U I T Y D E A L S B Y S I Z E ($ in Billions)
Date
Announced Company Name Transaction Value 11/19/2006 Equity Office Properties Trust $36.0 7/24/2006 Hospital Corporation of America $33.0 10/24/1988 RJR Nabisco $31.1 10/2/2006 Harrah’s Entertainment $25.7 8/28/2006 Kinder Morgan $22.0 9/15/2006 Freescale Semiconductor $17.6 9/13/2005 Hertz $15.0 1/20/2006 TDC AS $14.4 6/26/2006 Univision Communications $13.9 1/16/2006 VNU $12.7
Source: Securities Data Corporation and Company Press Releases Only adding to this feverish pace is the fact that numerous private equity firms are at
a critical stage in the life of their funds as they approach a point where they need to realize returns in order to return funds to limited partners or start raising their next fund, or both. Shorter hold periods for investments have continued to drive market activity. As competition for these assets increase, value creation will likely become more difficult and will slow the trend of the quick turnaround. The days of solely applying financial engineering and multiple arbitrage appear to be largely in the rearview mirror, with true operational expertise and improvements becoming a necessity. This trend should lead to increasing hold periods for sponsors and will have a negative effect on the market as velocity slows. LBO volume reached a record high for the 12 months ended September 30, 2006, topping $170 billion, an increase of 32% over calendar year 2005. On a global level, the most prevalent topic continues to be the incredible growth and interest in the Asia-Pacific region, and the private equity community has not missed the boat. According to a KPMG-Reuters survey, private equity groups have invested a record $46 billion in the Asia-Pacific region through the first nine months of 2006, outpacing the full-year 2005 level of $40 billion. This does not appear to be a trend that is going to slow down in the near future either as China and India continue to bolster their capabilities and offerings, and opportunities in these regions continue to grow. According to the Asian Venture Capital Journal, through the first nine months of 2006, the approximately 170 private equity funds in the region have raised nearly $27 billion, a significant increase from the $23 billion raised for the whole of 2005. Strong fundraising levels show the increasing confidence of limited partners and further indicate that private equity firms will have significant capital to deploy.
December 2006
PIPER JAFFRAY M&A INSIGHTS MIDDLE MARKET M&A OUTLOOK 2007 ⏐ 25
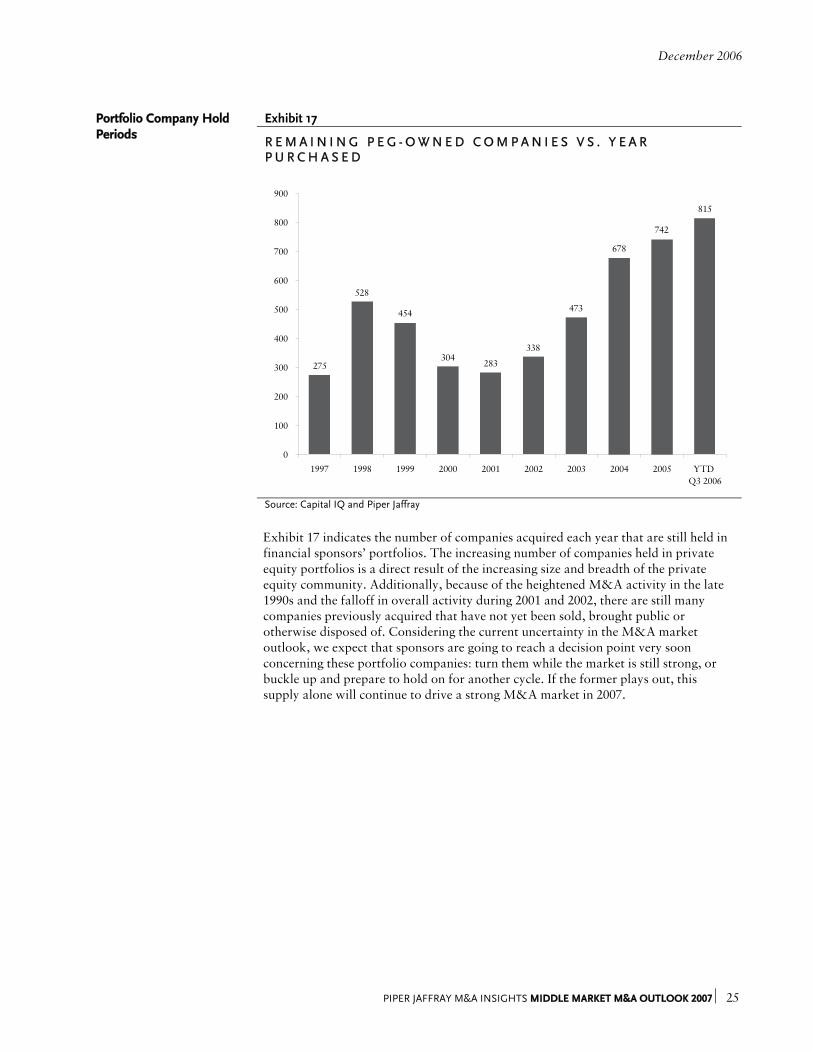
Portfolio Company Hold Exhibit 17 Periods
R E M A I N I N G P E G - O W N E D C O M P A N I E S V S . Y E A R P U R C H A S E D
275
473
815
742
678
338
283304
454
528
0
100
200
300
400
500
600
700
800
900
1997 1998 1999 2000 2001 2002 2003 2004 2005 YTD Q3 2006
Source: Capital IQ and Piper Jaffray
Exhibit 17 indicates the number of companies acquired each year that are still held in
financial sponsors’ portfolios. The increasing number of companies held in private equity portfolios is a direct result of the increasing size and breadth of the private equity community. Additionally, because of the heightened M&A activity in the late 1990s and the falloff in overall activity during 2001 and 2002, there are still many companies previously acquired that have not yet been sold, brought public or otherwise disposed of. Considering the current uncertainty in the M&A market outlook, we expect that sponsors are going to reach a decision point very soon concerning these portfolio companies: turn them while the market is still strong, or buckle up and prepare to hold on for another cycle. If the former plays out, this supply alone will continue to drive a strong M&A market in 2007.
December 2006
26 ⏐ PIPER JAFFRAY M&A INSIGHTS MIDDLE MARKET M&A OUTLOOK 2007
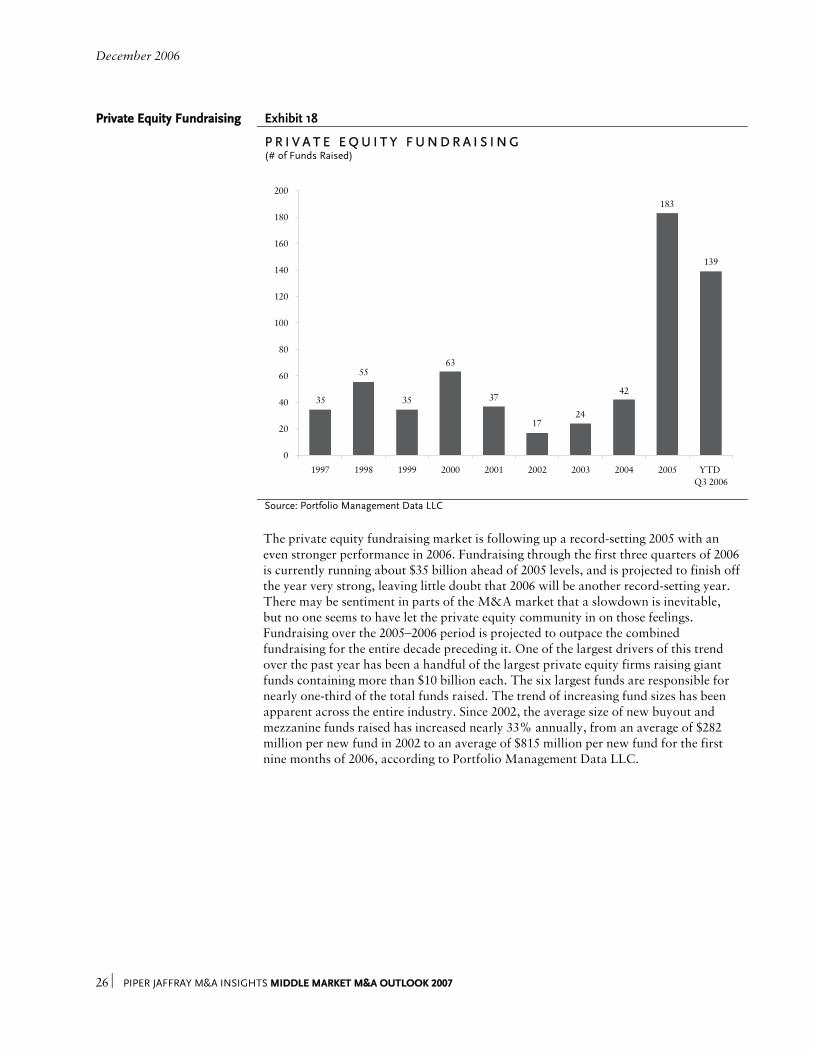
Private Equity Fundraising Exhibit 18
P R I V A T E E Q U I T Y F U N D R A I S I N G (# of Funds Raised)
139
183
42
17
37
63
35
55
3524
0
20
40
60
80
100
120
140
160
180
200
1997 1998 1999 2000 2001 2002 2003 2004 2005 YTD Q3 2006
Source: Portfolio Management Data LLC
The private equity fundraising market is following up a record-setting 2005 with an
even stronger performance in 2006. Fundraising through the first three quarters of 2006 is currently running about $35 billion ahead of 2005 levels, and is projected to finish off the year very strong, leaving little doubt that 2006 will be another record-setting year. There may be sentiment in parts of the M&A market that a slowdown is inevitable, but no one seems to have let the private equity community in on those feelings. Fundraising over the 2005–2006 period is projected to outpace the combined fundraising for the entire decade preceding it. One of the largest drivers of this trend over the past year has been a handful of the largest private equity firms raising giant funds containing more than $10 billion each. The six largest funds are responsible for nearly one-third of the total funds raised. The trend of increasing fund sizes has been apparent across the entire industry. Since 2002, the average size of new buyout and mezzanine funds raised has increased nearly 33% annually, from an average of $282 million per new fund in 2002 to an average of $815 million per new fund for the first nine months of 2006, according to Portfolio Management Data LLC.
December 2006
PIPER JAFFRAY M&A INSIGHTS MIDDLE MARKET M&A OUTLOOK 2007 ⏐ 27
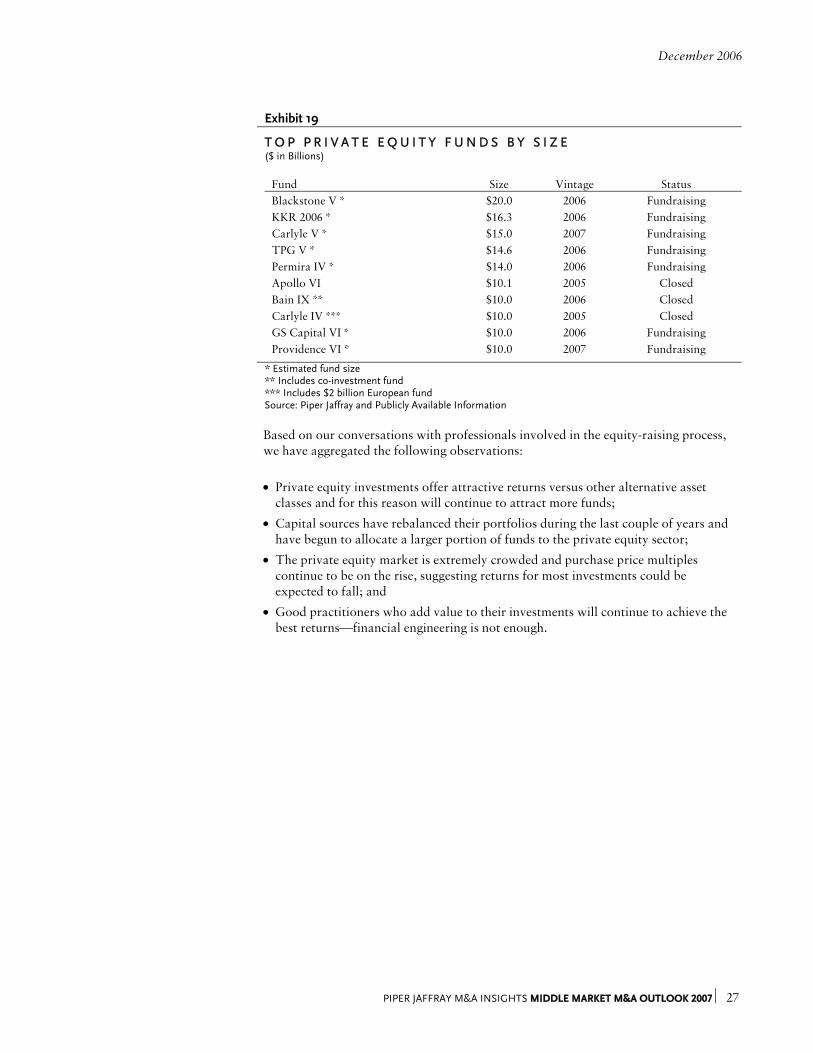
Exhibit 19
T O P P R I V A T E E Q U I T Y F U N D S B Y S I Z E ($ in Billions)
Fund Size Vintage Status Blackstone V * $20.0 2006 Fundraising KKR 2006 * $16.3 2006 Fundraising Carlyle V * $15.0 2007 Fundraising TPG V * $14.6 2006 Fundraising Permira IV * $14.0 2006 Fundraising Apollo VI $10.1 2005 Closed Bain IX ** $10.0 2006 Closed Carlyle IV *** $10.0 2005 Closed GS Capital VI * $10.0 2006 Fundraising Providence VI * $10.0 2007 Fundraising
* Estimated fund size
** Includes co-investment fund *** Includes $2 billion European fund Source: Piper Jaffray and Publicly Available Information
Based on our conversations with professionals involved in the equity-raising process,
we have aggregated the following observations:
• Private equity investments offer attractive returns versus other alternative asset classes and for this reason will continue to attract more funds;
• Capital sources have rebalanced their portfolios during the last couple of years and have begun to allocate a larger portion of funds to the private equity sector;
• The private equity market is extremely crowded and purchase price multiples continue to be on the rise, suggesting returns for most investments could be expected to fall; and
• Good practitioners who add value to their investments will continue to achieve the best returns—financial engineering is not enough.
December 2006
28 ⏐ PIPER JAFFRAY M&A INSIGHTS MIDDLE MARKET M&A OUTLOOK 2007
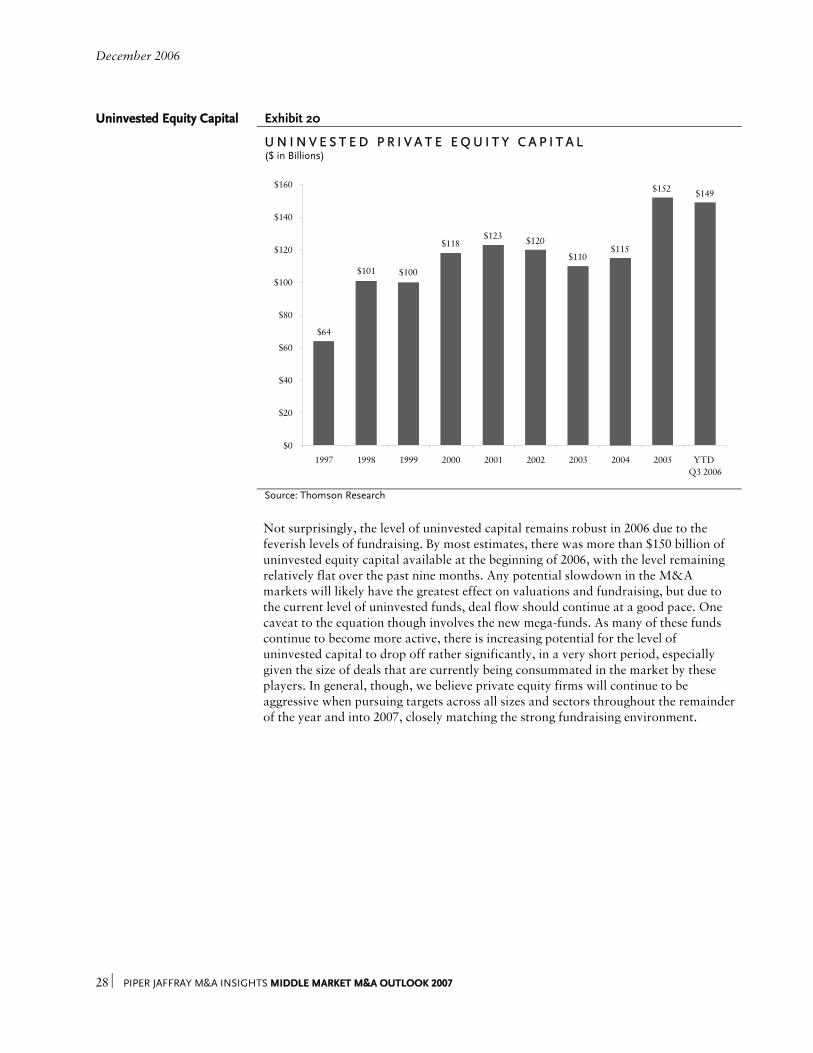
Uninvested Equity Capital Exhibit 20
U N I N V E S T E D P R I V A T E E Q U I T Y C A P I T A L ($ in Billions)
$149$152
$115$120$123
$118
$100$101
$64
$110
$0
$20
$40
$60
$80
$100
$120
$140
$160
1997 1998 1999 2000 2001 2002 2003 2004 2005 YTD Q3 2006
Source: Thomson Research
Not surprisingly, the level of uninvested capital remains robust in 2006 due to the
feverish levels of fundraising. By most estimates, there was more than $150 billion of uninvested equity capital available at the beginning of 2006, with the level remaining relatively flat over the past nine months. Any potential slowdown in the M&A markets will likely have the greatest effect on valuations and fundraising, but due to the current level of uninvested funds, deal flow should continue at a good pace. One caveat to the equation though involves the new mega-funds. As many of these funds continue to become more active, there is increasing potential for the level of uninvested capital to drop off rather significantly, in a very short period, especially given the size of deals that are currently being consummated in the market by these players. In general, though, we believe private equity firms will continue to be aggressive when pursuing targets across all sizes and sectors throughout the remainder of the year and into 2007, closely matching the strong fundraising environment.
December 2006
PIPER JAFFRAY M&A INSIGHTS MIDDLE MARKET M&A OUTLOOK 2007 ⏐ 29
Competitive Environment As the middle market has become more competitive, financial acquirors have been
forced to differentiate themselves from the pack with both prospective targets and potential limited partners. Increasingly, private equity firms are earnestly seeking an “angle” that will allow them to bid aggressively and distinguish themselves in a competitive process. In particular, sponsors are often attempting to demonstrate the following attributes:
• Demonstrated industry expertise (e.g., ability to drive operational improvements, pursue growth through add-on acquisitions);
• Unique firm attributes such as an executive network or in-house operational expertise;
• Ability to move quickly and provide certainty to close;
• Commitment and dedication to the deal by investing significant time, resources and dollars up front; and
• Good chemistry with management teams. Overall, we expect the private equity community to remain extremely active through 2007. Private equity firms are expected to continue to be active sellers of portfolio companies to take advantage of the current high valuations. More cyclical companies with improved financial performance and investments have performed particularly well. Likewise, more capital almost certainly will be put to work against a backdrop of a strong economy and robust financing markets.
December 2006
30 ⏐ PIPER JAFFRAY M&A INSIGHTS MIDDLE MARKET M&A OUTLOOK 2007
P A R T I V : S T R A T E G I C B U Y E R S
Introduction
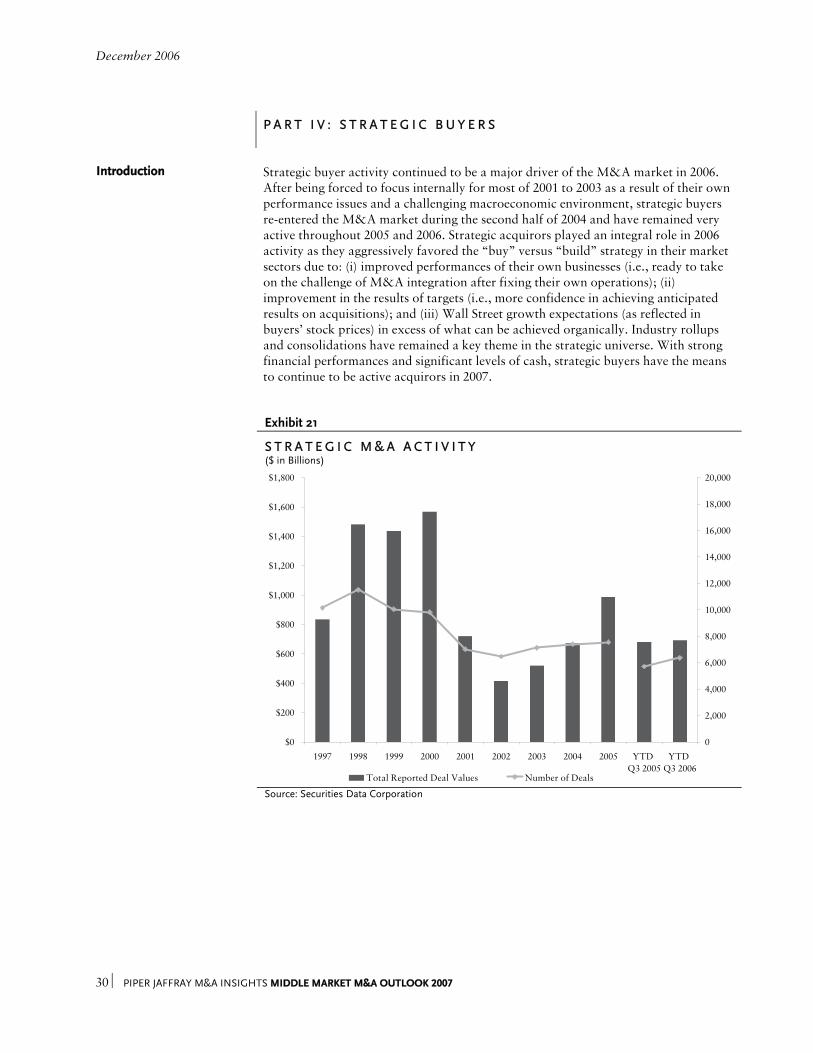
Strategic buyer activity continued to be a major driver of the M&A market in 2006. After being forced to focus internally for most of 2001 to 2003 as a result of their own performance issues and a challenging macroeconomic environment, strategic buyers re-entered the M&A market during the second half of 2004 and have remained very active throughout 2005 and 2006. Strategic acquirors played an integral role in 2006 activity as they aggressively favored the “buy” versus “build” strategy in their market sectors due to: (i) improved performances of their own businesses (i.e., ready to take on the challenge of M&A integration after fixing their own operations); (ii) improvement in the results of targets (i.e., more confidence in achieving anticipated results on acquisitions); and (iii) Wall Street growth expectations (as reflected in buyers’ stock prices) in excess of what can be achieved organically. Industry rollups and consolidations have remained a key theme in the strategic universe. With strong financial performances and significant levels of cash, strategic buyers have the means to continue to be active acquirors in 2007.
Exhibit 21
S T R A T E G I C M & A A C T I V I T Y ($ in Billions)
$0
$200
$400
$600
$800
$1,000
$1,200
$1,400
$1,600
$1,800
1997 1998 1999 2000 2001 2002 2003 2004 2005 YTD Q3 2005
YTD Q3 2006
0
2,000
4,000
6,000
8,000
10,000
12,000
14,000
16,000
18,000
20,000
Total Reported Deal Values Number of Deals Source: Securities Data Corporation
December 2006
PIPER JAFFRAY M&A INSIGHTS MIDDLE MARKET M&A OUTLOOK 2007 ⏐ 31
While the total number of deals has remained fairly consistent over the past five years,
the average deal size has been increasing rather consistently since 2002. This has not been the case over the first nine months of 2006, with average deal sizes taking a slight dip compared to the prior year, although remaining strong. Total strategic deal value (where strategic acquirors purchased U.S.-based companies) increased 2% for the first three quarters of 2006 versus the same period last year, while the total number of deals increased nearly 11%. When compared to the overall U.S. M&A market, as mentioned in the first section of this report, strategic M&A activity lagged total deal values (a 2% increase compared to a 13% increase) but was relatively inline with the percentage increase in the number of transactions (an 11% increase compared to a 10% increase) for the first three quarters over the same period last year. Total value of the strategic M&A market continues to be driven by a host of mega-mergers as illustrated in Exhibit 22.
Exhibit 22
L A R G E S T S T R A T E G I C T R A N S A C T I O N S B Y V A L U E ($ in Billions)
Date
Announced Target Acquiror Transaction
Value 3/24/2006 BellSouth Corp. AT&T Inc. $66.7 11/19/2006 Phelps Dodge Corp. Freeport McMoRan $25.8 5/07/2006 Golden West Financial Corp. Wachovia Corp. $25.0 6/22/2006 Kerr-McGee Corp. Anadarko Petroleum Corp. $19.0 6/26/2006 Pfizer Consumer Healthcare Johnson & Johnson Inc. $16.6 3/12/2006 North Fork Bancorp Capital One Financial $14.8 4/02/2006 Lucent Technologies Inc. Alcatel SA $17.0 5/07/2006 Fisher Scientific Inc. Thermo Electron Corp. $11.9 2/25/2006 KeySpan Corp. National Grid plc $11.8 5/24/2006 AmSouth Bancorp Regions Financial Corp. $10.1
Source: Securities Data Corporation and Company Press Releases Capital Structure
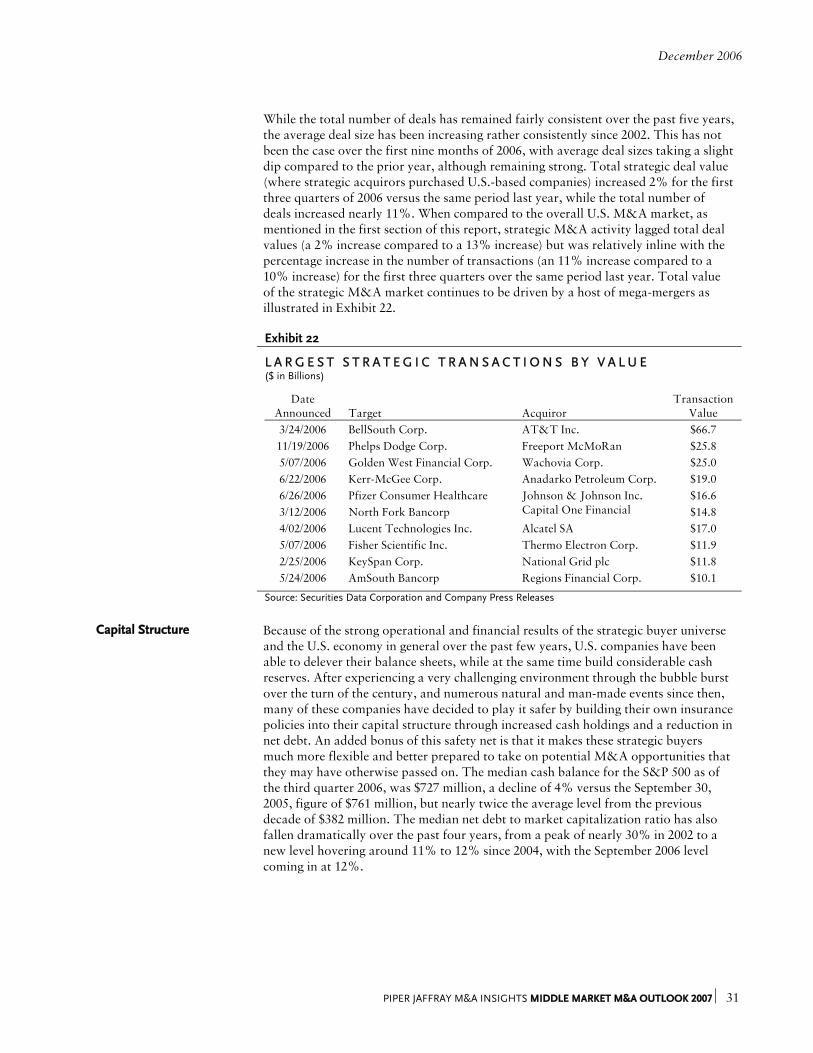
Because of the strong operational and financial results of the strategic buyer universe and the U.S. economy in general over the past few years, U.S. companies have been able to delever their balance sheets, while at the same time build considerable cash reserves. After experiencing a very challenging environment through the bubble burst over the turn of the century, and numerous natural and man-made events since then, many of these companies have decided to play it safer by building their own insurance policies into their capital structure through increased cash holdings and a reduction in net debt. An added bonus of this safety net is that it makes these strategic buyers much more flexible and better prepared to take on potential M&A opportunities that they may have otherwise passed on. The median cash balance for the S&P 500 as of the third quarter 2006, was $727 million, a decline of 4% versus the September 30, 2005, figure of $761 million, but nearly twice the average level from the previous decade of $382 million. The median net debt to market capitalization ratio has also fallen dramatically over the past four years, from a peak of nearly 30% in 2002 to a new level hovering around 11% to 12% since 2004, with the September 2006 level coming in at 12%.
December 2006
32 ⏐ PIPER JAFFRAY M&A INSIGHTS MIDDLE MARKET M&A OUTLOOK 2007
Exhibit 23
M E D I A N C A S H O F T H E S & P 5 0 0 v . C A P I T A L I Z A T I O N ($ in Millions)
$0
$100
$200
$300
$400
$500
$600
$700
$800
$900
$1,000
1997 1998 1999 2000 2001 2002 2003 2004 2005 Q32005
Q32006
0%
5%
10%
15%
20%
25%
30%
Median Cash Balance Net Debt to Market Cap
Source: Capital IQ
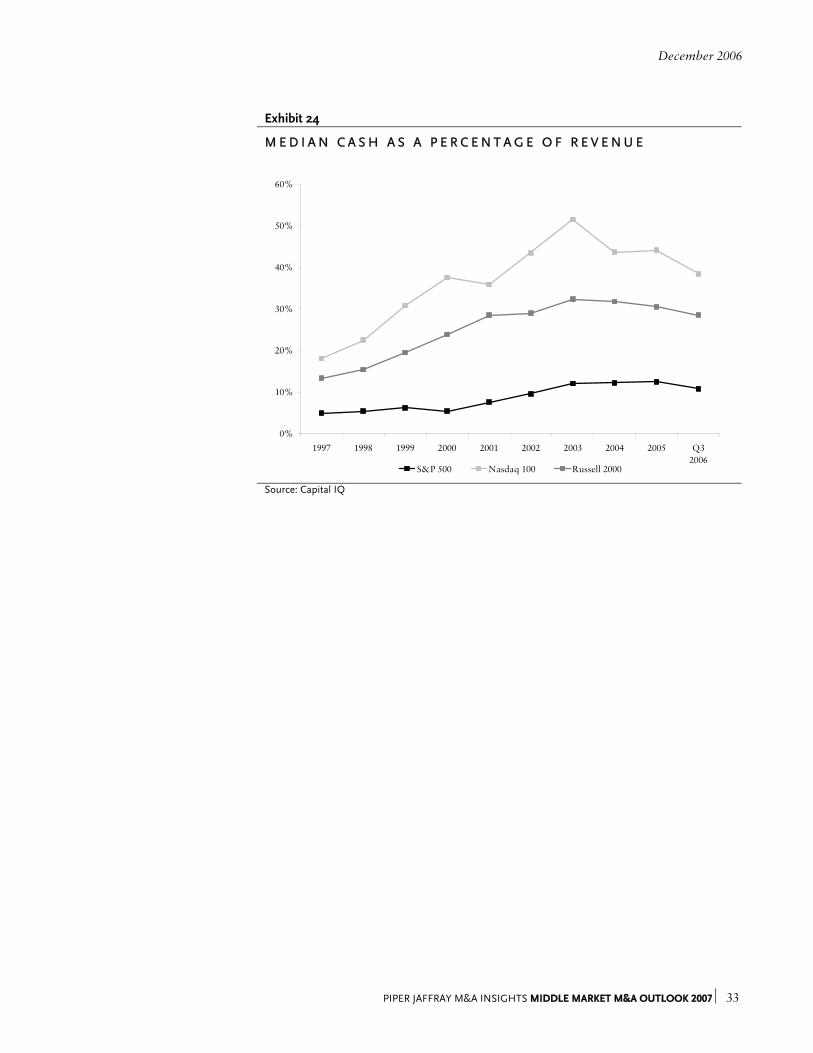
Cash Levels
To further substantiate this point we looked across three indices (the S&P 500, the NASDAQ 100, and the Russell 2000) to verify that cash balances were not simply rising because the components of the indices themselves were growing larger. The chart below depicts the median cash balances as a percentage of revenue for the stated indices and shows a very clear trend of the component companies carrying significantly larger cash balances given their size. This trend has strengthened the capital structure of the indices considerably. We believe this is a structural shift that will allow strategic buyers to continue to be active acquirors in 2007 and beyond.
December 2006
PIPER JAFFRAY M&A INSIGHTS MIDDLE MARKET M&A OUTLOOK 2007 ⏐ 33
Exhibit 24
M E D I A N C A S H A S A P E R C E N T A G E O F R E V E N U E
0%
10%
20%
30%
40%
50%
60%
1997 1998 1999 2000 2001 2002 2003 2004 2005 Q32006
S&P 500 Nasdaq 100 Russell 2000
Source: Capital IQ
December 2006
34 ⏐ PIPER JAFFRAY M&A INSIGHTS MIDDLE MARKET M&A OUTLOOK 2007
P A R T V : C O N C L U S I O N
Last year, we wrote that we believed 2006 was poised for continued strength and growth in the M&A market but that it was unlikely that 2006 would significantly outperform 2005. It appears that we may have been overly conservative in our outlook of the M&A market. 2006 turned out to be another record year in terms of M&A activity. M&A activity has increased year-to-date (as of the end of the third quarter) over last year with 10% more announced transactions and a 13% increase in deal value. Our outlook for 2007 definitely would be classified as more conservative. We are now three years into an active M&A market and signs are beginning to point toward fatigue. Many quality properties have successfully come to market and while many “A” properties remain in the pipeline, many lesser-grade companies remain also. The bifurcation between the two classes has started to become more apparent, with the top-quality companies demanding as much attention as ever before, and their more complex and storied counterparts receiving more scrutiny. Capital is cheap, fundraising remains strong and uninvested capital persists at record highs, but there seems to be an increasing feeling that the music is going to end soon. We are not ruling out a prolonged set or an encore or two, but eventually the lights are going to be turned on and the show must end. While risks surround the longevity of the bullish economy, most of these risks are not new. Natural disasters, terrorist activity, pressure on the U.S. dollar, volatile and rising commodity prices and political uncertainty relating to the global conflicts have existed throughout the bull run in the M&A market. There are still many strong signs in the M&A market that point toward continued strength. Additionally, we believe that the growth in the M&A market over the past three years has been built on stronger fundamentals than past periods and that a potential slowdown will be much more muted than those experienced over the past decade. There are many fundamental differences between the current M&A market and those of the past:
• Liquidity in the debt markets—In 2000, the debt markets dried up. We believe that is less likely to occur now because of an influx of autonomous, unregulated, market-funded lenders that have come online since 2000 and created greater overall diversity in the debt markets;
• Large capital pools—There is a record level of uninvested capital in the private equity world that needs to be deployed, and with the ever-increasing size of funds, the scope of potential targets has increased as financial buyers are able to take on much larger acquisitions than any time in the past;
• Broader, more diversified market potential—International markets have opened up considerably over recent years, with substantial opportunities continuing to present themselves and become more viable in emerging markets such as Brazil, China, India and Russia;
• Fundamental buy/sell cycle of private equity firms—The growth of private equity firms and their need to buy and sell into and out of their portfolios will reduce cyclicality more now than in 2000 as they are a bigger portion of the overall M&A market; and
• Healthier strategic acquirors—Strategic acquirors now have large amounts of cash on their balance sheets and have significantly delevered over the past few years.

December 2006
PIPER JAFFRAY M&A INSIGHTS MIDDLE MARKET M&A OUTLOOK 2007 ⏐ 35
Although there are some clouds on the horizon, we do not believe it is time to pull out the umbrellas just yet. While we don’t believe that M&A activity in 2007 will be able to top the impressive results of 2006 and the potential for a slowdown in the market is as high as it has been since this cycle began, we continue to be optimistic for another solid year in terms of activity, as the market is currently much healthier, more robust and potentially more resilient than it has ever been in the past, and is well-positioned to meet any eventual problems head-on.
December 2006
PIPER JAFFRAY M&A INSIGHTS MIDDLE MARKET M&A OUTLOOK 2007 36 ⏐
A P P E N D I X A L T E R N A T I V E E N E R G Y : B I O F U E L S
PIPER JAFFRAY TEAM CONTACTS Tom Halverson Hema Gunasekaran 612 303-6371 612 303-1830 [email protected] [email protected]
2006 SELECT BIOFUELS TRANSACTIONS
Target Acquiror
Altra Inc. Kleiner Perkins, Khosla VenturesCarolina Fiberboard Corp. Xethanol CorporationEarth Biofuels Inc. Cornell Capital PartnersFlex Fuels USA, Inc. Alternative Energy Sources, Inc.
Front Range Energy LLC Pacific Ethanol Inc.
Greenlight Energy, Inc. BP PLC
Hawkeye Holdings Inc. TH Lee Partners
Midwest Grain Processors Investec (Global Ethanol)
Seattle Biodiesel LLC Nth Power, Technology Partners
TexCom Inc. U.S. Renewables Group
Source: Capital IQ and Securities Data Corporation
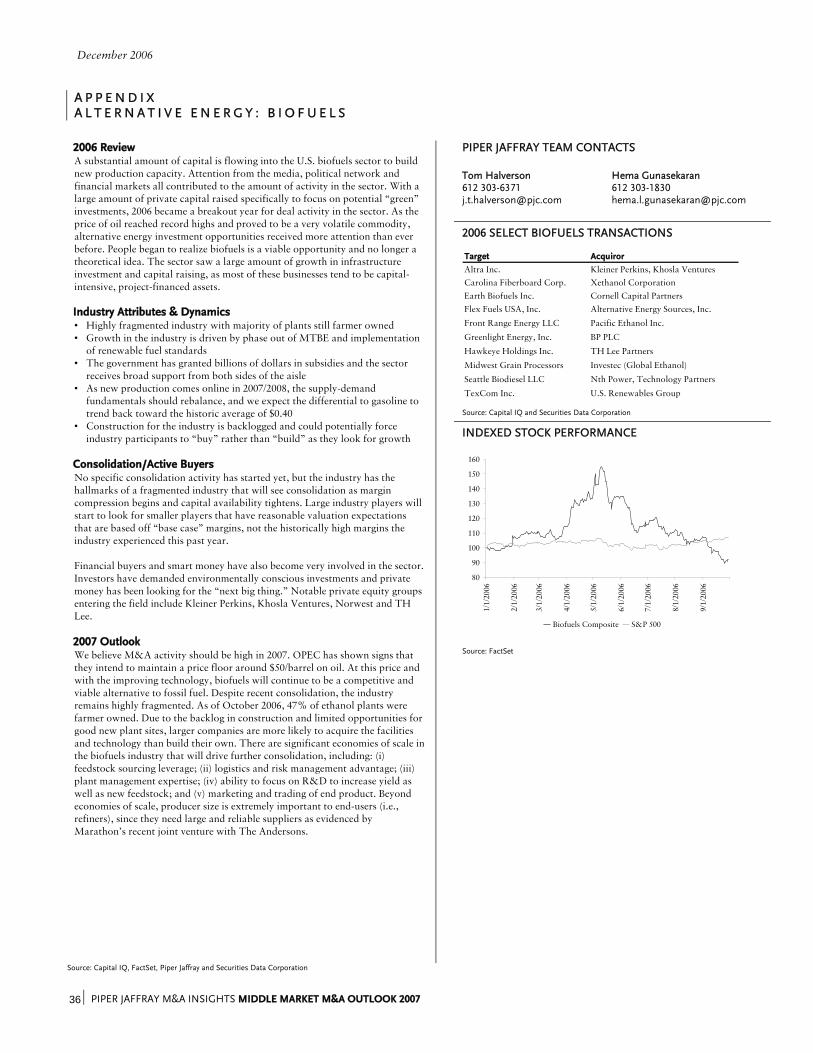
2006 Review A substantial amount of capital is flowing into the U.S. biofuels sector to build new production capacity. Attention from the media, political network and financial markets all contributed to the amount of activity in the sector. With a large amount of private capital raised specifically to focus on potential “green” investments, 2006 became a breakout year for deal activity in the sector. As the price of oil reached record highs and proved to be a very volatile commodity, alternative energy investment opportunities received more attention than ever before. People began to realize biofuels is a viable opportunity and no longer a theoretical idea. The sector saw a large amount of growth in infrastructure investment and capital raising, as most of these businesses tend to be capital-intensive, project-financed assets. Industry Attributes & Dynamics • Highly fragmented industry with majority of plants still farmer owned • Growth in the industry is driven by phase out of MTBE and implementation
of renewable fuel standards • The government has granted billions of dollars in subsidies and the sector
receives broad support from both sides of the aisle • As new production comes online in 2007/2008, the supply-demand
fundamentals should rebalance, and we expect the differential to gasoline to trend back toward the historic average of $0.40
• Construction for the industry is backlogged and could potentially force industry participants to “buy” rather than “build” as they look for growth
Consolidation/Active Buyers No specific consolidation activity has started yet, but the industry has the hallmarks of a fragmented industry that will see consolidation as margin compression begins and capital availability tightens. Large industry players will start to look for smaller players that have reasonable valuation expectations that are based off “base case” margins, not the historically high margins the industry experienced this past year. Financial buyers and smart money have also become very involved in the sector. Investors have demanded environmentally conscious investments and private money has been looking for the “next big thing.” Notable private equity groups entering the field include Kleiner Perkins, Khosla Ventures, Norwest and TH Lee. 2007 Outlook We believe M&A activity should be high in 2007. OPEC has shown signs that they intend to maintain a price floor around $50/barrel on oil. At this price and with the improving technology, biofuels will continue to be a competitive and viable alternative to fossil fuel. Despite recent consolidation, the industry remains highly fragmented. As of October 2006, 47% of ethanol plants were farmer owned. Due to the backlog in construction and limited opportunities for good new plant sites, larger companies are more likely to acquire the facilities and technology than build their own. There are significant economies of scale in the biofuels industry that will drive further consolidation, including: (i) feedstock sourcing leverage; (ii) logistics and risk management advantage; (iii) plant management expertise; (iv) ability to focus on R&D to increase yield as well as new feedstock; and (v) marketing and trading of end product. Beyond economies of scale, producer size is extremely important to end-users (i.e., refiners), since they need large and reliable suppliers as evidenced by Marathon’s recent joint venture with The Andersons.
INDEXED STOCK PERFORMANCE
80
90
100
110
120
130
140
150
160
1/1/
2006
2/1/
2006
3/1/
2006
4/1/
2006
5/1/
2006
6/1/
2006
7/1/
2006
8/1/
2006
9/1/
2006
Biofuels Composite S&P 500
Source: FactSet
Source: Capital IQ, FactSet, Piper Jaffray and Securities Data Corporation
December 2006
PIPER JAFFRAY M&A INSIGHTS MIDDLE MARKET M&A OUTLOOK 2007 ⏐ 37
A P P E N D I X B U S I N E S S S E R V I C E S : E M P L O Y E R S E R V I C E S
PIPER JAFFRAY TEAM CONTACTS John Lonnquist 612 303-6308 [email protected]
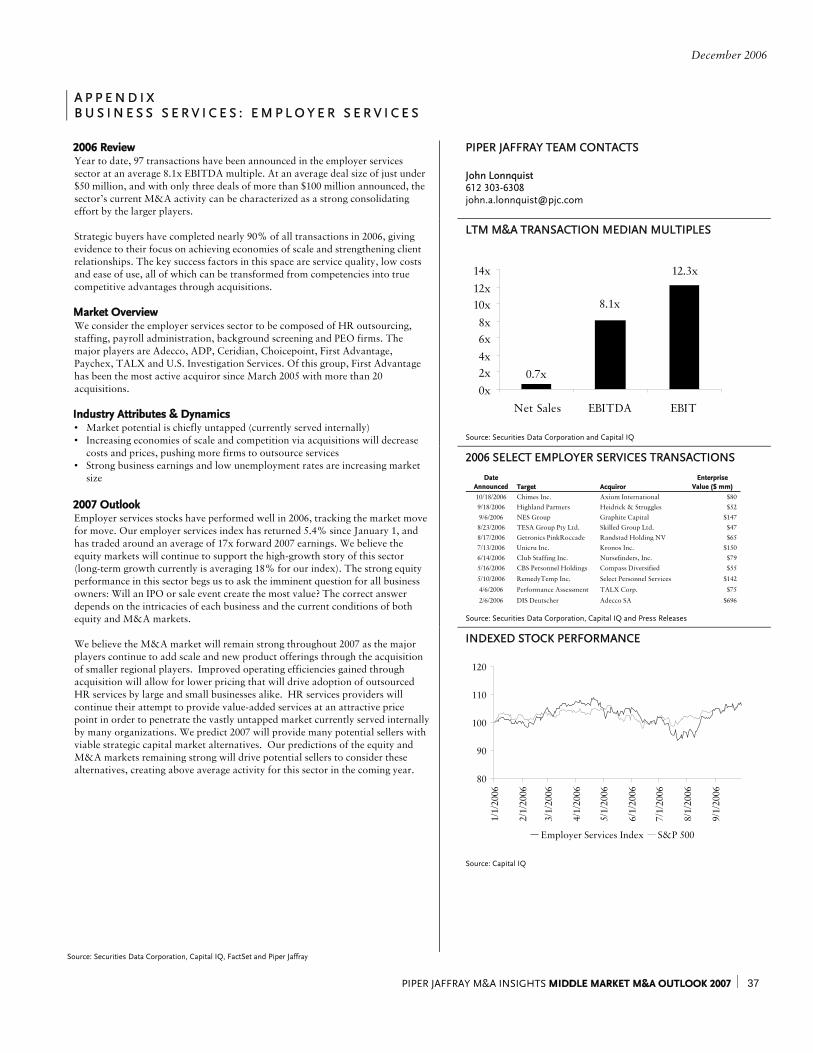
LTM M&A TRANSACTION MEDIAN MULTIPLES
0.7x
8.1x
12.3x
0x2x4x6x8x
10x12x14x
Net Sales EBITDA EBIT
Source: Securities Data Corporation and Capital IQ
2006 SELECT EMPLOYER SERVICES TRANSACTIONS
DateAnnounced Target Acquiror
EnterpriseValue ($ mm)
10/18/2006 Chimes Inc. Axium International $809/18/2006 Highland Partners Heidrick & Struggles $529/6/2006 NES Group Graphite Capital $1478/23/2006 TESA Group Pty Ltd. Skilled Group Ltd. $478/17/2006 Getronics PinkRoccade Randstad Holding NV $657/13/2006 Unicru Inc. Kronos Inc. $1506/14/2006 Club Staffing Inc. Nursefinders, Inc. $795/16/2006 CBS Personnel Holdings Compass Diversified $55
5/10/2006 RemedyTemp Inc. Select Personnel Services $142
4/6/2006 Performance Assessment TALX Corp. $75
2/6/2006 DIS Deutscher Adecco SA $696
Source: Securities Data Corporation, Capital IQ and Press Releases
2006 Review Year to date, 97 transactions have been announced in the employer services sector at an average 8.1x EBITDA multiple. At an average deal size of just under $50 million, and with only three deals of more than $100 million announced, the sector’s current M&A activity can be characterized as a strong consolidating effort by the larger players. Strategic buyers have completed nearly 90% of all transactions in 2006, giving evidence to their focus on achieving economies of scale and strengthening client relationships. The key success factors in this space are service quality, low costs and ease of use, all of which can be transformed from competencies into true competitive advantages through acquisitions. Market Overview We consider the employer services sector to be composed of HR outsourcing, staffing, payroll administration, background screening and PEO firms. The major players are Adecco, ADP, Ceridian, Choicepoint, First Advantage, Paychex, TALX and U.S. Investigation Services. Of this group, First Advantage has been the most active acquiror since March 2005 with more than 20 acquisitions. Industry Attributes & Dynamics • Market potential is chiefly untapped (currently served internally) • Increasing economies of scale and competition via acquisitions will decrease
costs and prices, pushing more firms to outsource services • Strong business earnings and low unemployment rates are increasing market
size 2007 Outlook Employer services stocks have performed well in 2006, tracking the market move for move. Our employer services index has returned 5.4% since January 1, and has traded around an average of 17x forward 2007 earnings. We believe the equity markets will continue to support the high-growth story of this sector (long-term growth currently is averaging 18% for our index). The strong equity performance in this sector begs us to ask the imminent question for all business owners: Will an IPO or sale event create the most value? The correct answer depends on the intricacies of each business and the current conditions of both equity and M&A markets. We believe the M&A market will remain strong throughout 2007 as the major players continue to add scale and new product offerings through the acquisition of smaller regional players. Improved operating efficiencies gained through acquisition will allow for lower pricing that will drive adoption of outsourced HR services by large and small businesses alike. HR services providers will continue their attempt to provide value-added services at an attractive price point in order to penetrate the vastly untapped market currently served internally by many organizations. We predict 2007 will provide many potential sellers with viable strategic capital market alternatives. Our predictions of the equity and M&A markets remaining strong will drive potential sellers to consider these alternatives, creating above average activity for this sector in the coming year.
INDEXED STOCK PERFORMANCE
80
90
100
110
120
1/1/
2006
2/1/
2006
3/1/
2006
4/1/
2006
5/1/
2006
6/1/
2006
7/1/
2006
8/1/
2006
9/1/
2006
Employer Services Index S&P 500
Source: Capital IQ
Source: Securities Data Corporation, Capital IQ, FactSet and Piper Jaffray
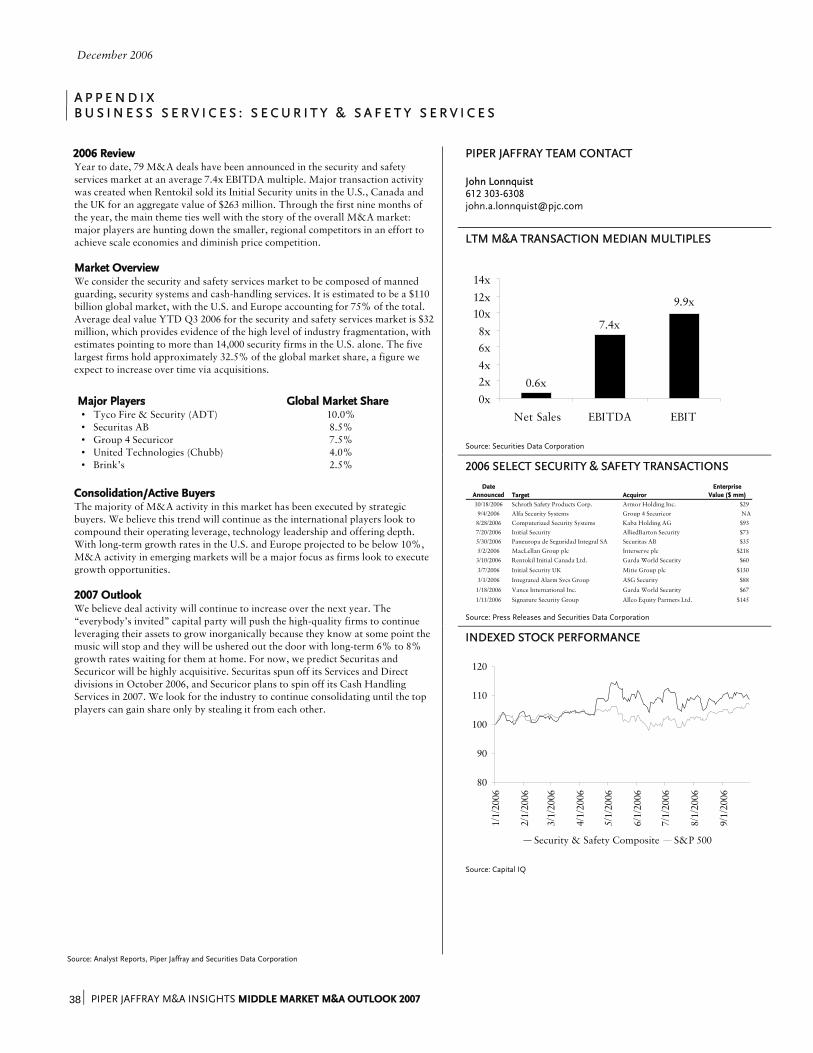
December 2006
PIPER JAFFRAY M&A INSIGHTS MIDDLE MARKET M&A OUTLOOK 2007 38 ⏐
A P P E N D I X B U S I N E S S S E R V I C E S : S E C U R I T Y & S A F E T Y S E R V I C E S
PIPER JAFFRAY TEAM CONTACT John Lonnquist 612 303-6308 [email protected]
LTM M&A TRANSACTION MEDIAN MULTIPLES
9.9x
7.4x
0.6x0x2x4x6x8x
10x12x14x
Net Sales EBITDA EBIT
Source: Securities Data Corporation
2006 SELECT SECURITY & SAFETY TRANSACTIONS
DateAnnounced Target Acquiror
EnterpriseValue ($ mm)
10/18/2006 Schroth Safety Products Corp. Armor Holding Inc. $299/4/2006 Alfa Security Systems Group 4 Securicor NA8/28/2006 Computerized Security Systems Kaba Holding AG $937/20/2006 Initial Security AlliedBarton Security $735/30/2006 Paneuropa de Seguridad Integral SA Securitas AB $355/2/2006 MacLellan Group plc Interserve plc $2183/10/2006 Rentokil Initial Canada Ltd. Garda World Security $60
3/7/2006 Initial Security UK Mitie Group plc $130
3/1/2006 Integrated Alarm Svcs Group ASG Security $88
1/18/2006 Vance International Inc. Garda World Security $67
1/11/2006 Signature Security Group Allco Equity Partners Ltd. $145
Source: Press Releases and Securities Data Corporation
2006 Review Year to date, 79 M&A deals have been announced in the security and safety services market at an average 7.4x EBITDA multiple. Major transaction activity was created when Rentokil sold its Initial Security units in the U.S., Canada and the UK for an aggregate value of $263 million. Through the first nine months of the year, the main theme ties well with the story of the overall M&A market: major players are hunting down the smaller, regional competitors in an effort to achieve scale economies and diminish price competition. Market Overview We consider the security and safety services market to be composed of manned guarding, security systems and cash-handling services. It is estimated to be a $110 billion global market, with the U.S. and Europe accounting for 75% of the total. Average deal value YTD Q3 2006 for the security and safety services market is $32 million, which provides evidence of the high level of industry fragmentation, with estimates pointing to more than 14,000 security firms in the U.S. alone. The five largest firms hold approximately 32.5% of the global market share, a figure we expect to increase over time via acquisitions.
Major Players Global Market Share • Tyco Fire & Security (ADT) 10.0% • Securitas AB 8.5% • Group 4 Securicor 7.5% • United Technologies (Chubb) 4.0% • Brink’s 2.5%
Consolidation/Active Buyers The majority of M&A activity in this market has been executed by strategic buyers. We believe this trend will continue as the international players look to compound their operating leverage, technology leadership and offering depth. With long-term growth rates in the U.S. and Europe projected to be below 10%, M&A activity in emerging markets will be a major focus as firms look to execute growth opportunities. 2007 Outlook We believe deal activity will continue to increase over the next year. The “everybody’s invited” capital party will push the high-quality firms to continue leveraging their assets to grow inorganically because they know at some point the music will stop and they will be ushered out the door with long-term 6% to 8% growth rates waiting for them at home. For now, we predict Securitas and Securicor will be highly acquisitive. Securitas spun off its Services and Direct divisions in October 2006, and Securicor plans to spin off its Cash Handling Services in 2007. We look for the industry to continue consolidating until the top players can gain share only by stealing it from each other.
INDEXED STOCK PERFORMANCE
80
90
100
110
120
1/1/
2006
2/1/
2006
3/1/
2006
4/1/
2006
5/1/
2006
6/1/
2006
7/1/
2006
8/1/
2006
9/1/
2006
Security & Safety Composite S&P 500
Source: Capital IQ
Source: Analyst Reports, Piper Jaffray and Securities Data Corporation
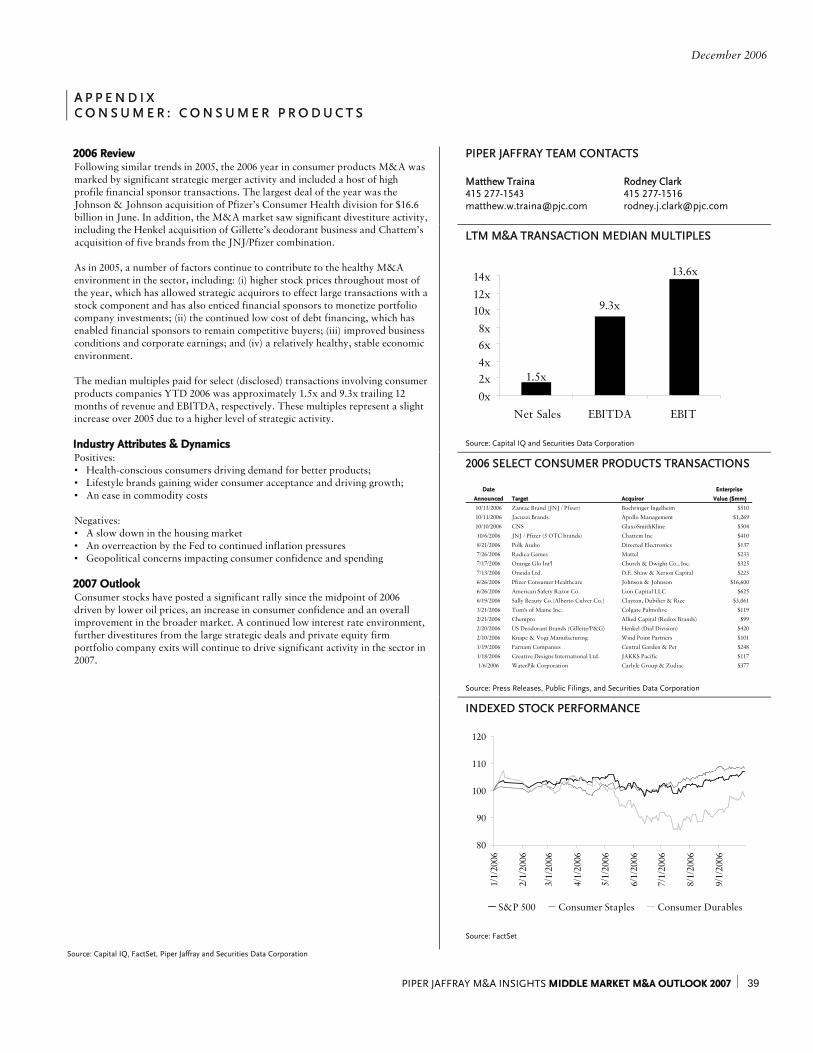
December 2006
PIPER JAFFRAY M&A INSIGHTS MIDDLE MARKET M&A OUTLOOK 2007 ⏐ 39
A P P E N D I X C O N S U M E R : C O N S U M E R P R O D U C T S
PIPER JAFFRAY TEAM CONTACTS Matthew Traina Rodney Clark 415 277-1543 415 277-1516 [email protected] [email protected]
LTM M&A TRANSACTION MEDIAN MULTIPLES
1.5x
9.3x
13.6x
0x2x4x6x8x
10x12x14x
Net Sales EBITDA EBIT
Source: Capital IQ and Securities Data Corporation
2006 SELECT CONSUMER PRODUCTS TRANSACTIONS
Date Enterprise
Announced Target Acquiror Value ($mm)
10/13/2006 Zantac Brand (JNJ / Pfizer) Boehringer Ingelheim $510
10/11/2006 Jacuzzi Brands Apollo Management $1,269
10/10/2006 CNS GlaxoSmithKline $504
10/6/2006 JNJ / Pfizer (5 OTC brands) Chattem Inc $410
8/21/2006 Polk Audio Directed Electronics $137
7/26/2006 Radica Games Mattel $233
7/17/2006 Orange Glo Int'l Church & Dwight Co., Inc. $325
7/13/2006 Oneida Ltd. D.E. Shaw & Xerion Capital $225
6/26/2006 Pfizer Consumer Healthcare Johnson & Johnson $16,600
6/26/2006 American Safety Razor Co. Lion Capital LLC $625
6/19/2006 Sally Beauty Co.(Alberto Culver Co.) Clayton, Dubilier & Rice $3,061
3/21/2006 Tom's of Maine Inc. Colgate Palmolive $119
2/21/2006 Chempro Allied Capital (Redox Brands) $99
2/20/2006 US Deodorant Brands (Gillette/P&G) Henkel (Dial Division) $420
2/10/2006 Knape & Vogt Manufacturing Wind Point Partners $101
1/19/2006 Farnam Companies Central Garden & Pet $248
1/18/2006 Creative Designs International Ltd. JAKKS Pacific $117
1/6/2006 WaterPik Corporation Carlyle Group & Zodiac $377
Source: Press Releases, Public Filings, and Securities Data Corporation
2006 Review Following similar trends in 2005, the 2006 year in consumer products M&A was marked by significant strategic merger activity and included a host of high profile financial sponsor transactions. The largest deal of the year was the Johnson & Johnson acquisition of Pfizer’s Consumer Health division for $16.6 billion in June. In addition, the M&A market saw significant divestiture activity, including the Henkel acquisition of Gillette’s deodorant business and Chattem’s acquisition of five brands from the JNJ/Pfizer combination. As in 2005, a number of factors continue to contribute to the healthy M&A environment in the sector, including: (i) higher stock prices throughout most of the year, which has allowed strategic acquirors to effect large transactions with a stock component and has also enticed financial sponsors to monetize portfolio company investments; (ii) the continued low cost of debt financing, which has enabled financial sponsors to remain competitive buyers; (iii) improved business conditions and corporate earnings; and (iv) a relatively healthy, stable economic environment. The median multiples paid for select (disclosed) transactions involving consumer products companies YTD 2006 was approximately 1.5x and 9.3x trailing 12 months of revenue and EBITDA, respectively. These multiples represent a slight increase over 2005 due to a higher level of strategic activity. Industry Attributes & Dynamics Positives: • Health-conscious consumers driving demand for better products; • Lifestyle brands gaining wider consumer acceptance and driving growth; • An ease in commodity costs Negatives: • A slow down in the housing market • An overreaction by the Fed to continued inflation pressures • Geopolitical concerns impacting consumer confidence and spending 2007 Outlook Consumer stocks have posted a significant rally since the midpoint of 2006 driven by lower oil prices, an increase in consumer confidence and an overall improvement in the broader market. A continued low interest rate environment, further divestitures from the large strategic deals and private equity firm portfolio company exits will continue to drive significant activity in the sector in 2007.
INDEXED STOCK PERFORMANCE
80
90
100
110
120
1/1/
2006
2/1/
2006
3/1/
2006
4/1/
2006
5/1/
2006
6/1/
2006
7/1/
2006
8/1/
2006
9/1/
2006
S&P 500 Consumer Staples Consumer Durables
Source: FactSet
Source: Capital IQ, FactSet, Piper Jaffray and Securities Data Corporation
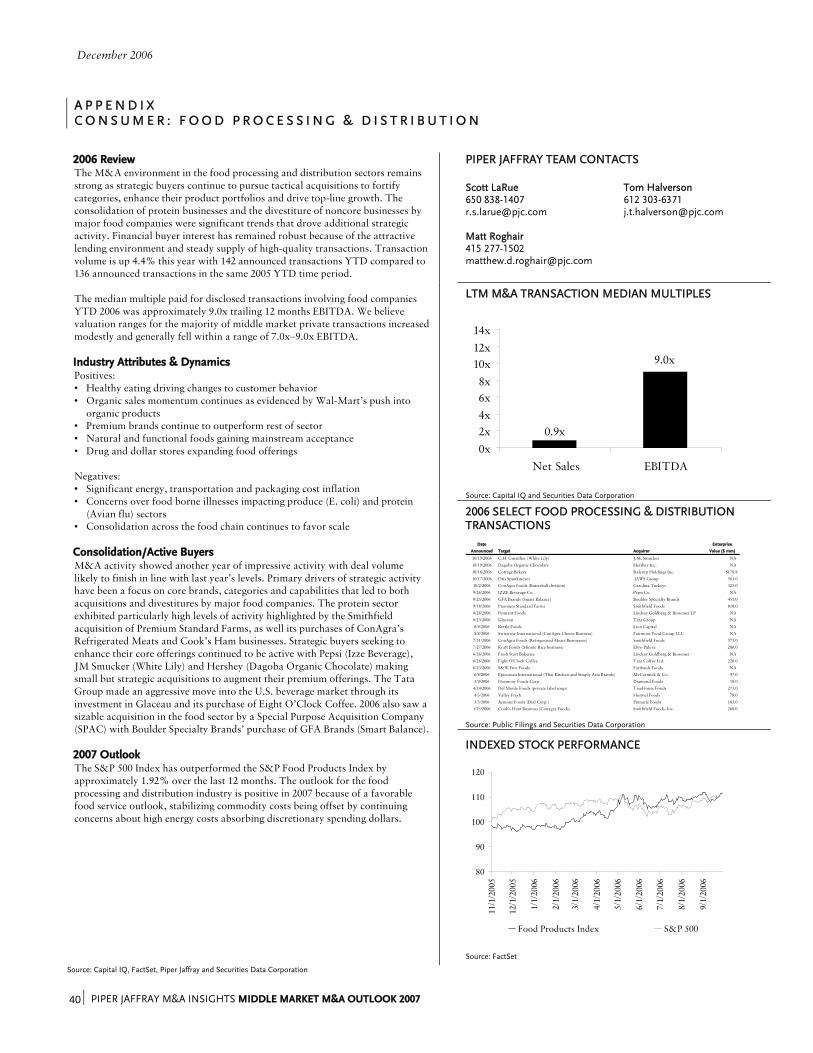
December 2006
PIPER JAFFRAY M&A INSIGHTS MIDDLE MARKET M&A OUTLOOK 2007 40 ⏐
A P P E N D I X C O N S U M E R : F O O D P R O C E S S I N G & D I S T R I B U T I O N
PIPER JAFFRAY TEAM CONTACTS Scott LaRue Tom Halverson 650 838-1407 612 303-6371 [email protected] [email protected] Matt Roghair 415 277-1502 [email protected]
LTM M&A TRANSACTION MEDIAN MULTIPLES
0.9x
9.0x
0x2x4x6x8x
10x12x14x
Net Sales EBITDA
Source: Capital IQ and Securities Data Corporation
2006 SELECT FOOD PROCESSING & DISTRIBUTION TRANSACTIONS
Date Enterprise
Announced Target Acquiror Value ($ mm)
10/19/2006 C.H. Guenther (White Lily) J.M. Smucker NA
10/19/2006 Dagoba Organic Chocolate Hershey Inc. NA
10/18/2006 Cottage Bakery Ralcorp Holdings Inc. $170.8
10/17/2006 Otis Spunkmeyer IAWS Group 561.0
10/2/2006 ConAgra Foods (Butterball division) Carolina Turkeys 325.0
9/26/2006 IZZE Beverage Co. Pepsi Co. NA
9/25/2006 GFA Brands (Smart Balance) Boulder Specialty Brands 451.0
9/18/2006 Premium Standard Farms Smithfield Foods 810.0
8/28/2006 Pennant Foods Lindsay Goldberg & Bessemer LP NA
8/23/2006 Glaceau Tata Group NA
8/9/2006 Kettle Foods Lion Capital NA
8/8/2006 Swissrose International (ConAgra Cheese Business) Fairmont Food Group LLC NA
7/31/2006 ConAgra Foods (Refrigerated Meats Businesses) Smithfield Foods 575.0
7/27/2006 Kraft Foods (Minute Rice business) Ebro Puleva 280.0
6/26/2006 Fresh Start Bakeries Lindsay Goldberg & Bessemer NA
6/26/2006 Eight O'Clock Coffee Tata Coffee Ltd. 220.0
6/23/2006 S&W Fine Foods Faribault Foods NA
6/8/2006 Epicurean International (Thai Kitchen and Simply Asia Brands) McCormick & Co. 97.0
5/9/2006 Harmony Foods Corp Diamond Foods 18.0
4/24/2006 Del Monte Foods (private label soup) TreeHouse Foods 275.0
4/3/2006 Valley Fresh Hormel Foods 78.0
3/3/2006 Armour Foods (Dial Corp.) Pinnacle Foods 183.0
1/25/2006 Cook's Ham Business (Conagra Foods) Smithfield Foods, Inc. 260.0
Source: Public Filings and Securities Data Corporation
2006 Review The M&A environment in the food processing and distribution sectors remains strong as strategic buyers continue to pursue tactical acquisitions to fortify categories, enhance their product portfolios and drive top-line growth. The consolidation of protein businesses and the divestiture of noncore businesses by major food companies were significant trends that drove additional strategic activity. Financial buyer interest has remained robust because of the attractive lending environment and steady supply of high-quality transactions. Transaction volume is up 4.4% this year with 142 announced transactions YTD compared to 136 announced transactions in the same 2005 YTD time period. The median multiple paid for disclosed transactions involving food companies YTD 2006 was approximately 9.0x trailing 12 months EBITDA. We believe valuation ranges for the majority of middle market private transactions increased modestly and generally fell within a range of 7.0x–9.0x EBITDA. Industry Attributes & Dynamics Positives: • Healthy eating driving changes to customer behavior • Organic sales momentum continues as evidenced by Wal-Mart’s push into
organic products • Premium brands continue to outperform rest of sector • Natural and functional foods gaining mainstream acceptance • Drug and dollar stores expanding food offerings Negatives: • Significant energy, transportation and packaging cost inflation • Concerns over food borne illnesses impacting produce (E. coli) and protein
(Avian flu) sectors • Consolidation across the food chain continues to favor scale Consolidation/Active Buyers M&A activity showed another year of impressive activity with deal volume likely to finish in line with last year’s levels. Primary drivers of strategic activity have been a focus on core brands, categories and capabilities that led to both acquisitions and divestitures by major food companies. The protein sector exhibited particularly high levels of activity highlighted by the Smithfield acquisition of Premium Standard Farms, as well its purchases of ConAgra’s Refrigerated Meats and Cook’s Ham businesses. Strategic buyers seeking to enhance their core offerings continued to be active with Pepsi (Izze Beverage), JM Smucker (White Lily) and Hershey (Dagoba Organic Chocolate) making small but strategic acquisitions to augment their premium offerings. The Tata Group made an aggressive move into the U.S. beverage market through its investment in Glaceau and its purchase of Eight O’Clock Coffee. 2006 also saw a sizable acquisition in the food sector by a Special Purpose Acquisition Company (SPAC) with Boulder Specialty Brands’ purchase of GFA Brands (Smart Balance). 2007 Outlook The S&P 500 Index has outperformed the S&P Food Products Index by approximately 1.92% over the last 12 months. The outlook for the food processing and distribution industry is positive in 2007 because of a favorable food service outlook, stabilizing commodity costs being offset by continuing concerns about high energy costs absorbing discretionary spending dollars.
INDEXED STOCK PERFORMANCE
80
90
100
110
120
11/1
/200
5
12/1
/200
5
1/1/
2006
2/1/
2006
3/1/
2006
4/1/
2006
5/1/
2006
6/1/
2006
7/1/
2006
8/1/
2006
9/1/
2006
Food Products Index S&P 500
Source: FactSet
Source: Capital IQ, FactSet, Piper Jaffray and Securities Data Corporation
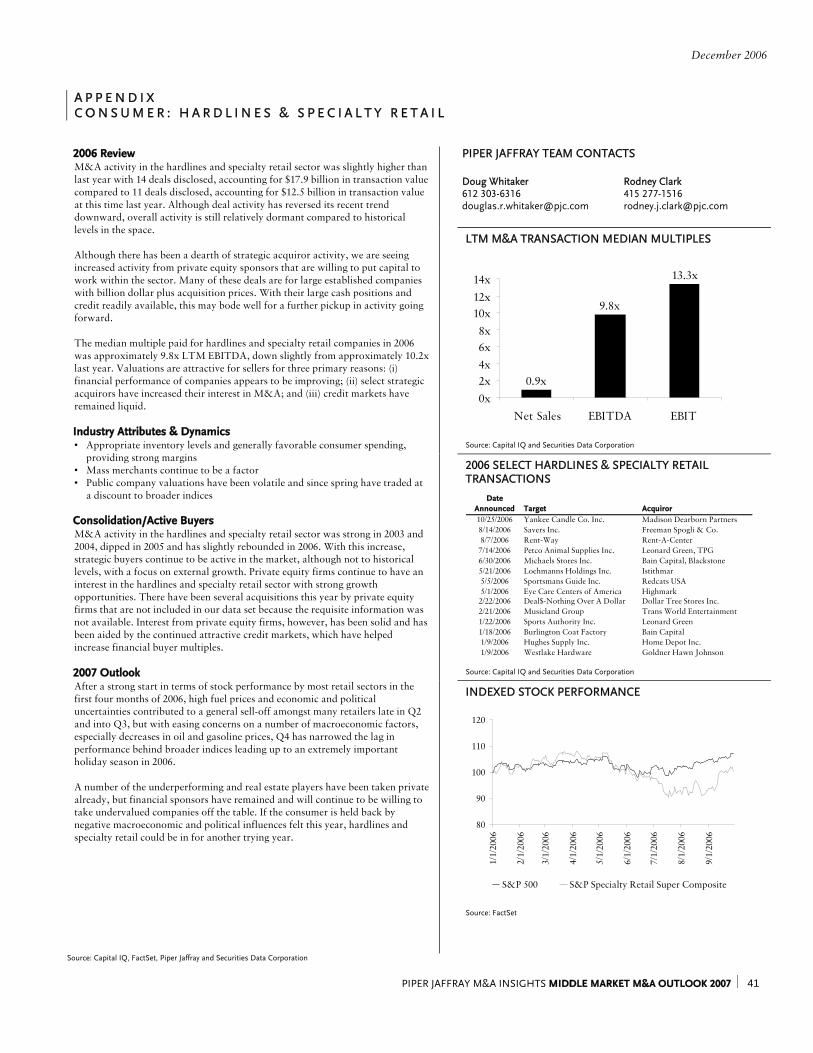
December 2006
PIPER JAFFRAY M&A INSIGHTS MIDDLE MARKET M&A OUTLOOK 2007 ⏐ 41
A P P E N D I X C O N S U M E R : H A R D L I N E S & S P E C I A L T Y R E T A I L
PIPER JAFFRAY TEAM CONTACTS Doug Whitaker Rodney Clark 612 303-6316 415 277-1516 [email protected] [email protected]
LTM M&A TRANSACTION MEDIAN MULTIPLES
0.9x
9.8x
13.3x
0x2x4x6x8x
10x12x14x
Net Sales EBITDA EBIT
Source: Capital IQ and Securities Data Corporation
2006 SELECT HARDLINES & SPECIALTY RETAIL TRANSACTIONS
DateAnnounced Target Acquiror10/25/2006 Yankee Candle Co. Inc. Madison Dearborn Partners8/14/2006 Savers Inc. Freeman Spogli & Co.8/7/2006 Rent-Way Rent-A-Center
7/14/2006 Petco Animal Supplies Inc. Leonard Green, TPG6/30/2006 Michaels Stores Inc. Bain Capital, Blackstone5/21/2006 Loehmanns Holdings Inc. Istithmar5/5/2006 Sportsmans Guide Inc. Redcats USA5/1/2006 Eye Care Centers of America Highmark
2/22/2006 Deal$-Nothing Over A Dollar Dollar Tree Stores Inc.2/21/2006 Musicland Group Trans World Entertainment1/22/2006 Sports Authority Inc. Leonard Green1/18/2006 Burlington Coat Factory Bain Capital1/9/2006 Hughes Supply Inc. Home Depot Inc.1/9/2006 Westlake Hardware Goldner Hawn Johnson
Source: Capital IQ and Securities Data Corporation
2006 Review M&A activity in the hardlines and specialty retail sector was slightly higher than last year with 14 deals disclosed, accounting for $17.9 billion in transaction value compared to 11 deals disclosed, accounting for $12.5 billion in transaction value at this time last year. Although deal activity has reversed its recent trend downward, overall activity is still relatively dormant compared to historical levels in the space. Although there has been a dearth of strategic acquiror activity, we are seeing increased activity from private equity sponsors that are willing to put capital to work within the sector. Many of these deals are for large established companies with billion dollar plus acquisition prices. With their large cash positions and credit readily available, this may bode well for a further pickup in activity going forward. The median multiple paid for hardlines and specialty retail companies in 2006 was approximately 9.8x LTM EBITDA, down slightly from approximately 10.2x last year. Valuations are attractive for sellers for three primary reasons: (i) financial performance of companies appears to be improving; (ii) select strategic acquirors have increased their interest in M&A; and (iii) credit markets have remained liquid. Industry Attributes & Dynamics • Appropriate inventory levels and generally favorable consumer spending,
providing strong margins • Mass merchants continue to be a factor • Public company valuations have been volatile and since spring have traded at
a discount to broader indices Consolidation/Active Buyers M&A activity in the hardlines and specialty retail sector was strong in 2003 and 2004, dipped in 2005 and has slightly rebounded in 2006. With this increase, strategic buyers continue to be active in the market, although not to historical levels, with a focus on external growth. Private equity firms continue to have an interest in the hardlines and specialty retail sector with strong growth opportunities. There have been several acquisitions this year by private equity firms that are not included in our data set because the requisite information was not available. Interest from private equity firms, however, has been solid and has been aided by the continued attractive credit markets, which have helped increase financial buyer multiples. 2007 Outlook After a strong start in terms of stock performance by most retail sectors in the first four months of 2006, high fuel prices and economic and political uncertainties contributed to a general sell-off amongst many retailers late in Q2 and into Q3, but with easing concerns on a number of macroeconomic factors, especially decreases in oil and gasoline prices, Q4 has narrowed the lag in performance behind broader indices leading up to an extremely important holiday season in 2006. A number of the underperforming and real estate players have been taken private already, but financial sponsors have remained and will continue to be willing to take undervalued companies off the table. If the consumer is held back by negative macroeconomic and political influences felt this year, hardlines and specialty retail could be in for another trying year.
INDEXED STOCK PERFORMANCE
80
90
100
110
120
1/1/
2006
2/1/
2006
3/1/
2006
4/1/
2006
5/1/
2006
6/1/
2006
7/1/
2006
8/1/
2006
9/1/
2006
S&P 500 S&P Specialty Retail Super Composite
Source: FactSet
Source: Capital IQ, FactSet, Piper Jaffray and Securities Data Corporation
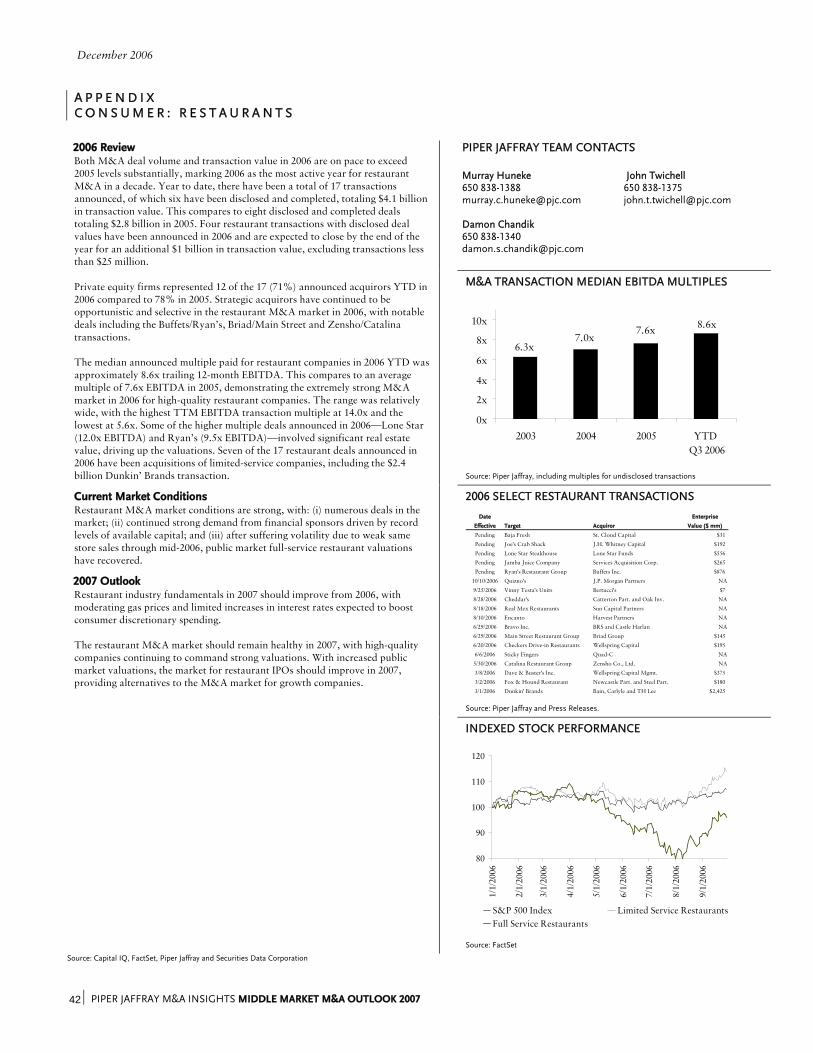
December 2006
PIPER JAFFRAY M&A INSIGHTS MIDDLE MARKET M&A OUTLOOK 2007 42 ⏐
A P P E N D I X C O N S U M E R : R E S T A U R A N T S
PIPER JAFFRAY TEAM CONTACTS
Murray Huneke John Twichell 650 838-1388 650 838-1375 [email protected] [email protected] Damon Chandik 650 838-1340 [email protected]
M&A TRANSACTION MEDIAN EBITDA MULTIPLES
7.6x7.0x
6.3x
8.6x
0x
2x
4x
6x
8x
10x
2003 2004 2005 YTD Q3 2006
Source: Piper Jaffray, including multiples for undisclosed transactions
2006 SELECT RESTAURANT TRANSACTIONS
Date Enterprise
Effective Target Acquiror Value ($ mm)
Pending Baja Fresh St. Cloud Capital $31
Pending Joe's Crab Shack J.H. Whitney Capital $192
Pending Lone Star Steakhouse Lone Star Funds $556
Pending Jamba Juice Company Services Acquisition Corp. $265
Pending Ryan's Restaurant Group Buffets Inc. $876
10/10/2006 Quizno's J.P. Morgan Partners NA
9/25/2006 Vinny Testa's Units Bertucci's $7
8/28/2006 Cheddar's Catterton Part. and Oak Inv. NA
8/18/2006 Real Mex Restaurants Sun Capital Partners NA
8/10/2006 Encanto Harvest Partners NA
6/29/2006 Bravo Inc. BRS and Castle Harlan NA
6/29/2006 Main Street Restaurant Group Briad Group $145
6/20/2006 Checkers Drive-in Restaurants Wellspring Capital $195
6/6/2006 Sticky Fingers Quad-C NA
5/30/2006 Catalina Restaurant Group Zensho Co., Ltd. NA
3/8/2006 Dave & Buster's Inc. Wellspring Capital Mgmt. $375
3/2/2006 Fox & Hound Restaurant Newcastle Part. and Steel Part. $180
3/1/2006 Dunkin' Brands Bain, Carlyle and TH Lee $2,425
Source: Piper Jaffray and Press Releases.
2006 Review Both M&A deal volume and transaction value in 2006 are on pace to exceed 2005 levels substantially, marking 2006 as the most active year for restaurant M&A in a decade. Year to date, there have been a total of 17 transactions announced, of which six have been disclosed and completed, totaling $4.1 billion in transaction value. This compares to eight disclosed and completed deals totaling $2.8 billion in 2005. Four restaurant transactions with disclosed deal values have been announced in 2006 and are expected to close by the end of the year for an additional $1 billion in transaction value, excluding transactions less than $25 million. Private equity firms represented 12 of the 17 (71%) announced acquirors YTD in 2006 compared to 78% in 2005. Strategic acquirors have continued to be opportunistic and selective in the restaurant M&A market in 2006, with notable deals including the Buffets/Ryan’s, Briad/Main Street and Zensho/Catalina transactions. The median announced multiple paid for restaurant companies in 2006 YTD was approximately 8.6x trailing 12-month EBITDA. This compares to an average multiple of 7.6x EBITDA in 2005, demonstrating the extremely strong M&A market in 2006 for high-quality restaurant companies. The range was relatively wide, with the highest TTM EBITDA transaction multiple at 14.0x and the lowest at 5.6x. Some of the higher multiple deals announced in 2006—Lone Star (12.0x EBITDA) and Ryan’s (9.5x EBITDA)—involved significant real estate value, driving up the valuations. Seven of the 17 restaurant deals announced in 2006 have been acquisitions of limited-service companies, including the $2.4 billion Dunkin’ Brands transaction.
Current Market Conditions Restaurant M&A market conditions are strong, with: (i) numerous deals in the market; (ii) continued strong demand from financial sponsors driven by record levels of available capital; and (iii) after suffering volatility due to weak same store sales through mid-2006, public market full-service restaurant valuations have recovered.
2007 Outlook Restaurant industry fundamentals in 2007 should improve from 2006, with moderating gas prices and limited increases in interest rates expected to boost consumer discretionary spending. The restaurant M&A market should remain healthy in 2007, with high-quality companies continuing to command strong valuations. With increased public market valuations, the market for restaurant IPOs should improve in 2007, providing alternatives to the M&A market for growth companies.
INDEXED STOCK PERFORMANCE
80
90
100
110
120
1/1/
2006
2/1/
2006
3/1/
2006
4/1/
2006
5/1/
2006
6/1/
2006
7/1/
2006
8/1/
2006
9/1/
2006
S&P 500 Index Limited Service RestaurantsFull Service Restaurants
Source: FactSet
Source: Capital IQ, FactSet, Piper Jaffray and Securities Data Corporation
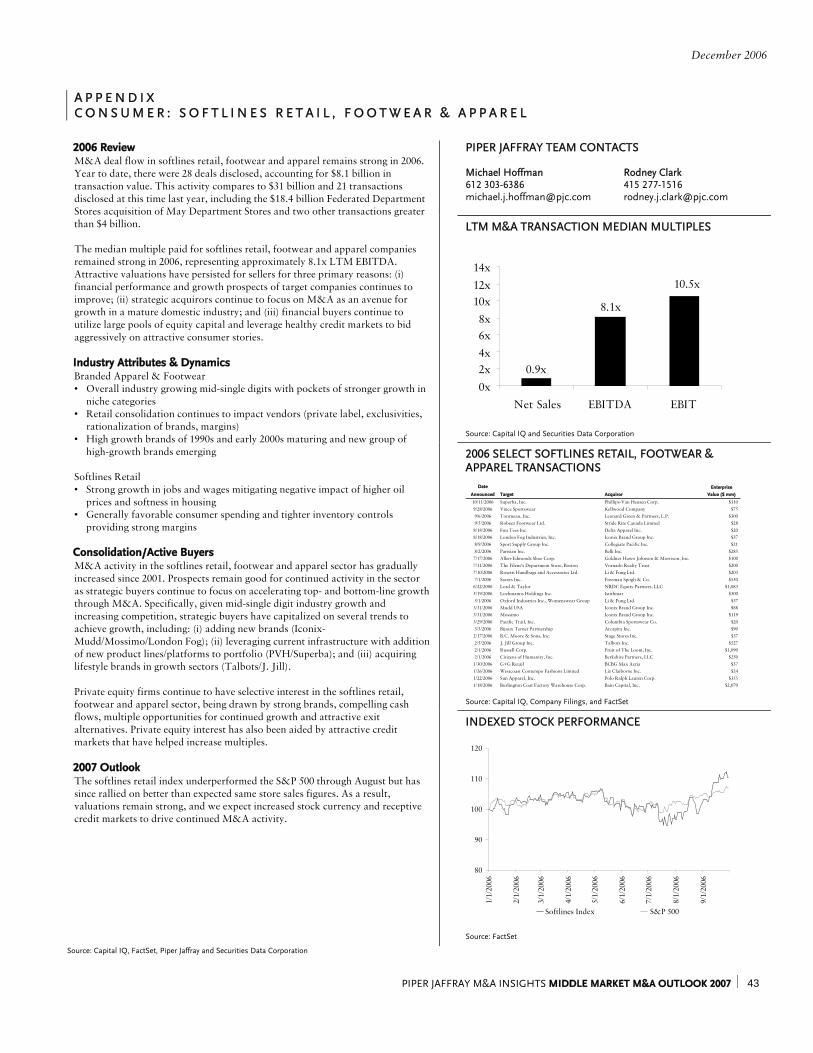
December 2006
PIPER JAFFRAY M&A INSIGHTS MIDDLE MARKET M&A OUTLOOK 2007 ⏐ 43
A P P E N D I X C O N S U M E R : S O F T L I N E S R E T A I L , F O O T W E A R & A P P A R E L
PIPER JAFFRAY TEAM CONTACTS Michael Hoffman Rodney Clark 612 303-6386 415 277-1516 [email protected] [email protected]
LTM M&A TRANSACTION MEDIAN MULTIPLES
0.9x
8.1x
10.5x
0x2x4x6x8x
10x12x14x
Net Sales EBITDA EBIT
Source: Capital IQ and Securities Data Corporation 2006 SELECT SOFTLINES RETAIL, FOOTWEAR &
APPAREL TRANSACTIONS Date Enterprise
Announced Target Acquiror Value ($ mm)
10/11/2006 Superba, Inc. Phillips-Van Heusen Corp. $1109/28/2006 Vince Sportswear Kellwood Company $759/6/2006 Tourneau, Inc. Leonard Green & Partners, L.P. $3009/5/2006 Robeez Footwear Ltd. Stride Rite Canada Limited $28
8/18/2006 Fun Tees Inc. Delta Apparel Inc. $208/18/2006 London Fog Industries, Inc. Iconix Brand Group Inc. $378/9/2006 Sport Supply Group Inc. Collegiate Pacific Inc. $218/2/2006 Parisian Inc. Belk Inc. $285
7/17/2006 Allen-Edmonds Shoe Corp. Goldner Hawn Johnson & Morrison, Inc. $1007/11/2006 The Filene's Department Store, Boston Vornado Realty Trust $2007/10/2006 Rosetti Handbags and Accessories Ltd. Li & Fung Ltd. $2037/1/2006 Savers Inc. Freeman Spogli & Co. $550
6/22/2006 Lord & Taylor NRDC Equity Partners, LLC $1,0835/19/2006 Loehmanns Holdings Inc. Istithmar $3005/1/2006 Oxford Industries Inc., Womenswear Group Li & Fung Ltd. $37
3/31/2006 Mudd USA Iconix Brand Group Inc. $883/31/2006 Mossimo Iconix Brand Group Inc. $1193/29/2006 Pacific Trail, Inc. Columbia Sportswear Co. $203/3/2006 Bijoux Terner Partnership Arcapita Inc. $90
2/17/2006 B.C. Moore & Sons, Inc. Stage Stores Inc. $372/5/2006 J. Jill Group Inc. Talbots Inc. $5272/1/2006 Russell Corp. Fruit of The Loom, Inc. $1,0902/1/2006 Citizens of Humanity, Inc. Berkshire Partners, LLC $250
1/30/2006 G+G Retail BCBG Max Azria $371/26/2006 Westcoast Contempo Fashions Limited Liz Claiborne Inc. $241/22/2006 Sun Apparel, Inc. Polo Ralph Lauren Corp. $3551/18/2006 Burlington Coat Factory Warehouse Corp. Bain Capital, Inc. $2,070
Source: Capital IQ, Company Filings, and FactSet
2006 Review M&A deal flow in softlines retail, footwear and apparel remains strong in 2006. Year to date, there were 28 deals disclosed, accounting for $8.1 billion in transaction value. This activity compares to $31 billion and 21 transactions disclosed at this time last year, including the $18.4 billion Federated Department Stores acquisition of May Department Stores and two other transactions greater than $4 billion. The median multiple paid for softlines retail, footwear and apparel companies remained strong in 2006, representing approximately 8.1x LTM EBITDA. Attractive valuations have persisted for sellers for three primary reasons: (i) financial performance and growth prospects of target companies continues to improve; (ii) strategic acquirors continue to focus on M&A as an avenue for growth in a mature domestic industry; and (iii) financial buyers continue to utilize large pools of equity capital and leverage healthy credit markets to bid aggressively on attractive consumer stories. Industry Attributes & Dynamics Branded Apparel & Footwear • Overall industry growing mid-single digits with pockets of stronger growth in
niche categories • Retail consolidation continues to impact vendors (private label, exclusivities,
rationalization of brands, margins) • High growth brands of 1990s and early 2000s maturing and new group of
high-growth brands emerging Softlines Retail • Strong growth in jobs and wages mitigating negative impact of higher oil
prices and softness in housing • Generally favorable consumer spending and tighter inventory controls
providing strong margins Consolidation/Active Buyers M&A activity in the softlines retail, footwear and apparel sector has gradually increased since 2001. Prospects remain good for continued activity in the sector as strategic buyers continue to focus on accelerating top- and bottom-line growth through M&A. Specifically, given mid-single digit industry growth and increasing competition, strategic buyers have capitalized on several trends to achieve growth, including: (i) adding new brands (Iconix-Mudd/Mossimo/London Fog); (ii) leveraging current infrastructure with addition of new product lines/platforms to portfolio (PVH/Superba); and (iii) acquiring lifestyle brands in growth sectors (Talbots/J. Jill). Private equity firms continue to have selective interest in the softlines retail, footwear and apparel sector, being drawn by strong brands, compelling cash flows, multiple opportunities for continued growth and attractive exit alternatives. Private equity interest has also been aided by attractive credit markets that have helped increase multiples. 2007 Outlook The softlines retail index underperformed the S&P 500 through August but has since rallied on better than expected same store sales figures. As a result, valuations remain strong, and we expect increased stock currency and receptive credit markets to drive continued M&A activity.
INDEXED STOCK PERFORMANCE
80
90
100
110
120
1/1/
2006
2/1/
2006
3/1/
2006
4/1/
2006
5/1/
2006
6/1/
2006
7/1/
2006
8/1/
2006
9/1/
2006
Softlines Index S&P 500
Source: FactSet
Source: Capital IQ, FactSet, Piper Jaffray and Securities Data Corporation
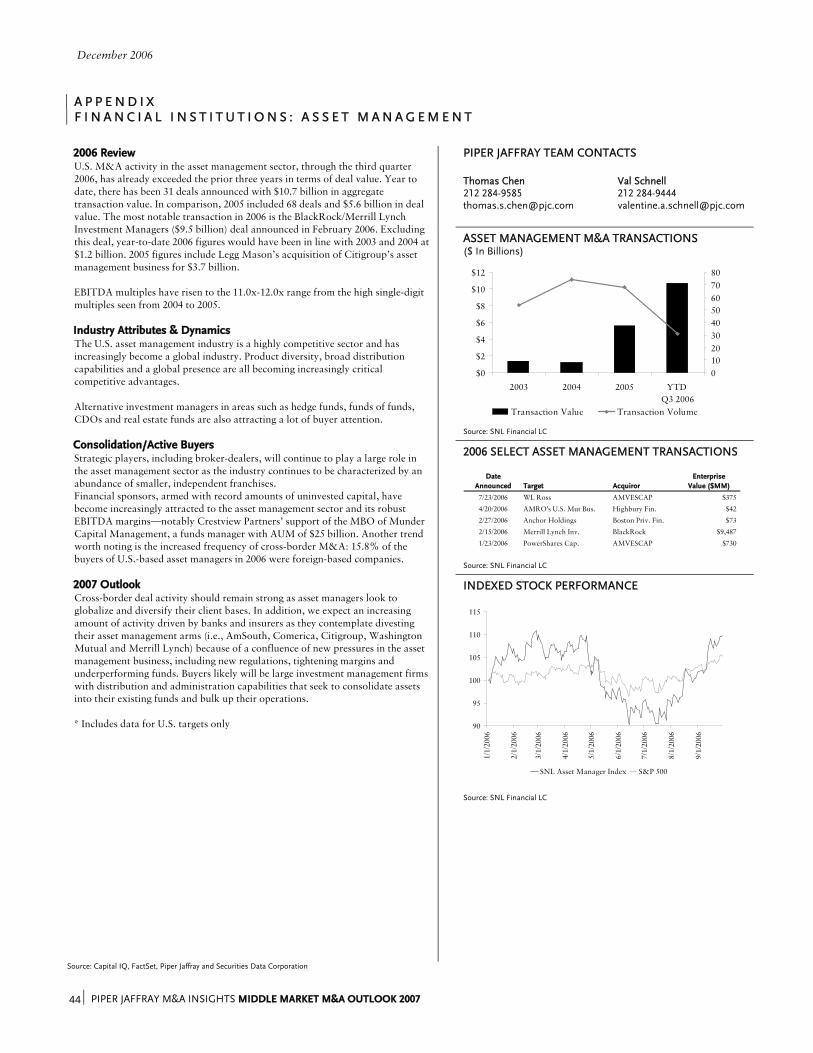
December 2006
PIPER JAFFRAY M&A INSIGHTS MIDDLE MARKET M&A OUTLOOK 2007 44 ⏐
A P P E N D I X F I N A N C I A L I N S T I T U T I O N S : A S S E T M A N A G E M E N T
PIPER JAFFRAY TEAM CONTACTS Thomas Chen Val Schnell 212 284-9585 212 284-9444 [email protected] [email protected] ASSET MANAGEMENT M&A TRANSACTIONS ($ In Billions)
$0
$2
$4
$6
$8
$10
$12
2003 2004 2005 YTD Q3 2006
01020304050607080
Transaction Value Transaction Volume Source: SNL Financial LC
2006 SELECT ASSET MANAGEMENT TRANSACTIONS
DateAnnounced Target Acquiror
EnterpriseValue ($MM)
7/23/2006 WL Ross AMVESCAP $375
4/20/2006 AMRO's U.S. Mut Bus. Highbury Fin. $42
2/27/2006 Anchor Holdings Boston Priv. Fin. $73
2/15/2006 Merrill Lynch Inv. BlackRock $9,487
1/23/2006 PowerShares Cap. AMVESCAP $730
Source: SNL Financial LC
2006 Review U.S. M&A activity in the asset management sector, through the third quarter 2006, has already exceeded the prior three years in terms of deal value. Year to date, there has been 31 deals announced with $10.7 billion in aggregate transaction value. In comparison, 2005 included 68 deals and $5.6 billion in deal value. The most notable transaction in 2006 is the BlackRock/Merrill Lynch Investment Managers ($9.5 billion) deal announced in February 2006. Excluding this deal, year-to-date 2006 figures would have been in line with 2003 and 2004 at $1.2 billion. 2005 figures include Legg Mason’s acquisition of Citigroup’s asset management business for $3.7 billion. EBITDA multiples have risen to the 11.0x-12.0x range from the high single-digit multiples seen from 2004 to 2005. Industry Attributes & Dynamics The U.S. asset management industry is a highly competitive sector and has increasingly become a global industry. Product diversity, broad distribution capabilities and a global presence are all becoming increasingly critical competitive advantages. Alternative investment managers in areas such as hedge funds, funds of funds, CDOs and real estate funds are also attracting a lot of buyer attention. Consolidation/Active Buyers Strategic players, including broker-dealers, will continue to play a large role in the asset management sector as the industry continues to be characterized by an abundance of smaller, independent franchises. Financial sponsors, armed with record amounts of uninvested capital, have become increasingly attracted to the asset management sector and its robust EBITDA margins—notably Crestview Partners’ support of the MBO of Munder Capital Management, a funds manager with AUM of $25 billion. Another trend worth noting is the increased frequency of cross-border M&A: 15.8% of the buyers of U.S.-based asset managers in 2006 were foreign-based companies. 2007 Outlook Cross-border deal activity should remain strong as asset managers look to globalize and diversify their client bases. In addition, we expect an increasing amount of activity driven by banks and insurers as they contemplate divesting their asset management arms (i.e., AmSouth, Comerica, Citigroup, Washington Mutual and Merrill Lynch) because of a confluence of new pressures in the asset management business, including new regulations, tightening margins and underperforming funds. Buyers likely will be large investment management firms with distribution and administration capabilities that seek to consolidate assets into their existing funds and bulk up their operations. * Includes data for U.S. targets only
INDEXED STOCK PERFORMANCE
90
95
100
105
110
115
1/1/
2006
2/1/
2006
3/1/
2006
4/1/
2006
5/1/
2006
6/1/
2006
7/1/
2006
8/1/
2006
9/1/
2006
SNL Asset Manager Index S&P 500
Source: SNL Financial LC
Source: Capital IQ, FactSet, Piper Jaffray and Securities Data Corporation
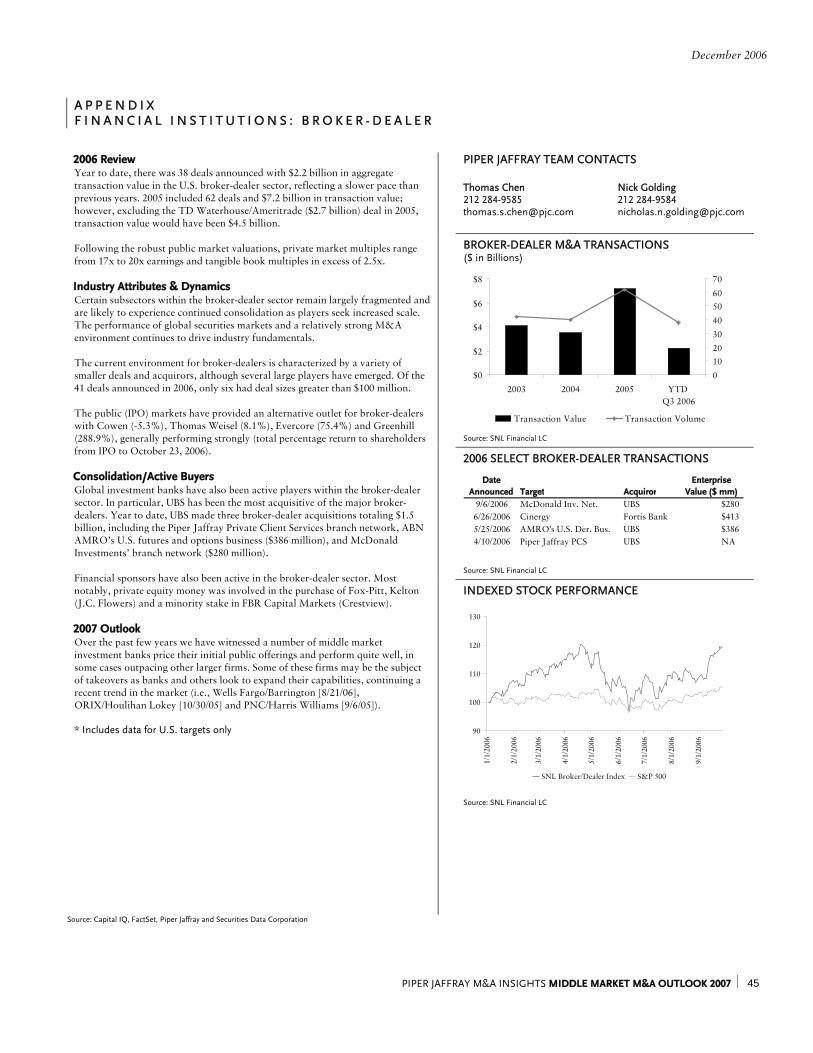
December 2006
PIPER JAFFRAY M&A INSIGHTS MIDDLE MARKET M&A OUTLOOK 2007 ⏐ 45
A P P E N D I X F I N A N C I A L I N S T I T U T I O N S : B R O K E R - D E A L E R
PIPER JAFFRAY TEAM CONTACTS Thomas Chen Nick Golding 212 284-9585 212 284-9584 [email protected] [email protected]
BROKER-DEALER M&A TRANSACTIONS ($ in Billions)
$0
$2
$4
$6
$8
2003 2004 2005 YTD Q3 2006
0
1020
30
40
5060
70
Transaction Value Transaction Volume
Source: SNL Financial LC
2006 SELECT BROKER-DEALER TRANSACTIONS
Source: SNL Financial LC
2006 Review Year to date, there was 38 deals announced with $2.2 billion in aggregate transaction value in the U.S. broker-dealer sector, reflecting a slower pace than previous years. 2005 included 62 deals and $7.2 billion in transaction value; however, excluding the TD Waterhouse/Ameritrade ($2.7 billion) deal in 2005, transaction value would have been $4.5 billion. Following the robust public market valuations, private market multiples range from 17x to 20x earnings and tangible book multiples in excess of 2.5x. Industry Attributes & Dynamics Certain subsectors within the broker-dealer sector remain largely fragmented and are likely to experience continued consolidation as players seek increased scale. The performance of global securities markets and a relatively strong M&A environment continues to drive industry fundamentals. The current environment for broker-dealers is characterized by a variety of smaller deals and acquirors, although several large players have emerged. Of the 41 deals announced in 2006, only six had deal sizes greater than $100 million. The public (IPO) markets have provided an alternative outlet for broker-dealers with Cowen (-5.3%), Thomas Weisel (8.1%), Evercore (75.4%) and Greenhill (288.9%), generally performing strongly (total percentage return to shareholders from IPO to October 23, 2006). Consolidation/Active Buyers Global investment banks have also been active players within the broker-dealer sector. In particular, UBS has been the most acquisitive of the major broker-dealers. Year to date, UBS made three broker-dealer acquisitions totaling $1.5 billion, including the Piper Jaffray Private Client Services branch network, ABN AMRO’s U.S. futures and options business ($386 million), and McDonald Investments’ branch network ($280 million). Financial sponsors have also been active in the broker-dealer sector. Most notably, private equity money was involved in the purchase of Fox-Pitt, Kelton (J.C. Flowers) and a minority stake in FBR Capital Markets (Crestview). 2007 Outlook Over the past few years we have witnessed a number of middle market investment banks price their initial public offerings and perform quite well, in some cases outpacing other larger firms. Some of these firms may be the subject of takeovers as banks and others look to expand their capabilities, continuing a recent trend in the market (i.e., Wells Fargo/Barrington [8/21/06], ORIX/Houlihan Lokey [10/30/05] and PNC/Harris Williams [9/6/05]). * Includes data for U.S. targets only
INDEXED STOCK PERFORMANCE
90
100
110
120
130
1/1/
2006
2/1/
2006
3/1/
2006
4/1/
2006
5/1/
2006
6/1/
2006
7/1/
2006
8/1/
2006
9/1/
2006
SNL Broker/Dealer Index S&P 500
Source: SNL Financial LC
Source: Capital IQ, FactSet, Piper Jaffray and Securities Data Corporation
DateAnnounced Target Acquiror
Enterprise Value ($ mm)
9/6/2006 McDonald Inv. Net. UBS $280 6/26/2006 Cinergy Fortis Bank $413 5/25/2006 AMRO's U.S. Der. Bus. UBS $386 4/10/2006 Piper Jaffray PCS UBS NA
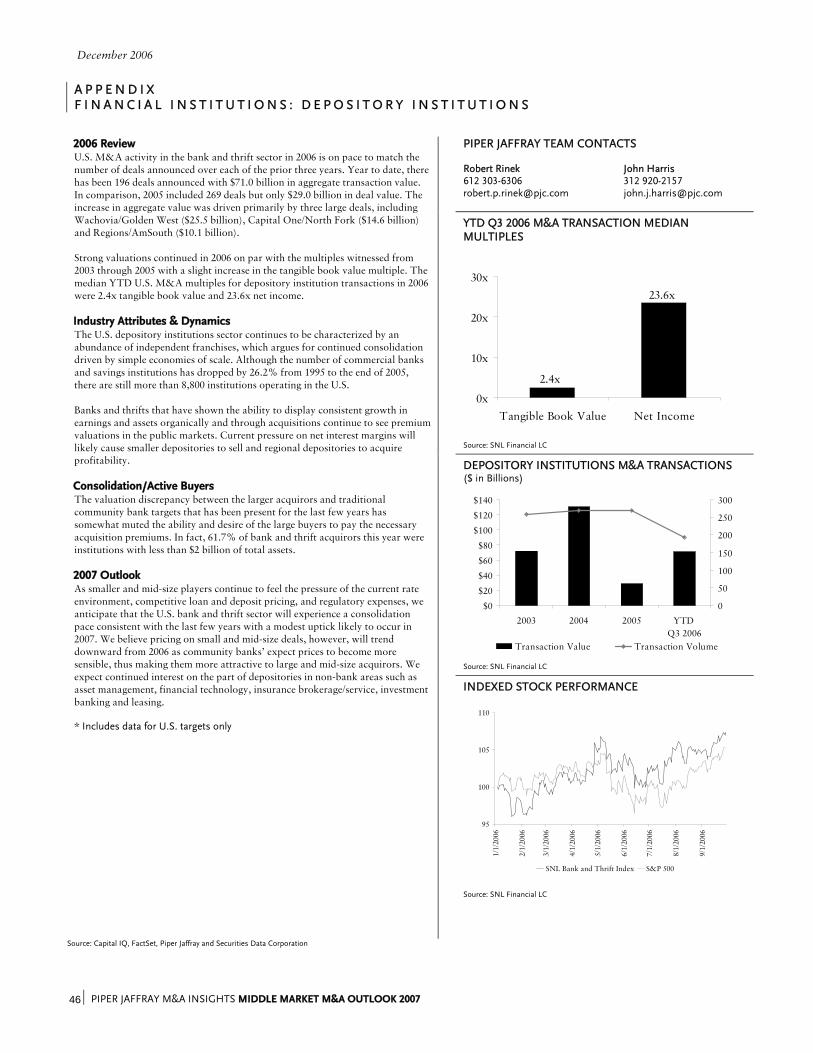
December 2006
PIPER JAFFRAY M&A INSIGHTS MIDDLE MARKET M&A OUTLOOK 2007 46 ⏐
A P P E N D I X F I N A N C I A L I N S T I T U T I O N S : D E P O S I T O R Y I N S T I T U T I O N S
PIPER JAFFRAY TEAM CONTACTS Robert Rinek John Harris 612 303-6306 312 920-2157 [email protected] [email protected]
YTD Q3 2006 M&A TRANSACTION MEDIAN MULTIPLES
23.6x
2.4x
0x
10x
20x
30x
Tangible Book Value Net Income
Source: SNL Financial LC
DEPOSITORY INSTITUTIONS M&A TRANSACTIONS ($ in Billions)
$0
$20
$40
$60
$80
$100
$120
$140
2003 2004 2005 YTD Q3 2006
0
50
100
150
200
250
300
Transaction Value Transaction Volume
Source: SNL Financial LC
2006 Review U.S. M&A activity in the bank and thrift sector in 2006 is on pace to match the number of deals announced over each of the prior three years. Year to date, there has been 196 deals announced with $71.0 billion in aggregate transaction value. In comparison, 2005 included 269 deals but only $29.0 billion in deal value. The increase in aggregate value was driven primarily by three large deals, including Wachovia/Golden West ($25.5 billion), Capital One/North Fork ($14.6 billion) and Regions/AmSouth ($10.1 billion). Strong valuations continued in 2006 on par with the multiples witnessed from 2003 through 2005 with a slight increase in the tangible book value multiple. The median YTD U.S. M&A multiples for depository institution transactions in 2006 were 2.4x tangible book value and 23.6x net income. Industry Attributes & Dynamics The U.S. depository institutions sector continues to be characterized by an abundance of independent franchises, which argues for continued consolidation driven by simple economies of scale. Although the number of commercial banks and savings institutions has dropped by 26.2% from 1995 to the end of 2005, there are still more than 8,800 institutions operating in the U.S. Banks and thrifts that have shown the ability to display consistent growth in earnings and assets organically and through acquisitions continue to see premium valuations in the public markets. Current pressure on net interest margins will likely cause smaller depositories to sell and regional depositories to acquire profitability. Consolidation/Active Buyers The valuation discrepancy between the larger acquirors and traditional community bank targets that has been present for the last few years has somewhat muted the ability and desire of the large buyers to pay the necessary acquisition premiums. In fact, 61.7% of bank and thrift acquirors this year were institutions with less than $2 billion of total assets. 2007 Outlook As smaller and mid-size players continue to feel the pressure of the current rate environment, competitive loan and deposit pricing, and regulatory expenses, we anticipate that the U.S. bank and thrift sector will experience a consolidation pace consistent with the last few years with a modest uptick likely to occur in 2007. We believe pricing on small and mid-size deals, however, will trend downward from 2006 as community banks’ expect prices to become more sensible, thus making them more attractive to large and mid-size acquirors. We expect continued interest on the part of depositories in non-bank areas such as asset management, financial technology, insurance brokerage/service, investment banking and leasing. * Includes data for U.S. targets only
INDEXED STOCK PERFORMANCE
95
100
105
110
1/1/
2006
2/1/
2006
3/1/
2006
4/1/
2006
5/1/
2006
6/1/
2006
7/1/
2006
8/1/
2006
9/1/
2006
SNL Bank and Thrift Index S&P 500
Source: SNL Financial LC
Source: Capital IQ, FactSet, Piper Jaffray and Securities Data Corporation
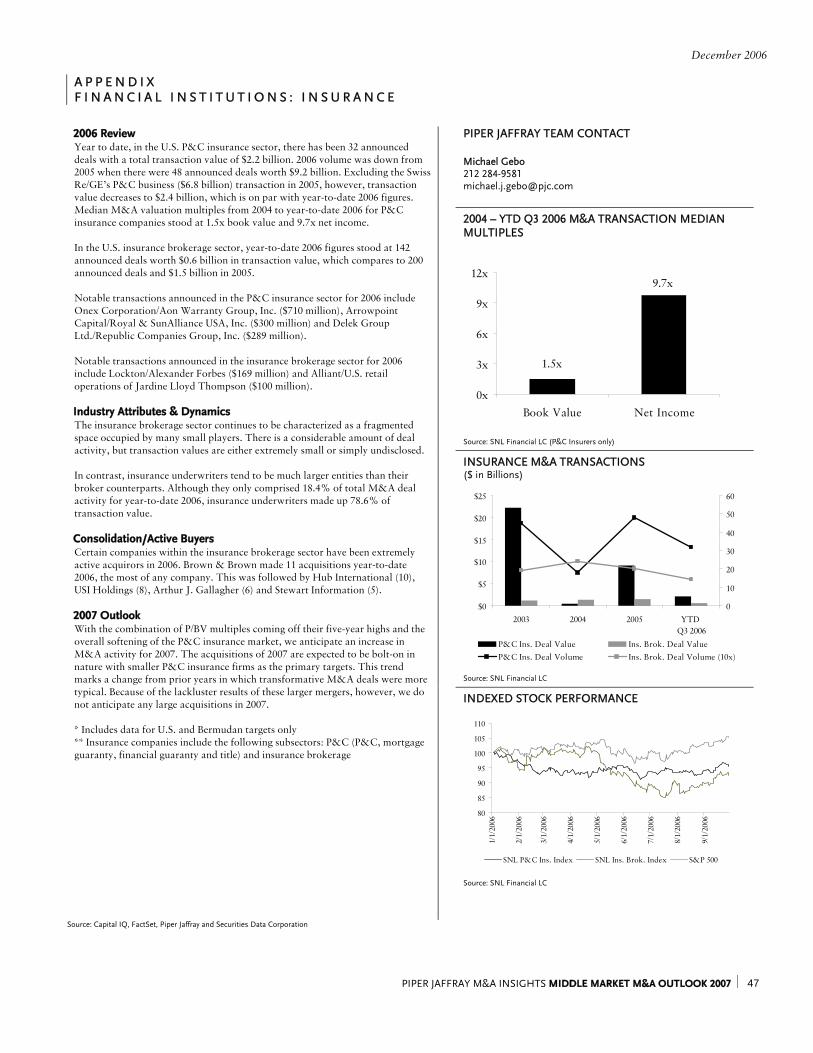
December 2006
PIPER JAFFRAY M&A INSIGHTS MIDDLE MARKET M&A OUTLOOK 2007 ⏐ 47
A P P E N D I X F I N A N C I A L I N S T I T U T I O N S : I N S U R A N C E
PIPER JAFFRAY TEAM CONTACT Michael Gebo 212 284-9581 [email protected]
2004 – YTD Q3 2006 M&A TRANSACTION MEDIAN MULTIPLES
1.5x
9.7x
0x
3x
6x
9x
12x
Book Value Net Income
Source: SNL Financial LC (P&C Insurers only)
INSURANCE M&A TRANSACTIONS ($ in Billions)
$0
$5
$10
$15
$20
$25
2003 2004 2005 YTD Q3 2006
0
10
20
30
40
50
60
P&C Ins. Deal Value Ins. Brok. Deal ValueP&C Ins. Deal Volume Ins. Brok. Deal Volume (10x)
Source: SNL Financial LC
2006 Review Year to date, in the U.S. P&C insurance sector, there has been 32 announced deals with a total transaction value of $2.2 billion. 2006 volume was down from 2005 when there were 48 announced deals worth $9.2 billion. Excluding the Swiss Re/GE’s P&C business ($6.8 billion) transaction in 2005, however, transaction value decreases to $2.4 billion, which is on par with year-to-date 2006 figures. Median M&A valuation multiples from 2004 to year-to-date 2006 for P&C insurance companies stood at 1.5x book value and 9.7x net income. In the U.S. insurance brokerage sector, year-to-date 2006 figures stood at 142 announced deals worth $0.6 billion in transaction value, which compares to 200 announced deals and $1.5 billion in 2005. Notable transactions announced in the P&C insurance sector for 2006 include Onex Corporation/Aon Warranty Group, Inc. ($710 million), Arrowpoint Capital/Royal & SunAlliance USA, Inc. ($300 million) and Delek Group Ltd./Republic Companies Group, Inc. ($289 million). Notable transactions announced in the insurance brokerage sector for 2006 include Lockton/Alexander Forbes ($169 million) and Alliant/U.S. retail operations of Jardine Lloyd Thompson ($100 million). Industry Attributes & Dynamics The insurance brokerage sector continues to be characterized as a fragmented space occupied by many small players. There is a considerable amount of deal activity, but transaction values are either extremely small or simply undisclosed. In contrast, insurance underwriters tend to be much larger entities than their broker counterparts. Although they only comprised 18.4% of total M&A deal activity for year-to-date 2006, insurance underwriters made up 78.6% of transaction value. Consolidation/Active Buyers Certain companies within the insurance brokerage sector have been extremely active acquirors in 2006. Brown & Brown made 11 acquisitions year-to-date 2006, the most of any company. This was followed by Hub International (10), USI Holdings (8), Arthur J. Gallagher (6) and Stewart Information (5). 2007 Outlook With the combination of P/BV multiples coming off their five-year highs and the overall softening of the P&C insurance market, we anticipate an increase in M&A activity for 2007. The acquisitions of 2007 are expected to be bolt-on in nature with smaller P&C insurance firms as the primary targets. This trend marks a change from prior years in which transformative M&A deals were more typical. Because of the lackluster results of these larger mergers, however, we do not anticipate any large acquisitions in 2007. * Includes data for U.S. and Bermudan targets only ** Insurance companies include the following subsectors: P&C (P&C, mortgage guaranty, financial guaranty and title) and insurance brokerage
INDEXED STOCK PERFORMANCE
80
85
90
95
100
105
110
1/1/
2006
2/1/
2006
3/1/
2006
4/1/
2006
5/1/
2006
6/1/
2006
7/1/
2006
8/1/
2006
9/1/
2006
SNL P&C Ins. Index SNL Ins. Brok. Index S&P 500
Source: SNL Financial LC
Source: Capital IQ, FactSet, Piper Jaffray and Securities Data Corporation
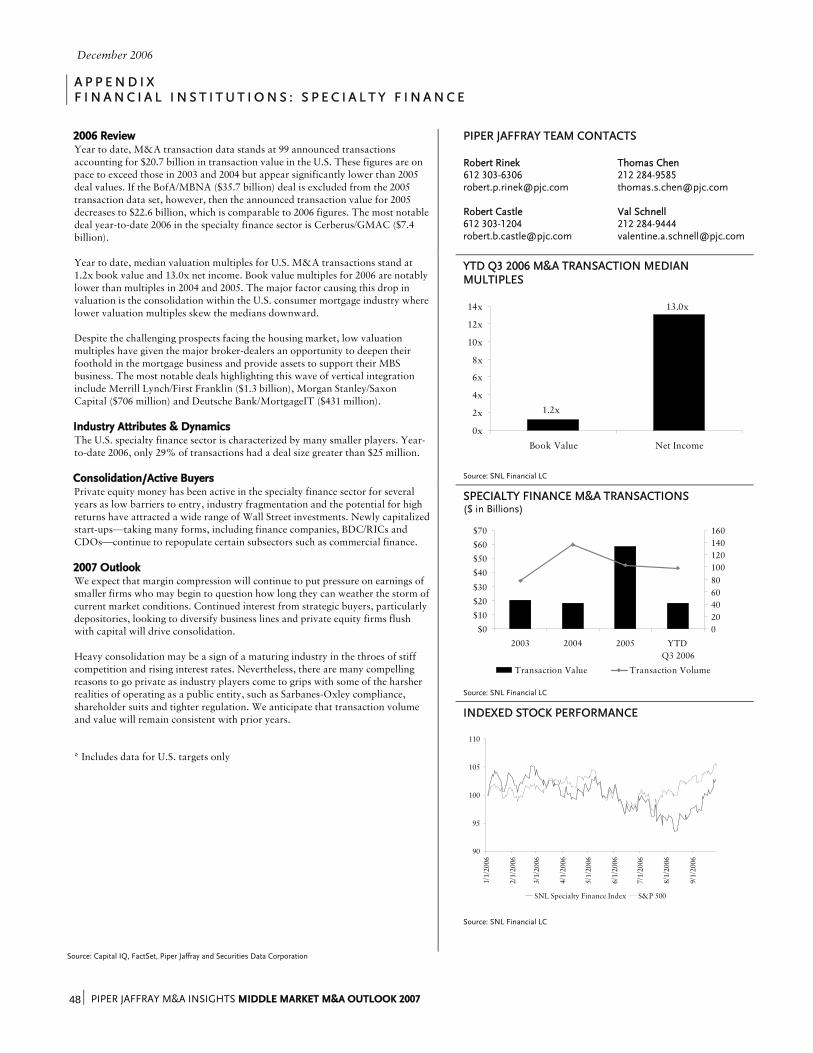
December 2006
PIPER JAFFRAY M&A INSIGHTS MIDDLE MARKET M&A OUTLOOK 2007 48 ⏐
A P P E N D I X F I N A N C I A L I N S T I T U T I O N S : S P E C I A L T Y F I N A N C E
PIPER JAFFRAY TEAM CONTACTS Robert Rinek Thomas Chen 612 303-6306 212 284-9585 [email protected] [email protected] Robert Castle Val Schnell 612 303-1204 212 284-9444 [email protected] [email protected]
YTD Q3 2006 M&A TRANSACTION MEDIAN MULTIPLES
1.2x
13.0x
0x
2x
4x
6x
8x
10x
12x
14x
Book Value Net Income
Source: SNL Financial LC
SPECIALTY FINANCE M&A TRANSACTIONS ($ in Billions)
$0
$10
$20
$30
$40
$50
$60
$70
2003 2004 2005 YTD Q3 2006
020406080100120140160
Transaction Value Transaction Volume
Source: SNL Financial LC
2006 Review Year to date, M&A transaction data stands at 99 announced transactions accounting for $20.7 billion in transaction value in the U.S. These figures are on pace to exceed those in 2003 and 2004 but appear significantly lower than 2005 deal values. If the BofA/MBNA ($35.7 billion) deal is excluded from the 2005 transaction data set, however, then the announced transaction value for 2005 decreases to $22.6 billion, which is comparable to 2006 figures. The most notable deal year-to-date 2006 in the specialty finance sector is Cerberus/GMAC ($7.4 billion). Year to date, median valuation multiples for U.S. M&A transactions stand at 1.2x book value and 13.0x net income. Book value multiples for 2006 are notably lower than multiples in 2004 and 2005. The major factor causing this drop in valuation is the consolidation within the U.S. consumer mortgage industry where lower valuation multiples skew the medians downward. Despite the challenging prospects facing the housing market, low valuation multiples have given the major broker-dealers an opportunity to deepen their foothold in the mortgage business and provide assets to support their MBS business. The most notable deals highlighting this wave of vertical integration include Merrill Lynch/First Franklin ($1.3 billion), Morgan Stanley/Saxon Capital ($706 million) and Deutsche Bank/MortgageIT ($431 million). Industry Attributes & Dynamics The U.S. specialty finance sector is characterized by many smaller players. Year-to-date 2006, only 29% of transactions had a deal size greater than $25 million. Consolidation/Active Buyers Private equity money has been active in the specialty finance sector for several years as low barriers to entry, industry fragmentation and the potential for high returns have attracted a wide range of Wall Street investments. Newly capitalized start-ups—taking many forms, including finance companies, BDC/RICs and CDOs—continue to repopulate certain subsectors such as commercial finance. 2007 Outlook We expect that margin compression will continue to put pressure on earnings of smaller firms who may begin to question how long they can weather the storm of current market conditions. Continued interest from strategic buyers, particularly depositories, looking to diversify business lines and private equity firms flush with capital will drive consolidation. Heavy consolidation may be a sign of a maturing industry in the throes of stiff competition and rising interest rates. Nevertheless, there are many compelling reasons to go private as industry players come to grips with some of the harsher realities of operating as a public entity, such as Sarbanes-Oxley compliance, shareholder suits and tighter regulation. We anticipate that transaction volume and value will remain consistent with prior years. * Includes data for U.S. targets only
INDEXED STOCK PERFORMANCE
90
95
100
105
110
1/1/
2006
2/1/
2006
3/1/
2006
4/1/
2006
5/1/
2006
6/1/
2006
7/1/
2006
8/1/
2006
9/1/
2006
SNL Specialty Finance Index S&P 500
Source: SNL Financial LC
Source: Capital IQ, FactSet, Piper Jaffray and Securities Data Corporation
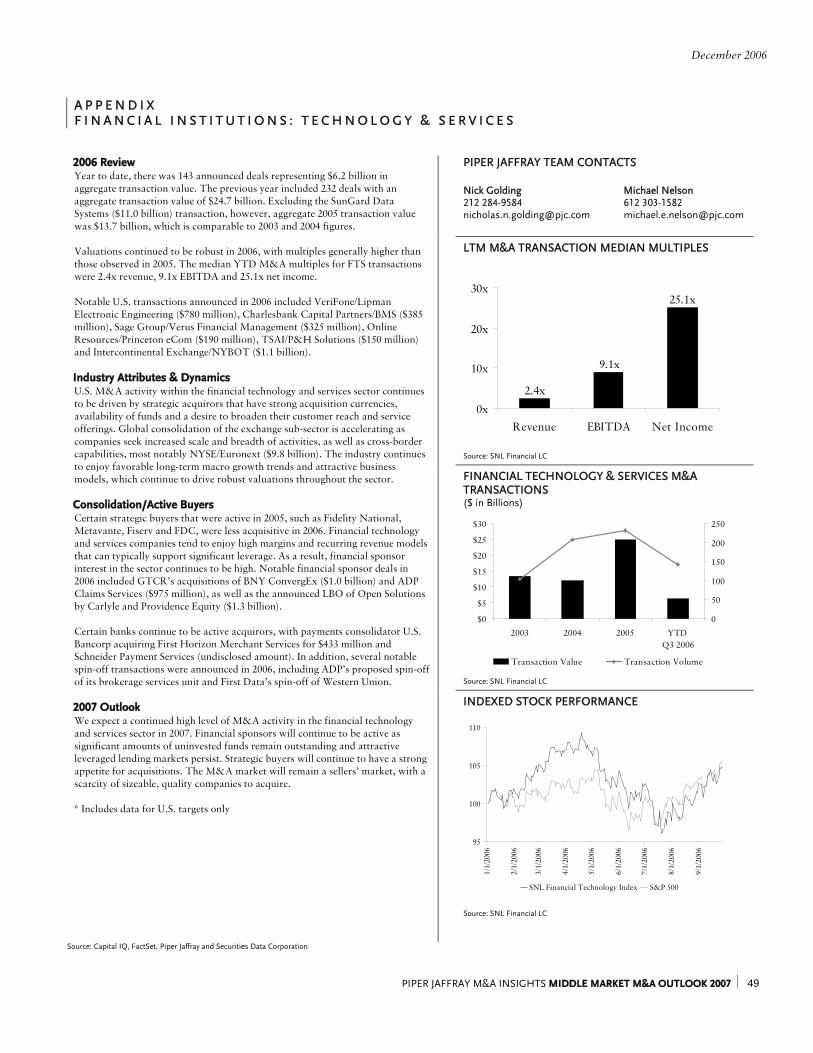
December 2006
PIPER JAFFRAY M&A INSIGHTS MIDDLE MARKET M&A OUTLOOK 2007 ⏐ 49
A P P E N D I X F I N A N C I A L I N S T I T U T I O N S : T E C H N O L O G Y & S E R V I C E S
PIPER JAFFRAY TEAM CONTACTS Nick Golding Michael Nelson 212 284-9584 612 303-1582 [email protected] [email protected]
LTM M&A TRANSACTION MEDIAN MULTIPLES
2.4x
25.1x
9.1x
0x
10x
20x
30x
Revenue EBITDA Net Income
Source: SNL Financial LC
FINANCIAL TECHNOLOGY & SERVICES M&A TRANSACTIONS ($ in Billions)
$0
$5
$10
$15
$20
$25
$30
2003 2004 2005 YTD Q3 2006
0
50
100
150
200
250
Transaction Value Transaction Volume
Source: SNL Financial LC
2006 Review Year to date, there was 143 announced deals representing $6.2 billion in aggregate transaction value. The previous year included 232 deals with an aggregate transaction value of $24.7 billion. Excluding the SunGard Data Systems ($11.0 billion) transaction, however, aggregate 2005 transaction value was $13.7 billion, which is comparable to 2003 and 2004 figures. Valuations continued to be robust in 2006, with multiples generally higher than those observed in 2005. The median YTD M&A multiples for FTS transactions were 2.4x revenue, 9.1x EBITDA and 25.1x net income. Notable U.S. transactions announced in 2006 included VeriFone/Lipman Electronic Engineering ($780 million), Charlesbank Capital Partners/BMS ($385 million), Sage Group/Verus Financial Management ($325 million), Online Resources/Princeton eCom ($190 million), TSAI/P&H Solutions ($150 million) and Intercontinental Exchange/NYBOT ($1.1 billion). Industry Attributes & Dynamics U.S. M&A activity within the financial technology and services sector continues to be driven by strategic acquirors that have strong acquisition currencies, availability of funds and a desire to broaden their customer reach and service offerings. Global consolidation of the exchange sub-sector is accelerating as companies seek increased scale and breadth of activities, as well as cross-border capabilities, most notably NYSE/Euronext ($9.8 billion). The industry continues to enjoy favorable long-term macro growth trends and attractive business models, which continue to drive robust valuations throughout the sector. Consolidation/Active Buyers Certain strategic buyers that were active in 2005, such as Fidelity National, Metavante, Fiserv and FDC, were less acquisitive in 2006. Financial technology and services companies tend to enjoy high margins and recurring revenue models that can typically support significant leverage. As a result, financial sponsor interest in the sector continues to be high. Notable financial sponsor deals in 2006 included GTCR’s acquisitions of BNY ConvergEx ($1.0 billion) and ADP Claims Services ($975 million), as well as the announced LBO of Open Solutions by Carlyle and Providence Equity ($1.3 billion). Certain banks continue to be active acquirors, with payments consolidator U.S. Bancorp acquiring First Horizon Merchant Services for $433 million and Schneider Payment Services (undisclosed amount). In addition, several notable spin-off transactions were announced in 2006, including ADP’s proposed spin-off of its brokerage services unit and First Data’s spin-off of Western Union. 2007 Outlook We expect a continued high level of M&A activity in the financial technology and services sector in 2007. Financial sponsors will continue to be active as significant amounts of uninvested funds remain outstanding and attractive leveraged lending markets persist. Strategic buyers will continue to have a strong appetite for acquisitions. The M&A market will remain a sellers’ market, with a scarcity of sizeable, quality companies to acquire. * Includes data for U.S. targets only
INDEXED STOCK PERFORMANCE
95
100
105
110
1/1/
2006
2/1/
2006
3/1/
2006
4/1/
2006
5/1/
2006
6/1/
2006
7/1/
2006
8/1/
2006
9/1/
2006
SNL Financial Technology Index S&P 500
Source: SNL Financial LC
Source: Capital IQ, FactSet, Piper Jaffray and Securities Data Corporation
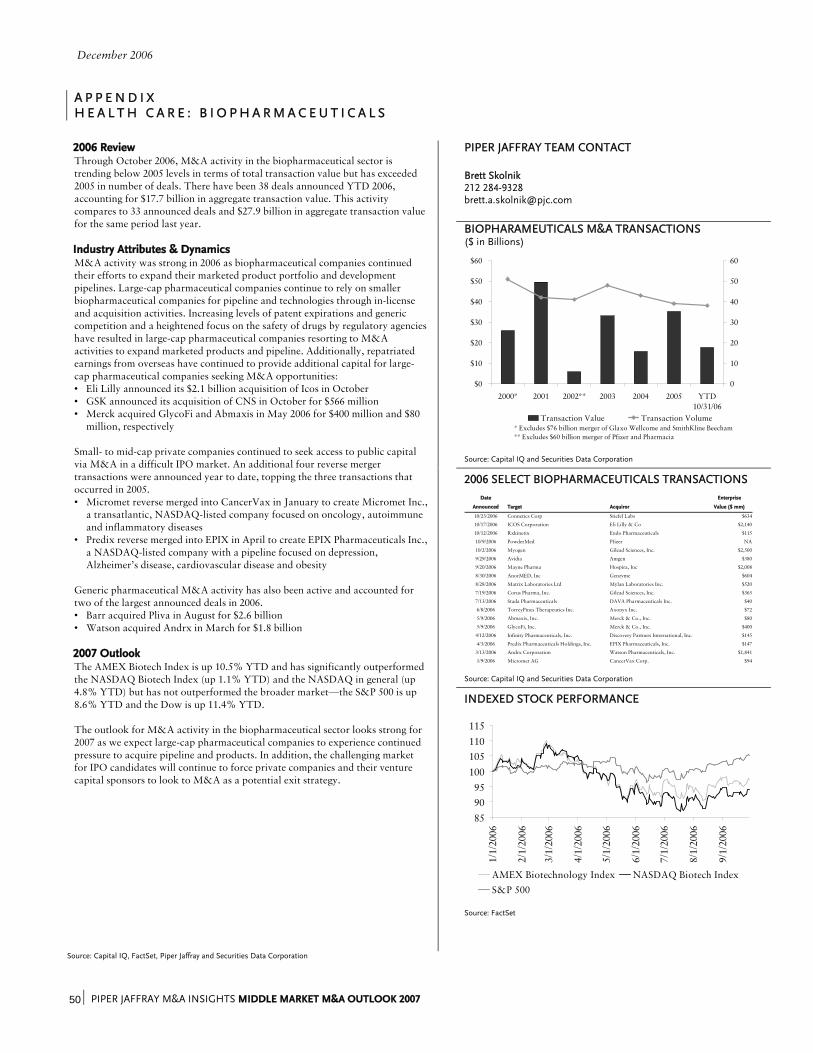
December 2006
PIPER JAFFRAY M&A INSIGHTS MIDDLE MARKET M&A OUTLOOK 2007 50 ⏐
A P P E N D I X H E A L T H C A R E : B I O P H A R M A C E U T I C A L S
PIPER JAFFRAY TEAM CONTACT Brett Skolnik 212 284-9328 [email protected]
BIOPHARAMEUTICALS M&A TRANSACTIONS ($ in Billions)
$0
$10
$20
$30
$40
$50
$60
2000* 2001 2002** 2003 2004 2005 YTD10/31/06
0
10
20
30
40
50
60
Transaction Value Transaction Volume* Excludes $76 billion merger of Glaxo Wellcome and SmithKline Beecham** Excludes $60 billion merger of Pfizer and Pharmacia
Source: Capital IQ and Securities Data Corporation
2006 SELECT BIOPHARMACEUTICALS TRANSACTIONS Date Enterprise
Announced Target Acquiror Value ($ mm)
10/23/2006 Connetics Corp Stiefel Labs $634
10/17/2006 ICOS Corporation Eli Lilly & Co $2,140
10/12/2006 Rxkinetix Endo Pharmaceuticals $115
10/9/2006 PowderMed Pfizer NA
10/2/2006 Myogen Gilead Sciences, Inc. $2,500
9/29/2006 Avidia Amgen $380
9/20/2006 Mayne Pharma Hospira, Inc $2,008
8/30/2006 AnorMED, Inc Genzyme $604
8/28/2006 Matrix Laboratories Ltd Mylan Laboratories Inc. $520
7/19/2006 Corus Pharma, Inc. Gilead Sciences, Inc. $365
7/13/2006 Stada Pharmaceuticals DAVA Pharmaceuticals Inc. $40
6/8/2006 TorreyPines Therapeutics Inc. Axonyx Inc. $72
5/9/2006 Abmaxis, Inc. Merck & Co., Inc. $80
5/9/2006 GlycoFi, Inc. Merck & Co., Inc. $400
4/12/2006 Infinity Pharmaceuticals, Inc. Discovery Partners International, Inc. $145
4/3/2006 Predix Pharmaceuticals Holdings, Inc. EPIX Pharmaceuticals, Inc. $147
3/13/2006 Andrx Corporation Watson Pharmaceuticals, Inc. $1,841
1/9/2006 Micromet AG CancerVax Corp. $94
Source: Capital IQ and Securities Data Corporation
2006 Review Through October 2006, M&A activity in the biopharmaceutical sector is trending below 2005 levels in terms of total transaction value but has exceeded 2005 in number of deals. There have been 38 deals announced YTD 2006, accounting for $17.7 billion in aggregate transaction value. This activity compares to 33 announced deals and $27.9 billion in aggregate transaction value for the same period last year. Industry Attributes & Dynamics M&A activity was strong in 2006 as biopharmaceutical companies continued their efforts to expand their marketed product portfolio and development pipelines. Large-cap pharmaceutical companies continue to rely on smaller biopharmaceutical companies for pipeline and technologies through in-license and acquisition activities. Increasing levels of patent expirations and generic competition and a heightened focus on the safety of drugs by regulatory agencies have resulted in large-cap pharmaceutical companies resorting to M&A activities to expand marketed products and pipeline. Additionally, repatriated earnings from overseas have continued to provide additional capital for large-cap pharmaceutical companies seeking M&A opportunities: • Eli Lilly announced its $2.1 billion acquisition of Icos in October • GSK announced its acquisition of CNS in October for $566 million • Merck acquired GlycoFi and Abmaxis in May 2006 for $400 million and $80
million, respectively Small- to mid-cap private companies continued to seek access to public capital via M&A in a difficult IPO market. An additional four reverse merger transactions were announced year to date, topping the three transactions that occurred in 2005. • Micromet reverse merged into CancerVax in January to create Micromet Inc.,
a transatlantic, NASDAQ-listed company focused on oncology, autoimmune and inflammatory diseases
• Predix reverse merged into EPIX in April to create EPIX Pharmaceuticals Inc., a NASDAQ-listed company with a pipeline focused on depression, Alzheimer’s disease, cardiovascular disease and obesity
Generic pharmaceutical M&A activity has also been active and accounted for two of the largest announced deals in 2006. • Barr acquired Pliva in August for $2.6 billion • Watson acquired Andrx in March for $1.8 billion 2007 Outlook The AMEX Biotech Index is up 10.5% YTD and has significantly outperformed the NASDAQ Biotech Index (up 1.1% YTD) and the NASDAQ in general (up 4.8% YTD) but has not outperformed the broader market—the S&P 500 is up 8.6% YTD and the Dow is up 11.4% YTD. The outlook for M&A activity in the biopharmaceutical sector looks strong for 2007 as we expect large-cap pharmaceutical companies to experience continued pressure to acquire pipeline and products. In addition, the challenging market for IPO candidates will continue to force private companies and their venture capital sponsors to look to M&A as a potential exit strategy.
INDEXED STOCK PERFORMANCE
859095
100105110115
1/1/
2006
2/1/
2006
3/1/
2006
4/1/
2006
5/1/
2006
6/1/
2006
7/1/
2006
8/1/
2006
9/1/
2006
AMEX Biotechnology Index NASDAQ Biotech IndexS&P 500
Source: FactSet
Source: Capital IQ, FactSet, Piper Jaffray and Securities Data Corporation
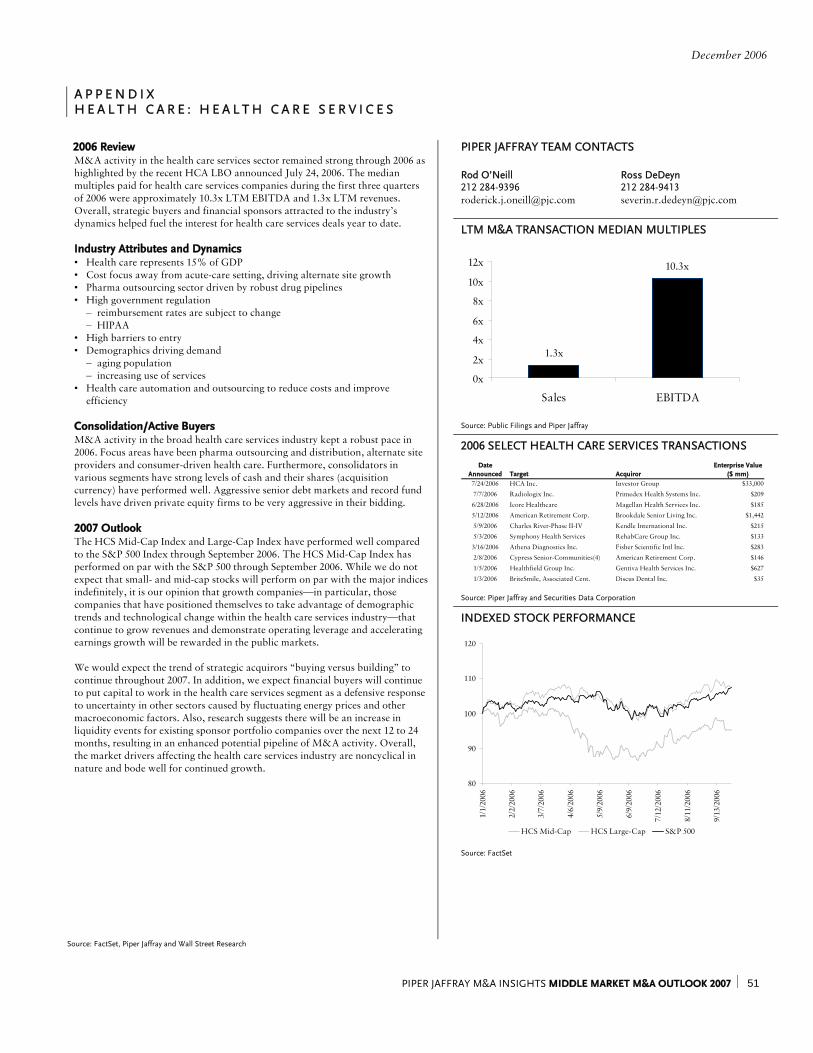
December 2006
PIPER JAFFRAY M&A INSIGHTS MIDDLE MARKET M&A OUTLOOK 2007 ⏐ 51
A P P E N D I X H E A L T H C A R E : H E A L T H C A R E S E R V I C E S
PIPER JAFFRAY TEAM CONTACTS
Rod O’Neill 212 284-9396 [email protected]
Ross DeDeyn 212 284-9413 [email protected]
LTM M&A TRANSACTION MEDIAN MULTIPLES
1.3x
10.3x
0x
2x
4x
6x
8x
10x
12x
Sales EBITDA
Source: Public Filings and Piper Jaffray
2006 SELECT HEALTH CARE SERVICES TRANSACTIONS
DateAnnounced Target Acquiror
Enterprise Value ($ mm)
7/24/2006 HCA Inc. Investor Group $33,000
7/7/2006 Radiologix Inc. Primedex Health Systems Inc. $209
6/28/2006 Icore Healthcare Magellan Health Services Inc. $185
5/12/2006 American Retirement Corp. Brookdale Senior Living Inc. $1,442
5/9/2006 Charles River-Phase II-IV Kendle International Inc. $215
5/3/2006 Symphony Health Services RehabCare Group Inc. $133
3/16/2006 Athena Diagnostics Inc. Fisher Scientific Intl Inc. $283
2/8/2006 Cypress Senior-Communities(4) American Retirement Corp. $146
1/5/2006 Healthfield Group Inc. Gentiva Health Services Inc. $627
1/3/2006 BriteSmile, Associated Cent. Discus Dental Inc. $35
Source: Piper Jaffray and Securities Data Corporation
2006 Review M&A activity in the health care services sector remained strong through 2006 as highlighted by the recent HCA LBO announced July 24, 2006. The median multiples paid for health care services companies during the first three quarters of 2006 were approximately 10.3x LTM EBITDA and 1.3x LTM revenues. Overall, strategic buyers and financial sponsors attracted to the industry’s dynamics helped fuel the interest for health care services deals year to date. Industry Attributes and Dynamics • Health care represents 15% of GDP • Cost focus away from acute-care setting, driving alternate site growth • Pharma outsourcing sector driven by robust drug pipelines • High government regulation
– reimbursement rates are subject to change – HIPAA
• High barriers to entry • Demographics driving demand
– aging population – increasing use of services
• Health care automation and outsourcing to reduce costs and improve efficiency
Consolidation/Active Buyers M&A activity in the broad health care services industry kept a robust pace in 2006. Focus areas have been pharma outsourcing and distribution, alternate site providers and consumer-driven health care. Furthermore, consolidators in various segments have strong levels of cash and their shares (acquisition currency) have performed well. Aggressive senior debt markets and record fund levels have driven private equity firms to be very aggressive in their bidding. 2007 Outlook The HCS Mid-Cap Index and Large-Cap Index have performed well compared to the S&P 500 Index through September 2006. The HCS Mid-Cap Index has performed on par with the S&P 500 through September 2006. While we do not expect that small- and mid-cap stocks will perform on par with the major indices indefinitely, it is our opinion that growth companies—in particular, those companies that have positioned themselves to take advantage of demographic trends and technological change within the health care services industry—that continue to grow revenues and demonstrate operating leverage and accelerating earnings growth will be rewarded in the public markets. We would expect the trend of strategic acquirors “buying versus building” to continue throughout 2007. In addition, we expect financial buyers will continue to put capital to work in the health care services segment as a defensive response to uncertainty in other sectors caused by fluctuating energy prices and other macroeconomic factors. Also, research suggests there will be an increase in liquidity events for existing sponsor portfolio companies over the next 12 to 24 months, resulting in an enhanced potential pipeline of M&A activity. Overall, the market drivers affecting the health care services industry are noncyclical in nature and bode well for continued growth.
INDEXED STOCK PERFORMANCE
80
90
100
110
120
1/1/
2006
2/2/
2006
3/7/
2006
4/6/
2006
5/9/
2006
6/9/
2006
7/12
/200
6
8/11
/200
6
9/13
/200
6
HCS Mid-Cap HCS Large-Cap S&P 500
Source: FactSet
Source: FactSet, Piper Jaffray and Wall Street Research
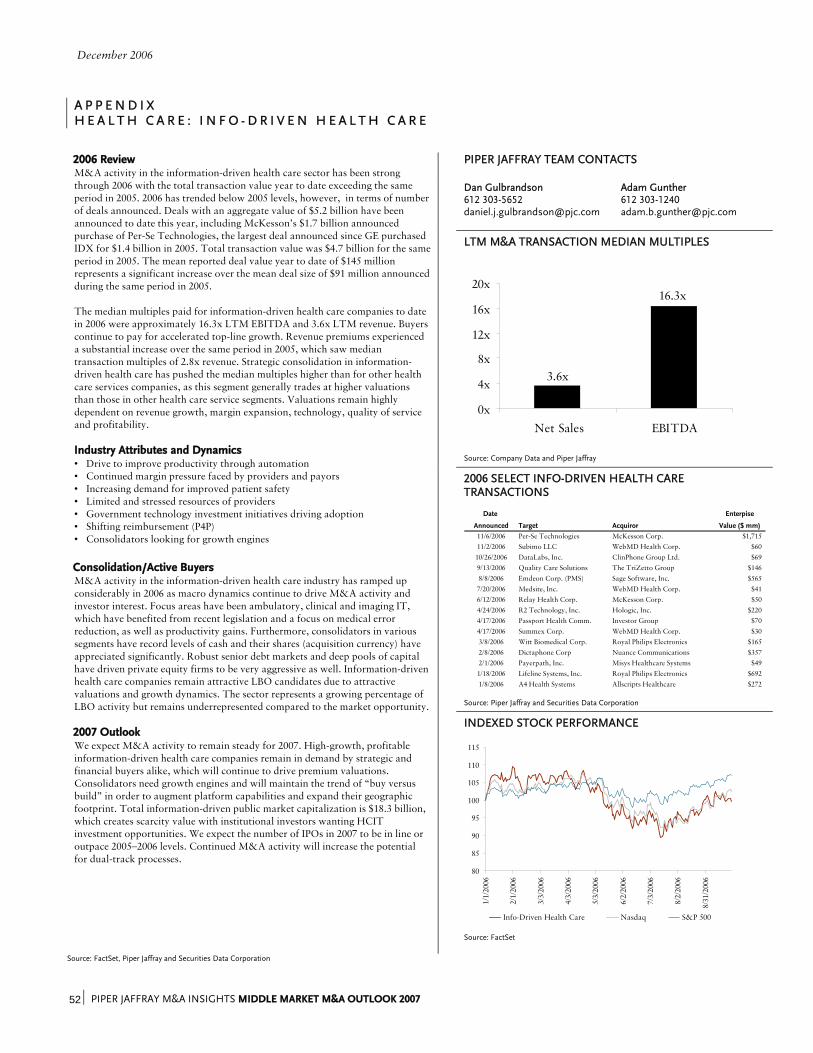
December 2006
PIPER JAFFRAY M&A INSIGHTS MIDDLE MARKET M&A OUTLOOK 2007 52 ⏐
A P P E N D I X H E A L T H C A R E : I N F O - D R I V E N H E A L T H C A R E
PIPER JAFFRAY TEAM CONTACTS
Dan Gulbrandson 612 303-5652 [email protected]
Adam Gunther 612 303-1240 [email protected]
LTM M&A TRANSACTION MEDIAN MULTIPLES
3.6x
16.3x
0x
4x
8x
12x
16x
20x
Net Sales EBITDA
Source: Company Data and Piper Jaffray
2006 SELECT INFO-DRIVEN HEALTH CARE TRANSACTIONS
Date Enterpise
Announced Target Acquiror Value ($ mm)
11/6/2006 Per-Se Technologies McKesson Corp. $1,71511/2/2006 Subimo LLC WebMD Health Corp. $60
10/26/2006 DataLabs, Inc. ClinPhone Group Ltd. $699/13/2006 Quality Care Solutions The TriZetto Group $1468/8/2006 Emdeon Corp. (PMS) Sage Software, Inc. $5657/20/2006 Medsite, Inc. WebMD Health Corp. $416/12/2006 Relay Health Corp. McKesson Corp. $504/24/2006 R2 Technology, Inc. Hologic, Inc. $2204/17/2006 Passport Health Comm. Investor Group $704/17/2006 Summex Corp. WebMD Health Corp. $303/8/2006 Witt Biomedical Corp. Royal Philips Electronics $1652/8/2006 Dictaphone Corp Nuance Communications $3572/1/2006 Payerpath, Inc. Misys Healthcare Systems $491/18/2006 Lifeline Systems, Inc. Royal Philips Electronics $6921/8/2006 A4 Health Systems Allscripts Healthcare $272
Source: Piper Jaffray and Securities Data Corporation
2006 Review M&A activity in the information-driven health care sector has been strong through 2006 with the total transaction value year to date exceeding the same period in 2005. 2006 has trended below 2005 levels, however, in terms of number of deals announced. Deals with an aggregate value of $5.2 billion have been announced to date this year, including McKesson’s $1.7 billion announced purchase of Per-Se Technologies, the largest deal announced since GE purchased IDX for $1.4 billion in 2005. Total transaction value was $4.7 billion for the same period in 2005. The mean reported deal value year to date of $145 million represents a significant increase over the mean deal size of $91 million announced during the same period in 2005. The median multiples paid for information-driven health care companies to date in 2006 were approximately 16.3x LTM EBITDA and 3.6x LTM revenue. Buyers continue to pay for accelerated top-line growth. Revenue premiums experienced a substantial increase over the same period in 2005, which saw median transaction multiples of 2.8x revenue. Strategic consolidation in information-driven health care has pushed the median multiples higher than for other health care services companies, as this segment generally trades at higher valuations than those in other health care service segments. Valuations remain highly dependent on revenue growth, margin expansion, technology, quality of service and profitability. Industry Attributes and Dynamics • Drive to improve productivity through automation • Continued margin pressure faced by providers and payors • Increasing demand for improved patient safety • Limited and stressed resources of providers • Government technology investment initiatives driving adoption • Shifting reimbursement (P4P) • Consolidators looking for growth engines Consolidation/Active Buyers M&A activity in the information-driven health care industry has ramped up considerably in 2006 as macro dynamics continue to drive M&A activity and investor interest. Focus areas have been ambulatory, clinical and imaging IT, which have benefited from recent legislation and a focus on medical error reduction, as well as productivity gains. Furthermore, consolidators in various segments have record levels of cash and their shares (acquisition currency) have appreciated significantly. Robust senior debt markets and deep pools of capital have driven private equity firms to be very aggressive as well. Information-driven health care companies remain attractive LBO candidates due to attractive valuations and growth dynamics. The sector represents a growing percentage of LBO activity but remains underrepresented compared to the market opportunity. 2007 Outlook We expect M&A activity to remain steady for 2007. High-growth, profitable information-driven health care companies remain in demand by strategic and financial buyers alike, which will continue to drive premium valuations. Consolidators need growth engines and will maintain the trend of “buy versus build” in order to augment platform capabilities and expand their geographic footprint. Total information-driven public market capitalization is $18.3 billion, which creates scarcity value with institutional investors wanting HCIT investment opportunities. We expect the number of IPOs in 2007 to be in line or outpace 2005–2006 levels. Continued M&A activity will increase the potential for dual-track processes.
INDEXED STOCK PERFORMANCE
80
85
90
95
100
105
110
115
1/1/
2006
2/1/
2006
3/3/
2006
4/3/
2006
5/3/
2006
6/2/
2006
7/3/
2006
8/2/
2006
8/31
/200
6
Info-Driven Health Care Nasdaq S&P 500
Source: FactSet
Source: FactSet, Piper Jaffray and Securities Data Corporation
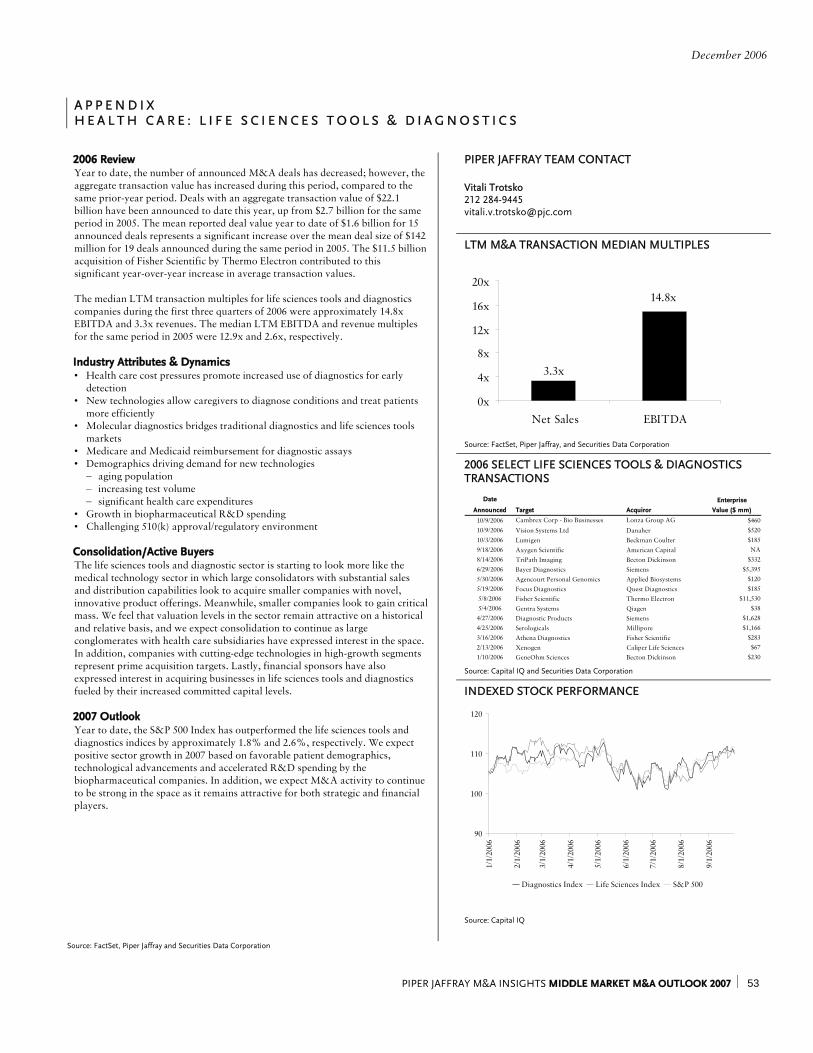
December 2006
PIPER JAFFRAY M&A INSIGHTS MIDDLE MARKET M&A OUTLOOK 2007 ⏐ 53
A P P E N D I X H E A L T H C A R E : L I F E S C I E N C E S T O O L S & D I A G N O S T I C S
PIPER JAFFRAY TEAM CONTACT Vitali Trotsko 212 284-9445 [email protected]
LTM M&A TRANSACTION MEDIAN MULTIPLES
3.3x
14.8x
0x
4x
8x
12x
16x
20x
Net Sales EBITDA
Source: FactSet, Piper Jaffray, and Securities Data Corporation
2006 SELECT LIFE SCIENCES TOOLS & DIAGNOSTICS TRANSACTIONS
Date Enterprise
Announced Target Acquiror Value ($ mm)
10/9/2006 Cambrex Corp - Bio Businesses Lonza Group AG $460 10/9/2006 Vision Systems Ltd Danaher $520 10/3/2006 Lumigen Beckman Coulter $185 9/18/2006 Axygen Scientific American Capital NA8/14/2006 TriPath Imaging Becton Dickinson $332 6/29/2006 Bayer Diagnostics Siemens $5,395 5/30/2006 Agencourt Personal Genomics Applied Biosystems $120 5/19/2006 Focus Diagnostics Quest Diagnostics $185 5/8/2006 Fisher Scientific Thermo Electron $11,530 5/4/2006 Gentra Systems Qiagen $38 4/27/2006 Diagnostic Products Siemens $1,628 4/25/2006 Serologicals Millipore $1,166 3/16/2006 Athena Diagnostics Fisher Scientific $283 2/13/2006 Xenogen Caliper Life Sciences $67 1/10/2006 GeneOhm Sciences Becton Dickinson $230
Source: Capital IQ and Securities Data Corporation
2006 Review Year to date, the number of announced M&A deals has decreased; however, the aggregate transaction value has increased during this period, compared to the same prior-year period. Deals with an aggregate transaction value of $22.1 billion have been announced to date this year, up from $2.7 billion for the same period in 2005. The mean reported deal value year to date of $1.6 billion for 15 announced deals represents a significant increase over the mean deal size of $142 million for 19 deals announced during the same period in 2005. The $11.5 billion acquisition of Fisher Scientific by Thermo Electron contributed to this significant year-over-year increase in average transaction values. The median LTM transaction multiples for life sciences tools and diagnostics companies during the first three quarters of 2006 were approximately 14.8x EBITDA and 3.3x revenues. The median LTM EBITDA and revenue multiples for the same period in 2005 were 12.9x and 2.6x, respectively. Industry Attributes & Dynamics • Health care cost pressures promote increased use of diagnostics for early
detection • New technologies allow caregivers to diagnose conditions and treat patients
more efficiently • Molecular diagnostics bridges traditional diagnostics and life sciences tools
markets • Medicare and Medicaid reimbursement for diagnostic assays • Demographics driving demand for new technologies
– aging population – increasing test volume – significant health care expenditures
• Growth in biopharmaceutical R&D spending • Challenging 510(k) approval/regulatory environment Consolidation/Active Buyers The life sciences tools and diagnostic sector is starting to look more like the medical technology sector in which large consolidators with substantial sales and distribution capabilities look to acquire smaller companies with novel, innovative product offerings. Meanwhile, smaller companies look to gain critical mass. We feel that valuation levels in the sector remain attractive on a historical and relative basis, and we expect consolidation to continue as large conglomerates with health care subsidiaries have expressed interest in the space. In addition, companies with cutting-edge technologies in high-growth segments represent prime acquisition targets. Lastly, financial sponsors have also expressed interest in acquiring businesses in life sciences tools and diagnostics fueled by their increased committed capital levels. 2007 Outlook Year to date, the S&P 500 Index has outperformed the life sciences tools and diagnostics indices by approximately 1.8% and 2.6%, respectively. We expect positive sector growth in 2007 based on favorable patient demographics, technological advancements and accelerated R&D spending by the biopharmaceutical companies. In addition, we expect M&A activity to continue to be strong in the space as it remains attractive for both strategic and financial players.
INDEXED STOCK PERFORMANCE
90
100
110
120
1/1/
2006
2/1/
2006
3/1/
2006
4/1/
2006
5/1/
2006
6/1/
2006
7/1/
2006
8/1/
2006
9/1/
2006
Diagnostics Index Life Sciences Index S&P 500
Source: Capital IQ
Source: FactSet, Piper Jaffray and Securities Data Corporation
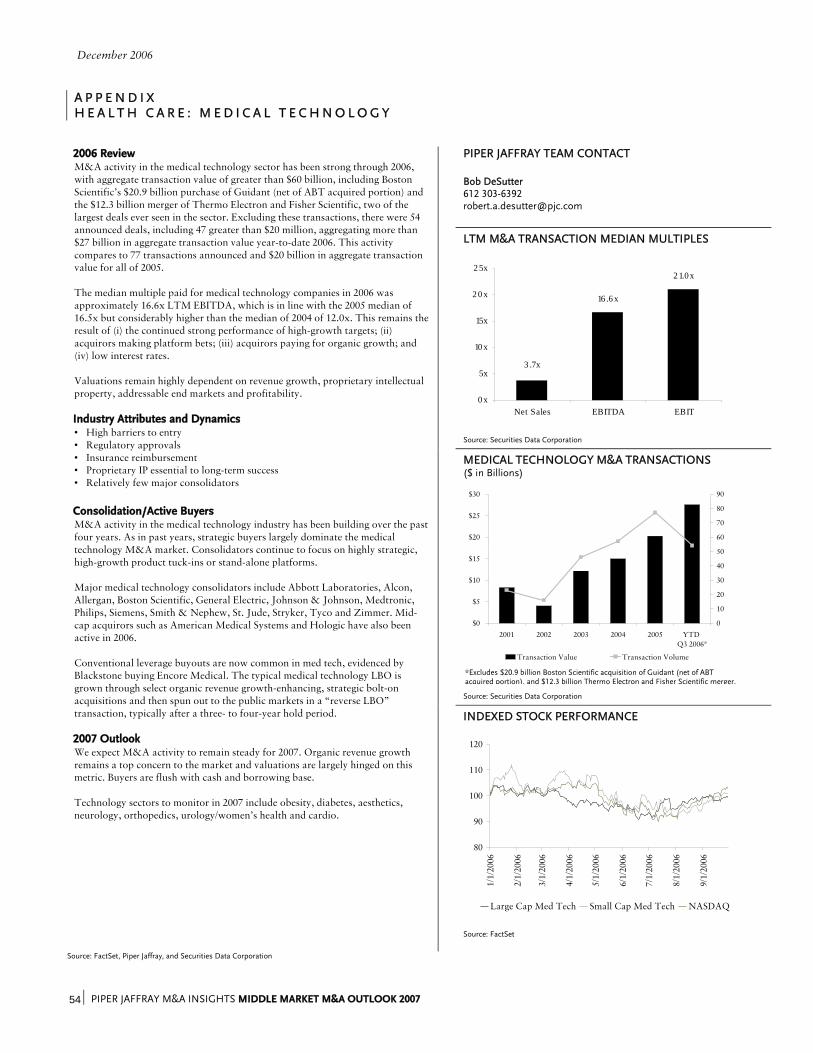
December 2006
PIPER JAFFRAY M&A INSIGHTS MIDDLE MARKET M&A OUTLOOK 2007 54 ⏐
A P P E N D I X H E A L T H C A R E : M E D I C A L T E C H N O L O G Y
PIPER JAFFRAY TEAM CONTACT Bob DeSutter 612 303-6392 [email protected]
LTM M&A TRANSACTION MEDIAN MULTIPLES
Source: Securities Data Corporation
MEDICAL TECHNOLOGY M&A TRANSACTIONS ($ in Billions)
$0
$5
$10
$15
$20
$25
$30
2001 2002 2003 2004 2005 YTD Q3 2006*
0
10
20
30
40
50
60
70
80
90
Transaction Value Transaction Volume
Source: Securities Data Corporation
2006 Review M&A activity in the medical technology sector has been strong through 2006, with aggregate transaction value of greater than $60 billion, including Boston Scientific’s $20.9 billion purchase of Guidant (net of ABT acquired portion) and the $12.3 billion merger of Thermo Electron and Fisher Scientific, two of the largest deals ever seen in the sector. Excluding these transactions, there were 54 announced deals, including 47 greater than $20 million, aggregating more than $27 billion in aggregate transaction value year-to-date 2006. This activity compares to 77 transactions announced and $20 billion in aggregate transaction value for all of 2005. The median multiple paid for medical technology companies in 2006 was approximately 16.6x LTM EBITDA, which is in line with the 2005 median of 16.5x but considerably higher than the median of 2004 of 12.0x. This remains the result of (i) the continued strong performance of high-growth targets; (ii) acquirors making platform bets; (iii) acquirors paying for organic growth; and (iv) low interest rates. Valuations remain highly dependent on revenue growth, proprietary intellectual property, addressable end markets and profitability. Industry Attributes and Dynamics • High barriers to entry • Regulatory approvals • Insurance reimbursement • Proprietary IP essential to long-term success • Relatively few major consolidators Consolidation/Active Buyers M&A activity in the medical technology industry has been building over the past four years. As in past years, strategic buyers largely dominate the medical technology M&A market. Consolidators continue to focus on highly strategic, high-growth product tuck-ins or stand-alone platforms. Major medical technology consolidators include Abbott Laboratories, Alcon, Allergan, Boston Scientific, General Electric, Johnson & Johnson, Medtronic, Philips, Siemens, Smith & Nephew, St. Jude, Stryker, Tyco and Zimmer. Mid-cap acquirors such as American Medical Systems and Hologic have also been active in 2006. Conventional leverage buyouts are now common in med tech, evidenced by Blackstone buying Encore Medical. The typical medical technology LBO is grown through select organic revenue growth-enhancing, strategic bolt-on acquisitions and then spun out to the public markets in a “reverse LBO” transaction, typically after a three- to four-year hold period. 2007 Outlook We expect M&A activity to remain steady for 2007. Organic revenue growth remains a top concern to the market and valuations are largely hinged on this metric. Buyers are flush with cash and borrowing base. Technology sectors to monitor in 2007 include obesity, diabetes, aesthetics, neurology, orthopedics, urology/women’s health and cardio.
INDEXED STOCK PERFORMANCE
80
90
100
110
120
1/1/
2006
2/1/
2006
3/1/
2006
4/1/
2006
5/1/
2006
6/1/
2006
7/1/
2006
8/1/
2006
9/1/
2006
Large Cap Med Tech Small Cap Med Tech NASDAQ
Source: FactSet
Source: FactSet, Piper Jaffray, and Securities Data Corporation
*Excludes $20.9 billion Boston Scientific acquisition of Guidant (net of ABT acquired portion), and $12.3 billion Thermo Electron and Fisher Scientific merger.
3 .7x
16 .6 x
2 1.0x
0 x
5x
10 x
15x
2 0 x
2 5x
Net Sales EBITDA EBIT
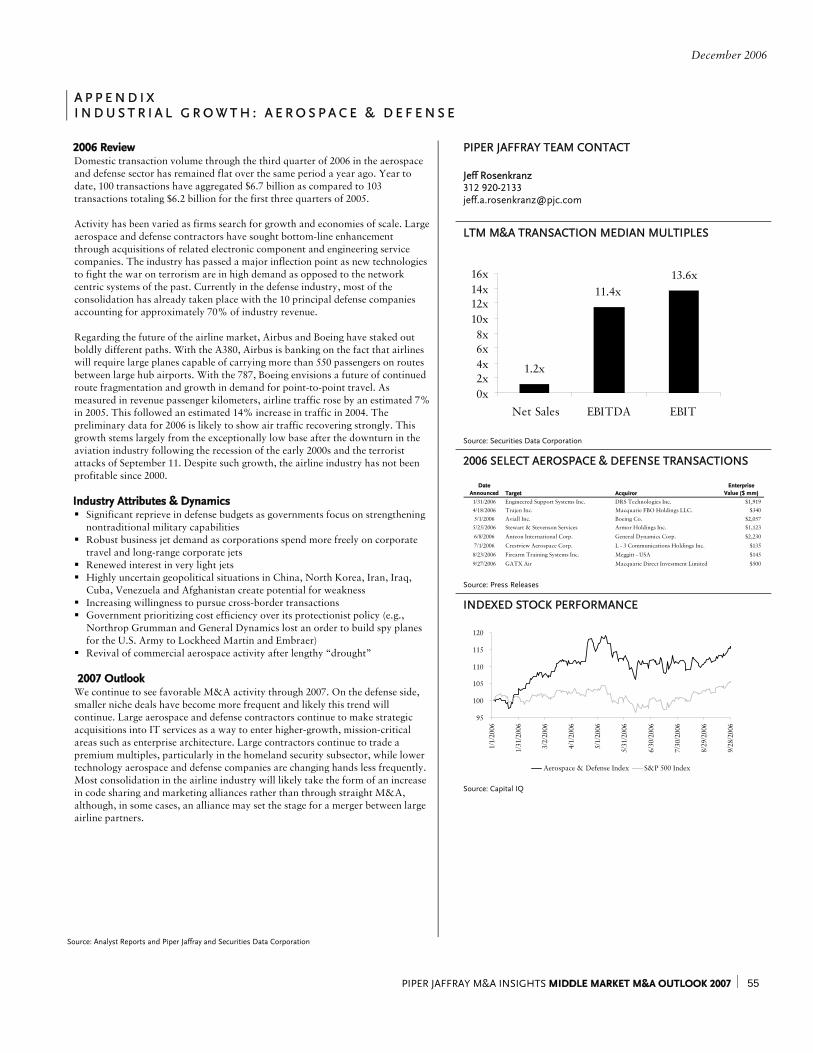
December 2006
PIPER JAFFRAY M&A INSIGHTS MIDDLE MARKET M&A OUTLOOK 2007 ⏐ 55
A P P E N D I X I N D U S T R I A L G R O W T H : A E R O S P A C E & D E F E N S E
PIPER JAFFRAY TEAM CONTACT Jeff Rosenkranz 312 920-2133 [email protected]
LTM M&A TRANSACTION MEDIAN MULTIPLES
1.2x
11.4x13.6x
0x2x4x6x8x
10x12x14x16x
Net Sales EBITDA EBIT
Source: Securities Data Corporation
2006 SELECT AEROSPACE & DEFENSE TRANSACTIONS
DateAnnounced Target Acquiror
EnterpriseValue ($ mm)
1/31/2006 Engineered Support Systems Inc. DRS Technologies Inc. $1,9194/18/2006 Trajen Inc. Macquarie FBO Holdings LLC. $3405/1/2006 Aviall Inc. Boeing Co. $2,0575/25/2006 Stewart & Stevenson Services Armor Holdings Inc. $1,123
6/8/2006 Anteon International Corp. General Dynamics Corp. $2,230
7/1/2006 Crestview Aerospace Corp. L - 3 Communications Holdings Inc. $135
8/23/2006 Firearm Training Systems Inc. Meggitt - USA $145
9/27/2006 GATX Air Macquarie Direct Investment Limited $500
Source: Press Releases
2006 Review Domestic transaction volume through the third quarter of 2006 in the aerospace and defense sector has remained flat over the same period a year ago. Year to date, 100 transactions have aggregated $6.7 billion as compared to 103 transactions totaling $6.2 billion for the first three quarters of 2005. Activity has been varied as firms search for growth and economies of scale. Large aerospace and defense contractors have sought bottom-line enhancement through acquisitions of related electronic component and engineering service companies. The industry has passed a major inflection point as new technologies to fight the war on terrorism are in high demand as opposed to the network centric systems of the past. Currently in the defense industry, most of the consolidation has already taken place with the 10 principal defense companies accounting for approximately 70% of industry revenue. Regarding the future of the airline market, Airbus and Boeing have staked out boldly different paths. With the A380, Airbus is banking on the fact that airlines will require large planes capable of carrying more than 550 passengers on routes between large hub airports. With the 787, Boeing envisions a future of continued route fragmentation and growth in demand for point-to-point travel. As measured in revenue passenger kilometers, airline traffic rose by an estimated 7% in 2005. This followed an estimated 14% increase in traffic in 2004. The preliminary data for 2006 is likely to show air traffic recovering strongly. This growth stems largely from the exceptionally low base after the downturn in the aviation industry following the recession of the early 2000s and the terrorist attacks of September 11. Despite such growth, the airline industry has not been profitable since 2000. Industry Attributes & Dynamics
Significant reprieve in defense budgets as governments focus on strengthening nontraditional military capabilities
Robust business jet demand as corporations spend more freely on corporate travel and long-range corporate jets
Renewed interest in very light jets Highly uncertain geopolitical situations in China, North Korea, Iran, Iraq,
Cuba, Venezuela and Afghanistan create potential for weakness Increasing willingness to pursue cross-border transactions Government prioritizing cost efficiency over its protectionist policy (e.g.,
Northrop Grumman and General Dynamics lost an order to build spy planes for the U.S. Army to Lockheed Martin and Embraer)
Revival of commercial aerospace activity after lengthy “drought” 2007 Outlook We continue to see favorable M&A activity through 2007. On the defense side, smaller niche deals have become more frequent and likely this trend will continue. Large aerospace and defense contractors continue to make strategic acquisitions into IT services as a way to enter higher-growth, mission-critical areas such as enterprise architecture. Large contractors continue to trade a premium multiples, particularly in the homeland security subsector, while lower technology aerospace and defense companies are changing hands less frequently. Most consolidation in the airline industry will likely take the form of an increase in code sharing and marketing alliances rather than through straight M&A, although, in some cases, an alliance may set the stage for a merger between large airline partners.
INDEXED STOCK PERFORMANCE
95
100
105
110
115
120
1/1/
2006
1/31
/200
6
3/2/
2006
4/1/
2006
5/1/
2006
5/31
/200
6
6/30
/200
6
7/30
/200
6
8/29
/200
6
9/28
/200
6
Aerospace & Defense Index S&P 500 Index
Source: Capital IQ
Source: Analyst Reports and Piper Jaffray and Securities Data Corporation
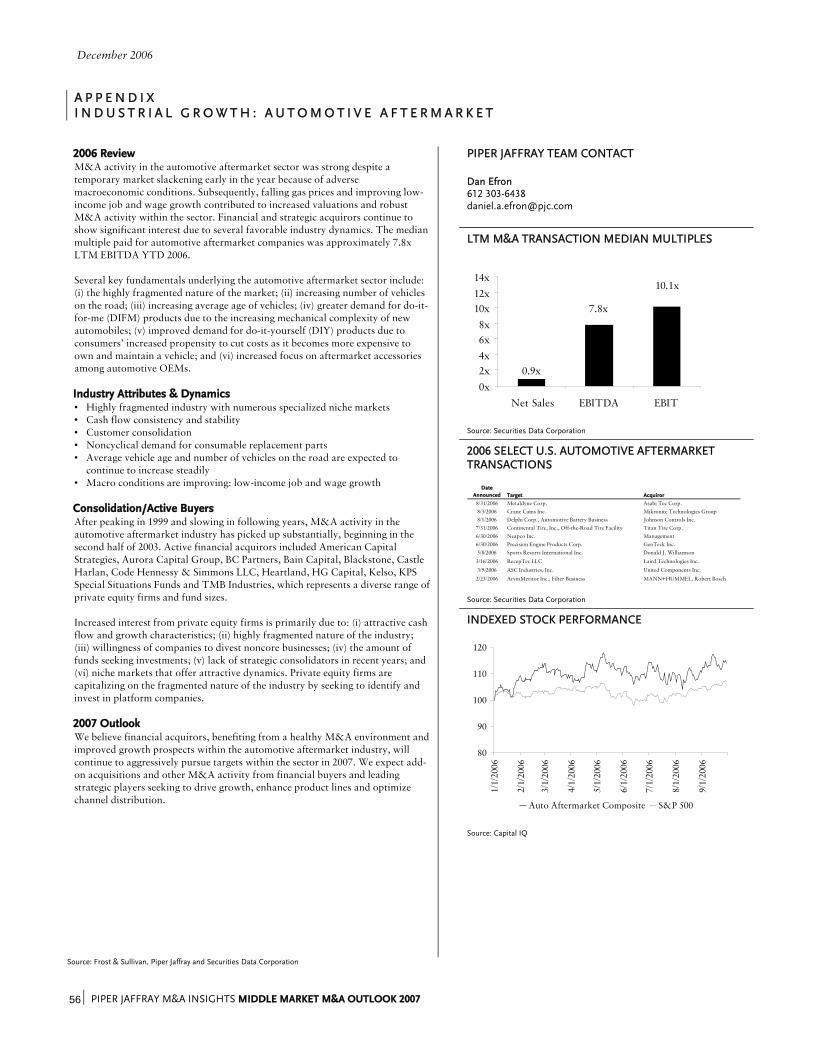
December 2006
PIPER JAFFRAY M&A INSIGHTS MIDDLE MARKET M&A OUTLOOK 2007 56 ⏐
A P P E N D I X I N D U S T R I A L G R O W T H : A U T O M O T I V E A F T E R M A R K E T
PIPER JAFFRAY TEAM CONTACT Dan Efron 612 303-6438 [email protected]
LTM M&A TRANSACTION MEDIAN MULTIPLES
0.9x
7.8x
10.1x
0x2x4x6x8x
10x12x14x
Net Sales EBITDA EBIT
Source: Securities Data Corporation
2006 SELECT U.S. AUTOMOTIVE AFTERMARKET TRANSACTIONS
DateAnnounced Target Acquiror
8/31/2006 Metaldyne Corp. Asahi Tec Corp.8/3/2006 Crane Cams Inc. Mikronite Technologies Group8/1/2006 Delphi Corp., Automotive Battery Business Johnson Controls Inc.
7/31/2006 Continental Tire, Inc., Off-the-Road Tire Facility Titan Tire Corp.6/30/2006 Neapco Inc. Management6/30/2006 Precision Engine Products Corp. GenTeck Inc.5/8/2006 Sports Resorts International Inc. Donald J. Williamson
3/16/2006 RecepTec LLC Laird Technologies Inc.
3/9/2006 ASC Industries, Inc. United Components Inc.
2/23/2006 ArvinMeritor Inc., Filter Business MANN+HUMMEL, Robert Bosch
Source: Securities Data Corporation
2006 Review M&A activity in the automotive aftermarket sector was strong despite a temporary market slackening early in the year because of adverse macroeconomic conditions. Subsequently, falling gas prices and improving low-income job and wage growth contributed to increased valuations and robust M&A activity within the sector. Financial and strategic acquirors continue to show significant interest due to several favorable industry dynamics. The median multiple paid for automotive aftermarket companies was approximately 7.8x LTM EBITDA YTD 2006. Several key fundamentals underlying the automotive aftermarket sector include: (i) the highly fragmented nature of the market; (ii) increasing number of vehicles on the road; (iii) increasing average age of vehicles; (iv) greater demand for do-it-for-me (DIFM) products due to the increasing mechanical complexity of new automobiles; (v) improved demand for do-it-yourself (DIY) products due to consumers’ increased propensity to cut costs as it becomes more expensive to own and maintain a vehicle; and (vi) increased focus on aftermarket accessories among automotive OEMs. Industry Attributes & Dynamics • Highly fragmented industry with numerous specialized niche markets • Cash flow consistency and stability • Customer consolidation • Noncyclical demand for consumable replacement parts • Average vehicle age and number of vehicles on the road are expected to
continue to increase steadily • Macro conditions are improving: low-income job and wage growth Consolidation/Active Buyers After peaking in 1999 and slowing in following years, M&A activity in the automotive aftermarket industry has picked up substantially, beginning in the second half of 2003. Active financial acquirors included American Capital Strategies, Aurora Capital Group, BC Partners, Bain Capital, Blackstone, Castle Harlan, Code Hennessy & Simmons LLC, Heartland, HG Capital, Kelso, KPS Special Situations Funds and TMB Industries, which represents a diverse range of private equity firms and fund sizes. Increased interest from private equity firms is primarily due to: (i) attractive cash flow and growth characteristics; (ii) highly fragmented nature of the industry; (iii) willingness of companies to divest noncore businesses; (iv) the amount of funds seeking investments; (v) lack of strategic consolidators in recent years; and (vi) niche markets that offer attractive dynamics. Private equity firms are capitalizing on the fragmented nature of the industry by seeking to identify and invest in platform companies. 2007 Outlook We believe financial acquirors, benefiting from a healthy M&A environment and improved growth prospects within the automotive aftermarket industry, will continue to aggressively pursue targets within the sector in 2007. We expect add-on acquisitions and other M&A activity from financial buyers and leading strategic players seeking to drive growth, enhance product lines and optimize channel distribution.
INDEXED STOCK PERFORMANCE
80
90
100
110
120
1/1/
2006
2/1/
2006
3/1/
2006
4/1/
2006
5/1/
2006
6/1/
2006
7/1/
2006
8/1/
2006
9/1/
2006
Auto Aftermarket Composite S&P 500
Source: Capital IQ
Source: Frost & Sullivan, Piper Jaffray and Securities Data Corporation
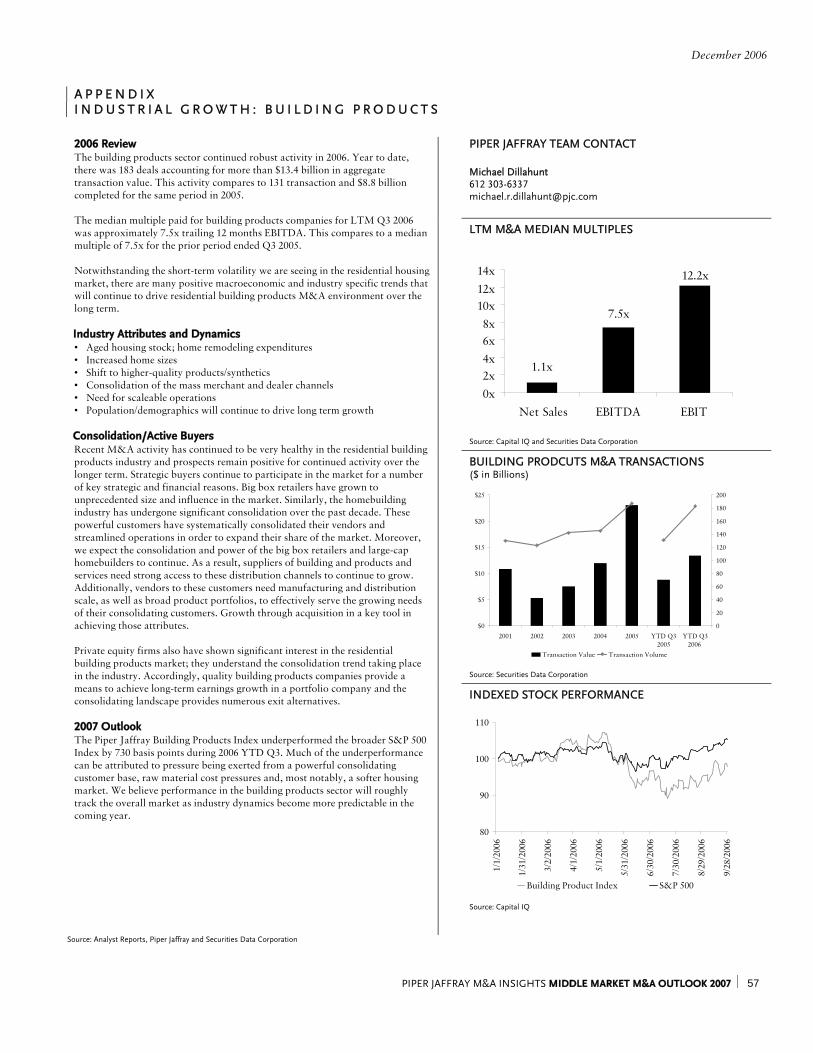
December 2006
PIPER JAFFRAY M&A INSIGHTS MIDDLE MARKET M&A OUTLOOK 2007 ⏐ 57
A P P E N D I X I N D U S T R I A L G R O W T H : B U I L D I N G P R O D U C T S
PIPER JAFFRAY TEAM CONTACT Michael Dillahunt 612 303-6337 [email protected]
LTM M&A MEDIAN MULTIPLES
1.1x
7.5x
12.2x
0x2x4x6x8x
10x12x14x
Net Sales EBITDA EBIT
Source: Capital IQ and Securities Data Corporation
BUILDING PRODCUTS M&A TRANSACTIONS ($ in Billions)
$0
$5
$10
$15
$20
$25
2001 2002 2003 2004 2005 YTD Q32005
YTD Q32006
0
20
40
60
80
100
120
140
160
180
200
Transaction Value Transaction Volume
Source: Securities Data Corporation
2006 Review The building products sector continued robust activity in 2006. Year to date, there was 183 deals accounting for more than $13.4 billion in aggregate transaction value. This activity compares to 131 transaction and $8.8 billion completed for the same period in 2005. The median multiple paid for building products companies for LTM Q3 2006 was approximately 7.5x trailing 12 months EBITDA. This compares to a median multiple of 7.5x for the prior period ended Q3 2005. Notwithstanding the short-term volatility we are seeing in the residential housing market, there are many positive macroeconomic and industry specific trends that will continue to drive residential building products M&A environment over the long term. Industry Attributes and Dynamics • Aged housing stock; home remodeling expenditures • Increased home sizes • Shift to higher-quality products/synthetics • Consolidation of the mass merchant and dealer channels • Need for scaleable operations • Population/demographics will continue to drive long term growth Consolidation/Active Buyers Recent M&A activity has continued to be very healthy in the residential building products industry and prospects remain positive for continued activity over the longer term. Strategic buyers continue to participate in the market for a number of key strategic and financial reasons. Big box retailers have grown to unprecedented size and influence in the market. Similarly, the homebuilding industry has undergone significant consolidation over the past decade. These powerful customers have systematically consolidated their vendors and streamlined operations in order to expand their share of the market. Moreover, we expect the consolidation and power of the big box retailers and large-cap homebuilders to continue. As a result, suppliers of building and products and services need strong access to these distribution channels to continue to grow. Additionally, vendors to these customers need manufacturing and distribution scale, as well as broad product portfolios, to effectively serve the growing needs of their consolidating customers. Growth through acquisition in a key tool in achieving those attributes. Private equity firms also have shown significant interest in the residential building products market; they understand the consolidation trend taking place in the industry. Accordingly, quality building products companies provide a means to achieve long-term earnings growth in a portfolio company and the consolidating landscape provides numerous exit alternatives. 2007 Outlook The Piper Jaffray Building Products Index underperformed the broader S&P 500 Index by 730 basis points during 2006 YTD Q3. Much of the underperformance can be attributed to pressure being exerted from a powerful consolidating customer base, raw material cost pressures and, most notably, a softer housing market. We believe performance in the building products sector will roughly track the overall market as industry dynamics become more predictable in the coming year.
INDEXED STOCK PERFORMANCE
80
90
100
110
1/1/
2006
1/31
/200
6
3/2/
2006
4/1/
2006
5/1/
2006
5/31
/200
6
6/30
/200
6
7/30
/200
6
8/29
/200
6
9/28
/200
6
Building Product Index S&P 500
Source: Capital IQ
Source: Analyst Reports, Piper Jaffray and Securities Data Corporation
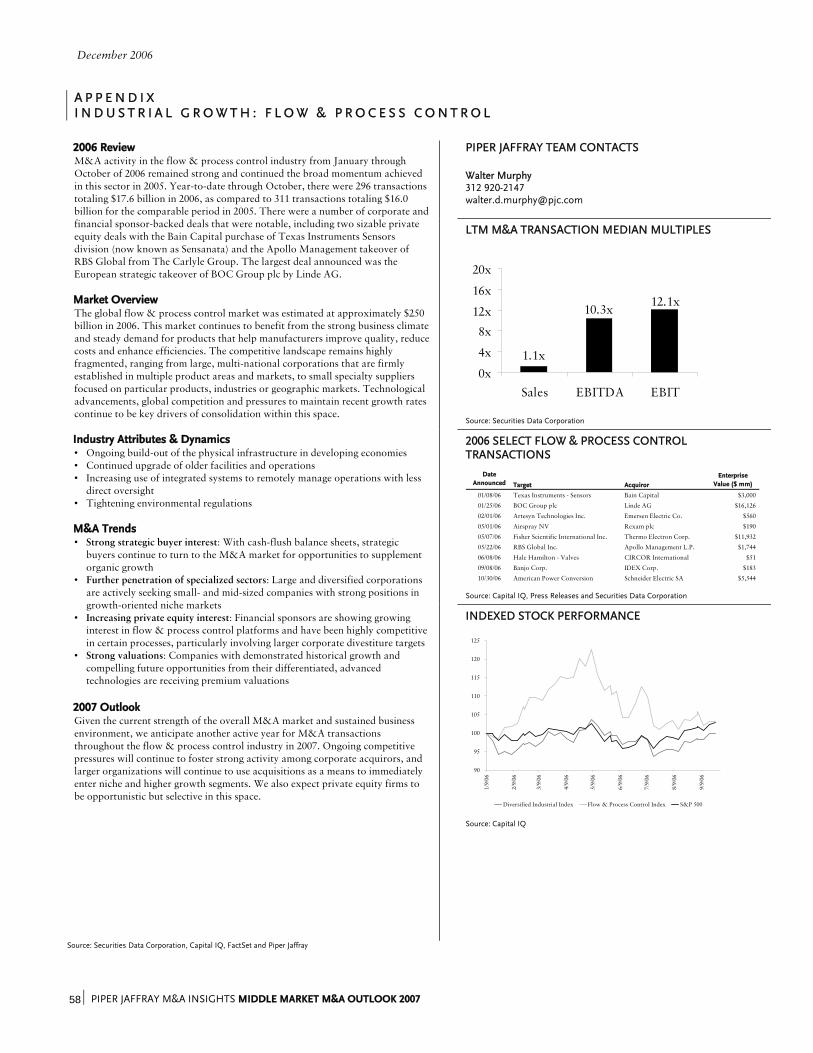
December 2006
PIPER JAFFRAY M&A INSIGHTS MIDDLE MARKET M&A OUTLOOK 2007 58 ⏐
A P P E N D I X I N D U S T R I A L G R O W T H : F L O W & P R O C E S S C O N T R O L
PIPER JAFFRAY TEAM CONTACTS Walter Murphy 312 920-2147 [email protected]
LTM M&A TRANSACTION MEDIAN MULTIPLES
12.1x10.3x
1.1x0x
4x
8x
12x
16x
20x
Sales EBITDA EBIT
Source: Securities Data Corporation
2006 SELECT FLOW & PROCESS CONTROL TRANSACTIONS
DateAnnounced Target Acquiror
EnterpriseValue ($ mm)
01/08/06 Texas Instruments - Sensors Bain Capital $3,000
01/25/06 BOC Group plc Linde AG $16,126
02/01/06 Artesyn Technologies Inc. Emersen Electric Co. $560
05/01/06 Airspray NV Rexam plc $190
05/07/06 Fisher Scientific International Inc. Thermo Electron Corp. $11,932
05/22/06 RBS Global Inc. Apollo Management L.P. $1,744
06/08/06 Hale Hamilton - Valves CIRCOR International $51
09/08/06 Banjo Corp. IDEX Corp. $183
10/30/06 American Power Conversion Schneider Electric SA $5,544
Source: Capital IQ, Press Releases and Securities Data Corporation
2006 Review M&A activity in the flow & process control industry from January through October of 2006 remained strong and continued the broad momentum achieved in this sector in 2005. Year-to-date through October, there were 296 transactions totaling $17.6 billion in 2006, as compared to 311 transactions totaling $16.0 billion for the comparable period in 2005. There were a number of corporate and financial sponsor-backed deals that were notable, including two sizable private equity deals with the Bain Capital purchase of Texas Instruments Sensors division (now known as Sensanata) and the Apollo Management takeover of RBS Global from The Carlyle Group. The largest deal announced was the European strategic takeover of BOC Group plc by Linde AG. Market Overview The global flow & process control market was estimated at approximately $250 billion in 2006. This market continues to benefit from the strong business climate and steady demand for products that help manufacturers improve quality, reduce costs and enhance efficiencies. The competitive landscape remains highly fragmented, ranging from large, multi-national corporations that are firmly established in multiple product areas and markets, to small specialty suppliers focused on particular products, industries or geographic markets. Technological advancements, global competition and pressures to maintain recent growth rates continue to be key drivers of consolidation within this space. Industry Attributes & Dynamics • Ongoing build-out of the physical infrastructure in developing economies • Continued upgrade of older facilities and operations • Increasing use of integrated systems to remotely manage operations with less
direct oversight • Tightening environmental regulations M&A Trends • Strong strategic buyer interest: With cash-flush balance sheets, strategic
buyers continue to turn to the M&A market for opportunities to supplement organic growth
• Further penetration of specialized sectors: Large and diversified corporations are actively seeking small- and mid-sized companies with strong positions in growth-oriented niche markets
• Increasing private equity interest: Financial sponsors are showing growing interest in flow & process control platforms and have been highly competitive in certain processes, particularly involving larger corporate divestiture targets
• Strong valuations: Companies with demonstrated historical growth and compelling future opportunities from their differentiated, advanced technologies are receiving premium valuations
2007 Outlook Given the current strength of the overall M&A market and sustained business environment, we anticipate another active year for M&A transactions throughout the flow & process control industry in 2007. Ongoing competitive pressures will continue to foster strong activity among corporate acquirors, and larger organizations will continue to use acquisitions as a means to immediately enter niche and higher growth segments. We also expect private equity firms to be opportunistic but selective in this space.
INDEXED STOCK PERFORMANCE
90
95
100
105
110
115
120
125
1/9/
06
2/9/
06
3/9/
06
4/9/
06
5/9/
06
6/9/
06
7/9/
06
8/9/
06
9/9/
06
Diversified Industrial Index Flow & Process Control Index S&P 500
Source: Capital IQ
Source: Securities Data Corporation, Capital IQ, FactSet and Piper Jaffray
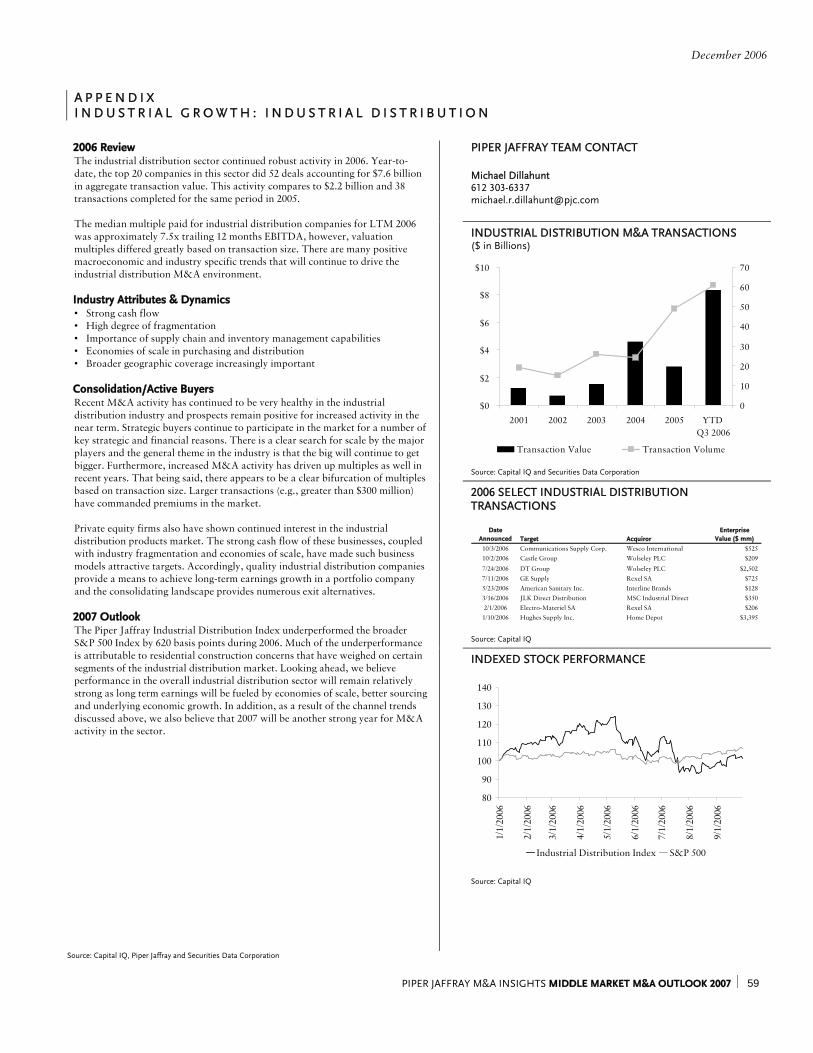
December 2006
PIPER JAFFRAY M&A INSIGHTS MIDDLE MARKET M&A OUTLOOK 2007 ⏐ 59
A P P E N D I X I N D U S T R I A L G R O W T H : I N D U S T R I A L D I S T R I B U T I O N
PIPER JAFFRAY TEAM CONTACT Michael Dillahunt 612 303-6337 [email protected]
INDUSTRIAL DISTRIBUTION M&A TRANSACTIONS ($ in Billions)
$0
$2
$4
$6
$8
$10
2001 2002 2003 2004 2005 YTD Q3 2006
0
10
20
30
40
50
60
70
Transaction Value Transaction Volume Source: Capital IQ and Securities Data Corporation
2006 SELECT INDUSTRIAL DISTRIBUTION TRANSACTIONS
DateAnnounced Target Acquiror
EnterpriseValue ($ mm)
10/3/2006 Communications Supply Corp. Wesco International $52510/2/2006 Castle Group Wolseley PLC $209
7/24/2006 DT Group Wolseley PLC $2,5027/11/2006 GE Supply Rexel SA $7255/23/2006 American Sanitary Inc. Interline Brands $1283/16/2006 JLK Direct Distribution MSC Industrial Direct $3502/1/2006 Electro-Materiel SA Rexel SA $206
1/10/2006 Hughes Supply Inc. Home Depot $3,395
Source: Capital IQ
2006 Review The industrial distribution sector continued robust activity in 2006. Year-to-date, the top 20 companies in this sector did 52 deals accounting for $7.6 billion in aggregate transaction value. This activity compares to $2.2 billion and 38 transactions completed for the same period in 2005. The median multiple paid for industrial distribution companies for LTM 2006 was approximately 7.5x trailing 12 months EBITDA, however, valuation multiples differed greatly based on transaction size. There are many positive macroeconomic and industry specific trends that will continue to drive the industrial distribution M&A environment. Industry Attributes & Dynamics • Strong cash flow • High degree of fragmentation • Importance of supply chain and inventory management capabilities • Economies of scale in purchasing and distribution • Broader geographic coverage increasingly important Consolidation/Active Buyers Recent M&A activity has continued to be very healthy in the industrial distribution industry and prospects remain positive for increased activity in the near term. Strategic buyers continue to participate in the market for a number of key strategic and financial reasons. There is a clear search for scale by the major players and the general theme in the industry is that the big will continue to get bigger. Furthermore, increased M&A activity has driven up multiples as well in recent years. That being said, there appears to be a clear bifurcation of multiples based on transaction size. Larger transactions (e.g., greater than $300 million) have commanded premiums in the market. Private equity firms also have shown continued interest in the industrial distribution products market. The strong cash flow of these businesses, coupled with industry fragmentation and economies of scale, have made such business models attractive targets. Accordingly, quality industrial distribution companies provide a means to achieve long-term earnings growth in a portfolio company and the consolidating landscape provides numerous exit alternatives. 2007 Outlook The Piper Jaffray Industrial Distribution Index underperformed the broader S&P 500 Index by 620 basis points during 2006. Much of the underperformance is attributable to residential construction concerns that have weighed on certain segments of the industrial distribution market. Looking ahead, we believe performance in the overall industrial distribution sector will remain relatively strong as long term earnings will be fueled by economies of scale, better sourcing and underlying economic growth. In addition, as a result of the channel trends discussed above, we also believe that 2007 will be another strong year for M&A activity in the sector.
INDEXED STOCK PERFORMANCE
80
90
100
110
120
130
140
1/1/
2006
2/1/
2006
3/1/
2006
4/1/
2006
5/1/
2006
6/1/
2006
7/1/
2006
8/1/
2006
9/1/
2006
Industrial Distribution Index S&P 500
Source: Capital IQ
Source: Capital IQ, Piper Jaffray and Securities Data Corporation
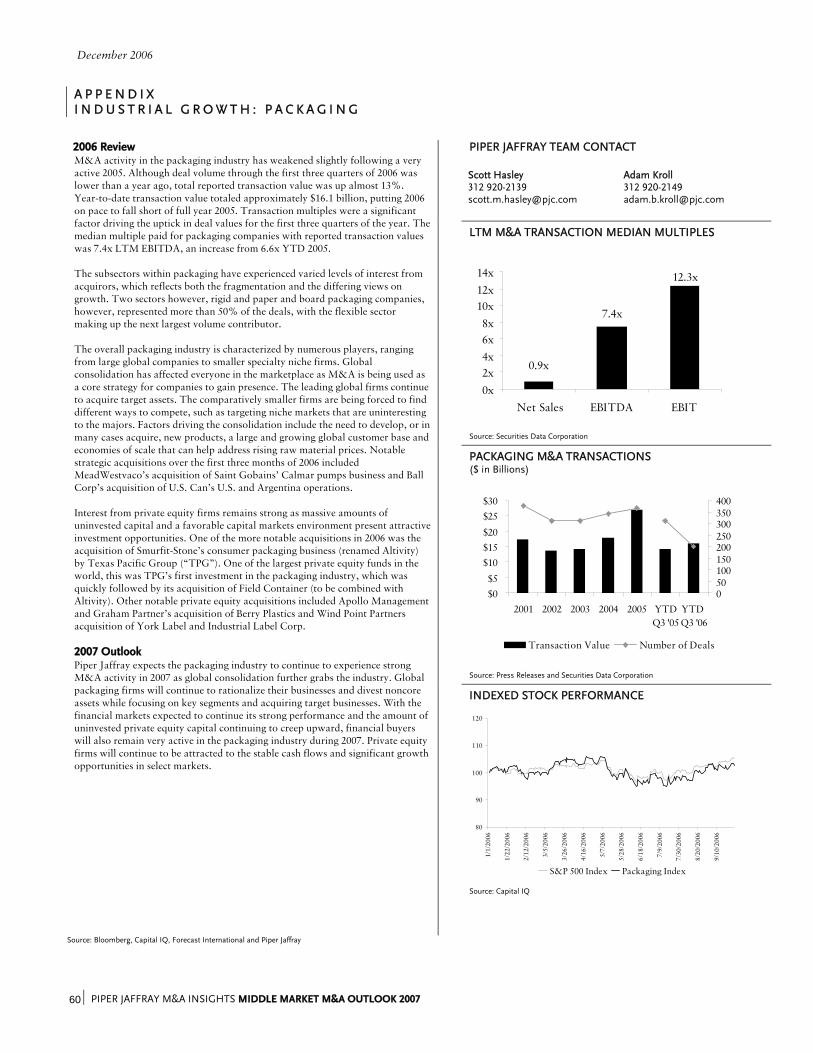
December 2006
PIPER JAFFRAY M&A INSIGHTS MIDDLE MARKET M&A OUTLOOK 2007 60 ⏐
A P P E N D I X I N D U S T R I A L G R O W T H : P A C K A G I N G
PIPER JAFFRAY TEAM CONTACT Scott Hasley Adam Kroll 312 920-2139 312 920-2149 [email protected] [email protected]
LTM M&A TRANSACTION MEDIAN MULTIPLES
0.9x
7.4x
12.3x
0x2x4x6x8x
10x12x14x
Net Sales EBITDA EBIT
Source: Securities Data Corporation
PACKAGING M&A TRANSACTIONS ($ in Billions)
$0$5
$10$15$20
$25$30
2001 2002 2003 2004 2005 YTDQ3 '05
YTD Q3 '06
050100150200250300350400
Transaction Value Number of Deals
Source: Press Releases and Securities Data Corporation
2006 Review M&A activity in the packaging industry has weakened slightly following a very active 2005. Although deal volume through the first three quarters of 2006 was lower than a year ago, total reported transaction value was up almost 13%. Year-to-date transaction value totaled approximately $16.1 billion, putting 2006 on pace to fall short of full year 2005. Transaction multiples were a significant factor driving the uptick in deal values for the first three quarters of the year. The median multiple paid for packaging companies with reported transaction values was 7.4x LTM EBITDA, an increase from 6.6x YTD 2005. The subsectors within packaging have experienced varied levels of interest from acquirors, which reflects both the fragmentation and the differing views on growth. Two sectors however, rigid and paper and board packaging companies, however, represented more than 50% of the deals, with the flexible sector making up the next largest volume contributor. The overall packaging industry is characterized by numerous players, ranging from large global companies to smaller specialty niche firms. Global consolidation has affected everyone in the marketplace as M&A is being used as a core strategy for companies to gain presence. The leading global firms continue to acquire target assets. The comparatively smaller firms are being forced to find different ways to compete, such as targeting niche markets that are uninteresting to the majors. Factors driving the consolidation include the need to develop, or in many cases acquire, new products, a large and growing global customer base and economies of scale that can help address rising raw material prices. Notable strategic acquisitions over the first three months of 2006 included MeadWestvaco’s acquisition of Saint Gobains’ Calmar pumps business and Ball Corp’s acquisition of U.S. Can’s U.S. and Argentina operations. Interest from private equity firms remains strong as massive amounts of uninvested capital and a favorable capital markets environment present attractive investment opportunities. One of the more notable acquisitions in 2006 was the acquisition of Smurfit-Stone’s consumer packaging business (renamed Altivity) by Texas Pacific Group (“TPG”). One of the largest private equity funds in the world, this was TPG’s first investment in the packaging industry, which was quickly followed by its acquisition of Field Container (to be combined with Altivity). Other notable private equity acquisitions included Apollo Management and Graham Partner’s acquisition of Berry Plastics and Wind Point Partners acquisition of York Label and Industrial Label Corp. 2007 Outlook Piper Jaffray expects the packaging industry to continue to experience strong M&A activity in 2007 as global consolidation further grabs the industry. Global packaging firms will continue to rationalize their businesses and divest noncore assets while focusing on key segments and acquiring target businesses. With the financial markets expected to continue its strong performance and the amount of uninvested private equity capital continuing to creep upward, financial buyers will also remain very active in the packaging industry during 2007. Private equity firms will continue to be attracted to the stable cash flows and significant growth opportunities in select markets.
INDEXED STOCK PERFORMANCE
80
90
100
110
120
1/1/
2006
1/22
/200
6
2/12
/200
6
3/5/
2006
3/26
/200
6
4/16
/200
6
5/7/
2006
5/28
/200
6
6/18
/200
6
7/9/
2006
7/30
/200
6
8/20
/200
6
9/10
/200
6
S&P 500 Index Packaging Index
Source: Capital IQ
Source: Bloomberg, Capital IQ, Forecast International and Piper Jaffray
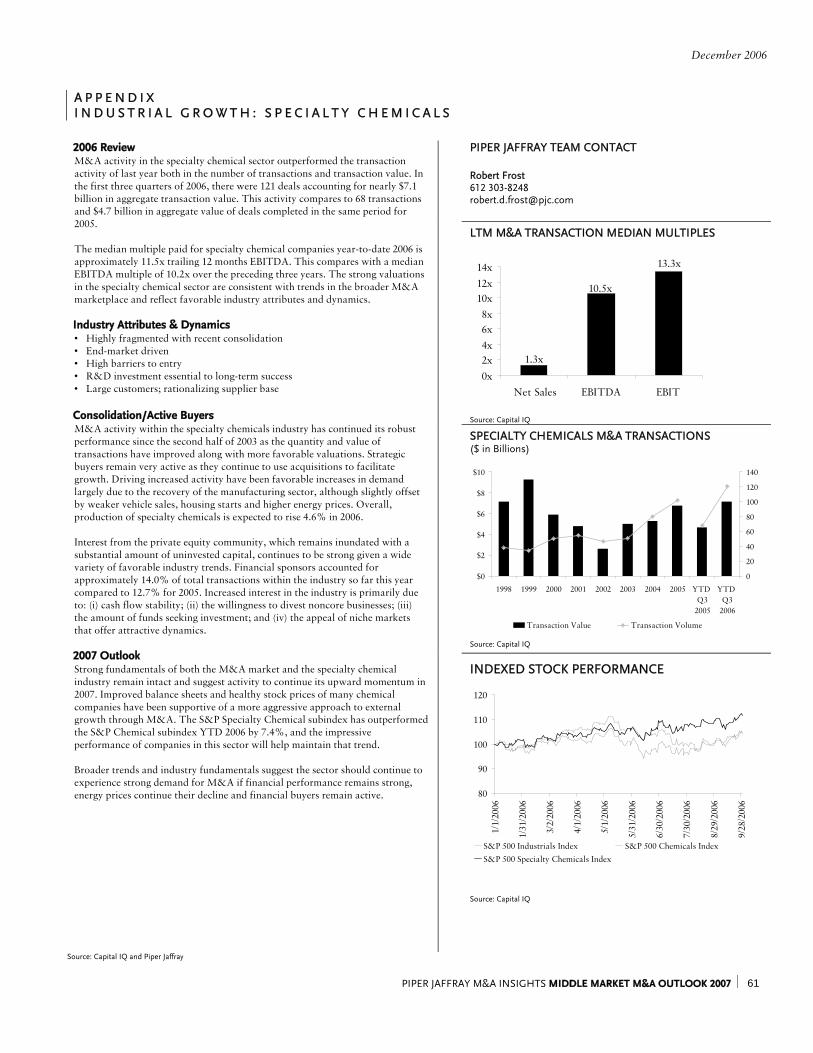
December 2006
PIPER JAFFRAY M&A INSIGHTS MIDDLE MARKET M&A OUTLOOK 2007 ⏐ 61
A P P E N D I X I N D U S T R I A L G R O W T H : S P E C I A L T Y C H E M I C A L S
PIPER JAFFRAY TEAM CONTACT Robert Frost 612 303-8248 [email protected]
LTM M&A TRANSACTION MEDIAN MULTIPLES
1.3x
10.5x
13.3x
0x2x4x6x8x
10x12x14x
Net Sales EBITDA EBIT
Source: Capital IQ
SPECIALTY CHEMICALS M&A TRANSACTIONS ($ in Billions)
$0
$2
$4
$6
$8
$10
1998 1999 2000 2001 2002 2003 2004 2005 YTD Q3
2005
YTD Q3
2006
0
20
40
60
80
100
120
140
Transaction Value Transaction Volume
Source: Capital IQ
2006 Review M&A activity in the specialty chemical sector outperformed the transaction activity of last year both in the number of transactions and transaction value. In the first three quarters of 2006, there were 121 deals accounting for nearly $7.1 billion in aggregate transaction value. This activity compares to 68 transactions and $4.7 billion in aggregate value of deals completed in the same period for 2005. The median multiple paid for specialty chemical companies year-to-date 2006 is approximately 11.5x trailing 12 months EBITDA. This compares with a median EBITDA multiple of 10.2x over the preceding three years. The strong valuations in the specialty chemical sector are consistent with trends in the broader M&A marketplace and reflect favorable industry attributes and dynamics. Industry Attributes & Dynamics • Highly fragmented with recent consolidation • End-market driven • High barriers to entry • R&D investment essential to long-term success • Large customers; rationalizing supplier base Consolidation/Active Buyers M&A activity within the specialty chemicals industry has continued its robust performance since the second half of 2003 as the quantity and value of transactions have improved along with more favorable valuations. Strategic buyers remain very active as they continue to use acquisitions to facilitate growth. Driving increased activity have been favorable increases in demand largely due to the recovery of the manufacturing sector, although slightly offset by weaker vehicle sales, housing starts and higher energy prices. Overall, production of specialty chemicals is expected to rise 4.6% in 2006. Interest from the private equity community, which remains inundated with a substantial amount of uninvested capital, continues to be strong given a wide variety of favorable industry trends. Financial sponsors accounted for approximately 14.0% of total transactions within the industry so far this year compared to 12.7% for 2005. Increased interest in the industry is primarily due to: (i) cash flow stability; (ii) the willingness to divest noncore businesses; (iii) the amount of funds seeking investment; and (iv) the appeal of niche markets that offer attractive dynamics. 2007 Outlook Strong fundamentals of both the M&A market and the specialty chemical industry remain intact and suggest activity to continue its upward momentum in 2007. Improved balance sheets and healthy stock prices of many chemical companies have been supportive of a more aggressive approach to external growth through M&A. The S&P Specialty Chemical subindex has outperformed the S&P Chemical subindex YTD 2006 by 7.4%, and the impressive performance of companies in this sector will help maintain that trend. Broader trends and industry fundamentals suggest the sector should continue to experience strong demand for M&A if financial performance remains strong, energy prices continue their decline and financial buyers remain active.
INDEXED STOCK PERFORMANCE
80
90
100
110
120
1/1/
2006
1/31
/200
6
3/2/
2006
4/1/
2006
5/1/
2006
5/31
/200
6
6/30
/200
6
7/30
/200
6
8/29
/200
6
9/28
/200
6
S&P 500 Industrials Index S&P 500 Chemicals Index
S&P 500 Specialty Chemicals Index
Source: Capital IQ
Source: Capital IQ and Piper Jaffray
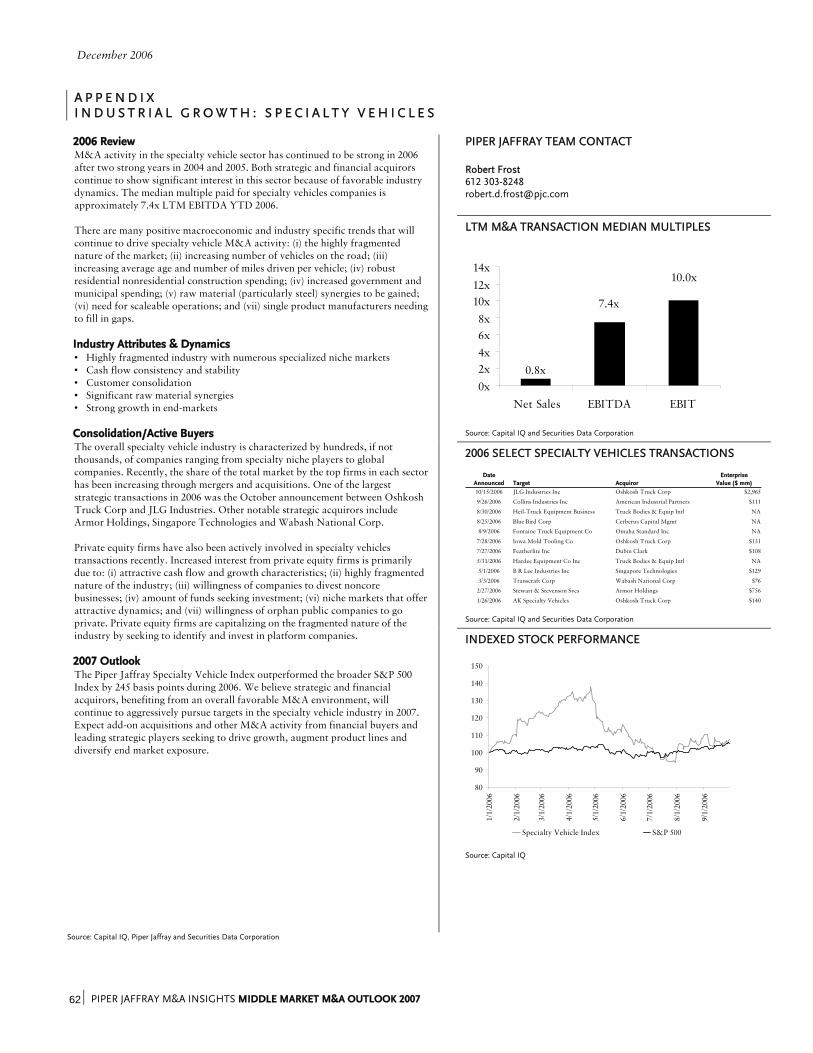
December 2006
PIPER JAFFRAY M&A INSIGHTS MIDDLE MARKET M&A OUTLOOK 2007 62 ⏐
A P P E N D I X I N D U S T R I A L G R O W T H : S P E C I A L T Y V E H I C L E S
PIPER JAFFRAY TEAM CONTACT Robert Frost 612 303-8248 [email protected]
LTM M&A TRANSACTION MEDIAN MULTIPLES
0.8x
7.4x
10.0x
0x2x4x6x8x
10x12x14x
Net Sales EBITDA EBIT
Source: Capital IQ and Securities Data Corporation
2006 SELECT SPECIALTY VEHICLES TRANSACTIONS
DateAnnounced Target Acquiror
EnterpriseValue ($ mm)
10/15/2006 JLG Industries Inc Oshkosh Truck Corp $2,965
9/26/2006 Collins Industries Inc American Industrial Partners $111
8/30/2006 Heil-Truck Equipment Business Truck Bodies & Equip Intl NA
8/25/2006 Blue Bird Corp Cerberus Capital Mgmt NA
8/9/2006 Fontaine Truck Equipment Co Omaha Standard Inc NA
7/28/2006 Iowa Mold Tooling Co Oshkosh Truck Corp $131
7/27/2006 Featherlite Inc Dubin Clark $108
5/31/2006 Hardee Equipment Co Inc Truck Bodies & Equip Intl NA
5/1/2006 B R Lee Industries Inc Singapore Technologies $129
3/3/2006 Transcraft Corp Wabash National Corp $76
2/27/2006 Stewart & Stevenson Svcs Armor Holdings $756
1/26/2006 AK Specialty Vehicles Oshkosh Truck Corp $140
Source: Capital IQ and Securities Data Corporation
2006 Review M&A activity in the specialty vehicle sector has continued to be strong in 2006 after two strong years in 2004 and 2005. Both strategic and financial acquirors continue to show significant interest in this sector because of favorable industry dynamics. The median multiple paid for specialty vehicles companies is approximately 7.4x LTM EBITDA YTD 2006. There are many positive macroeconomic and industry specific trends that will continue to drive specialty vehicle M&A activity: (i) the highly fragmented nature of the market; (ii) increasing number of vehicles on the road; (iii) increasing average age and number of miles driven per vehicle; (iv) robust residential nonresidential construction spending; (iv) increased government and municipal spending; (v) raw material (particularly steel) synergies to be gained; (vi) need for scaleable operations; and (vii) single product manufacturers needing to fill in gaps. Industry Attributes & Dynamics • Highly fragmented industry with numerous specialized niche markets • Cash flow consistency and stability • Customer consolidation • Significant raw material synergies • Strong growth in end-markets Consolidation/Active Buyers The overall specialty vehicle industry is characterized by hundreds, if not thousands, of companies ranging from specialty niche players to global companies. Recently, the share of the total market by the top firms in each sector has been increasing through mergers and acquisitions. One of the largest strategic transactions in 2006 was the October announcement between Oshkosh Truck Corp and JLG Industries. Other notable strategic acquirors include Armor Holdings, Singapore Technologies and Wabash National Corp. Private equity firms have also been actively involved in specialty vehicles transactions recently. Increased interest from private equity firms is primarily due to: (i) attractive cash flow and growth characteristics; (ii) highly fragmented nature of the industry; (iii) willingness of companies to divest noncore businesses; (iv) amount of funds seeking investment; (vi) niche markets that offer attractive dynamics; and (vii) willingness of orphan public companies to go private. Private equity firms are capitalizing on the fragmented nature of the industry by seeking to identify and invest in platform companies. 2007 Outlook The Piper Jaffray Specialty Vehicle Index outperformed the broader S&P 500 Index by 245 basis points during 2006. We believe strategic and financial acquirors, benefiting from an overall favorable M&A environment, will continue to aggressively pursue targets in the specialty vehicle industry in 2007. Expect add-on acquisitions and other M&A activity from financial buyers and leading strategic players seeking to drive growth, augment product lines and diversify end market exposure.
INDEXED STOCK PERFORMANCE
80
90
100
110
120
130
140
150
1/1/
2006
2/1/
2006
3/1/
2006
4/1/
2006
5/1/
2006
6/1/
2006
7/1/
2006
8/1/
2006
9/1/
2006
Specialty Vehicle Index S&P 500
Source: Capital IQ
Source: Capital IQ, Piper Jaffray and Securities Data Corporation
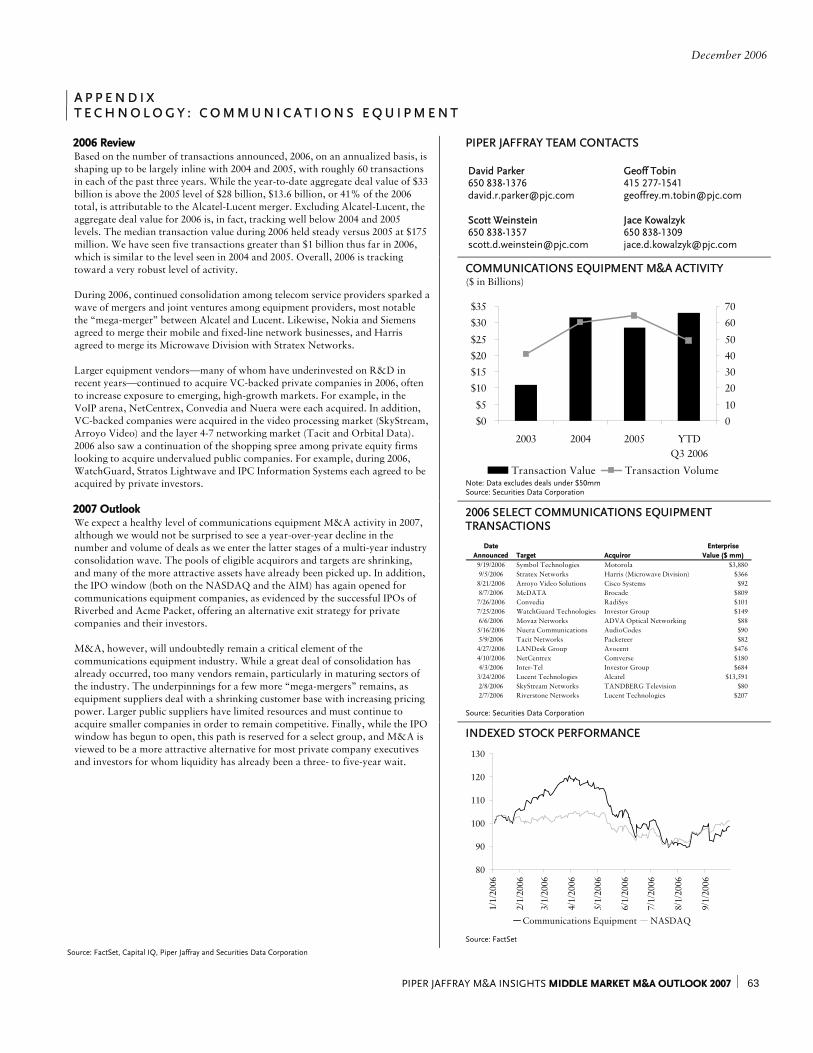
December 2006
PIPER JAFFRAY M&A INSIGHTS MIDDLE MARKET M&A OUTLOOK 2007 ⏐ 63
A P P E N D I X T E C H N O L O G Y : C O M M U N I C A T I O N S E Q U I P M E N T
PIPER JAFFRAY TEAM CONTACTS
David Parker Geoff Tobin 650 838-1376 415 277-1541 [email protected] [email protected] Scott Weinstein Jace Kowalzyk 650 838-1357 650 838-1309 [email protected] [email protected]
COMMUNICATIONS EQUIPMENT M&A ACTIVITY ($ in Billions)
$0$5
$10$15$20$25
$30$35
2003 2004 2005 YTDQ3 2006
010
20304050
6070
Transaction Value Transaction Volume Note: Data excludes deals under $50mm Source: Securities Data Corporation
2006 SELECT COMMUNICATIONS EQUIPMENT TRANSACTIONS
Date EnterpriseAnnounced Target Acquiror Value ($ mm)
9/19/2006 Symbol Technologies Motorola $3,8809/5/2006 Stratex Networks Harris (Microwave Division) $3668/21/2006 Arroyo Video Solutions Cisco Systems $928/7/2006 McDATA Brocade $8097/26/2006 Convedia RadiSys $1017/25/2006 WatchGuard Technologies Investor Group $1496/6/2006 Movaz Networks ADVA Optical Networking $885/16/2006 Nuera Communications AudioCodes $905/9/2006 Tacit Networks Packeteer $824/27/2006 LANDesk Group Avocent $4764/10/2006 NetCentrex Comverse $1804/3/2006 Inter-Tel Investor Group $6843/24/2006 Lucent Technologies Alcatel $13,5912/8/2006 SkyStream Networks TANDBERG Television $802/7/2006 Riverstone Networks Lucent Technologies $207
Source: Securities Data Corporation
2006 Review Based on the number of transactions announced, 2006, on an annualized basis, is shaping up to be largely inline with 2004 and 2005, with roughly 60 transactions in each of the past three years. While the year-to-date aggregate deal value of $33 billion is above the 2005 level of $28 billion, $13.6 billion, or 41% of the 2006 total, is attributable to the Alcatel-Lucent merger. Excluding Alcatel-Lucent, the aggregate deal value for 2006 is, in fact, tracking well below 2004 and 2005 levels. The median transaction value during 2006 held steady versus 2005 at $175 million. We have seen five transactions greater than $1 billion thus far in 2006, which is similar to the level seen in 2004 and 2005. Overall, 2006 is tracking toward a very robust level of activity. During 2006, continued consolidation among telecom service providers sparked a wave of mergers and joint ventures among equipment providers, most notable the “mega-merger” between Alcatel and Lucent. Likewise, Nokia and Siemens agreed to merge their mobile and fixed-line network businesses, and Harris agreed to merge its Microwave Division with Stratex Networks. Larger equipment vendors—many of whom have underinvested on R&D in recent years—continued to acquire VC-backed private companies in 2006, often to increase exposure to emerging, high-growth markets. For example, in the VoIP arena, NetCentrex, Convedia and Nuera were each acquired. In addition, VC-backed companies were acquired in the video processing market (SkyStream, Arroyo Video) and the layer 4-7 networking market (Tacit and Orbital Data). 2006 also saw a continuation of the shopping spree among private equity firms looking to acquire undervalued public companies. For example, during 2006, WatchGuard, Stratos Lightwave and IPC Information Systems each agreed to be acquired by private investors. 2007 Outlook We expect a healthy level of communications equipment M&A activity in 2007, although we would not be surprised to see a year-over-year decline in the number and volume of deals as we enter the latter stages of a multi-year industry consolidation wave. The pools of eligible acquirors and targets are shrinking, and many of the more attractive assets have already been picked up. In addition, the IPO window (both on the NASDAQ and the AIM) has again opened for communications equipment companies, as evidenced by the successful IPOs of Riverbed and Acme Packet, offering an alternative exit strategy for private companies and their investors. M&A, however, will undoubtedly remain a critical element of the communications equipment industry. While a great deal of consolidation has already occurred, too many vendors remain, particularly in maturing sectors of the industry. The underpinnings for a few more “mega-mergers” remains, as equipment suppliers deal with a shrinking customer base with increasing pricing power. Larger public suppliers have limited resources and must continue to acquire smaller companies in order to remain competitive. Finally, while the IPO window has begun to open, this path is reserved for a select group, and M&A is viewed to be a more attractive alternative for most private company executives and investors for whom liquidity has already been a three- to five-year wait.
INDEXED STOCK PERFORMANCE
80
90
100
110
120
130
1/1/
2006
2/1/
2006
3/1/
2006
4/1/
2006
5/1/
2006
6/1/
2006
7/1/
2006
8/1/
2006
9/1/
2006
Communications Equipment NASDAQ
Source: FactSet
Source: FactSet, Capital IQ, Piper Jaffray and Securities Data Corporation
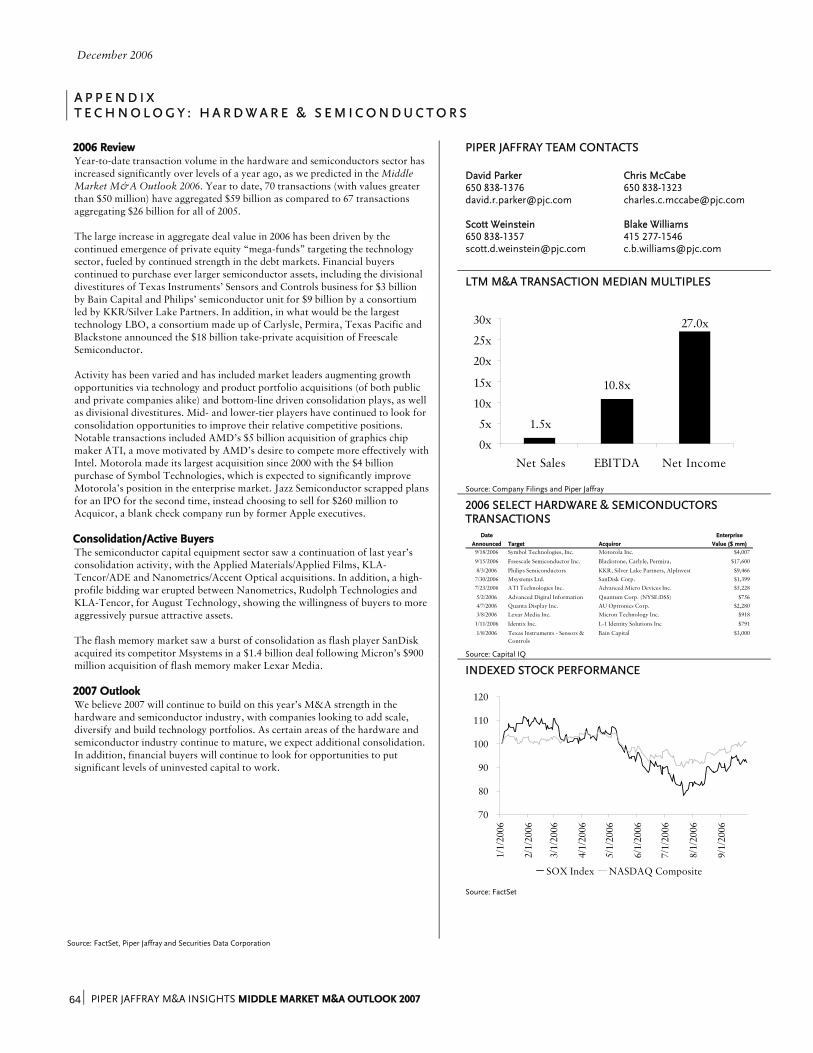
December 2006
PIPER JAFFRAY M&A INSIGHTS MIDDLE MARKET M&A OUTLOOK 2007 64 ⏐
A P P E N D I X T E C H N O L O G Y : H A R D W A R E & S E M I C O N D U C T O R S
PIPER JAFFRAY TEAM CONTACTS David Parker Chris McCabe 650 838-1376 650 838-1323 [email protected] [email protected] Scott Weinstein Blake Williams 650 838-1357 415 277-1546 [email protected] [email protected]
LTM M&A TRANSACTION MEDIAN MULTIPLES
1.5x
10.8x
27.0x
0x
5x
10x
15x
20x
25x
30x
Net Sales EBITDA Net Income
Source: Company Filings and Piper Jaffray
2006 SELECT HARDWARE & SEMICONDUCTORS TRANSACTIONS
Date Enterprise
Announced Target Acquiror Value ($ mm)9/18/2006 Symbol Technologies, Inc. Motorola Inc. $4,007
9/15/2006 Freescale Semiconductor Inc. Blackstone, Carlyle, Permira, $17,600
8/3/2006 Philips Semiconductors KKR, Silver Lake Partners, AlpInvest $9,4667/30/2006 Msystems Ltd. SanDisk Corp. $1,3997/23/2006 ATI Technologies Inc. Advanced Micro Devices Inc. $5,228
5/2/2006 Advanced Digital Information Quantum Corp. (NYSE:DSS) $7564/7/2006 Quanta Display Inc. AU Optronics Corp. $2,2803/8/2006 Lexar Media Inc. Micron Technology Inc. $918
1/11/2006 Identix Inc. L-1 Identity Solutions Inc $791
1/8/2006 Texas Instruments - Sensors & Controls
Bain Capital $3,000
Source: Capital IQ
2006 Review Year-to-date transaction volume in the hardware and semiconductors sector has increased significantly over levels of a year ago, as we predicted in the Middle Market M&A Outlook 2006. Year to date, 70 transactions (with values greater than $50 million) have aggregated $59 billion as compared to 67 transactions aggregating $26 billion for all of 2005. The large increase in aggregate deal value in 2006 has been driven by the continued emergence of private equity “mega-funds” targeting the technology sector, fueled by continued strength in the debt markets. Financial buyers continued to purchase ever larger semiconductor assets, including the divisional divestitures of Texas Instruments’ Sensors and Controls business for $3 billion by Bain Capital and Philips’ semiconductor unit for $9 billion by a consortium led by KKR/Silver Lake Partners. In addition, in what would be the largest technology LBO, a consortium made up of Carlysle, Permira, Texas Pacific and Blackstone announced the $18 billion take-private acquisition of Freescale Semiconductor. Activity has been varied and has included market leaders augmenting growth opportunities via technology and product portfolio acquisitions (of both public and private companies alike) and bottom-line driven consolidation plays, as well as divisional divestitures. Mid- and lower-tier players have continued to look for consolidation opportunities to improve their relative competitive positions. Notable transactions included AMD’s $5 billion acquisition of graphics chip maker ATI, a move motivated by AMD’s desire to compete more effectively with Intel. Motorola made its largest acquisition since 2000 with the $4 billion purchase of Symbol Technologies, which is expected to significantly improve Motorola’s position in the enterprise market. Jazz Semiconductor scrapped plans for an IPO for the second time, instead choosing to sell for $260 million to Acquicor, a blank check company run by former Apple executives. Consolidation/Active Buyers The semiconductor capital equipment sector saw a continuation of last year’s consolidation activity, with the Applied Materials/Applied Films, KLA-Tencor/ADE and Nanometrics/Accent Optical acquisitions. In addition, a high-profile bidding war erupted between Nanometrics, Rudolph Technologies and KLA-Tencor, for August Technology, showing the willingness of buyers to more aggressively pursue attractive assets. The flash memory market saw a burst of consolidation as flash player SanDisk acquired its competitor Msystems in a $1.4 billion deal following Micron’s $900 million acquisition of flash memory maker Lexar Media. 2007 Outlook We believe 2007 will continue to build on this year’s M&A strength in the hardware and semiconductor industry, with companies looking to add scale, diversify and build technology portfolios. As certain areas of the hardware and semiconductor industry continue to mature, we expect additional consolidation. In addition, financial buyers will continue to look for opportunities to put significant levels of uninvested capital to work.
INDEXED STOCK PERFORMANCE
70
80
90
100
110
120
1/1/
2006
2/1/
2006
3/1/
2006
4/1/
2006
5/1/
2006
6/1/
2006
7/1/
2006
8/1/
2006
9/1/
2006
SOX Index NASDAQ Composite
Source: FactSet
Source: FactSet, Piper Jaffray and Securities Data Corporation
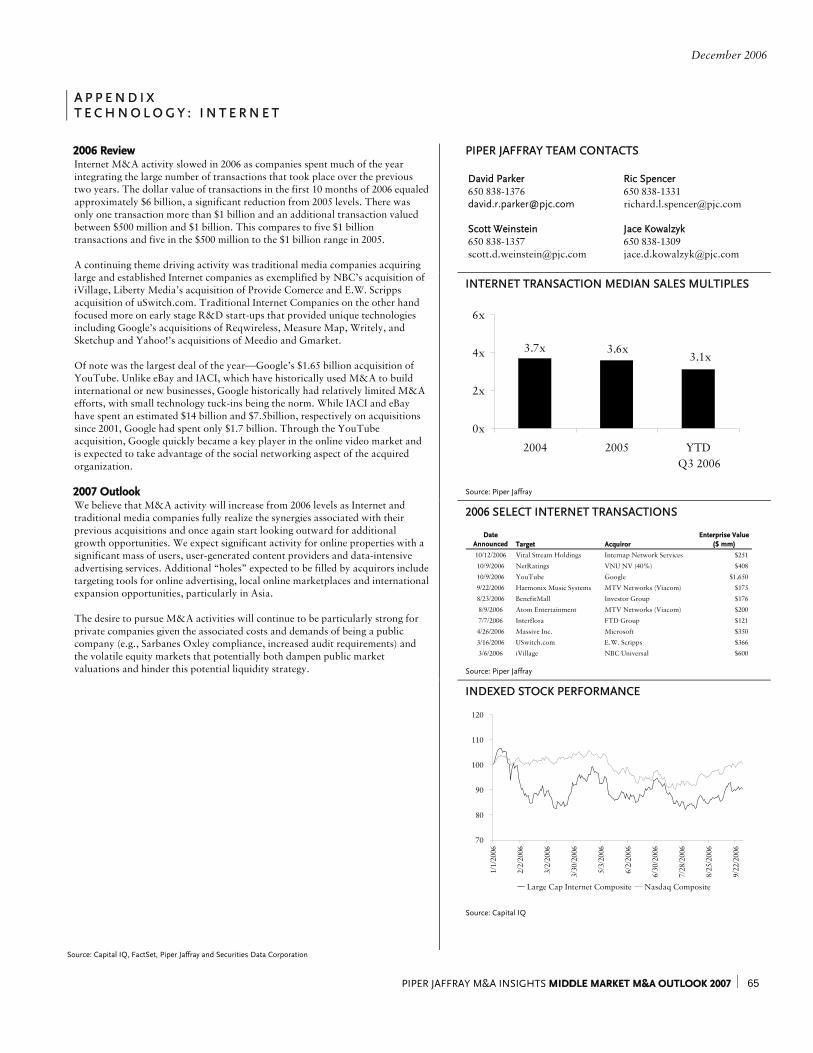
December 2006
PIPER JAFFRAY M&A INSIGHTS MIDDLE MARKET M&A OUTLOOK 2007 ⏐ 65
A P P E N D I X T E C H N O L O G Y : I N T E R N E T
PIPER JAFFRAY TEAM CONTACTS David Parker Ric Spencer 650 838-1376 650 838-1331 [email protected] [email protected] Scott Weinstein Jace Kowalzyk 650 838-1357 650 838-1309 [email protected] [email protected]
INTERNET TRANSACTION MEDIAN SALES MULTIPLES
3.7x 3.6x3.1x
0x
2x
4x
6x
2004 2005 YTD Q3 2006
Source: Piper Jaffray
2006 SELECT INTERNET TRANSACTIONS
DateAnnounced Target Acquiror
Enterprise Value ($ mm)
10/12/2006 Vital Stream Holdings Internap Network Services $251
10/9/2006 NetRatings VNU NV (40%) $408
10/9/2006 YouTube Google $1,650
9/22/2006 Harmonix Music Systems MTV Networks (Viacom) $175
8/23/2006 BenefitMall Investor Group $176
8/9/2006 Atom Entertainment MTV Networks (Viacom) $200
7/7/2006 Interflora FTD Group $121
4/26/2006 Massive Inc. Microsoft $350
3/16/2006 USwitch.com E.W. Scripps $366
3/6/2006 iVillage NBC Universal $600
Source: Piper Jaffray
2006 Review Internet M&A activity slowed in 2006 as companies spent much of the year integrating the large number of transactions that took place over the previous two years. The dollar value of transactions in the first 10 months of 2006 equaled approximately $6 billion, a significant reduction from 2005 levels. There was only one transaction more than $1 billion and an additional transaction valued between $500 million and $1 billion. This compares to five $1 billion transactions and five in the $500 million to the $1 billion range in 2005. A continuing theme driving activity was traditional media companies acquiring large and established Internet companies as exemplified by NBC’s acquisition of iVillage, Liberty Media’s acquisition of Provide Comerce and E.W. Scripps acquisition of uSwitch.com. Traditional Internet Companies on the other hand focused more on early stage R&D start-ups that provided unique technologies including Google’s acquisitions of Reqwireless, Measure Map, Writely, and Sketchup and Yahoo!’s acquisitions of Meedio and Gmarket. Of note was the largest deal of the year—Google’s $1.65 billion acquisition of YouTube. Unlike eBay and IACI, which have historically used M&A to build international or new businesses, Google historically had relatively limited M&A efforts, with small technology tuck-ins being the norm. While IACI and eBay have spent an estimated $14 billion and $7.5billion, respectively on acquisitions since 2001, Google had spent only $1.7 billion. Through the YouTube acquisition, Google quickly became a key player in the online video market and is expected to take advantage of the social networking aspect of the acquired organization. 2007 Outlook We believe that M&A activity will increase from 2006 levels as Internet and traditional media companies fully realize the synergies associated with their previous acquisitions and once again start looking outward for additional growth opportunities. We expect significant activity for online properties with a significant mass of users, user-generated content providers and data-intensive advertising services. Additional “holes” expected to be filled by acquirors include targeting tools for online advertising, local online marketplaces and international expansion opportunities, particularly in Asia. The desire to pursue M&A activities will continue to be particularly strong for private companies given the associated costs and demands of being a public company (e.g., Sarbanes Oxley compliance, increased audit requirements) and the volatile equity markets that potentially both dampen public market valuations and hinder this potential liquidity strategy.
INDEXED STOCK PERFORMANCE
70
80
90
100
110
120
1/1/
2006
2/2/
2006
3/2/
2006
3/30
/200
6
5/3/
2006
6/2/
2006
6/30
/200
6
7/28
/200
6
8/25
/200
6
9/22
/200
6
Large Cap Internet Composite Nasdaq Composite
Source: Capital IQ
Source: Capital IQ, FactSet, Piper Jaffray and Securities Data Corporation
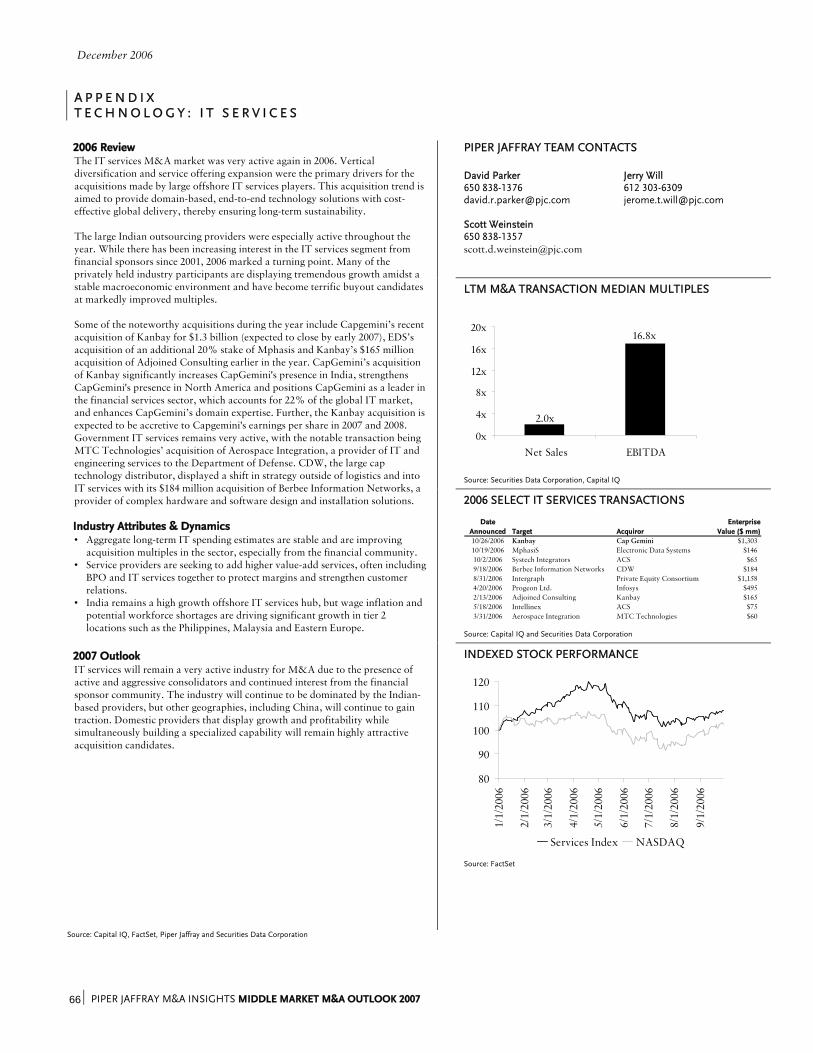
December 2006
PIPER JAFFRAY M&A INSIGHTS MIDDLE MARKET M&A OUTLOOK 2007 66 ⏐
A P P E N D I X T E C H N O L O G Y : I T S E R V I C E S
PIPER JAFFRAY TEAM CONTACTS David Parker Jerry Will 650 838-1376 612 303-6309 [email protected] [email protected] Scott Weinstein 650 838-1357 [email protected]
LTM M&A TRANSACTION MEDIAN MULTIPLES
2.0x
16.8x
0x
4x
8x
12x
16x
20x
Net Sales EBITDA
Source: Securities Data Corporation, Capital IQ
2006 SELECT IT SERVICES TRANSACTIONS
DateAnnounced Target Acquiror
EnterpriseValue ($ mm)
10/26/2006 Kanbay Cap Gemini $1,30310/19/2006 MphasiS Electronic Data Systems $14610/2/2006 Systech Integrators ACS $659/18/2006 Berbee Information Networks CDW $1848/31/2006 Intergraph Private Equity Consortium $1,1584/20/2006 Progeon Ltd. Infosys $4952/13/2006 Adjoined Consulting Kanbay $1655/18/2006 Intellinex ACS $753/31/2006 Aerospace Integration MTC Technologies $60
Source: Capital IQ and Securities Data Corporation
2006 Review The IT services M&A market was very active again in 2006. Vertical diversification and service offering expansion were the primary drivers for the acquisitions made by large offshore IT services players. This acquisition trend is aimed to provide domain-based, end-to-end technology solutions with cost-effective global delivery, thereby ensuring long-term sustainability. The large Indian outsourcing providers were especially active throughout the year. While there has been increasing interest in the IT services segment from financial sponsors since 2001, 2006 marked a turning point. Many of the privately held industry participants are displaying tremendous growth amidst a stable macroeconomic environment and have become terrific buyout candidates at markedly improved multiples. Some of the noteworthy acquisitions during the year include Capgemini’s recent acquisition of Kanbay for $1.3 billion (expected to close by early 2007), EDS’s acquisition of an additional 20% stake of Mphasis and Kanbay’s $165 million acquisition of Adjoined Consulting earlier in the year. CapGemini’s acquisition of Kanbay significantly increases CapGemini's presence in India, strengthens CapGemini's presence in North America and positions CapGemini as a leader in the financial services sector, which accounts for 22% of the global IT market, and enhances CapGemini’s domain expertise. Further, the Kanbay acquisition is expected to be accretive to Capgemini's earnings per share in 2007 and 2008. Government IT services remains very active, with the notable transaction being MTC Technologies’ acquisition of Aerospace Integration, a provider of IT and engineering services to the Department of Defense. CDW, the large cap technology distributor, displayed a shift in strategy outside of logistics and into IT services with its $184 million acquisition of Berbee Information Networks, a provider of complex hardware and software design and installation solutions. Industry Attributes & Dynamics • Aggregate long-term IT spending estimates are stable and are improving
acquisition multiples in the sector, especially from the financial community. • Service providers are seeking to add higher value-add services, often including
BPO and IT services together to protect margins and strengthen customer relations.
• India remains a high growth offshore IT services hub, but wage inflation and potential workforce shortages are driving significant growth in tier 2 locations such as the Philippines, Malaysia and Eastern Europe.
2007 Outlook IT services will remain a very active industry for M&A due to the presence of active and aggressive consolidators and continued interest from the financial sponsor community. The industry will continue to be dominated by the Indian-based providers, but other geographies, including China, will continue to gain traction. Domestic providers that display growth and profitability while simultaneously building a specialized capability will remain highly attractive acquisition candidates.
INDEXED STOCK PERFORMANCE
80
90
100
110
120
1/1/
2006
2/1/
2006
3/1/
2006
4/1/
2006
5/1/
2006
6/1/
2006
7/1/
2006
8/1/
2006
9/1/
2006
Services Index NASDAQ
Source: FactSet
Source: Capital IQ, FactSet, Piper Jaffray and Securities Data Corporation
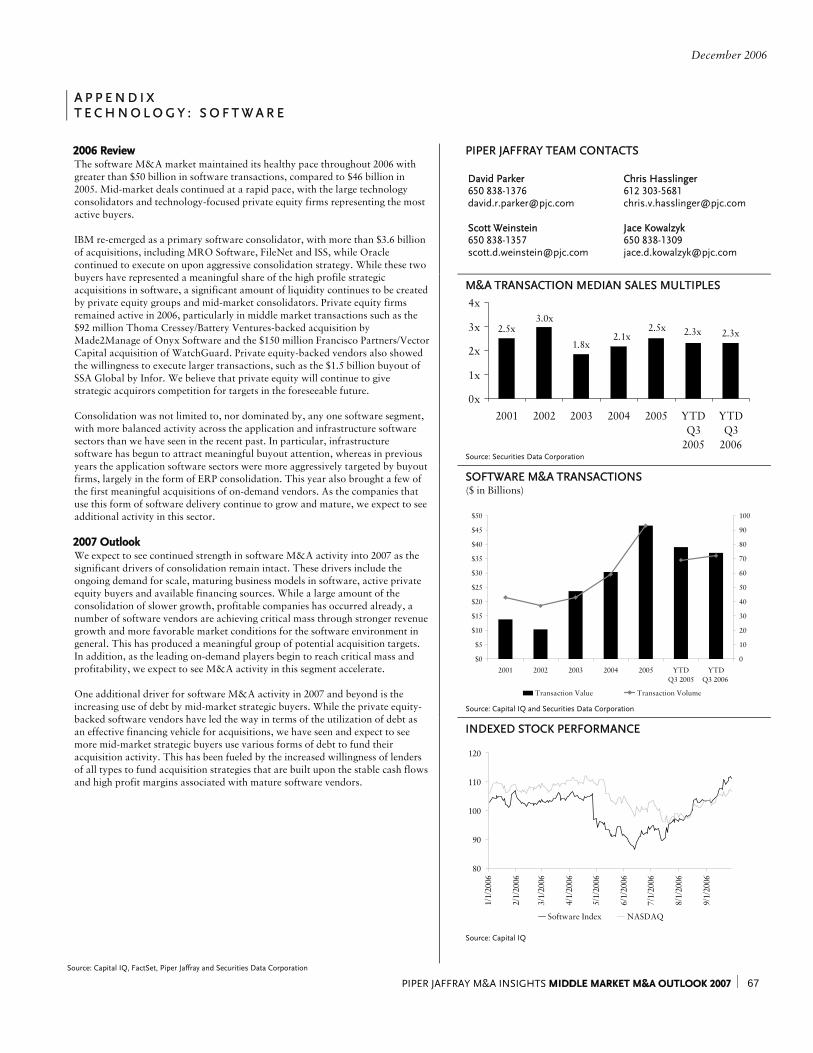
December 2006
PIPER JAFFRAY M&A INSIGHTS MIDDLE MARKET M&A OUTLOOK 2007 ⏐ 67
A P P E N D I X T E C H N O L O G Y : S O F T W A R E
PIPER JAFFRAY TEAM CONTACTS David Parker Chris Hasslinger 650 838-1376 612 303-5681 [email protected] [email protected] Scott Weinstein Jace Kowalzyk 650 838-1357 650 838-1309 [email protected] [email protected]
M&A TRANSACTION MEDIAN SALES MULTIPLES
Source: Securities Data Corporation
SOFTWARE M&A TRANSACTIONS ($ in Billions)
$0
$5
$10
$15
$20
$25
$30
$35
$40
$45
$50
2001 2002 2003 2004 2005 YTDQ3 2005
YTDQ3 2006
0
10
20
30
40
50
60
70
80
90
100
Transaction Value Transaction Volume Source: Capital IQ and Securities Data Corporation
2006 Review The software M&A market maintained its healthy pace throughout 2006 with greater than $50 billion in software transactions, compared to $46 billion in 2005. Mid-market deals continued at a rapid pace, with the large technology consolidators and technology-focused private equity firms representing the most active buyers. IBM re-emerged as a primary software consolidator, with more than $3.6 billion of acquisitions, including MRO Software, FileNet and ISS, while Oracle continued to execute on upon aggressive consolidation strategy. While these two buyers have represented a meaningful share of the high profile strategic acquisitions in software, a significant amount of liquidity continues to be created by private equity groups and mid-market consolidators. Private equity firms remained active in 2006, particularly in middle market transactions such as the $92 million Thoma Cressey/Battery Ventures-backed acquisition by Made2Manage of Onyx Software and the $150 million Francisco Partners/Vector Capital acquisition of WatchGuard. Private equity-backed vendors also showed the willingness to execute larger transactions, such as the $1.5 billion buyout of SSA Global by Infor. We believe that private equity will continue to give strategic acquirors competition for targets in the foreseeable future. Consolidation was not limited to, nor dominated by, any one software segment, with more balanced activity across the application and infrastructure software sectors than we have seen in the recent past. In particular, infrastructure software has begun to attract meaningful buyout attention, whereas in previous years the application software sectors were more aggressively targeted by buyout firms, largely in the form of ERP consolidation. This year also brought a few of the first meaningful acquisitions of on-demand vendors. As the companies that use this form of software delivery continue to grow and mature, we expect to see additional activity in this sector. 2007 Outlook We expect to see continued strength in software M&A activity into 2007 as the significant drivers of consolidation remain intact. These drivers include the ongoing demand for scale, maturing business models in software, active private equity buyers and available financing sources. While a large amount of the consolidation of slower growth, profitable companies has occurred already, a number of software vendors are achieving critical mass through stronger revenue growth and more favorable market conditions for the software environment in general. This has produced a meaningful group of potential acquisition targets. In addition, as the leading on-demand players begin to reach critical mass and profitability, we expect to see M&A activity in this segment accelerate. One additional driver for software M&A activity in 2007 and beyond is the increasing use of debt by mid-market strategic buyers. While the private equity-backed software vendors have led the way in terms of the utilization of debt as an effective financing vehicle for acquisitions, we have seen and expect to see more mid-market strategic buyers use various forms of debt to fund their acquisition activity. This has been fueled by the increased willingness of lenders of all types to fund acquisition strategies that are built upon the stable cash flows and high profit margins associated with mature software vendors.
INDEXED STOCK PERFORMANCE
80
90
100
110
120
1/1/
2006
2/1/
2006
3/1/
2006
4/1/
2006
5/1/
2006
6/1/
2006
7/1/
2006
8/1/
2006
9/1/
2006
Software Index NASDAQ
Source: Capital IQ
Source: Capital IQ, FactSet, Piper Jaffray and Securities Data Corporation
2.5x
1.8x2.3x2.3x2.5x
3.0x
2.1x
0x
1x
2x
3x
4x
2001 2002 2003 2004 2005 YTDQ3
2005
YTDQ3
2006
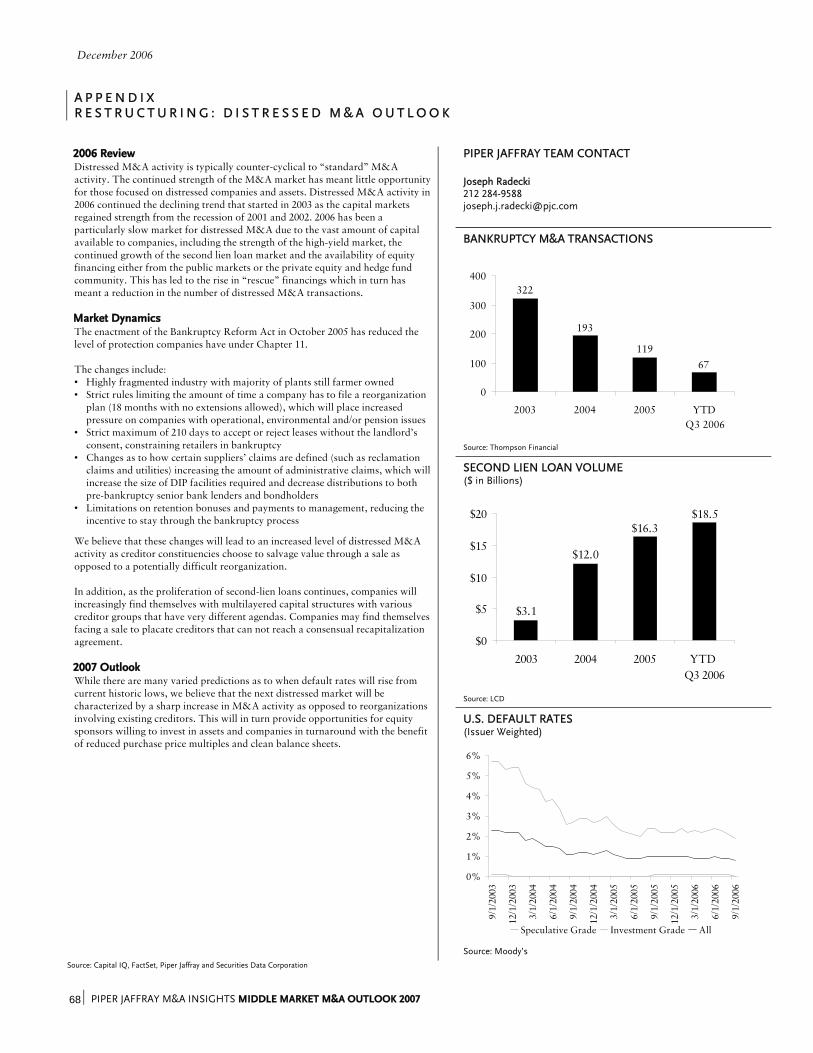
December 2006
PIPER JAFFRAY M&A INSIGHTS MIDDLE MARKET M&A OUTLOOK 2007 68 ⏐
A P P E N D I X R E S T R U C T U R I N G : D I S T R E S S E D M & A O U T L O O K
PIPER JAFFRAY TEAM CONTACT Joseph Radecki 212 284-9588 [email protected]
BANKRUPTCY M&A TRANSACTIONS
67
322
193
119
0
100
200
300
400
2003 2004 2005 YTD Q3 2006
Source: Thompson Financial
SECOND LIEN LOAN VOLUME ($ in Billions)
$16.3
$12.0
$3.1
$18.5
$0
$5
$10
$15
$20
2003 2004 2005 YTD Q3 2006
Source: LCD
2006 Review Distressed M&A activity is typically counter-cyclical to “standard” M&A activity. The continued strength of the M&A market has meant little opportunity for those focused on distressed companies and assets. Distressed M&A activity in 2006 continued the declining trend that started in 2003 as the capital markets regained strength from the recession of 2001 and 2002. 2006 has been a particularly slow market for distressed M&A due to the vast amount of capital available to companies, including the strength of the high-yield market, the continued growth of the second lien loan market and the availability of equity financing either from the public markets or the private equity and hedge fund community. This has led to the rise in “rescue” financings which in turn has meant a reduction in the number of distressed M&A transactions. Market Dynamics The enactment of the Bankruptcy Reform Act in October 2005 has reduced the level of protection companies have under Chapter 11. The changes include: • Highly fragmented industry with majority of plants still farmer owned • Strict rules limiting the amount of time a company has to file a reorganization
plan (18 months with no extensions allowed), which will place increased pressure on companies with operational, environmental and/or pension issues
• Strict maximum of 210 days to accept or reject leases without the landlord’s consent, constraining retailers in bankruptcy
• Changes as to how certain suppliers’ claims are defined (such as reclamation claims and utilities) increasing the amount of administrative claims, which will increase the size of DIP facilities required and decrease distributions to both pre-bankruptcy senior bank lenders and bondholders
• Limitations on retention bonuses and payments to management, reducing the incentive to stay through the bankruptcy process
We believe that these changes will lead to an increased level of distressed M&A activity as creditor constituencies choose to salvage value through a sale as opposed to a potentially difficult reorganization. In addition, as the proliferation of second-lien loans continues, companies will increasingly find themselves with multilayered capital structures with various creditor groups that have very different agendas. Companies may find themselves facing a sale to placate creditors that can not reach a consensual recapitalization agreement. 2007 Outlook While there are many varied predictions as to when default rates will rise from current historic lows, we believe that the next distressed market will be characterized by a sharp increase in M&A activity as opposed to reorganizations involving existing creditors. This will in turn provide opportunities for equity sponsors willing to invest in assets and companies in turnaround with the benefit of reduced purchase price multiples and clean balance sheets.
U.S. DEFAULT RATES (Issuer Weighted)
0%
1%
2%
3%
4%
5%
6%
9/1/
2003
12/1
/200
3
3/1/
2004
6/1/
2004
9/1/
2004
12/1
/200
4
3/1/
2005
6/1/
2005
9/1/
2005
12/1
/200
5
3/1/
2006
6/1/
2006
9/1/
2006
Speculative Grade Investment Grade All
Source: Moody’s Source: Capital IQ, FactSet, Piper Jaffray and Securities Data Corporation

28 locations serving the capital markets—including 25 u.s. offices, london, madrid and shanghai
© 2006 Piper Jaffray & Co. Since 1895. Member SIPC and NYSE. Securities and products are offered in theUnited Kingdom through Piper Jaffray Ltd., which is an affiliate of Piper Jaffray & Co., incorporated underthe laws of England and Wales, authorized and regulated by the Financial Services Authority and a memberof the London Stock Exchange.11/06 CM-06-1190 piperjaffray.com