merck fy 2016
TRANSCRIPT
Stefan Oschmann, CEO Marcus Kuhnert, CFO
March 9, 2017
Merck FY 2016 results
– Presentation for the media –
ANNUAL PRESS CONFERENCE
Disclaimer
Cautionary Note Regarding Forward-Looking Statements and financial indicatorsThis communication may include “forward-looking statements.” Statements that include words such as “anticipate,” “expect,” “should,” “would,” “intend,” “plan,” “project,” “seek,”“believe,” “will,” and other words of similar meaning in connection with future events or future operating or financial performance are often used to identify forward-looking statements. Allstatements in this communication, other than those relating to historical information or current conditions, are forward-looking statements. We intend these forward-looking statements tobe covered by the safe harbor provisions for forward-looking statements in the Private Securities Litigation Reform Act of 1995. These forward-looking statements are subject to a numberof risks and uncertainties, many of which are beyond control of Merck KGaA, Darmstadt, Germany, which could cause actual results to differ materially from such statements.
Risks and uncertainties include, but are not limited to: the risks of more restrictive regulatory requirements regarding drug pricing, reimbursement and approval; the risk of stricterregulations for the manufacture, testing and marketing of products; the risk of destabilization of political systems and the establishment of trade barriers; the risk of a changing marketingenvironment for multiple sclerosis products in the European Union; the risk of greater competitive pressure due to biosimilars; the risks of research and development; the risks ofdiscontinuing development projects and regulatory approval of developed medicines; the risk of a temporary ban on products/production facilities or of non-registration of products due tonon-compliance with quality standards; the risk of an import ban on products to the United States due to an FDA warning letter; the risks of dependency on suppliers; risks due to product-related crime and espionage; risks in relation to the use of financial instruments; liquidity risks; counterparty risks; market risks; risks of impairment on balance sheet items; risks frompension obligations; risks from product-related and patent law disputes; risks from antitrust law proceedings; risks from drug pricing by the divested Generics Group; risks in humanresources; risks from e-crime and cyber attacks; risks due to failure of business-critical information technology applications or to failure of data center capacity; environmental and safetyrisks; unanticipated contract or regulatory issues; a potential downgrade in the rating of the indebtedness of Merck KGaA, Darmstadt, Germany; downward pressure on the common stockprice of Merck KGaA, Darmstadt, Germany and its impact on goodwill impairment evaluations; the impact of future regulatory or legislative actions; and the risks and uncertainties detailedby Sigma-Aldrich Corporation (“Sigma-Aldrich”) with respect to its business as described in its reports and documents filed with the U.S. Securities and Exchange Commission (the “SEC”).
The foregoing review of important factors should not be construed as exhaustive and should be read in conjunction with the other cautionary statements that are included elsewhere,including the Report on Risks and Opportunities Section of the most recent annual report and quarterly report of Merck KGaA, Darmstadt, Germany, and the Risk Factors section of Sigma-Aldrich’s most recent reports on Form 10-K and Form 10-Q. Any forward-looking statements made in this communication are qualified in their entirety by these cautionary statements, andthere can be no assurance that the actual results or developments anticipated by us will be realized or, even if substantially realized, that they will have the expected consequences to, oreffects on, us or our business or operations. Except to the extent required by applicable law, we undertake no obligation to update publicly or revise any forward-looking statement,whether as a result of new information, future developments or otherwise.
This quarterly presentation contains certain financial indicators such as EBITDA pre exceptionals, net financial debt and earnings per share pre exceptionals, which are not defined byInternational Financial Reporting Standards (IFRS). These financial indicators should not be taken into account in order to assess the performance of Merck in isolation or used as analternative to the financial indicators presented in the consolidated financial statements and determined in accordance with IFRS. The figures presented in this quarterly statement havebeen rounded. This may lead to individual values not adding up to the totals presented.
2

Agenda
2016 – A successful year
Strategic review
Financial overview
Outlook and guidance
3

2016 – A SUCCESSFUL YEAR
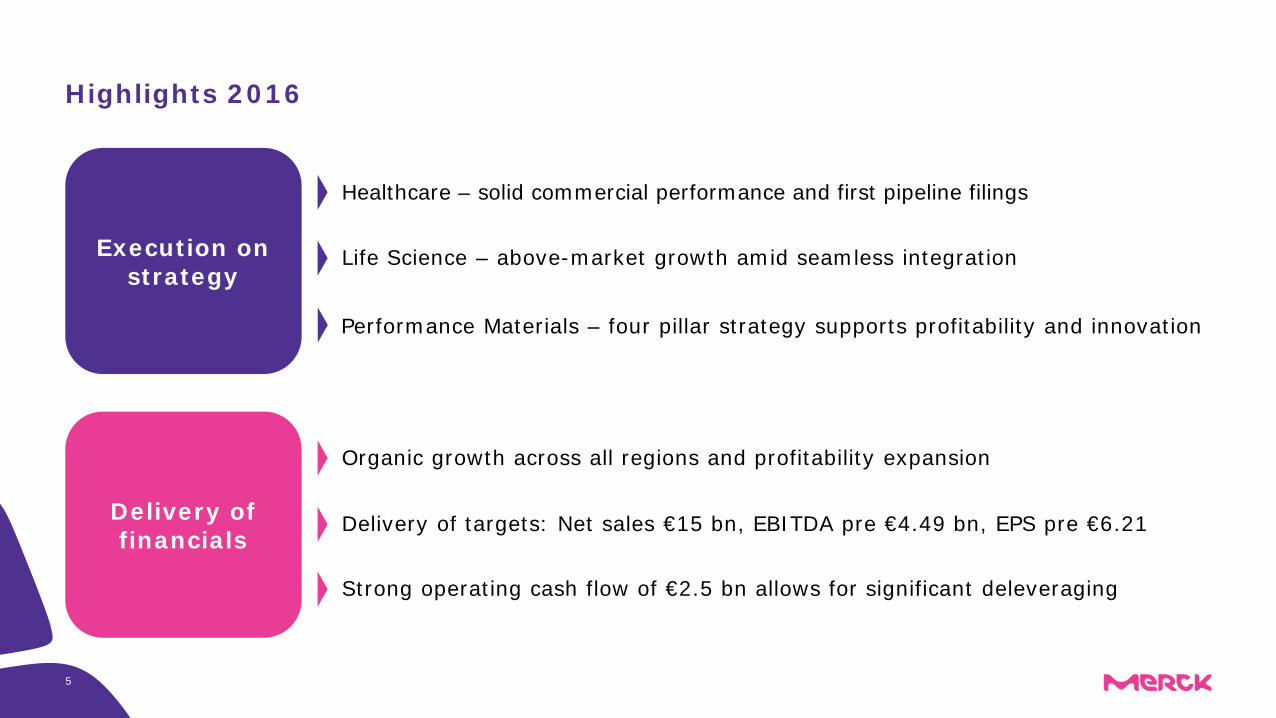
Highlights 2016
Execution on strategy
Healthcare – solid commercial performance and first pipeline filings
Performance Materials – four pillar strategy supports profitability and innovation
Life Science – above-market growth amid seamless integration
Delivery of financials
Strong operating cash flow of €2.5 bn allows for significant deleveraging
Delivery of targets: Net sales €15 bn, EBITDA pre €4.49 bn, EPS pre €6.21
Organic growth across all regions and profitability expansion
5
FY 2015 FY 2016
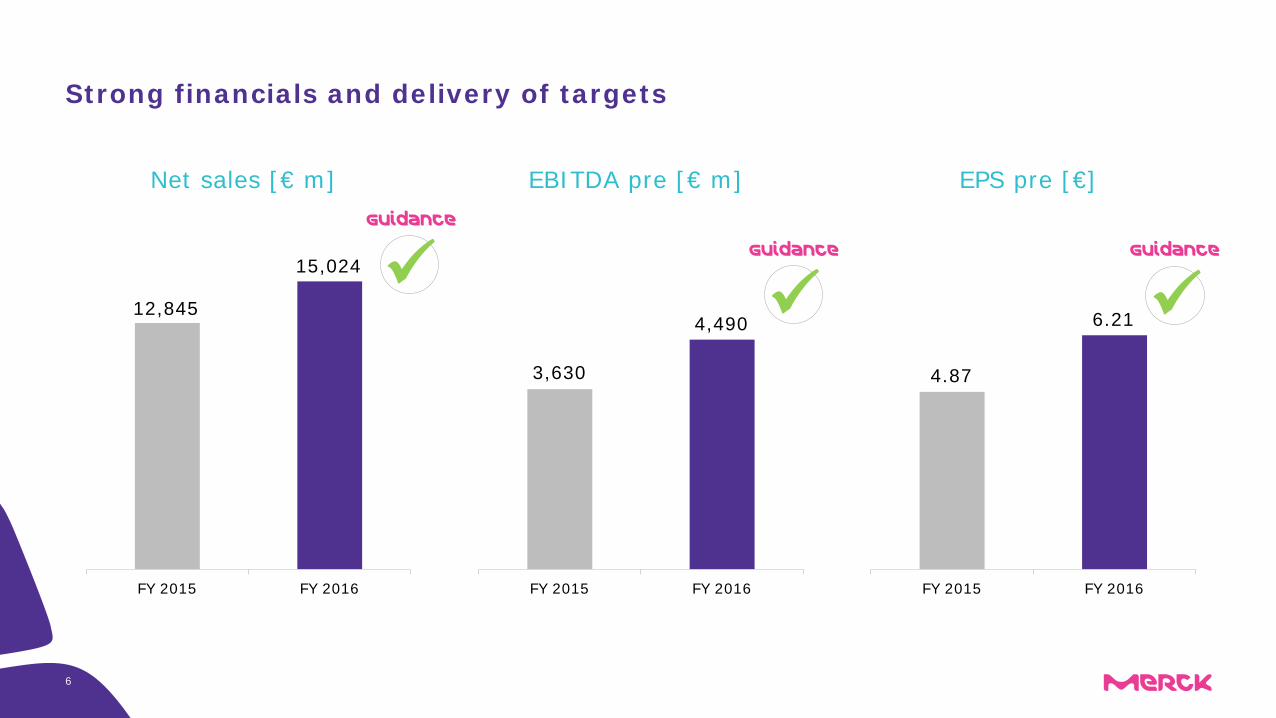
Strong financials and delivery of targets
FY 2015 FY 2016 FY 2015 FY 2016
Net sales [€ m] EBITDA pre [€ m] EPS pre [€]
12,845
15,024
3,630
4,490
4.87
6.21
Guidance
Guidance Guidance
6
LC=Liquid Crystals; GM=General Medicine (includes CardioMetabolic Care & General Medicine and Others); CH=Consumer Health7
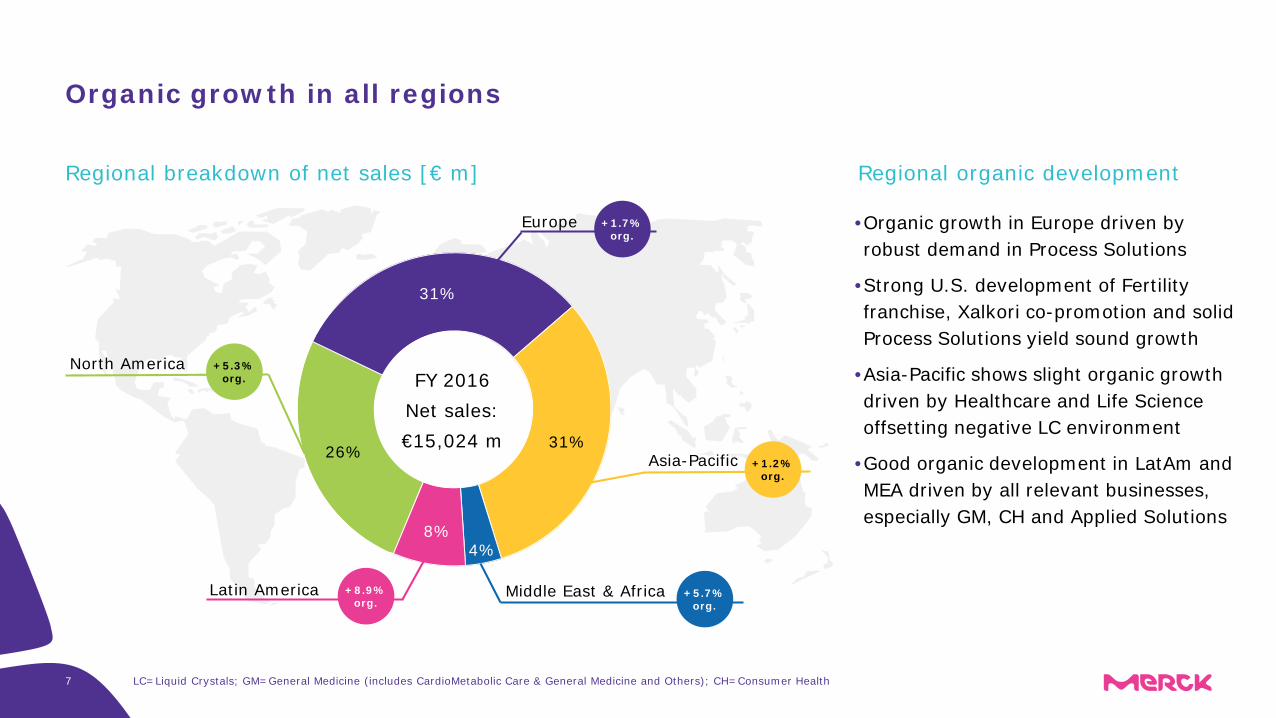
Organic growth in all regions
Regional breakdown of net sales [€ m]
•Organic growth in Europe driven by robust demand in Process Solutions
•Strong U.S. development of Fertility franchise, Xalkori co-promotion and solid Process Solutions yield sound growth
•Asia-Pacific shows slight organic growth driven by Healthcare and Life Science offsetting negative LC environment
•Good organic development in LatAm and MEA driven by all relevant businesses, especially GM, CH and Applied Solutions
Regional organic development
26%
31%
31%
4%8%
FY 2016Net sales:€15,024 m
Middle East & Africa
Asia-Pacific
Europe
Latin America
North America
+1.7%org.
+1.2%org.
+5.7%org.
+8.9%org.
+5.3%org.
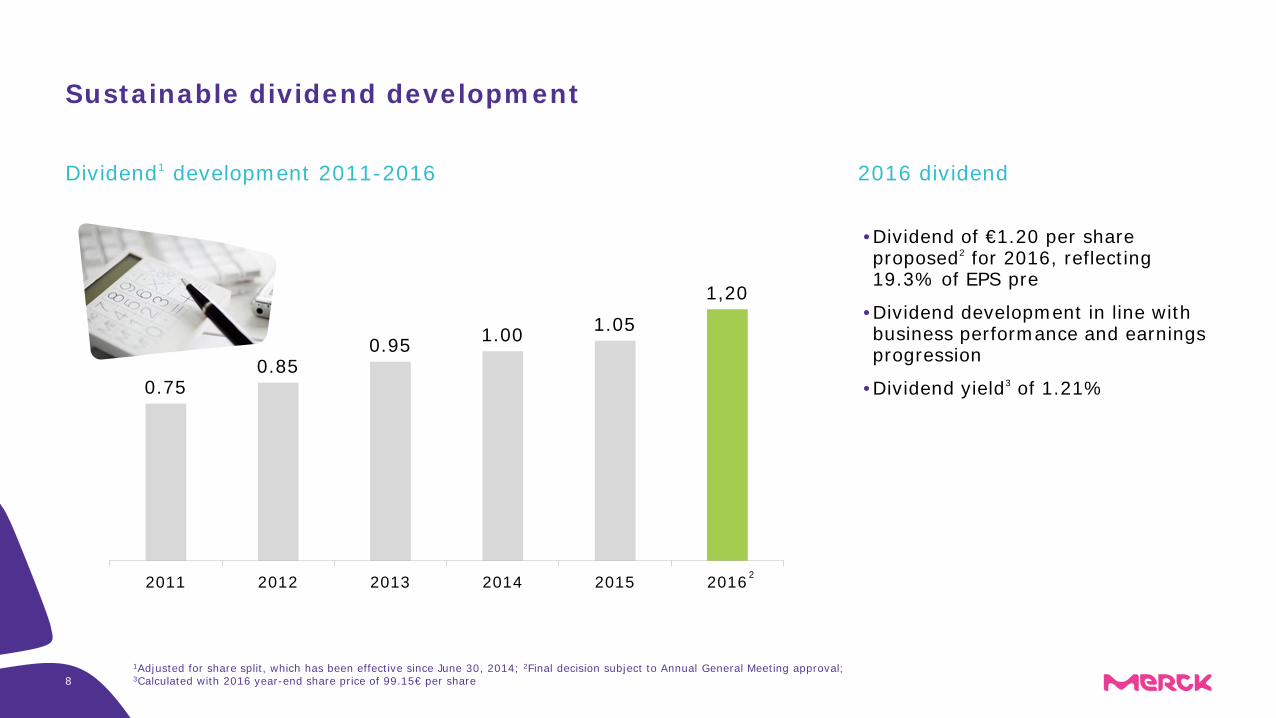
0.750.85
0.95 1.00 1.051,20
2011 2012 2013 2014 2015 2016
81Adjusted for share split, which has been effective since June 30, 2014; 2Final decision subject to Annual General Meeting approval; 3Calculated with 2016 year-end share price of 99.15€ per share
Sustainable dividend development
• Dividend of €1.20 per share proposed2 for 2016, reflecting 19.3% of EPS pre
• Dividend development in line with business performance and earnings progression
• Dividend yield3 of 1.21%
Dividend1 development 2011-2016 2016 dividend
2

STRATEGIC REVIEW
10
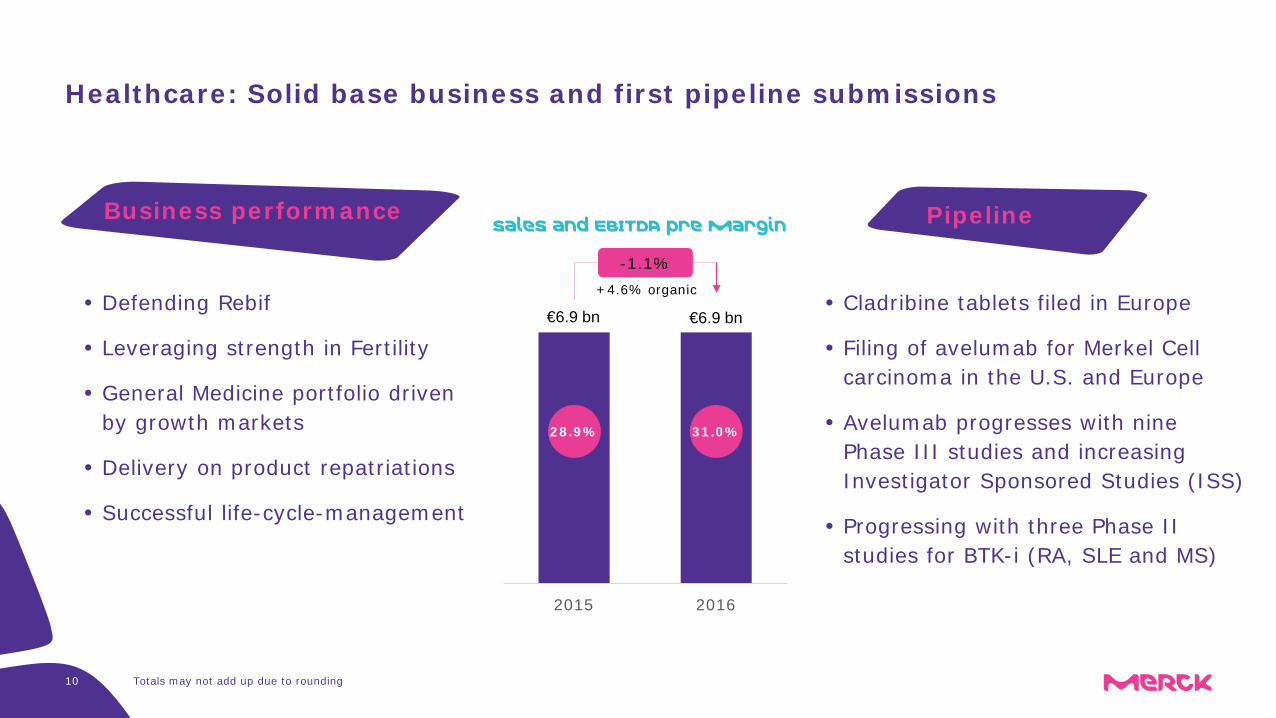
Healthcare: Solid base business and first pipeline submissions
Defending Rebif
Leveraging strength in Fertility
General Medicine portfolio driven by growth markets
Delivery on product repatriations
Successful life-cycle-management
2015 2016
-1.1%
€6.9 bn€6.9 bn
Sales and EBITDA pre margin
31.0%28.9%
+4.6% organic
Business performance Pipeline
Cladribine tablets filed in Europe
Filing of avelumab for Merkel Cell carcinoma in the U.S. and Europe
Avelumab progresses with ninePhase III studies and increasing Investigator Sponsored Studies (ISS)
Progressing with three Phase II studies for BTK-i (RA, SLE and MS)
Totals may not add up due to rounding
11
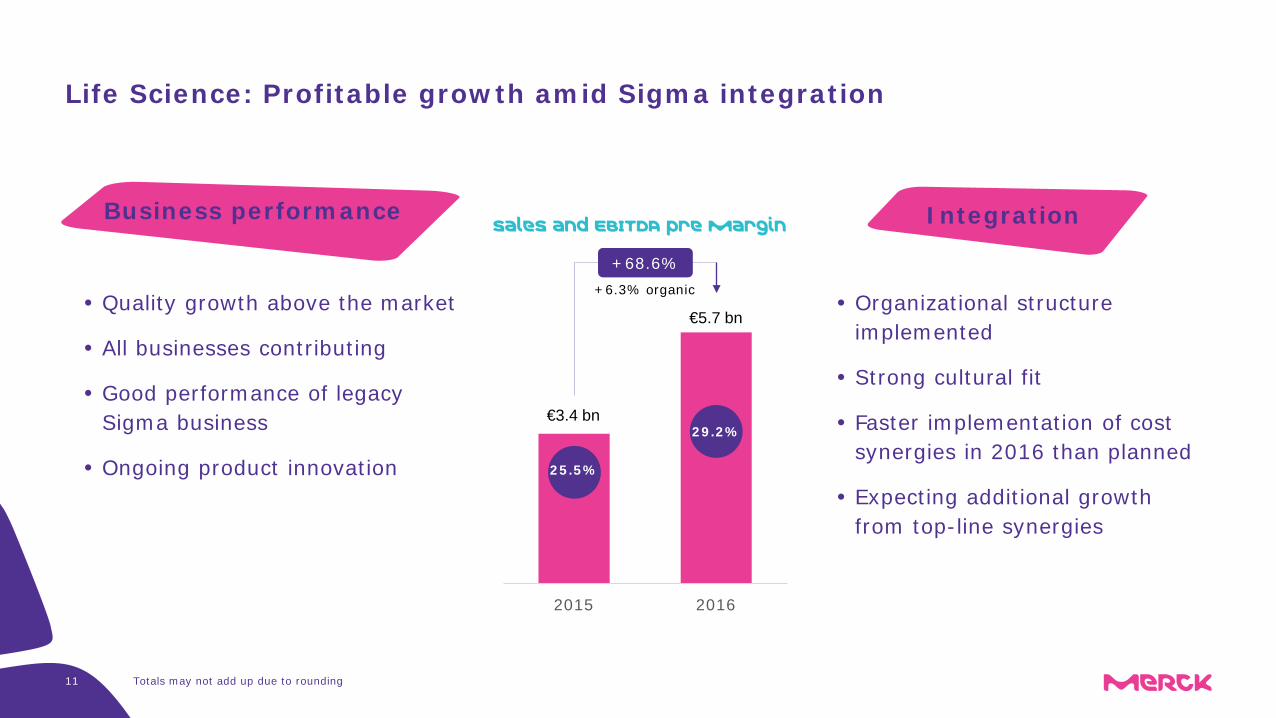
Life Science: Profitable growth amid Sigma integration
2015 2016
+68.6%
€5.7 bn
€3.4 bn29.2%
25.5%
Sales and EBITDA pre margin
+6.3% organic Quality growth above the market
All businesses contributing
Good performance of legacy Sigma business
Ongoing product innovation
Business performance Integration
Organizational structure implemented
Strong cultural fit
Faster implementation of cost synergies in 2016 than planned
Expecting additional growth from top-line synergies
Totals may not add up due to rounding
12
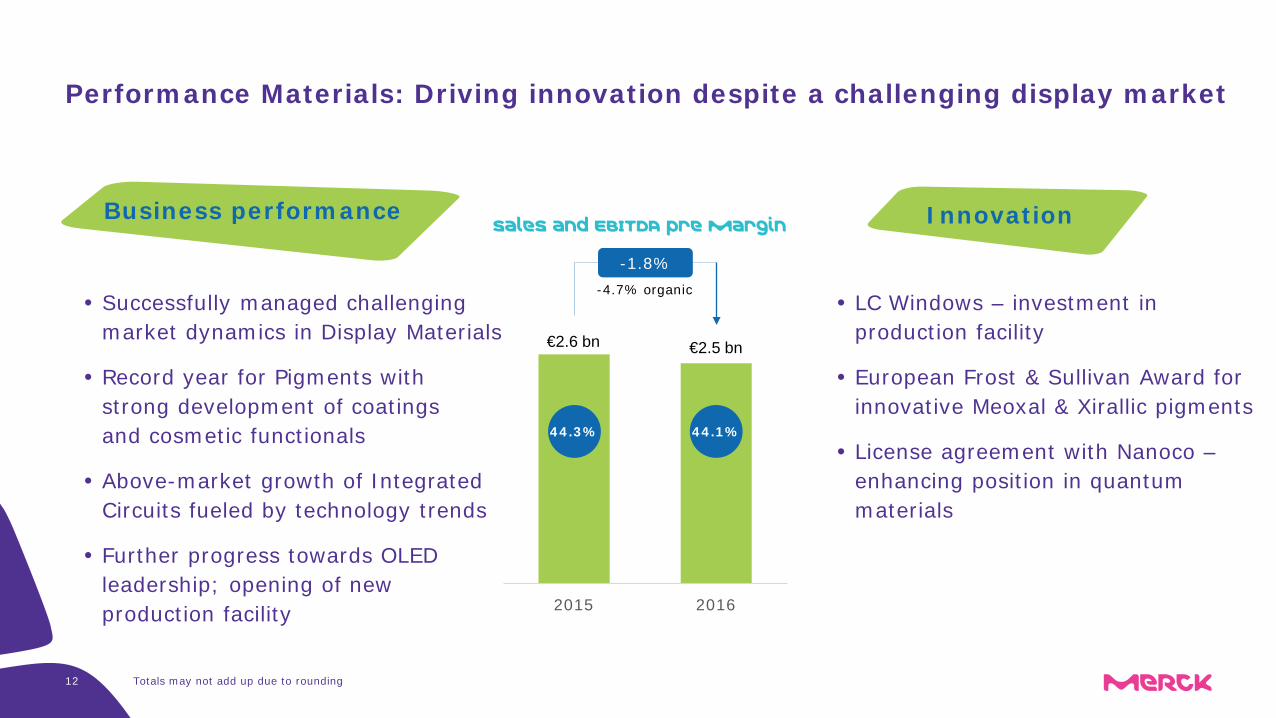
Performance Materials: Driving innovation despite a challenging display market
2015 2016
-1.8%
€2.5 bn€2.6 bn
44.1%44.3%
Sales and EBITDA pre margin
-4.7% organic Successfully managed challenging
market dynamics in Display Materials
Record year for Pigments with strong development of coatings and cosmetic functionals
Above-market growth of Integrated Circuits fueled by technology trends
Further progress towards OLED leadership; opening of new production facility
Business performance Innovation
LC Windows – investment in production facility
European Frost & Sullivan Award for innovative Meoxal & Xirallic pigments
License agreement with Nanoco –enhancing position in quantum materials
Totals may not add up due to rounding

FINANCIAL OVERVIEW
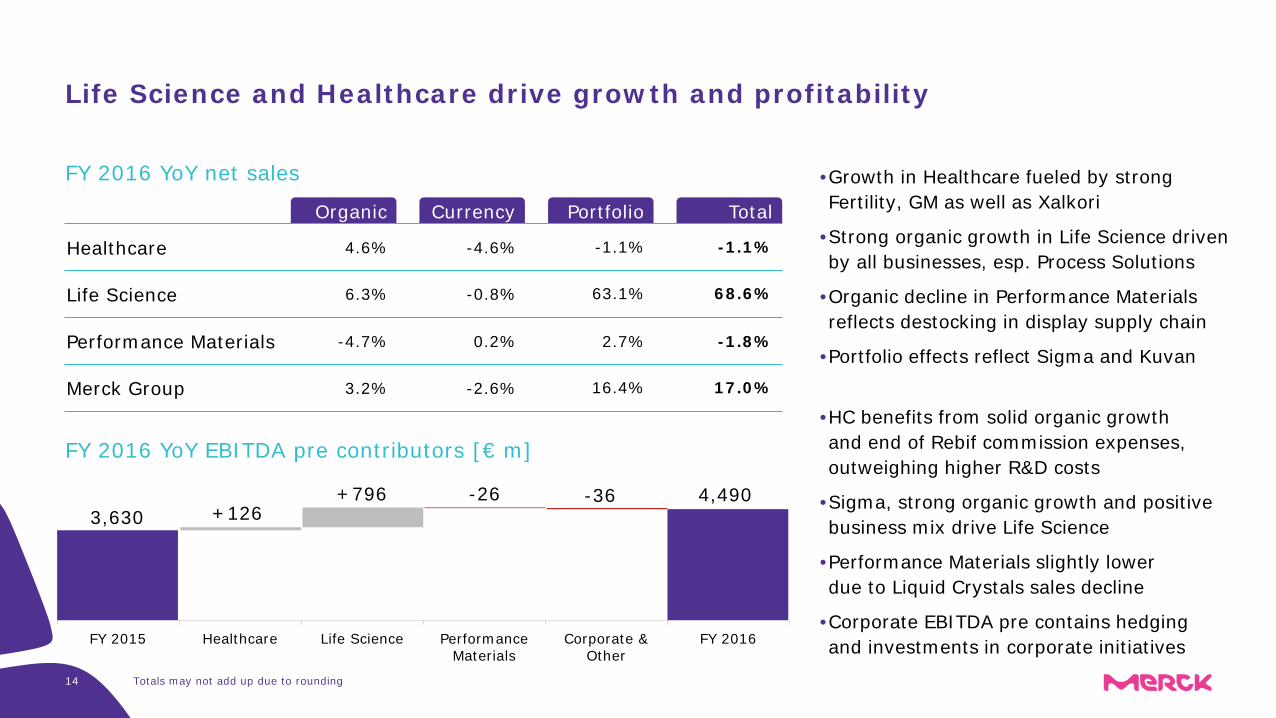
Organic Currency Portfolio Total
Totals may not add up due to rounding14
Life Science and Healthcare drive growth and profitability
•Growth in Healthcare fueled by strong Fertility, GM as well as Xalkori
•Strong organic growth in Life Science driven by all businesses, esp. Process Solutions
•Organic decline in Performance Materials reflects destocking in display supply chain
•Portfolio effects reflect Sigma and Kuvan
Healthcare 4.6% -4.6%
Life Science
Performance Materials
Merck Group
-1.1% -1.1%
6.3% -0.8% 63.1% 68.6%
-4.7% 0.2% 2.7% -1.8%
3.2% -2.6% 16.4% 17.0%
FY 2016 YoY net sales
FY 2015 Healthcare Life Science PerformanceMaterials
Corporate &Other
FY 2016
3,630 +126+796 -26 -36 4,490
•HC benefits from solid organic growth and end of Rebif commission expenses, outweighing higher R&D costs
•Sigma, strong organic growth and positive business mix drive Life Science
•Performance Materials slightly lower due to Liquid Crystals sales decline
•Corporate EBITDA pre contains hedging and investments in corporate initiatives
FY 2016 YoY EBITDA pre contributors [€ m]
Δ Dec. 31, 2015 Dec. 31, 2016
FY 2015 FY 2016 Δ
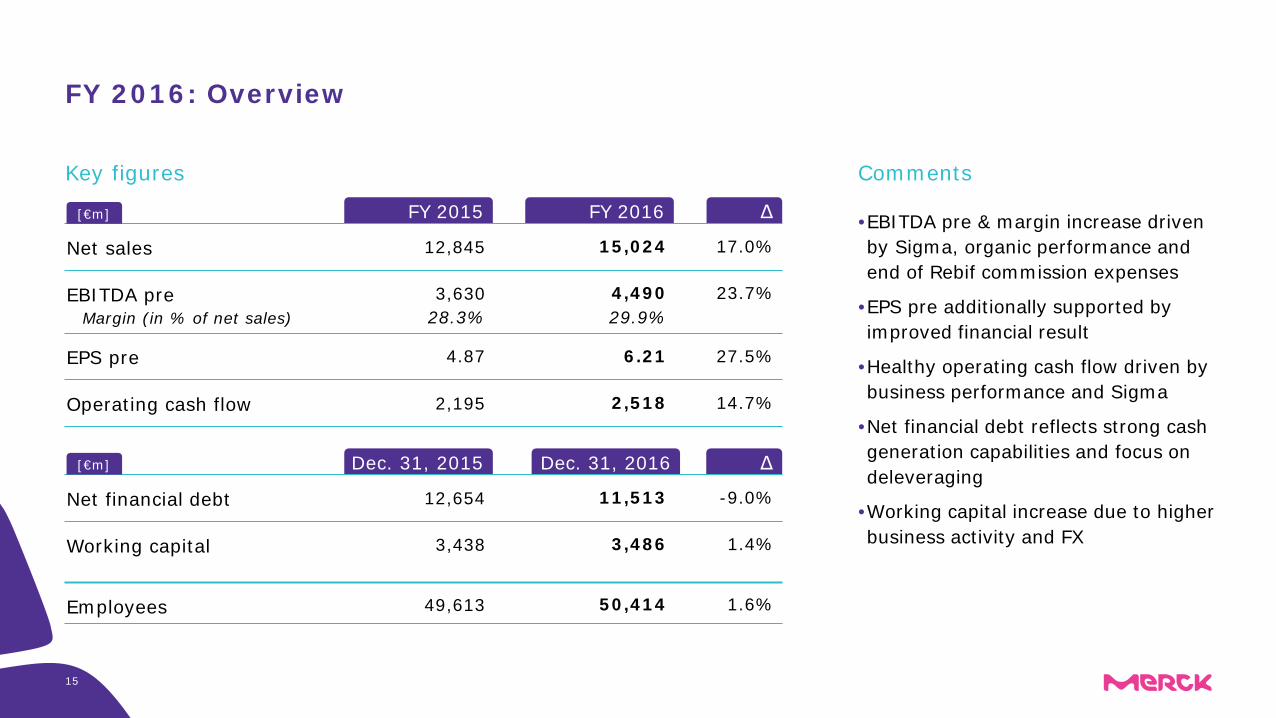
FY 2016: Overview
Net sales 12,845
EBITDA pre
EPS pre
Operating cash flow
15,024 17.0%
3,630 4,490 23.7%
4.87 6.21 27.5%
2,195 2,518 14.7%
•EBITDA pre & margin increase driven by Sigma, organic performance and end of Rebif commission expenses
•EPS pre additionally supported by improved financial result
•Healthy operating cash flow driven by business performance and Sigma
•Net financial debt reflects strong cash generation capabilities and focus on deleveraging
•Working capital increase due to higher business activity and FX
Comments
[€m]
Margin (in % of net sales) 28.3% 29.9%
Net financial debt 12,654
Working capital
Employees
3,438
49,613
Key figures
[€m]
11,513 -9.0%
50,414 1.6%
3,486 1.4%
15
FY 2015 FY 2016 Δ
16
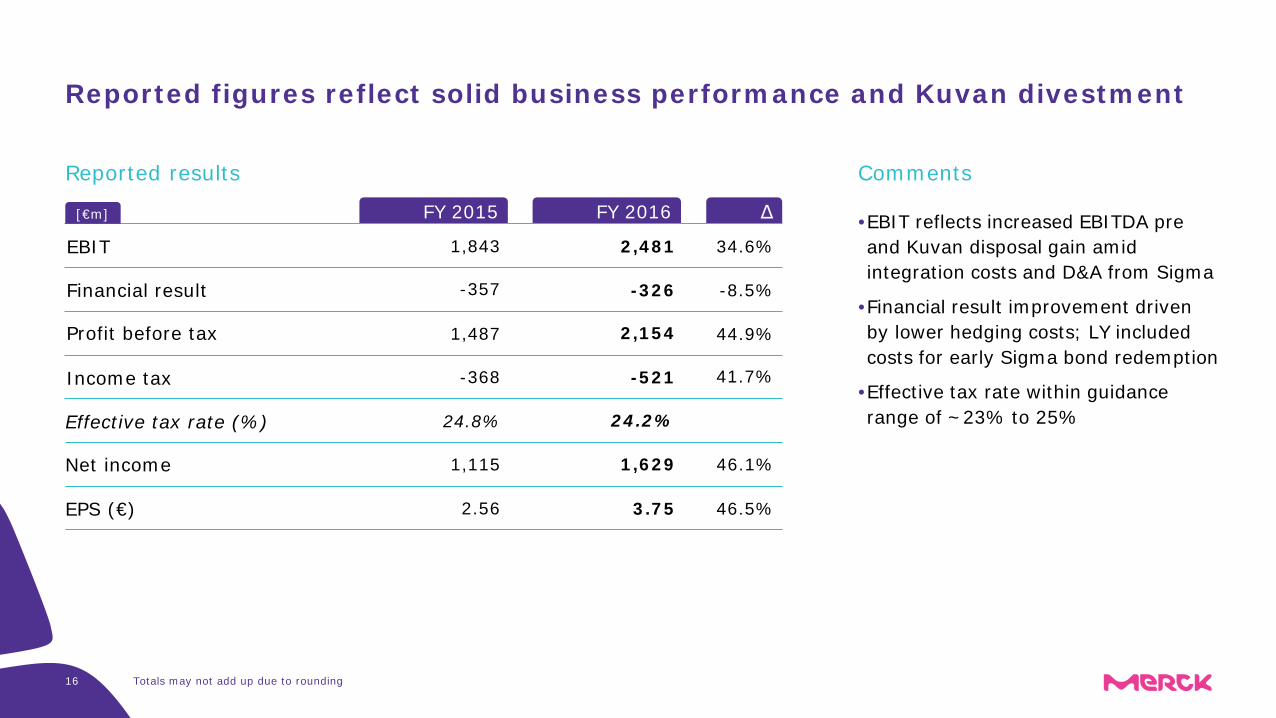
Reported figures reflect solid business performance and Kuvan divestment
EBIT 1,843 2,481 34.6%•EBIT reflects increased EBITDA pre and Kuvan disposal gain amid integration costs and D&A from Sigma
•Financial result improvement driven by lower hedging costs; LY included costs for early Sigma bond redemption
•Effective tax rate within guidance range of ~23% to 25%
Comments
[€m]
Financial result
Profit before tax
Income tax
Effective tax rate (%)
Net income
EPS (€)
24.8% 24.2%
1,115 1,629 46.1%
2.56 3.75 46.5%
-357 -326 -8.5%
1,487 2,154 44.9%
-368 -521 41.7%
Reported results
Totals may not add up due to rounding
FY 2015 FY 2016
17
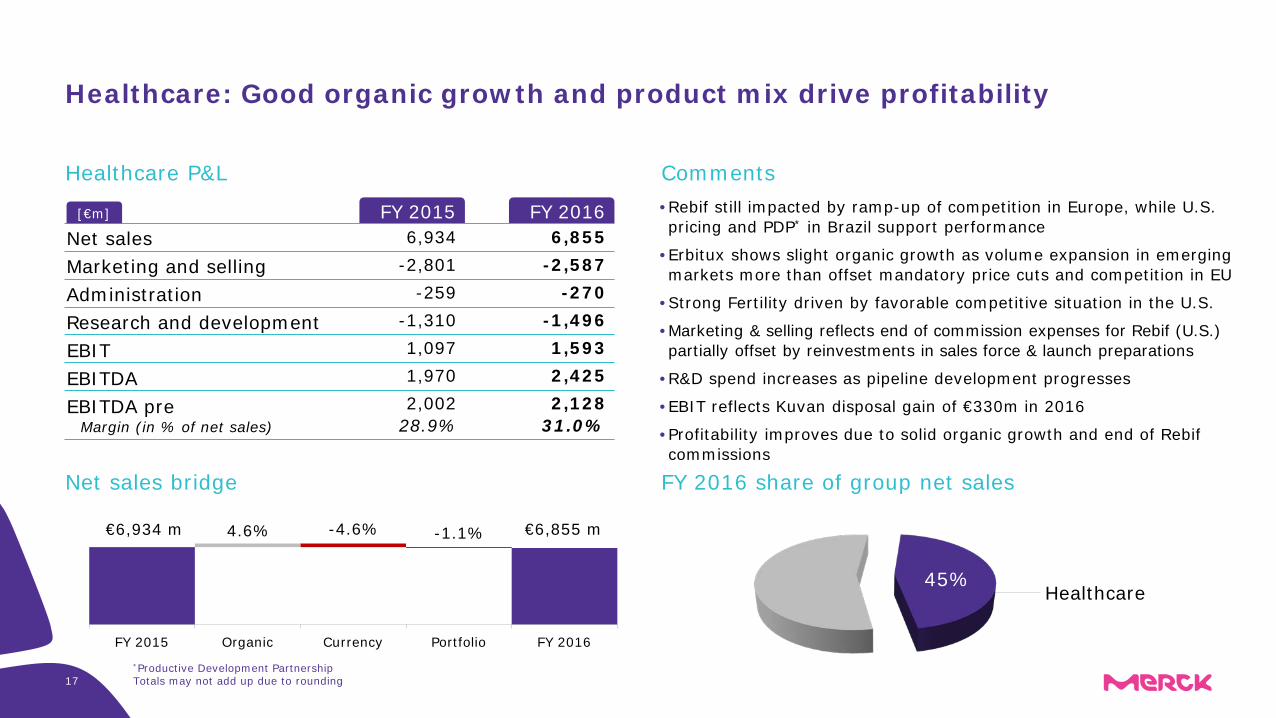
Healthcare: Good organic growth and product mix drive profitability
• Rebif still impacted by ramp-up of competition in Europe, while U.S. pricing and PDP* in Brazil support performance
• Erbitux shows slight organic growth as volume expansion in emerging markets more than offset mandatory price cuts and competition in EU
• Strong Fertility driven by favorable competitive situation in the U.S.
• Marketing & selling reflects end of commission expenses for Rebif (U.S.) partially offset by reinvestments in sales force & launch preparations
• R&D spend increases as pipeline development progresses
• EBIT reflects Kuvan disposal gain of €330m in 2016
• Profitability improves due to solid organic growth and end of Rebif commissions
Net sales 6,855
Marketing and sellingAdministrationResearch and development
-270
1,593
2,128
Healthcare P&L
Net sales bridge
EBITEBITDAEBITDA pre
-2,587
-1,496
2,425
6,934
-259
1,097
2,002
-2,801
-1,310
1,970
Margin (in % of net sales)
FY 2015 Organic Currency Portfolio FY 2016
4.6% -4.6% -1.1%€6,934 m €6,855 m
Comments
FY 2016 share of group net sales
31.0%28.9%
[€m]
45%Healthcare
*Productive Development PartnershipTotals may not add up due to rounding
18
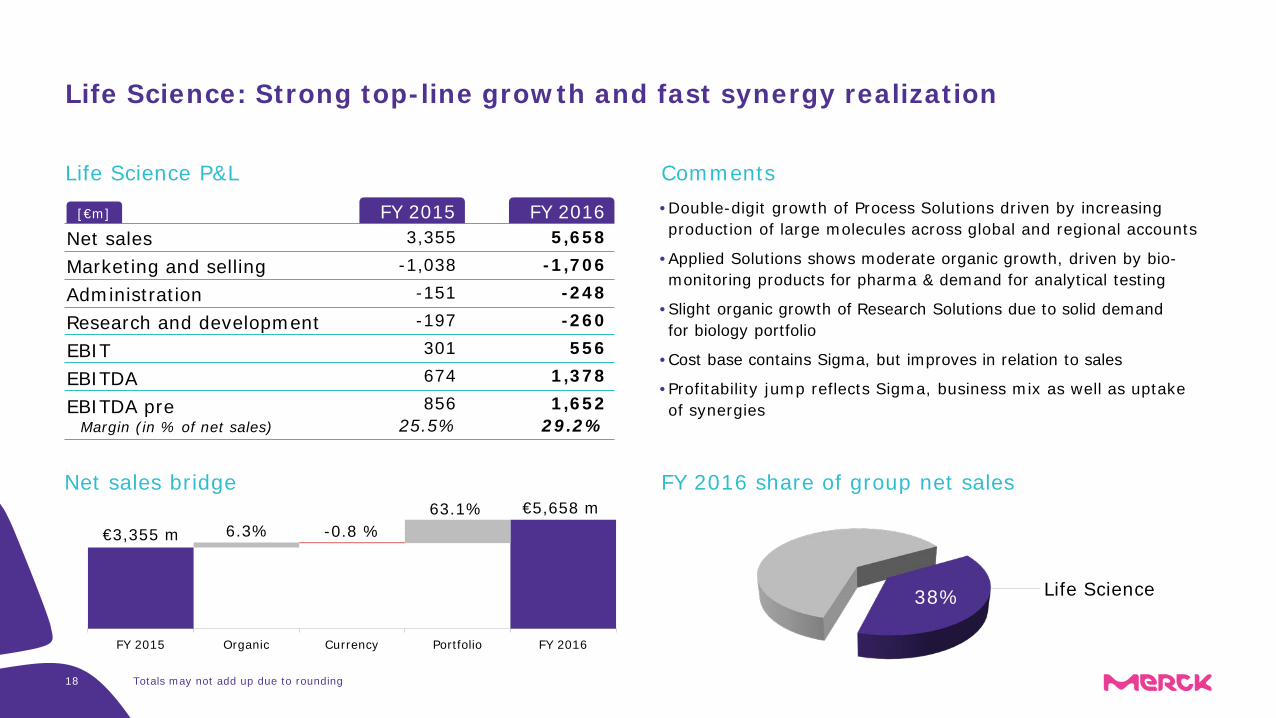
Life Science: Strong top-line growth and fast synergy realization
• Double-digit growth of Process Solutions driven by increasing production of large molecules across global and regional accounts
• Applied Solutions shows moderate organic growth, driven by bio-monitoring products for pharma & demand for analytical testing
• Slight organic growth of Research Solutions due to solid demand for biology portfolio
• Cost base contains Sigma, but improves in relation to sales
• Profitability jump reflects Sigma, business mix as well as uptake of synergies
Net sales 5,658
Marketing and sellingAdministrationResearch and development
-248
556
1,652
Life Science P&L
Net sales bridge
EBITEBITDAEBITDA pre
-1,706
-260
1,378
3,355
-151
301
856
-1,038
-197
674
Margin (in % of net sales)
Comments
FY 2016 share of group net sales
29.2%25.5%
FY 2015 Organic Currency Portfolio FY 2016
6.3% -0.8 %63.1%
€3,355 m€5,658 m
Life Science38%
FY 2015 FY 2016[€m]
Totals may not add up due to rounding
19
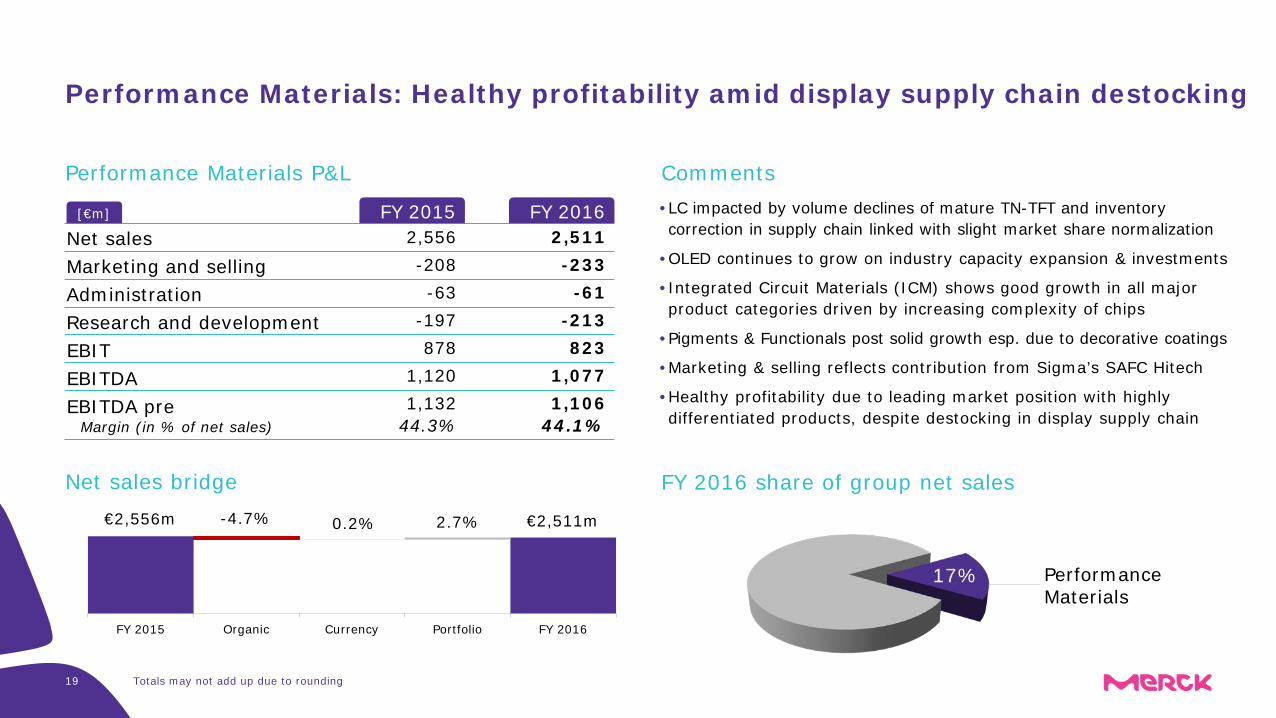
Performance Materials: Healthy profitability amid display supply chain destocking
• LC impacted by volume declines of mature TN-TFT and inventory correction in supply chain linked with slight market share normalization
• OLED continues to grow on industry capacity expansion & investments
• Integrated Circuit Materials (ICM) shows good growth in all major product categories driven by increasing complexity of chips
• Pigments & Functionals post solid growth esp. due to decorative coatings
• Marketing & selling reflects contribution from Sigma’s SAFC Hitech
• Healthy profitability due to leading market position with highly differentiated products, despite destocking in display supply chain
Net sales 2,511
Marketing and sellingAdministrationResearch and development
-61
823
1,106
Performance Materials P&L
Net sales bridge
EBITEBITDAEBITDA pre
-233
-213
1,077
2,556
-63
878
1,132
-208
-197
1,120
Margin (in % of net sales)
Comments
FY 2016 share of group net sales
44.1%44.3%
FY 2015 Organic Currency Portfolio FY 2016
-4.7% 0.2% 2.7%€2,556m €2,511m
Performance Materials
17%
FY 2015 FY 2016[€m]
Totals may not add up due to rounding
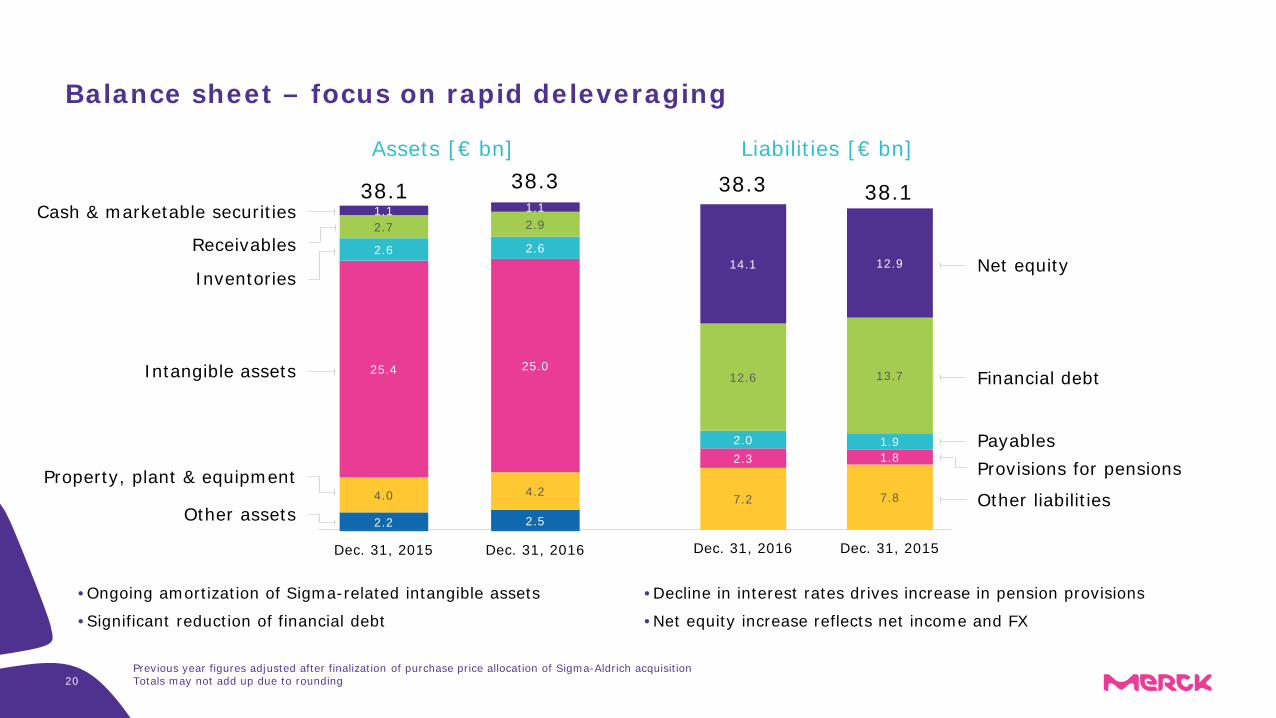
7.87.2
1.82.31.92.0
13.712.6
12.914.1
Dec. 31, 2015Dec. 31, 2016
Previous year figures adjusted after finalization of purchase price allocation of Sigma-Aldrich acquisitionTotals may not add up due to rounding20
Balance sheet – focus on rapid deleveraging
• Ongoing amortization of Sigma-related intangible assets
• Significant reduction of financial debt
• Decline in interest rates drives increase in pension provisions
• Net equity increase reflects net income and FX
2.2 2.5
4.0 4.2
25.4 25.0
2.6 2.6
2.7 2.91.1 1.1
Dec. 31, 2015 Dec. 31, 2016
Intangible assets
Inventories
Other assets
Property, plant & equipment
Receivables
Cash & marketable securities
Net equity
38.1 38.1
Assets [€ bn] Liabilities [€ bn]
Financial debt
Provisions for pensions
Other liabilities
Payables
38.3 38.3

OUTLOOK AND GUIDANCE
22
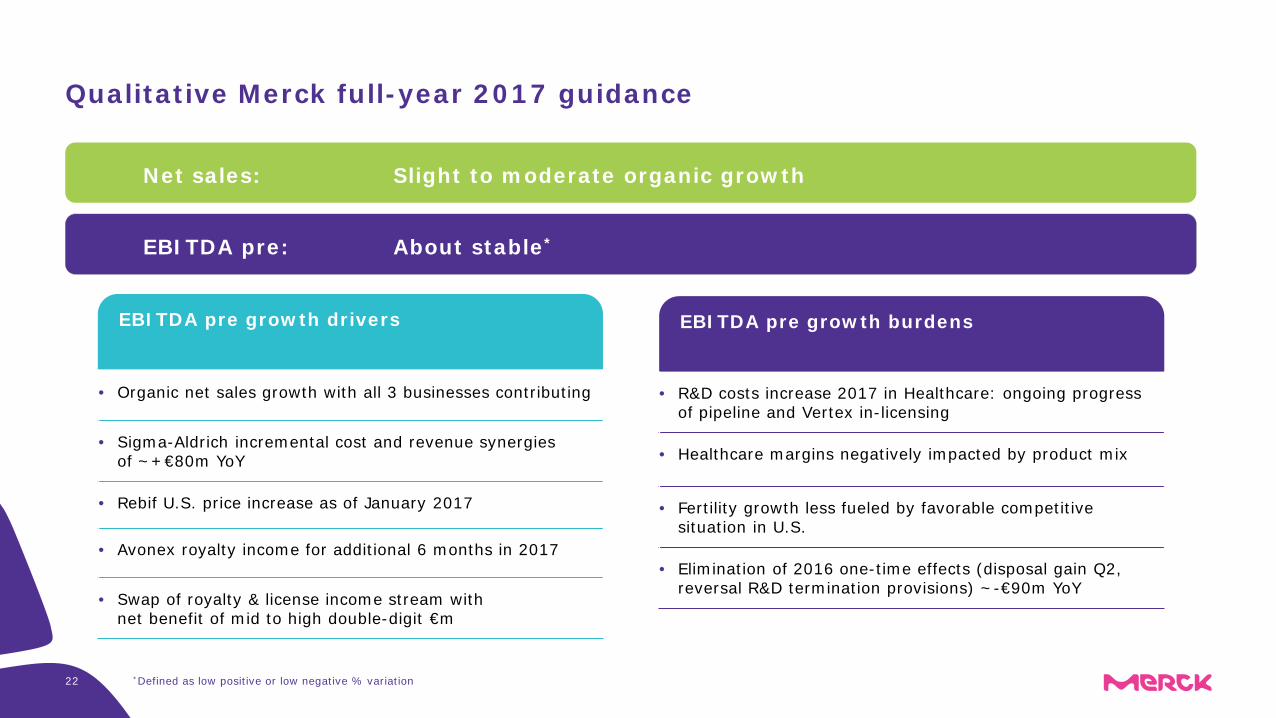
Qualitative Merck full-year 2017 guidance
Net sales: Slight to moderate organic growth
EBITDA pre: About stable*
EBITDA pre growth burdensEBITDA pre growth drivers
• Organic net sales growth with all 3 businesses contributing
• Sigma-Aldrich incremental cost and revenue synergies of ~+€80m YoY
• Rebif U.S. price increase as of January 2017
• Avonex royalty income for additional 6 months in 2017
• Swap of royalty & license income stream with net benefit of mid to high double-digit €m
• R&D costs increase 2017 in Healthcare: ongoing progress of pipeline and Vertex in-licensing
• Healthcare margins negatively impacted by product mix
• Fertility growth less fueled by favorable competitive situation in U.S.
• Elimination of 2016 one-time effects (disposal gain Q2, reversal R&D termination provisions) ~-€90m YoY
*Defined as low positive or low negative % variation
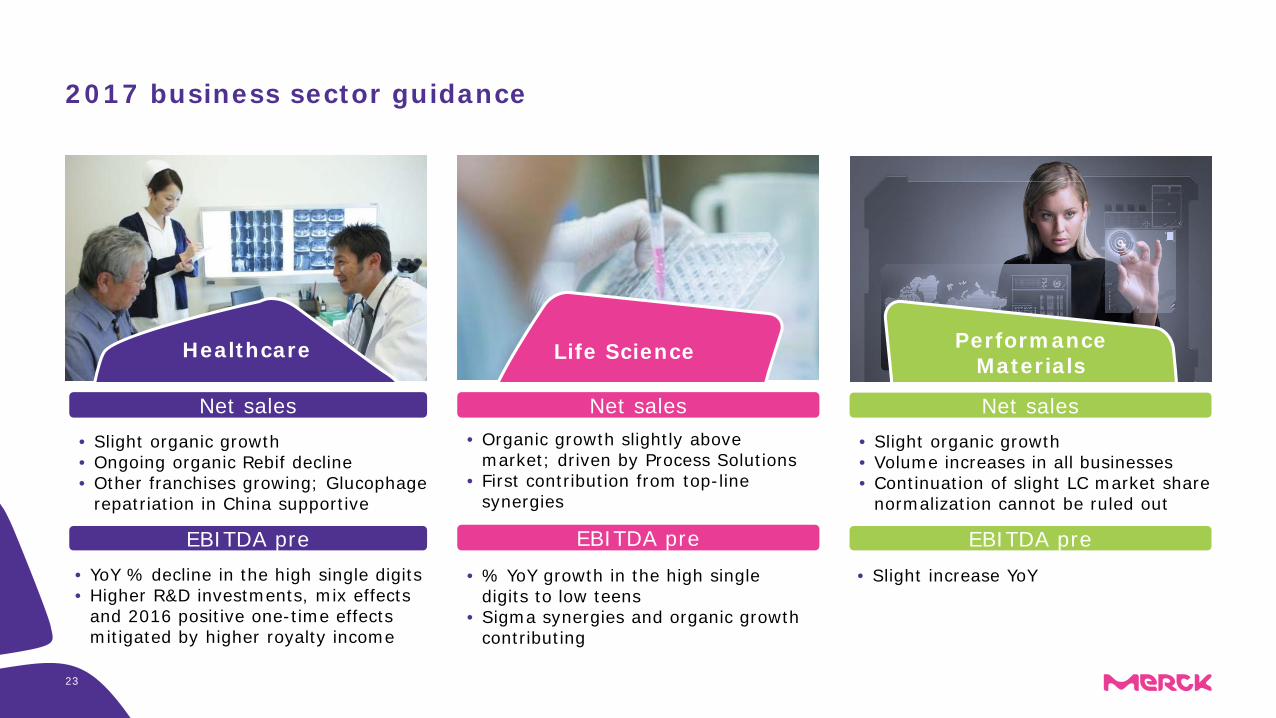
• Slight increase YoY• % YoY growth in the high single digits to low teens
• Sigma synergies and organic growth contributing
• YoY % decline in the high single digits• Higher R&D investments, mix effects
and 2016 positive one-time effects mitigated by higher royalty income
2017 business sector guidance
EBITDA pre
Life Science PerformanceMaterials
Healthcare
Net sales
EBITDA pre
Net sales
EBITDA pre
Net sales• Organic growth slightly above
market; driven by Process Solutions• First contribution from top-line
synergies
• Slight organic growth• Volume increases in all businesses• Continuation of slight LC market share
normalization cannot be ruled out
• Slight organic growth• Ongoing organic Rebif decline• Other franchises growing; Glucophage
repatriation in China supportive
23


APPENDIX

Additional financial guidance 2017
Further financial details
Corporate & Other EBITDA pre
Effective tax rate
Capex on PPE
Hedging/USD assumption
2017 Ø EUR/USD assumption
2017 hedge ratio ~50% at EUR/USD ~ 1.11 to 1.12
~ 1.06 – 1.10
~ -€350 – -380m
~ 23% to 25%
~ €850 – 900 m
Interest result ~ -€250 – -260 m
26
27
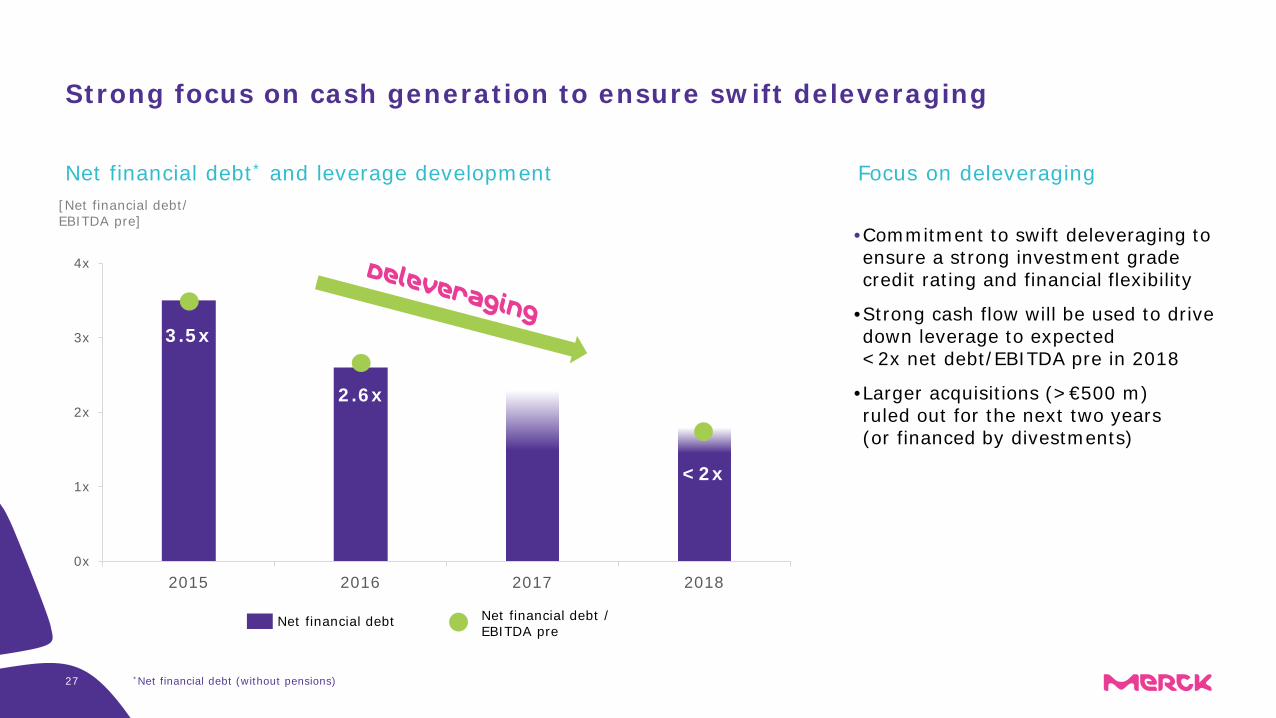
Strong focus on cash generation to ensure swift deleveraging
0x
1x
2x
3x
4x
2015 2016 2017 2018
[Net financial debt/EBITDA pre]
•Commitment to swift deleveraging to ensure a strong investment grade credit rating and financial flexibility
•Strong cash flow will be used to drive down leverage to expected <2x net debt/EBITDA pre in 2018
•Larger acquisitions (>€500 m) ruled out for the next two years (or financed by divestments)
Focus on deleveragingNet financial debt* and leverage development
3.5x
<2x
Net financial debt Net financial debt /EBITDA pre
2.6x
*Net financial debt (without pensions)
28
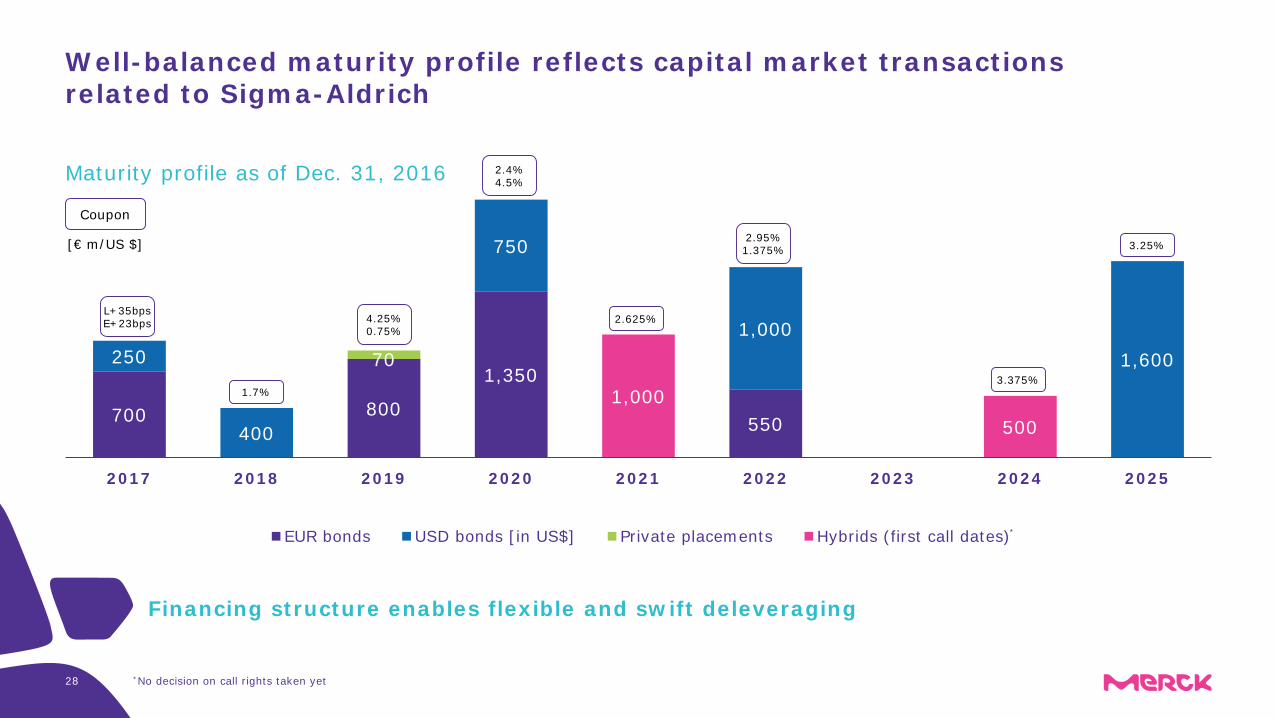
Well-balanced maturity profile reflects capital market transactions related to Sigma-Aldrich
Financing structure enables flexible and swift deleveraging
700 800
1,350
550
250
400
750
1,0001,60070
1,000500
2017 2018 2019 2020 2021 2022 2023 2024 2025
EUR bonds USD bonds [in US$] Private placements Hybrids (first call dates)
L+35bpsE+23bps
1.7%
2.4%4.5%
2.625%
3.375%
4.25%0.75%
2.95%1.375% 3.25%
Coupon
Maturity profile as of Dec. 31, 2016
[€ m/US $]
*No decision on call rights taken yet
*
Totals may not add up due to rounding29
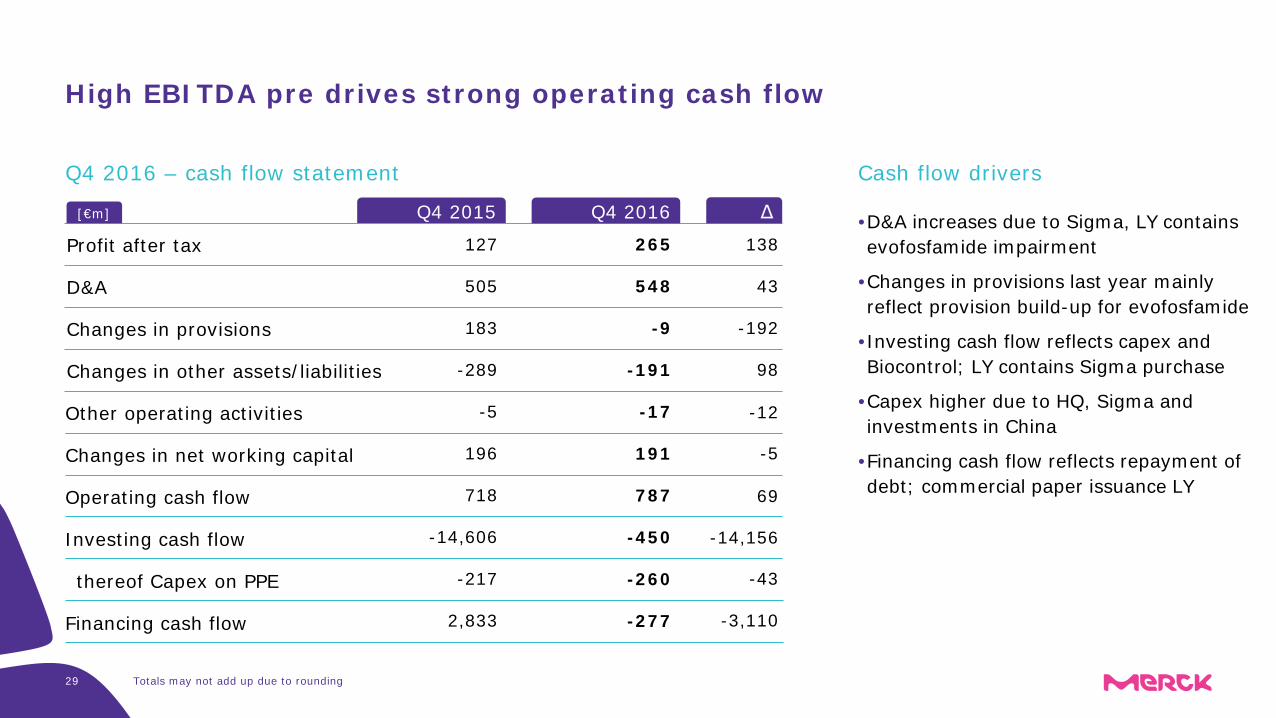
High EBITDA pre drives strong operating cash flow
Profit after tax
Q4 2015
127
Q4 2016 Δ
265 138•D&A increases due to Sigma, LY contains evofosfamide impairment
•Changes in provisions last year mainly reflect provision build-up for evofosfamide
•Investing cash flow reflects capex and Biocontrol; LY contains Sigma purchase
•Capex higher due to HQ, Sigma and investments in China
•Financing cash flow reflects repayment of debt; commercial paper issuance LY
Cash flow drivers
D&A
Changes in provisions
Changes in other assets/liabilities
Other operating activities
Changes in net working capital
Operating cash flow
-5 -17
196 191 -5
718 787 69
505 548 43
183 -9 -192
-289 -191 98
Investing cash flow
thereof Capex on PPE
Financing cash flow
-14,606
-217
2,833
-450
-260 -43
-277 -3,110
[€m]
Q4 2016 – cash flow statement
-12
-14,156
Organic Currency Portfolio Total
Totals may not add up due to rounding30
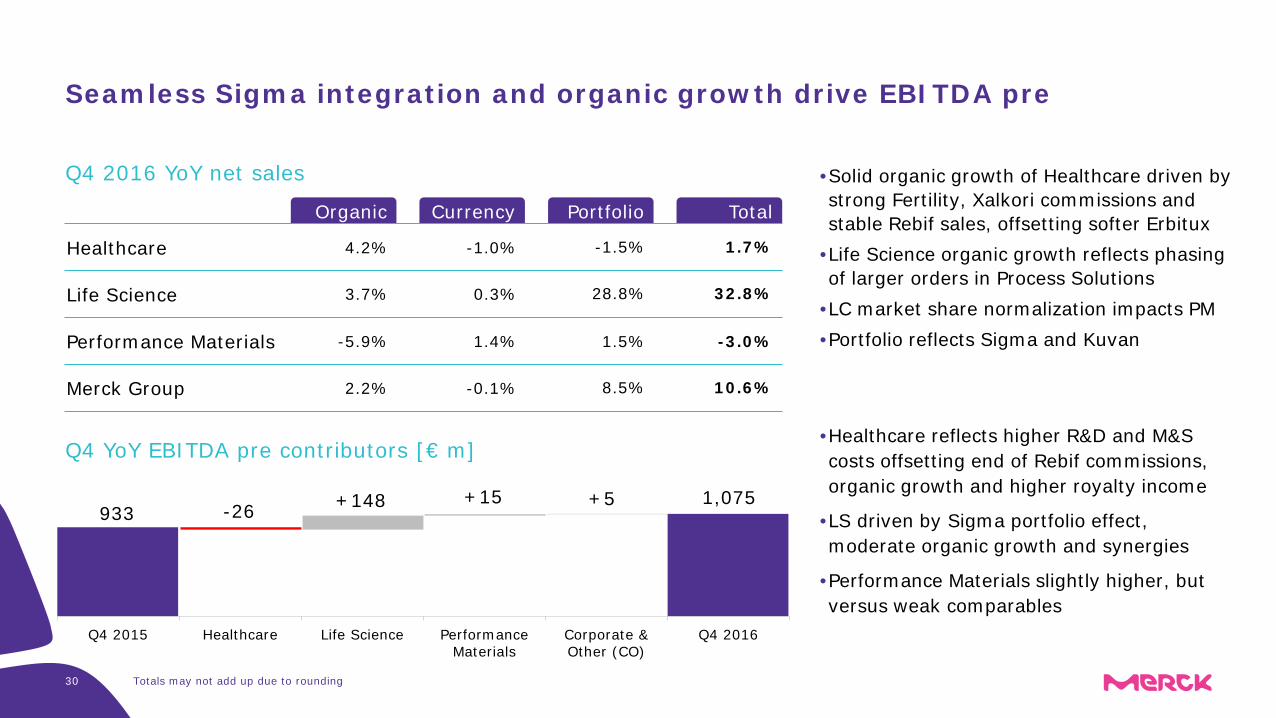
Seamless Sigma integration and organic growth drive EBITDA pre
•Solid organic growth of Healthcare driven by strong Fertility, Xalkori commissions and stable Rebif sales, offsetting softer Erbitux
•Life Science organic growth reflects phasing of larger orders in Process Solutions
•LC market share normalization impacts PM•Portfolio reflects Sigma and Kuvan
Healthcare 4.2% -1.0%
Life Science
Performance Materials
Merck Group
-1.5% 1.7%
3.7% 0.3% 28.8% 32.8%
-5.9% 1.4% 1.5% -3.0%
2.2% -0.1% 8.5% 10.6%
Q4 2016 YoY net sales
Q4 YoY EBITDA pre contributors [€ m]
Q4 2015 Healthcare Life Science PerformanceMaterials
Corporate &Other (CO)
Q4 2016
933 -26 +148 +15 +5 1,075
•Healthcare reflects higher R&D and M&S costs offsetting end of Rebif commissions, organic growth and higher royalty income
•LS driven by Sigma portfolio effect, moderate organic growth and synergies
•Performance Materials slightly higher, but versus weak comparables
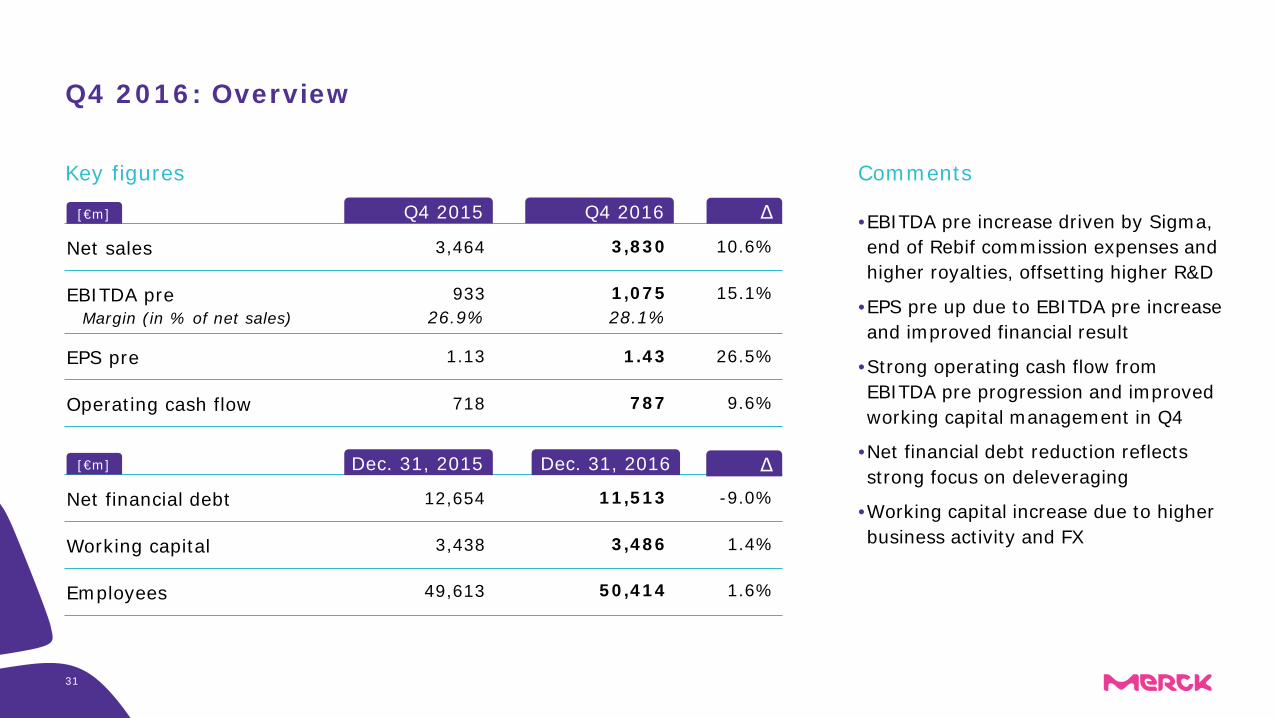
Q4 2016: Overview
Net sales 3,464
EBITDA pre
EPS pre
Operating cash flow
3,830 10.6%
933 1,075 15.1%
1.13 1.43 26.5%
718 787 9.6%
•EBITDA pre increase driven by Sigma,end of Rebif commission expenses and higher royalties, offsetting higher R&D
•EPS pre up due to EBITDA pre increaseand improved financial result
•Strong operating cash flow from EBITDA pre progression and improved working capital management in Q4
•Net financial debt reduction reflects strong focus on deleveraging
•Working capital increase due to higher business activity and FX
Comments
[€m]
Margin (in % of net sales) 26.9% 28.1%
Net financial debt 12,654
Working capital
Employees
Δ
3,438
49,613
Dec. 31, 2015
Key figures
[€m] Dec. 31, 2016
11,513 -9.0%
3,486 1.4%
Q4 2015 Q4 2016 Δ
50,414 1.6%
31
[€m] Q4 2015 Q4 2016 Δ
32
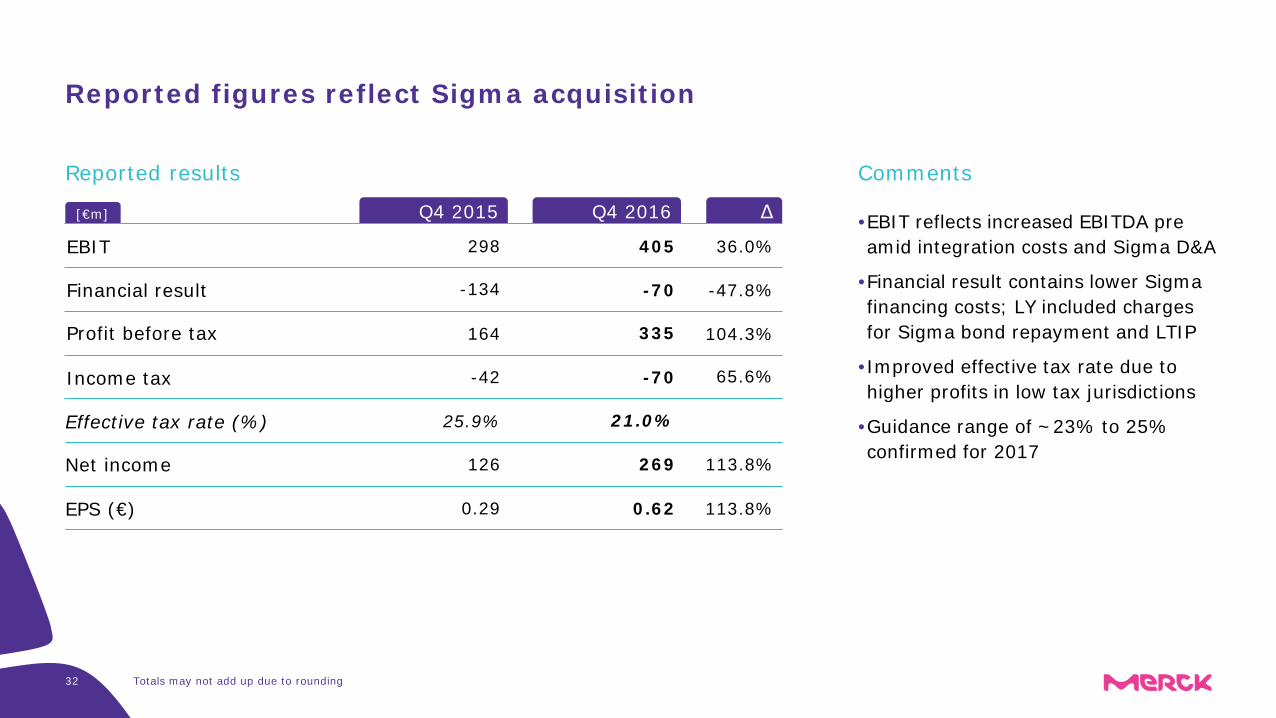
Reported figures reflect Sigma acquisition
EBIT 298 405 36.0%•EBIT reflects increased EBITDA pre amid integration costs and Sigma D&A
•Financial result contains lower Sigma financing costs; LY included charges for Sigma bond repayment and LTIP
•Improved effective tax rate due to higher profits in low tax jurisdictions
•Guidance range of ~23% to 25%confirmed for 2017
Comments
Financial result
Profit before tax
Income tax
Effective tax rate (%)
Net income
EPS (€)
25.9% 21.0%
126 269 113.8%
0.29 0.62 113.8%
-134 -70 -47.8%
164 335 104.3%
-42 -70 65.6%
Reported results
Totals may not add up due to rounding
[€m] Q4 2015 Q4 2016
33
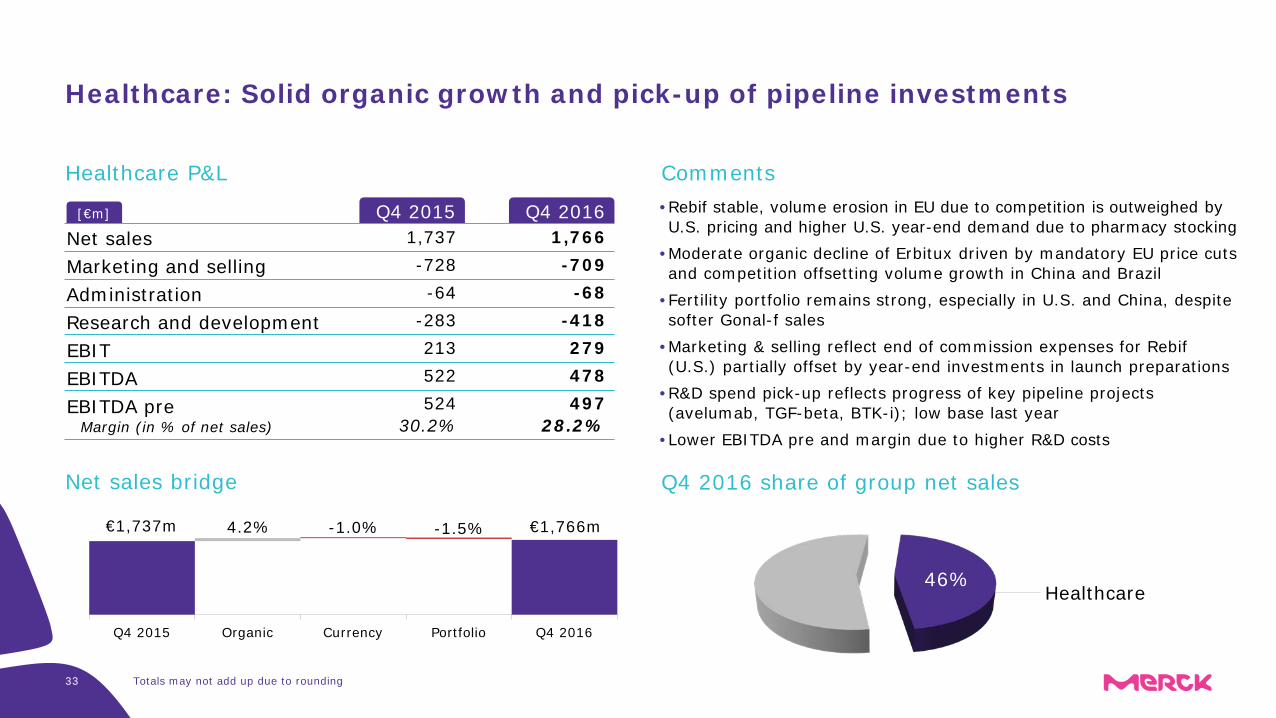
Healthcare: Solid organic growth and pick-up of pipeline investments
• Rebif stable, volume erosion in EU due to competition is outweighed by U.S. pricing and higher U.S. year-end demand due to pharmacy stocking
• Moderate organic decline of Erbitux driven by mandatory EU price cuts and competition offsetting volume growth in China and Brazil
• Fertility portfolio remains strong, especially in U.S. and China, despite softer Gonal-f sales
• Marketing & selling reflect end of commission expenses for Rebif (U.S.) partially offset by year-end investments in launch preparations
• R&D spend pick-up reflects progress of key pipeline projects (avelumab, TGF-beta, BTK-i); low base last year
• Lower EBITDA pre and margin due to higher R&D costs
Net sales 1,766
Marketing and sellingAdministrationResearch and development
-68
279
497
Healthcare P&L
Net sales bridge
EBITEBITDAEBITDA pre
-709
-418
478
1,737
-64
213
524
-728
-283
522
Margin (in % of net sales)
Q4 2015 Organic Currency Portfolio Q4 2016
4.2% -1.0% -1.5%€1,737m €1,766m
Comments
Q4 2016 share of group net sales
28.2%30.2%
46%Healthcare
Totals may not add up due to rounding
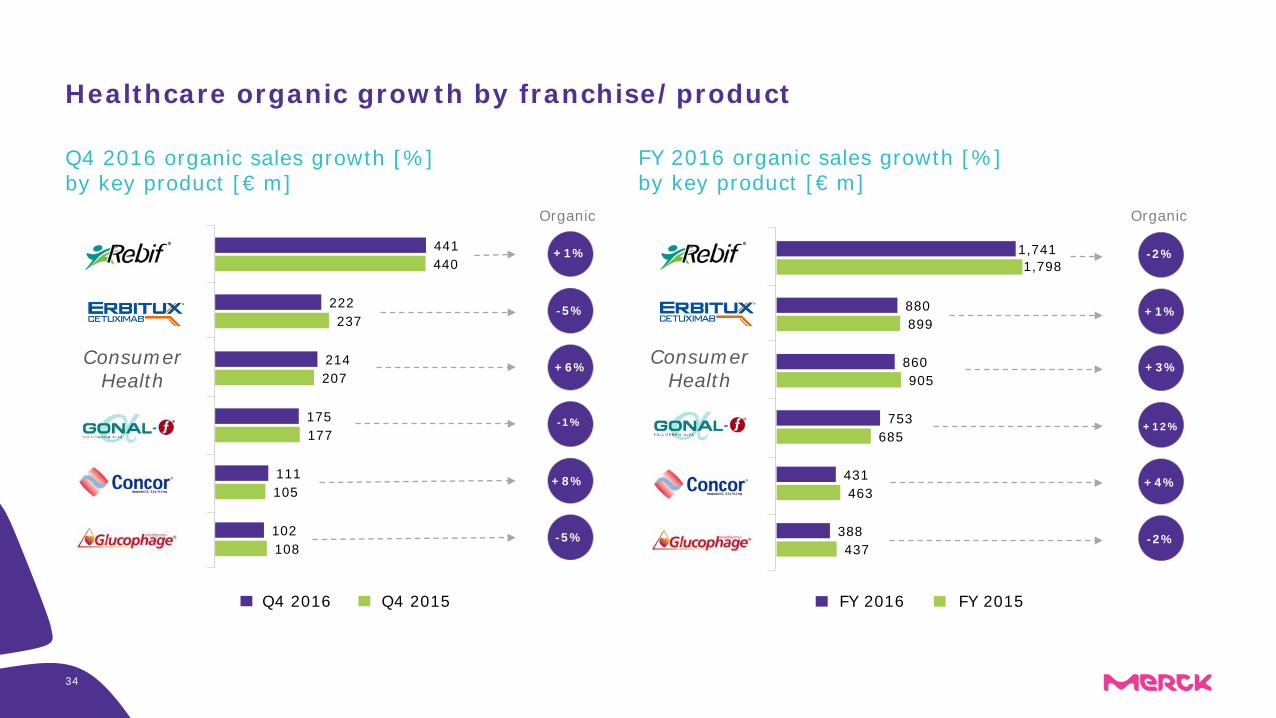
Healthcare organic growth by franchise/product
Q4 2016 organic sales growth [%] by key product [€ m]
FY 2016 organic sales growth [%] by key product [€ m]
Q4 2016 Q4 2015
108
105
177
207
237
440
102
111
175
214
222
441 +1%
-5%
+6%
-1%
+8%
-5%
Consumer Health
FY 2016 FY 2015
437
463
685
905
899
1,798
388
431
753
860
880
1,741 -2%
+1%
+3%
+12%
+4%
-2%
Consumer Health
Organic Organic
34
100
120
140
160
180
Q4 2015 Q1 2016 Q2 2016 Q3 2016 Q4 2016
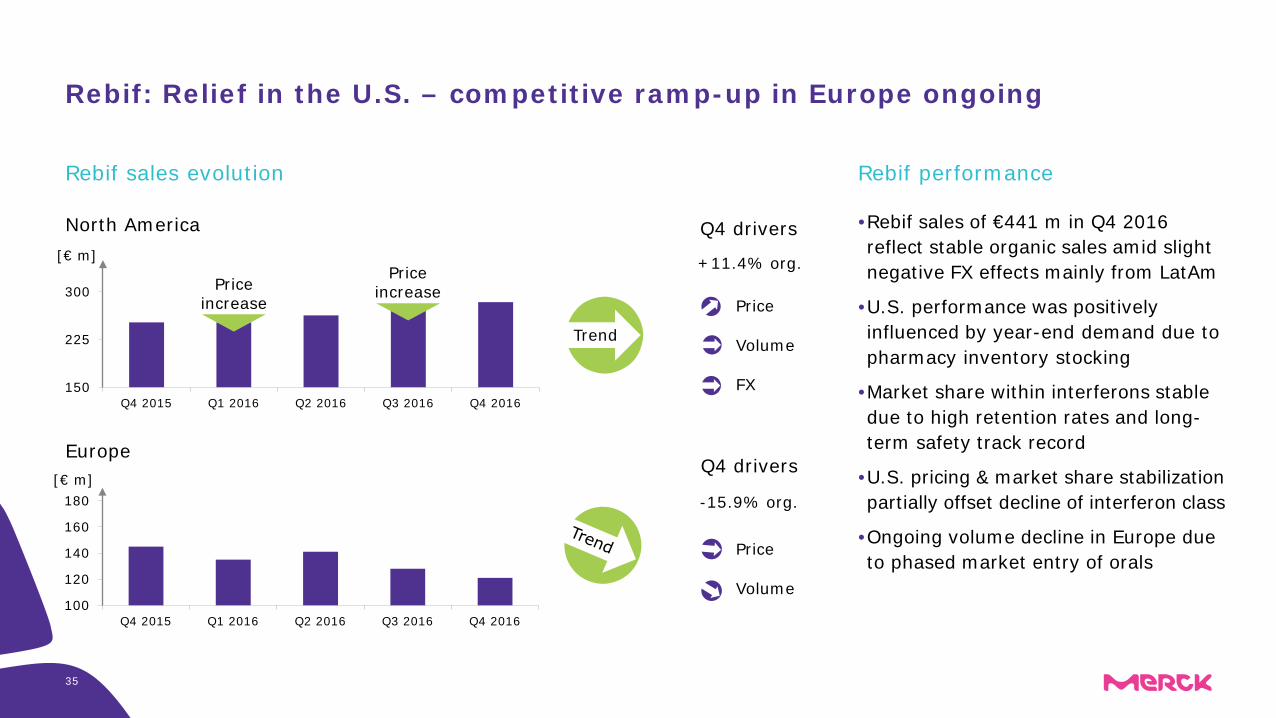
Rebif: Relief in the U.S. – competitive ramp-up in Europe ongoing
Europe
Price
Volume
FX
Price
Volume
+11.4% org.
-15.9% org.
150
225
300
Q4 2015 Q1 2016 Q2 2016 Q3 2016 Q4 2016
Price increase
North America •Rebif sales of €441 m in Q4 2016 reflect stable organic sales amid slight negative FX effects mainly from LatAm
•U.S. performance was positively influenced by year-end demand due to pharmacy inventory stocking
•Market share within interferons stable due to high retention rates and long-term safety track record
•U.S. pricing & market share stabilization partially offset decline of interferon class
•Ongoing volume decline in Europe due to phased market entry of orals
Rebif performanceRebif sales evolution
Q4 drivers
Trend
Q4 drivers[€ m]
[€ m]
Price increase
35
0
50
100
150
200
250
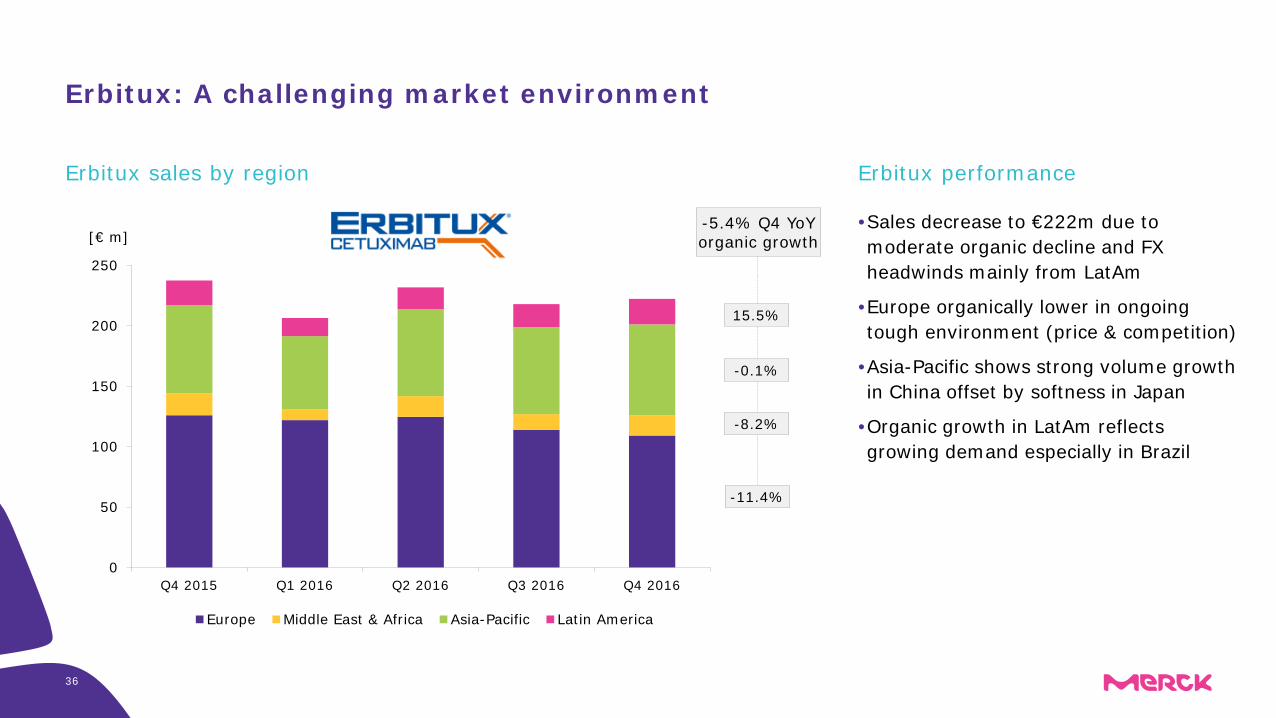
Q4 2015 Q1 2016 Q2 2016 Q3 2016 Q4 2016
Europe Middle East & Africa Asia-Pacific Latin America
Erbitux: A challenging market environment
•Sales decrease to €222m due to moderate organic decline and FX headwinds mainly from LatAm
•Europe organically lower in ongoing tough environment (price & competition)
•Asia-Pacific shows strong volume growth in China offset by softness in Japan
•Organic growth in LatAm reflects growing demand especially in Brazil
Erbitux performanceErbitux sales by region
[€ m]-5.4% Q4 YoY organic growth
-11.4%
-8.2%
-0.1%
15.5%
36
37
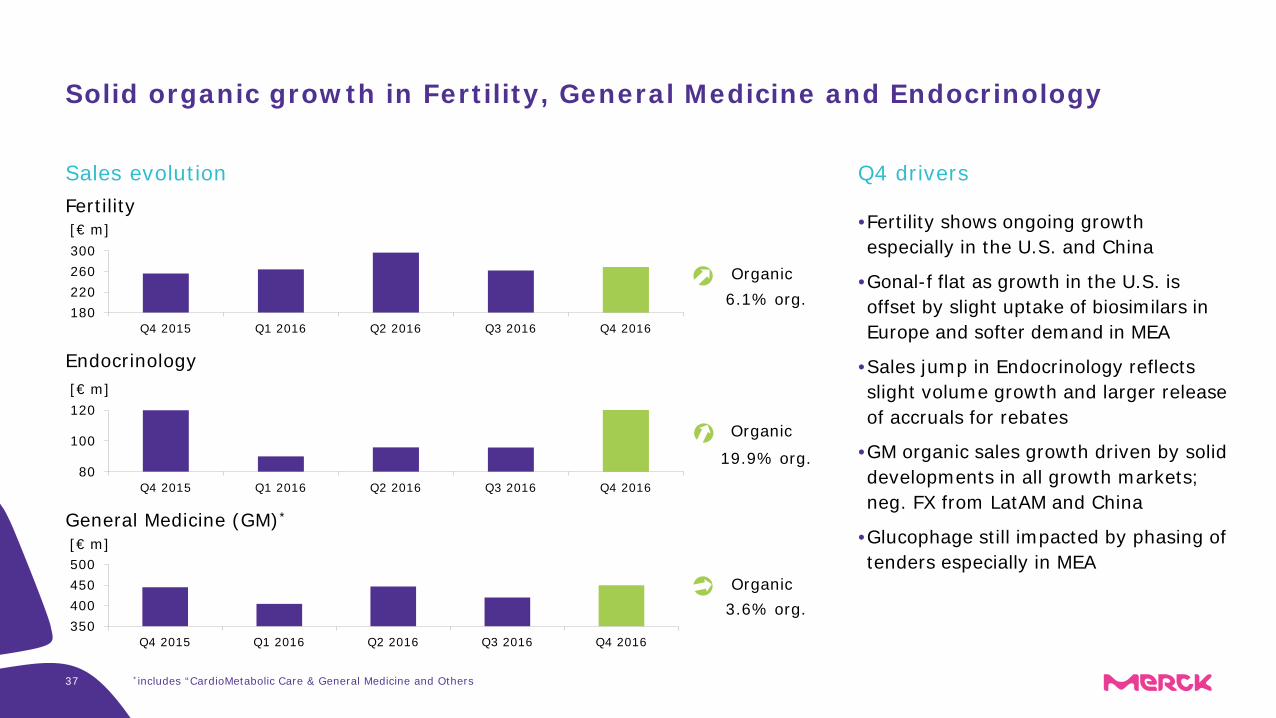
Solid organic growth in Fertility, General Medicine and Endocrinology
Endocrinology
Organic
Fertility•Fertility shows ongoing growth especially in the U.S. and China
•Gonal-f flat as growth in the U.S. is offset by slight uptake of biosimilars in Europe and softer demand in MEA
•Sales jump in Endocrinology reflectsslight volume growth and larger release of accruals for rebates
•GM organic sales growth driven by solid developments in all growth markets; neg. FX from LatAM and China
•Glucophage still impacted by phasing of tenders especially in MEA
Q4 driversSales evolution
180220260300
Q4 2015 Q1 2016 Q2 2016 Q3 2016 Q4 2016
[€ m]
80
100
120
Q4 2015 Q1 2016 Q2 2016 Q3 2016 Q4 2016
[€ m]
Organic
General Medicine (GM)*
350400450500
Q4 2015 Q1 2016 Q2 2016 Q3 2016 Q4 2016
[€ m]
Organic
*includes “CardioMetabolic Care & General Medicine and Others
6.1% org.
3.6% org.
19.9% org.
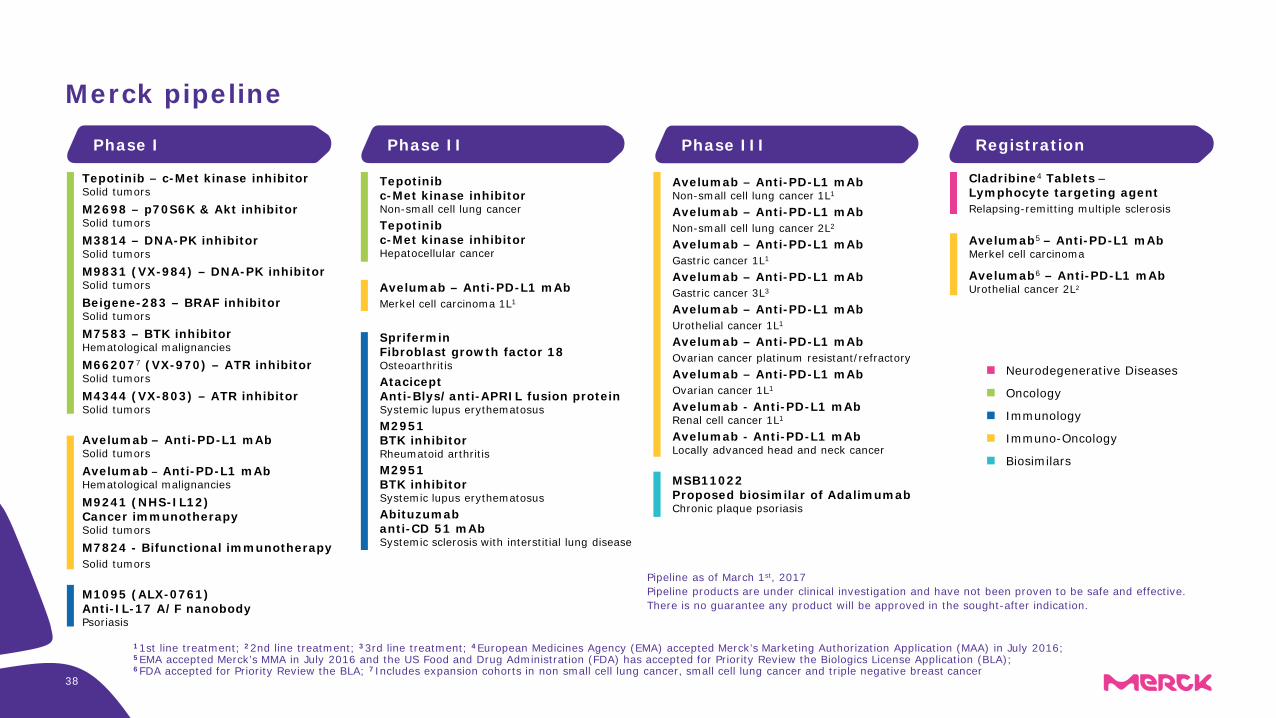
Tepotinibc-Met kinase inhibitor Non-small cell lung cancerTepotinibc-Met kinase inhibitor Hepatocellular cancer
SpriferminFibroblast growth factor 18OsteoarthritisAtaciceptAnti-Blys/anti-APRIL fusion proteinSystemic lupus erythematosusM2951BTK inhibitorRheumatoid arthritisM2951BTK inhibitorSystemic lupus erythematosus Abituzumabanti-CD 51 mAbSystemic sclerosis with interstitial lung disease
Tepotinib – c-Met kinase inhibitor Solid tumorsM2698 – p70S6K & Akt inhibitorSolid tumorsM3814 – DNA-PK inhibitorSolid tumorsM9831 (VX-984) – DNA-PK inhibitorSolid tumorsBeigene-283 – BRAF inhibitorSolid tumorsM7583 – BTK inhibitorHematological malignanciesM662077 (VX-970) – ATR inhibitorSolid tumorsM4344 (VX-803) – ATR inhibitorSolid tumors
Avelumab – Anti-PD-L1 mAbSolid tumorsAvelumab – Anti-PD-L1 mAbHematological malignanciesM9241 (NHS-IL12)Cancer immunotherapySolid tumorsM7824 - Bifunctional immunotherapySolid tumors
M1095 (ALX-0761)Anti-IL-17 A/F nanobodyPsoriasis
RegistrationPhase IIIPhase IIPhase I
Cladribine4 Tablets –Lymphocyte targeting agentRelapsing-remitting multiple sclerosis
Avelumab5 – Anti-PD-L1 mAb Merkel cell carcinoma
Avelumab6 – Anti-PD-L1 mAb Urothelial cancer 2L2
Pipeline as of March 1st, 2017Pipeline products are under clinical investigation and have not been proven to be safe and effective.There is no guarantee any product will be approved in the sought-after indication.
Neurodegenerative Diseases
Oncology
Immunology
Immuno-Oncology
Avelumab – Anti-PD-L1 mAb Non-small cell lung cancer 1L1
Avelumab – Anti-PD-L1 mAbNon-small cell lung cancer 2L2
Avelumab – Anti-PD-L1 mAbGastric cancer 1L1
Avelumab – Anti-PD-L1 mAbGastric cancer 3L3
Avelumab – Anti-PD-L1 mAbUrothelial cancer 1L1
Avelumab – Anti-PD-L1 mAbOvarian cancer platinum resistant/refractoryAvelumab – Anti-PD-L1 mAbOvarian cancer 1L1
Avelumab - Anti-PD-L1 mAbRenal cell cancer 1L1
Avelumab - Anti-PD-L1 mAbLocally advanced head and neck cancer
1 1st line treatment; 2 2nd line treatment; 3 3rd line treatment; 4 European Medicines Agency (EMA) accepted Merck’s Marketing Authorization Application (MAA) in July 2016;5 EMA accepted Merck’s MMA in July 2016 and the US Food and Drug Administration (FDA) has accepted for Priority Review the Biologics License Application (BLA);6 FDA accepted for Priority Review the BLA; 7 Includes expansion cohorts in non small cell lung cancer, small cell lung cancer and triple negative breast cancer
Merck pipeline
38
MSB11022Proposed biosimilar of AdalimumabChronic plaque psoriasis
Biosimilars
Avelumab – Anti-PD-L1 mAbMerkel cell carcinoma 1L1
39
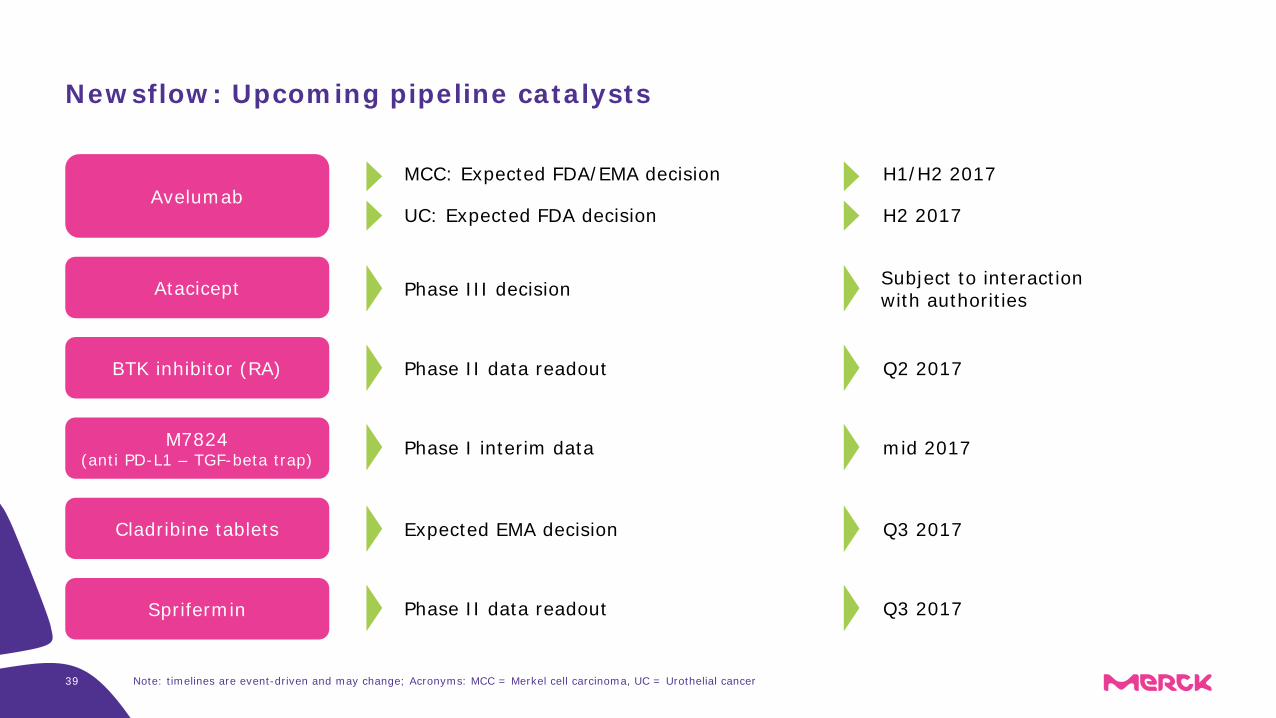
Newsflow: Upcoming pipeline catalysts
MCC: Expected FDA/EMA decision H1/H2 2017Avelumab
Cladribine tablets Expected EMA decision Q3 2017
Phase I interim data mid 2017M7824(anti PD-L1 – TGF-beta trap)
Note: timelines are event-driven and may change; Acronyms: MCC = Merkel cell carcinoma, UC = Urothelial cancer
Phase II data readout Q3 2017Sprifermin
Phase II data readout Q2 2017BTK inhibitor (RA)
Phase III decisionAtacicept Subject to interaction with authorities
UC: Expected FDA decision H2 2017
40
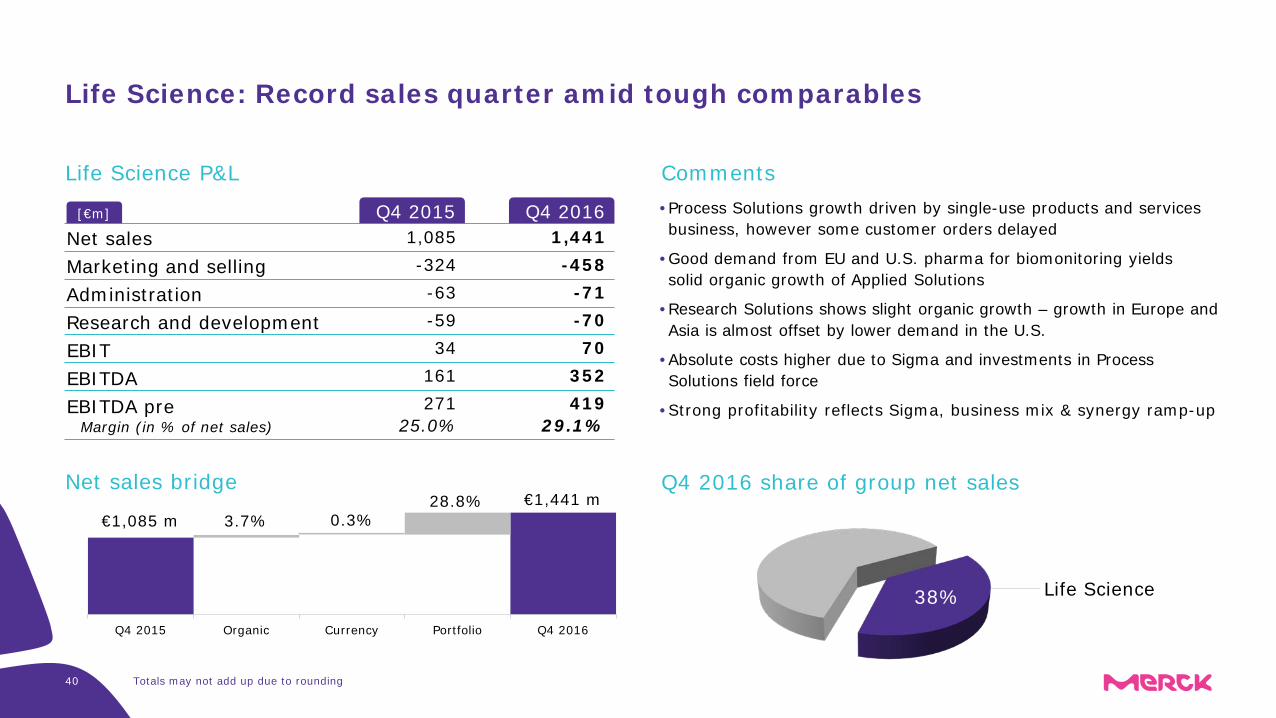
Life Science: Record sales quarter amid tough comparables
• Process Solutions growth driven by single-use products and services business, however some customer orders delayed
• Good demand from EU and U.S. pharma for biomonitoring yields solid organic growth of Applied Solutions
• Research Solutions shows slight organic growth – growth in Europe and Asia is almost offset by lower demand in the U.S.
• Absolute costs higher due to Sigma and investments in Process Solutions field force
• Strong profitability reflects Sigma, business mix & synergy ramp-up
Net sales 1,441
Marketing and sellingAdministrationResearch and development
-71
70
419
Life Science P&L
Net sales bridge
EBITEBITDAEBITDA pre
-458
-70
352
1,085
-63
34
271
-324
-59
161
Margin (in % of net sales)
Comments
Q4 2016 share of group net sales
29.1%25.0%
Q4 2015 Organic Currency Portfolio Q4 2016
3.7% 0.3%28.8%
€1,085 m€1,441 m
Life Science38%
[€m]
Totals may not add up due to rounding
Q4 2015 Q4 2016
41
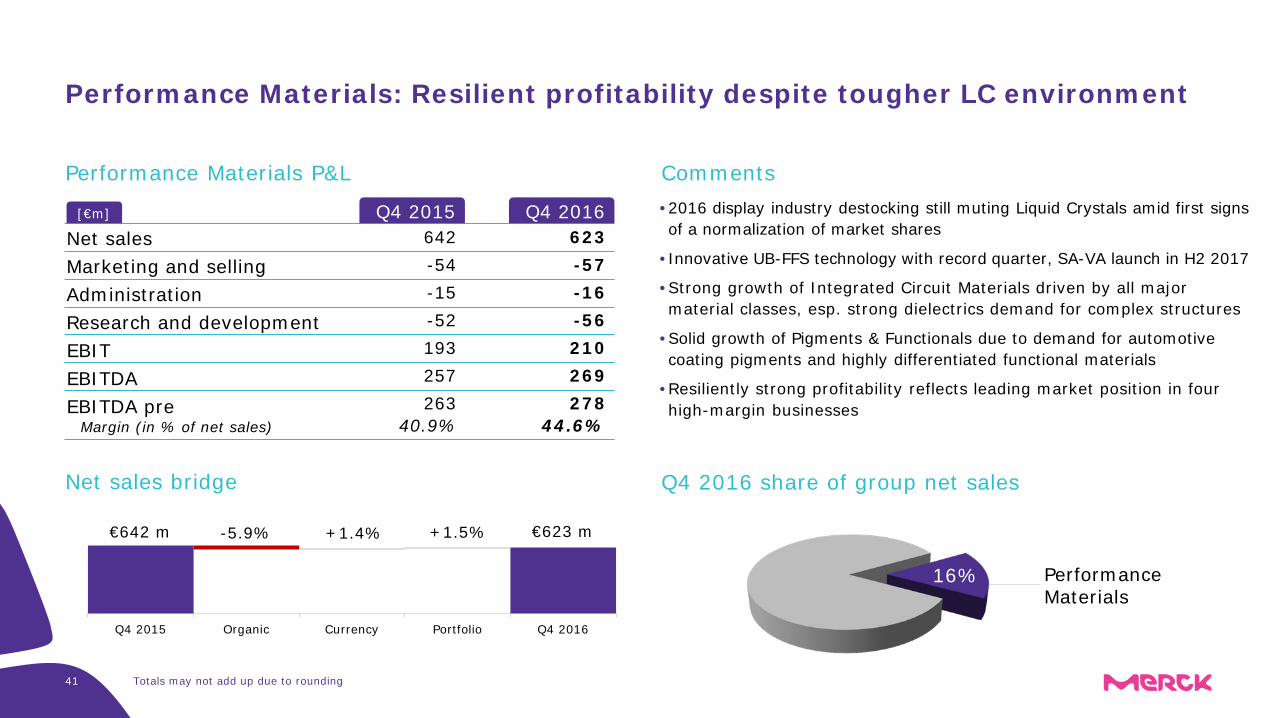
Performance Materials: Resilient profitability despite tougher LC environment
• 2016 display industry destocking still muting Liquid Crystals amid first signs of a normalization of market shares
• Innovative UB-FFS technology with record quarter, SA-VA launch in H2 2017
• Strong growth of Integrated Circuit Materials driven by all major material classes, esp. strong dielectrics demand for complex structures
• Solid growth of Pigments & Functionals due to demand for automotive coating pigments and highly differentiated functional materials
• Resiliently strong profitability reflects leading market position in four high-margin businesses
Net sales 623
Marketing and sellingAdministrationResearch and development
-16
210
278
Performance Materials P&L
Net sales bridge
EBITEBITDAEBITDA pre
-57
-56
269
642
-15
193
263
-54
-52
257
Margin (in % of net sales)
Comments
Q4 2016 share of group net sales
44.6%40.9%
Q4 2015 Organic Currency Portfolio Q4 2016
-5.9% +1.4% +1.5%€642 m €623 m
Performance Materials
16%
[€m]
Totals may not add up due to rounding
Q4 2015 Q4 2016
FY 2015 FY 2016
Totals may not add up due to rounding42
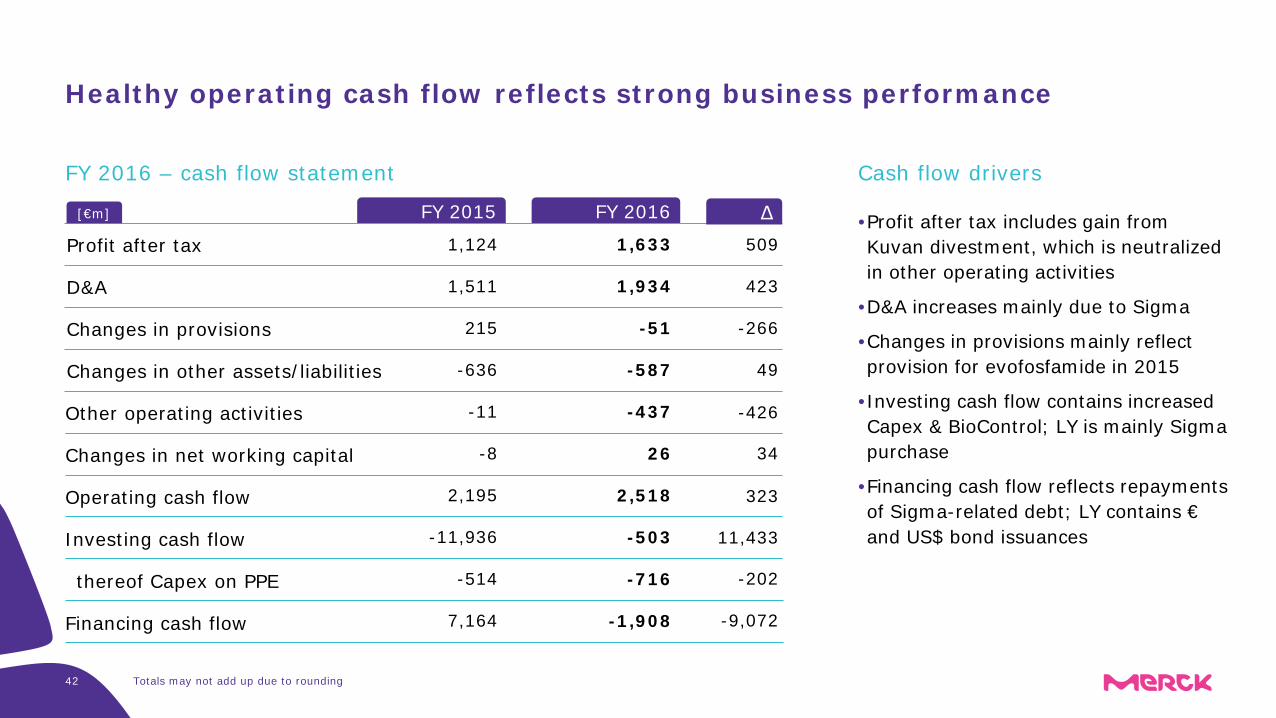
Healthy operating cash flow reflects strong business performance
Profit after tax 1,124
Δ 1,633 509
•Profit after tax includes gain from Kuvan divestment, which is neutralized in other operating activities
•D&A increases mainly due to Sigma
•Changes in provisions mainly reflectprovision for evofosfamide in 2015
•Investing cash flow contains increased Capex & BioControl; LY is mainly Sigma purchase
•Financing cash flow reflects repayments of Sigma-related debt; LY contains €and US$ bond issuances
Cash flow drivers
D&A
Changes in provisions
Changes in other assets/liabilities
Other operating activities
Changes in net working capital
Operating cash flow
-11 -437
-8 26 34
2,195 2,518 323
1,511 1,934 423
215 -51 -266
-636 -587 49
Investing cash flow
thereof Capex on PPE
Financing cash flow
-11,936
-514
7,164
-503
-716 -202
-1,908 -9,072
[€m]
FY 2016 – cash flow statement
-426
11,433
Q4 2015 Q4 2016
Totals may not add up due to rounding
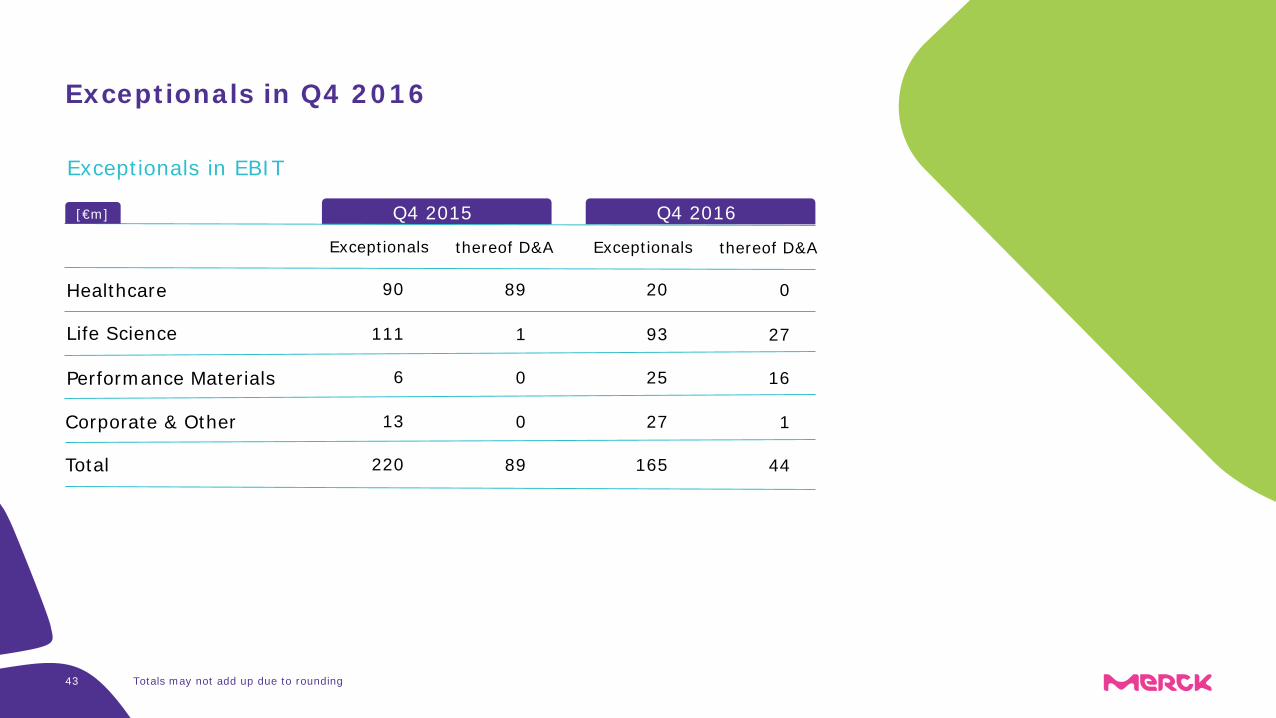
Exceptionals
[€m]
Healthcare
Life Science
Performance Materials
Corporate & Other
Total
13
220
90
111
6
Exceptionals in EBIT
thereof D&A
0
89
89
1
0
Exceptionals
27
165
20
93
25
thereof D&A
1
44
0
27
16
43
Exceptionals in Q4 2016
FY 2015 FY 2016
Totals may not add up due to rounding
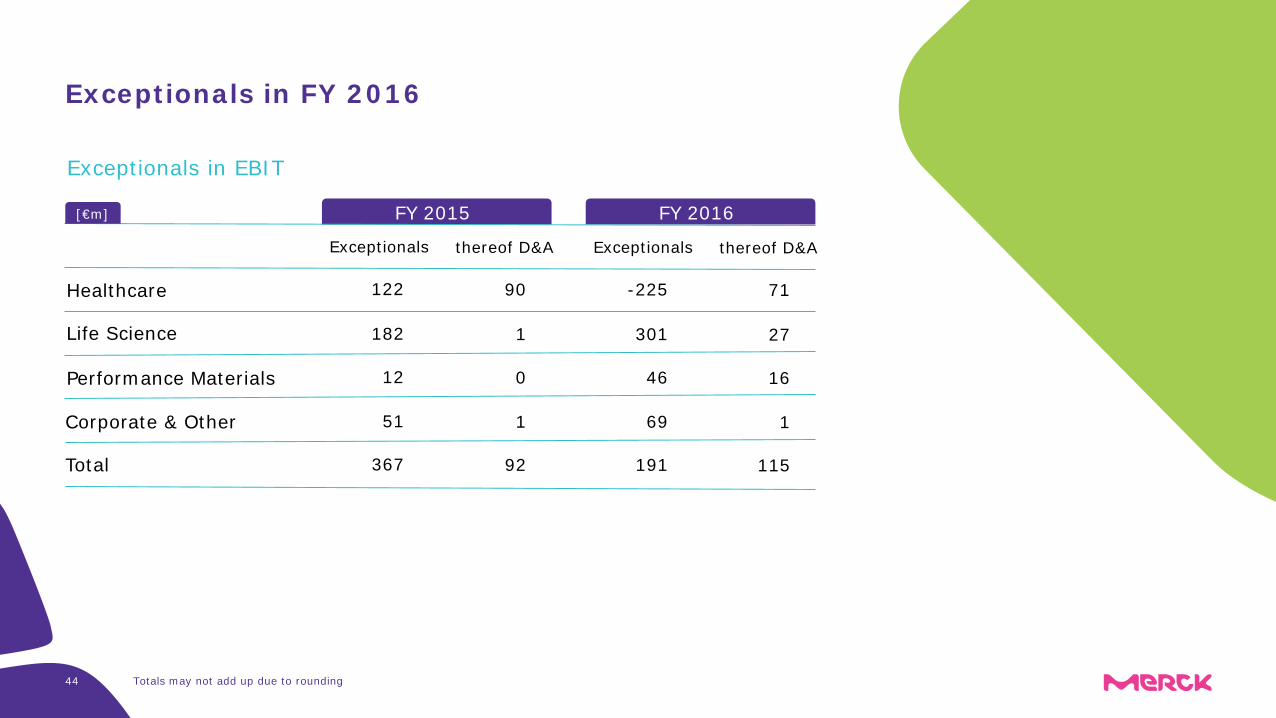
Exceptionals
[€m]
Healthcare
Life Science
Performance Materials
Corporate & Other
Total
51
367
122
182
12
Exceptionals in EBIT
thereof D&A
1
92
90
1
0
Exceptionals
69
191
-225
301
46
thereof D&A
1
115
71
27
16
44
Exceptionals in FY 2016
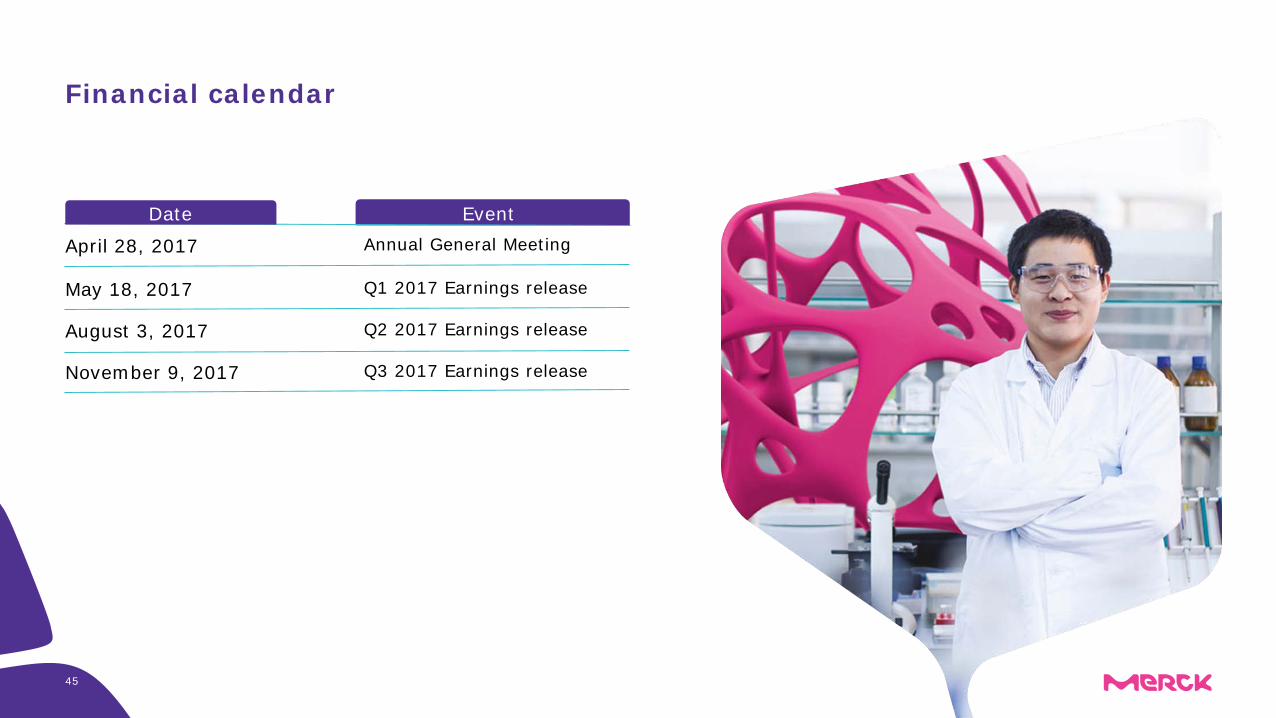
Financial calendar
EventDate
April 28, 2017 Annual General Meeting
May 18, 2017 Q1 2017 Earnings release
August 3, 2017 Q2 2017 Earnings release
November 9, 2017 Q3 2017 Earnings release
45
NEETHA MAHADEVAN
Life Science+49 6151 [email protected]
MARKUS TALANOW
Financial Communications/Performance Materials+49 6151 72-7144 [email protected]
Healthcare+49 6151 [email protected]
Head of Group Communications +49 6151 [email protected]
GANGOLF SCHRIMPF
ISABEL DE PAOLI
SILKE KLOTZ
Administrator Media Relations+49 6151 72-4342 [email protected]
EMAIL: [email protected]: www.media.merck.deFAX: +49 6151 72-5000
THOMAS MOELLER
Head of External Communications+49 6151 [email protected]