mercer capital's value focus: fintech industry | first quarter 2016 | are market conditions...
TRANSCRIPT

VALUE FOCUSFinTech Industry
www.mercercapital.com
Are Market Conditions Driving More FinTech Partnerships and M&A? 1
FinTech Industry Overview Public Market Indicators 3Mercer Capital FinTech Indices vs. S&P 500 3Median Total Return 3Valuation Multiples 4FinTech Margins 4FinTech Revenue Multiples 4FinTech EBITDA Multiples 4
FinTech IPO Watch 5
FinTech M&A 1Q16 vs. 1Q15 61Q16 Largest FinTech M&A Overview 7
FinTech Venture Capital Activity Overview 8
Venture Capital Case Study: TradeKing 11
Publicly Traded FinTech Companies Payments 14Solutions 16Technology 18
About Mercer Capital 20
First Quarter 2016
© 2016 Mercer Capital // www.mercercapital.com 1
Mercer Capital’s Value Focus: FinTech Industry First Quarter 2016
Are Market Conditions Driving More FinTech Partnerships and M&A?by Jay D. Wilson, Jr., CFA, ASA, CBA
It has been an interesting few weeks for FinTech. Coming off recent years where
both public and private FinTech markets were trending positively, the tail end of 2015
and the start to 2016 have been unique as performance has started to diverge. The
performance of public FinTech companies has been relatively flat through the first
quarter of 2016 (see Public Market Indicators on page 3), and signs of weakness
have been observed in alternative/marketplace lending, as well as some of the more
high profile FinTech companies that have gone public recently. The median return of the
FinTech companies that IPO’d in 2015 was a decline of 16% since IPO (through 3/31/16).
For perspective, Square, OnDeck, and Lending Club are each down significantly in
2016 (down 28%, 53%, and 64%, respectively from 1/1/2016 to 5/18/2016). Also, the
broader technology IPO slowdown in late 2015 has continued into 2016 and no FinTech
IPOs have occurred thus far in 2016.
However, optimism for FinTech still abounds, and the private markets continue to reflect
that with robust investor interest and funding levels. In 2016, 334 FinTech companies
raised a total of $6.7 billion in funding in the first quarter (compared to 171 companies
raising $3.2 billion in the first quarter of 2015), and Ant Financial (Alibaba’s finance
affiliate) completed an eye-popping $4.5 billion capital raise in April.
While the factors driving this divergence in performance between public and private
markets are debatable, the divergence is unlikely to continue indefinitely. A less
favorable public market and less attractive IPO market creates a more challenging
exit environment for those “unicorns” and other private companies. Headwinds for the
private markets could develop from more technology companies seeking IPOs and less
cash flow from successful exits to fund the next round of private companies.
Consequently, other strategic and exit options beyond an IPO should be considered
such as partnering with, acquiring, or selling to traditional incumbents (banks, insurers,
and money managers). The potential for M&A and partnerships is even more likely in
FinTech, particularly here in the US, due to the unique dynamics of the financial ser-
vices industry including the resiliency of traditional incumbents and the regulatory land-
scape. For example, consider a few of the inherent advantages that traditional banks
have over non-bank FinTech lenders:
• Better Access to Funding. Prior to 2016, the interest rate/funding environment
was very favorable and limited the funding advantage that financial institutions
have historically had relative to less regulated non-financial companies. However,
the winds appear to be shifting somewhat as rates rose in late 2015, and funding
availability for certain FinTech companies has tightened. For example, alternative
lenders are dependent, to some extent, on institutional investors to provide funding
and/or purchase loans generated on their platform, and a number have cited some
decline in institutional investor interest.
© 2016 Mercer Capital // www.mercercapital.com 2
Mercer Capital’s Value Focus: FinTech Industry First Quarter 2016
industry’s response to robo-advisory. Robo-advisers were noted by the CFA Institute
as the FinTech innovation most likely to have the greatest impact on the financial
services industry in the short-term (one year) and medium-term (five years). Consider
the following announcements in this area over the last few years; on the acquisition front,
BlackRock’s acquisition of FutureAdvisor in August 2015, Invesco’s acquisition
of Jemstep, and Ally Financial’s acquisition of TradeKing in April 2016. On the
partnering front, Motif and J.P. Morgan announced a partnership in October 2015,
UBS announced a major partnership with SigFig in May 2016, and Betterment and
Fidelity announced a partnership in October 2014.
While we do not yet know which strategy will be most successful, discussions of whether
to build, partner, or buy will increasingly be on the agenda of boards and executives of
both financial institutions and FinTech companies for the next few years. The right
combination of technology and financial services through either partnerships or M&A
has significant potential to create value for both FinTech companies and traditional
financial institutions. Any partnership or merger should be examined thoroughly to
ensure that the right metrics are utilized to examine value creation and returns on
investment.
Transactions and significant partnerships also have significant risks and potential issues
will need to be discussed. For example, significant issues with M&A and potential
partnerships can include: execution and cultural issues, shareholder dilution, whether
the partnership is significant enough to create shareholder value and provide a return
on investment, contingent liabilities, and regulatory pressures/issues. These issues
must be balanced with the potential rewards, such as customer satisfaction/retention,
shareholder value creation, and return on investment.
If you are interested in considering strategic options and potential partnerships for your
financial institution or FinTech company, contact Mercer Capital. Financial institutions
represent our largest industry focus for over thirty years. We have a deep bench with
experience with both FinTech companies and traditional financial institutions (banks,
asset managers, and insurance companies). This uniquely suits us to assist both as
they explore partnerships and potential transactions.
• Banks Still Have Strong Customer Relationships. While certain niches of Fin-
Tech are enhanced by demand from consumers and businesses for new and inno-
vative products and technology, presently, the traditional institutions still maintain the
majority of customer relationships. As an example, the 2015 Small Business Credit
Survey from the Federal Reserve noted that traditional banks are still the primary
source for small business loans with only 20% of employer firms applying at an online
lender. The satisfaction rate for online lenders was low (15% compared to 75% for
small banks and 51% for large banks). The main reasons reported for dissatisfaction
with online lenders was high interest rates and unfavorable repayment terms.
• Regulatory Scrutiny and Uncertainty related to FinTech. Both the Federal
Reserve and the OCC have made recent announcements and comments about
ways to regulate financial technology. In the online lending area specifically, regu-
latory scrutiny appears to be on the rise with the Treasury releasing a white paper
discussing the potential oversight of marketplace lending and the CFPB signaling
the potential to increase scrutiny in the area. The lack of a banking charter
has also been cited as a potential weakness and has exposed certain alternative
lenders to lawsuits in different states.
At the same time that FinTech companies are increasingly considering, or being forced
to consider, strategic options beyond an IPO, traditional incumbents are starting to
realize that they must develop a strategic plan that considers how to evolve, survive,
and thrive as technology and financial services increasingly intersect. For example,
a number of banks are looking to engage in discussions with FinTech companies. A
recent survey from BankDirector noted that boards are focusing more on technology
with 75% of respondents wanting to understand how technology can make the bank
more efficient and 72% wanting to know how technology can improve the customer
experience.
FinTech presents traditional financial institutions with a number of strategic options,
but the most notable options include focusing on one or some combination of the
following: building their own technology solutions, acquiring a FinTech company, or
partnering with a FinTech company. One area where we have started to see more
FinTech partnerships and M&A already start to play out is wealth management and the
© 2016 Mercer Capital // www.mercercapital.com 3
Mercer Capital’s Value Focus: FinTech Industry First Quarter 2016
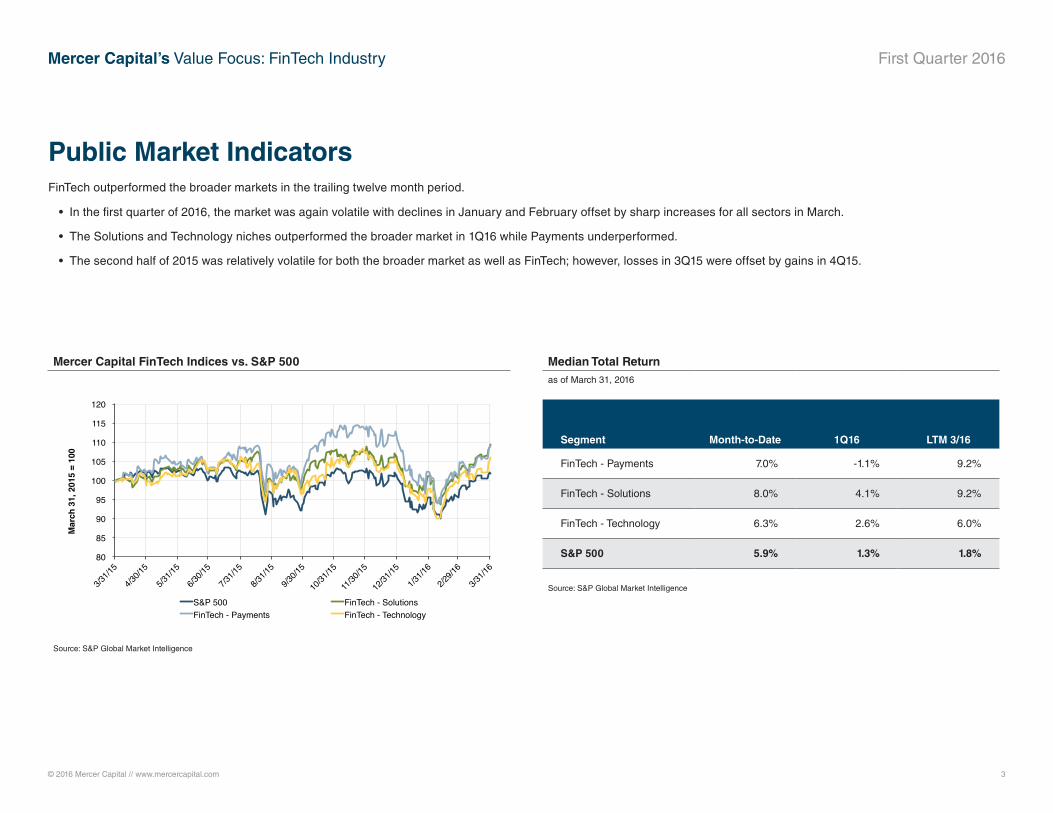
Median Total Returnas of March 31, 2016
Segment Month-to-Date 1Q16 LTM 3/16
FinTech - Payments 7.0% -1.1% 9.2%
FinTech - Solutions 8.0% 4.1% 9.2%
FinTech - Technology 6.3% 2.6% 6.0%
S&P 500 5.9% 1.3% 1.8%
Source: S&P Global Market Intelligence
Public Market IndicatorsFinTech outperformed the broader markets in the trailing twelve month period.
• In the first quarter of 2016, the market was again volatile with declines in January and February offset by sharp increases for all sectors in March.
• The Solutions and Technology niches outperformed the broader market in 1Q16 while Payments underperformed.
• The second half of 2015 was relatively volatile for both the broader market as well as FinTech; however, losses in 3Q15 were offset by gains in 4Q15.
Mercer Capital FinTech Indices vs. S&P 500
Source: S&P Global Market Intelligence
80 !
85 !
90 !
95 !
100 !
105 !
110 !
115 !
120 !
3/31/1
5!
4/30/1
5!
5/31/1
5!
6/30/1
5!
7/31/1
5!
8/31/1
5!
9/30/1
5!
10/31
/15!
11/30
/15!
12/31
/15!
1/31/1
6!
2/29/1
6!
3/31/1
6!
Mar
ch 3
1, 2
015
= 10
0!
MCM FinTech Indices vs. S&P 500 for LTM Period
S&P 500! FinTech - Solutions!FinTech - Payments! FinTech - Technology!
© 2016 Mercer Capital // www.mercercapital.com 4
Mercer Capital’s Value Focus: FinTech Industry First Quarter 2016
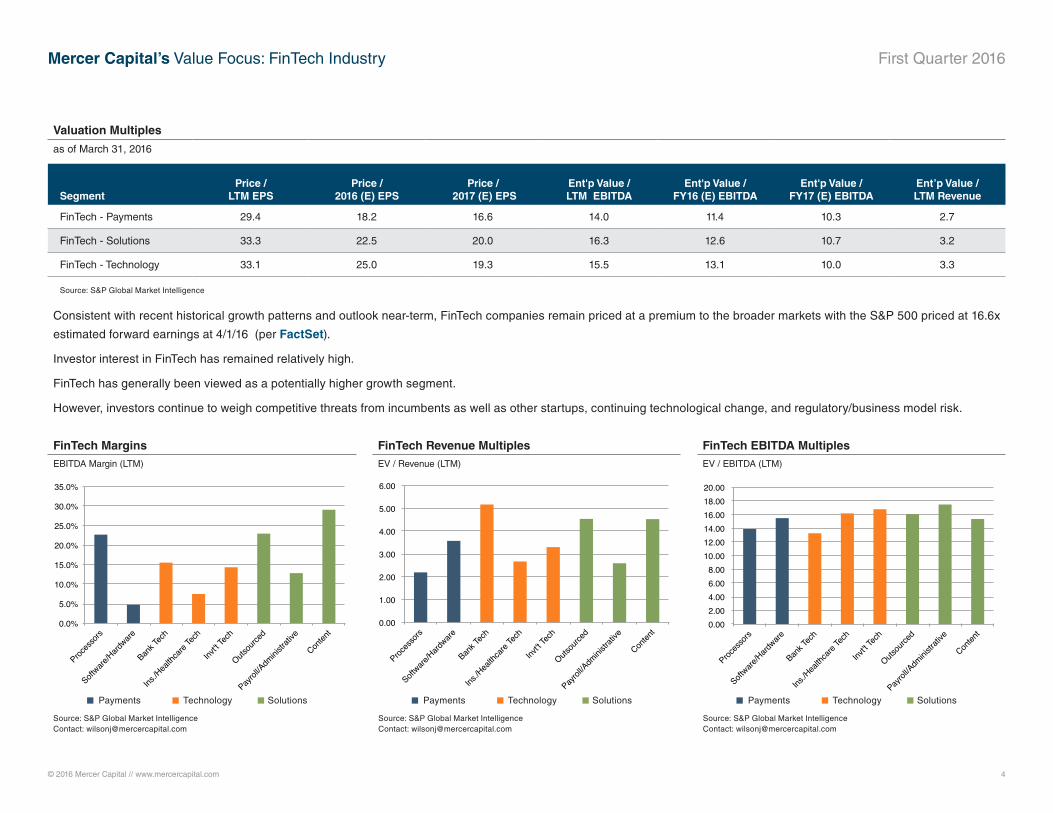
Valuation Multiples
as of March 31, 2016
SegmentPrice /
LTM EPSPrice /
2016 (E) EPSPrice /
2017 (E) EPSEnt'p Value / LTM EBITDA
Ent'p Value / FY16 (E) EBITDA
Ent'p Value / FY17 (E) EBITDA
Ent’p Value / LTM Revenue
FinTech - Payments 29.4 18.2 16.6 14.0 11.4 10.3 2.7
FinTech - Solutions 33.3 22.5 20.0 16.3 12.6 10.7 3.2
FinTech - Technology 33.1 25.0 19.3 15.5 13.1 10.0 3.3
Source: S&P Global Market Intelligence
Consistent with recent historical growth patterns and outlook near-term, FinTech companies remain priced at a premium to the broader markets with the S&P 500 priced at 16.6x
estimated forward earnings at 4/1/16 (per FactSet).
Investor interest in FinTech has remained relatively high.
FinTech has generally been viewed as a potentially higher growth segment.
However, investors continue to weigh competitive threats from incumbents as well as other startups, continuing technological change, and regulatory/business model risk.
FinTech MarginsEBITDA Margin (LTM)
FinTech Revenue MultiplesEV / Revenue (LTM)
FinTech EBITDA MultiplesEV / EBITDA (LTM)
0.00 !2.00 !4.00 !6.00 !8.00 !
10.00 !12.00 !14.00 !16.00 !18.00 !20.00 !
Proces
sors!
Software
/Hardware
!
Bank T
ech!
Ins./H
ealth
care
Tech!
Invt't T
ech!
Outsou
rced!
Payrol
l/Adm
inistra
tive!
Conten
t!0.00 !
1.00 !
2.00 !
3.00 !
4.00 !
5.00 !
6.00 !
Proces
sors!
Software
/Hardware
!
Bank T
ech!
Ins./H
ealth
care
Tech!
Invt't T
ech!
Outsou
rced!
Payrol
l/Adm
inistra
tive!
Conten
t!0.0%!
5.0%!
10.0%!
15.0%!
20.0%!
25.0%!
30.0%!
35.0%!
Proces
sors!
Software
/Hardware
!
Bank T
ech!
Ins./H
ealth
care
Tech!
Invt't T
ech!
Outsou
rced!
Payrol
l/Adm
inistra
tive!
Conten
t!
Source: S&P Global Market IntelligenceContact: [email protected]
Source: S&P Global Market IntelligenceContact: [email protected]
Source: S&P Global Market IntelligenceContact: [email protected]
Payments Technology Solutions Payments Technology Solutions Payments Technology Solutions
© 2016 Mercer Capital // www.mercercapital.com 5
Mercer Capital’s Value Focus: FinTech Industry First Quarter 2016
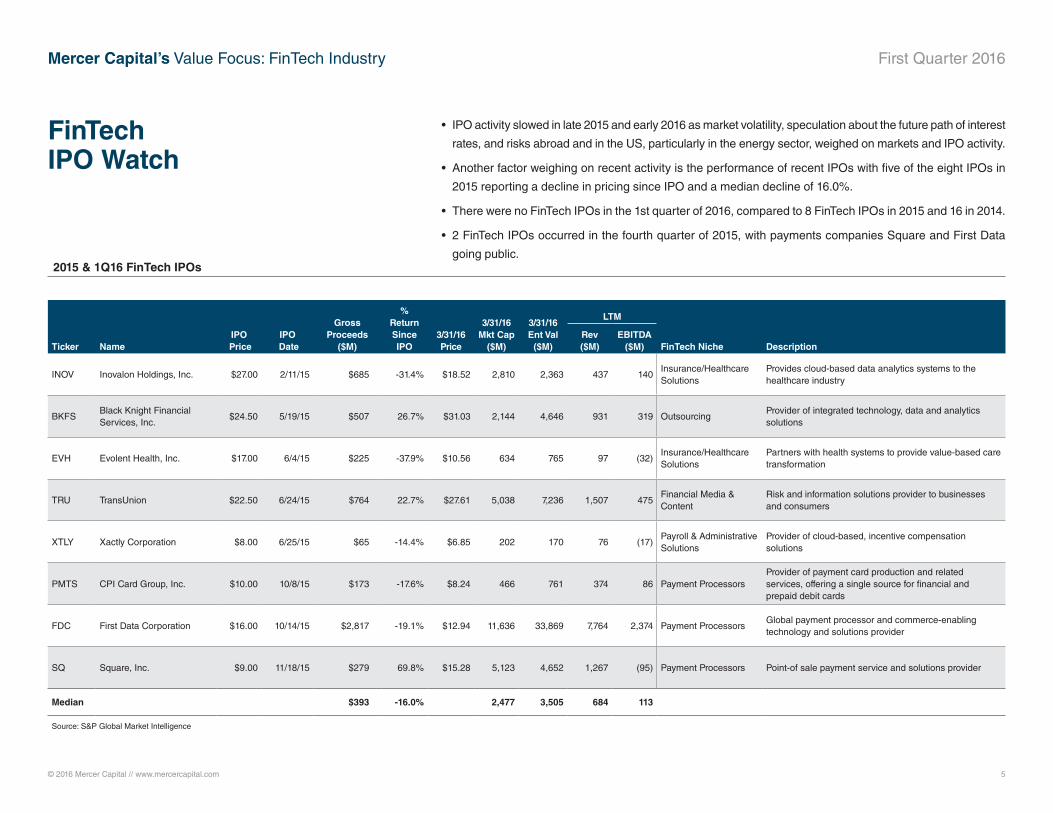
• IPO activity slowed in late 2015 and early 2016 as market volatility, speculation about the future path of interest
rates, and risks abroad and in the US, particularly in the energy sector, weighed on markets and IPO activity.
• Another factor weighing on recent activity is the performance of recent IPOs with five of the eight IPOs in
2015 reporting a decline in pricing since IPO and a median decline of 16.0%.
• There were no FinTech IPOs in the 1st quarter of 2016, compared to 8 FinTech IPOs in 2015 and 16 in 2014.
• 2 FinTech IPOs occurred in the fourth quarter of 2015, with payments companies Square and First Data
going public.
FinTech IPO Watch
IPO Date
Gross Proceeds
($M)
% Return Since IPO
3/31/16 Price
3/31/16 Mkt Cap
($M)
3/31/16 Ent Val
($M)
LTM
Ticker NameIPO
Price Rev ($M)
EBITDA ($M) FinTech Niche Description
INOV Inovalon Holdings, Inc. $27.00 2/11/15 $685 -31.4% $18.52 2,810 2,363 437 140 Insurance/Healthcare Solutions
Provides cloud-based data analytics systems to the healthcare industry
BKFSBlack Knight Financial Services, Inc.
$24.50 5/19/15 $507 26.7% $31.03 2,144 4,646 931 319 OutsourcingProvider of integrated technology, data and analytics solutions
EVH Evolent Health, Inc. $17.00 6/4/15 $225 -37.9% $10.56 634 765 97 (32)Insurance/Healthcare Solutions
Partners with health systems to provide value-based care transformation
TRU TransUnion $22.50 6/24/15 $764 22.7% $27.61 5,038 7,236 1,507 475 Financial Media & Content
Risk and information solutions provider to businesses and consumers
XTLY Xactly Corporation $8.00 6/25/15 $65 -14.4% $6.85 202 170 76 (17)Payroll & Administrative Solutions
Provider of cloud-based, incentive compensation solutions
PMTS CPI Card Group, Inc. $10.00 10/8/15 $173 -17.6% $8.24 466 761 374 86 Payment ProcessorsProvider of payment card production and related services, offering a single source for financial and prepaid debit cards
FDC First Data Corporation $16.00 10/14/15 $2,817 -19.1% $12.94 11,636 33,869 7,764 2,374 Payment ProcessorsGlobal payment processor and commerce-enabling technology and solutions provider
SQ Square, Inc. $9.00 11/18/15 $279 69.8% $15.28 5,123 4,652 1,267 (95) Payment Processors Point-of sale payment service and solutions provider
Median $393 -16.0% 2,477 3,505 684 113
Source: S&P Global Market Intelligence
2015 & 1Q16 FinTech IPOs
© 2016 Mercer Capital // www.mercercapital.com // Source: S&P Global Market Intelligence 6
Mercer Capital’s Value Focus: FinTech Industry First Quarter 2016
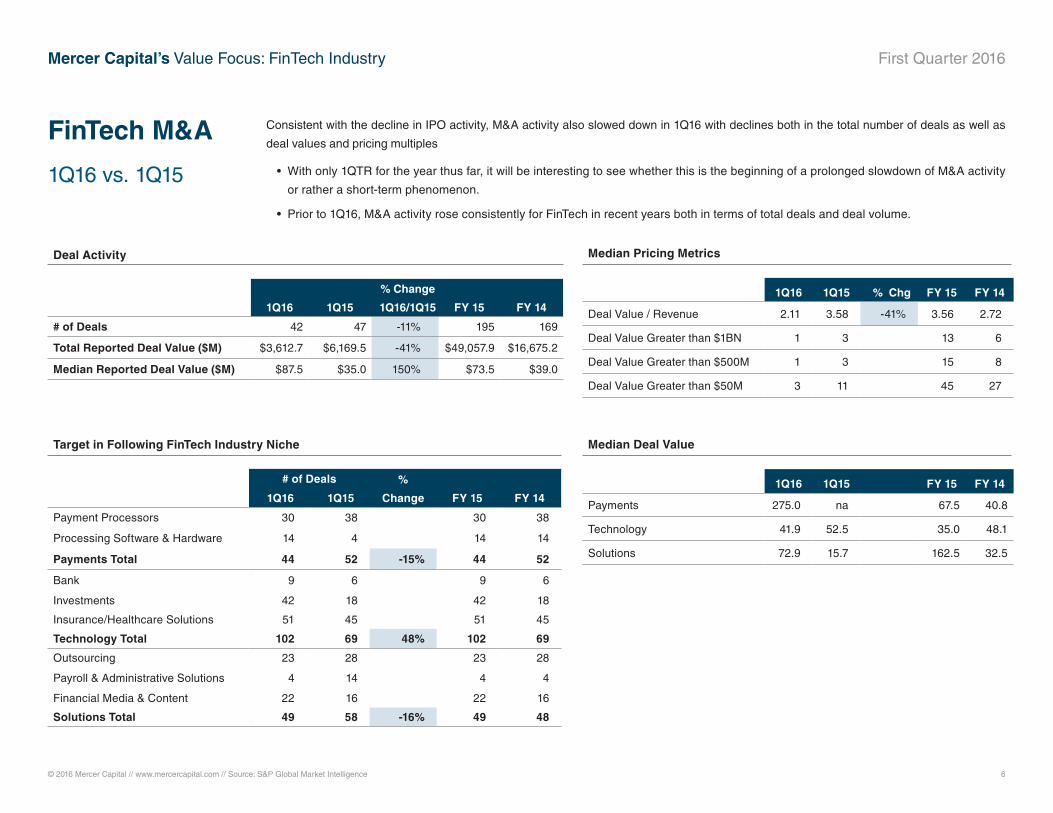
Consistent with the decline in IPO activity, M&A activity also slowed down in 1Q16 with declines both in the total number of deals as well as
deal values and pricing multiples
• With only 1QTR for the year thus far, it will be interesting to see whether this is the beginning of a prolonged slowdown of M&A activity
or rather a short-term phenomenon.
• Prior to 1Q16, M&A activity rose consistently for FinTech in recent years both in terms of total deals and deal volume.
FinTech M&A
1Q16 vs. 1Q15
1Q16 1Q15
% Change
1Q16/1Q15 FY 15 FY 14
# of Deals 42 47 -11% 195 169
Total Reported Deal Value ($M) $3,612.7 $6,169.5 -41% $49,057.9 $16,675.2
Median Reported Deal Value ($M) $87.5 $35.0 150% $73.5 $39.0
Deal Activity
# of Deals %
Change FY 15 FY 141Q16 1Q15
Payment Processors 30 38 30 38
Processing Software & Hardware 14 4 14 14
Payments Total 44 52 -15% 44 52
Bank 9 6 9 6
Investments 42 18 42 18
Insurance/Healthcare Solutions 51 45 51 45
Technology Total 102 69 48% 102 69
Outsourcing 23 28 23 28
Payroll & Administrative Solutions 4 14 4 4
Financial Media & Content 22 16 22 16
Solutions Total 49 58 -16% 49 48
Target in Following FinTech Industry Niche
Median Pricing Metrics
Median Deal Value
1Q16 1Q15 % Chg FY 15 FY 14
Deal Value / Revenue 2.11 3.58 -41% 3.56 2.72
Deal Value Greater than $1BN 1 3 13 6
Deal Value Greater than $500M 1 3 15 8
Deal Value Greater than $50M 3 11 45 27
1Q16 1Q15 FY 15 FY 14
Payments 275.0 na 67.5 40.8
Technology 41.9 52.5 35.0 48.1
Solutions 72.9 15.7 162.5 32.5
© 2016 Mercer Capital // www.mercercapital.com 7
Mercer Capital’s Value Focus: FinTech Industry First Quarter 2016
FinTech M&A 1Q16 Largest FinTech M&A Overview
Deal Value (Reported)
$M
Deal Value, Including Debt
Assumption (Reported)
$M
Valuation Multiples
Buyer Name/ Target Name
Announce Date
Total Ent. Value (i.e., DV, Including Debt) / Revenue
Total Ent. Value (i.e., DV, Including
Debt) / EBITDA Target Niche Target Description
Wipro Limited/ HealthPlan Services
2/11/16 460 460 2.06 NA Insurance/Healthcare Solutions
Provides sales, benefits administration, retention, and technology solutions to the insurance and managed care industries.
FinTech Acquisition Corp./ FTS Holding Corporation
3/7/16 350 412 3.42 NA Payment Processors
Provides payment processing and technology solutions
Total System Services, Inc./ TransFirst Holdings Corp.
1/26/16 2,350 3,483 2.26 NA Payment Processors
Provides merchant solutions to more than 235,000 small and medium-sized businesses in the U.S. through its proprietary technology, end-to-end customized and multi-channel products and superior customer service
Fiserv, Inc./ Community Financial Services Business
1/20/16 200 NA 2.11 NA Processing Software & Hardware
Community financial services business from ACI Worldwide Inc. which provides financial institutions with a suite of digital banking and electronic payments solutions including Architect Banking, which supports online, mobile, and tablet banking for retail banks and small business customers on a single platform
Median 405 460 2.19 NA
Source: SNL Financial
© 2016 Mercer Capital // www.mercercapital.com 8
Mercer Capital’s Value Focus: FinTech Industry First Quarter 2016
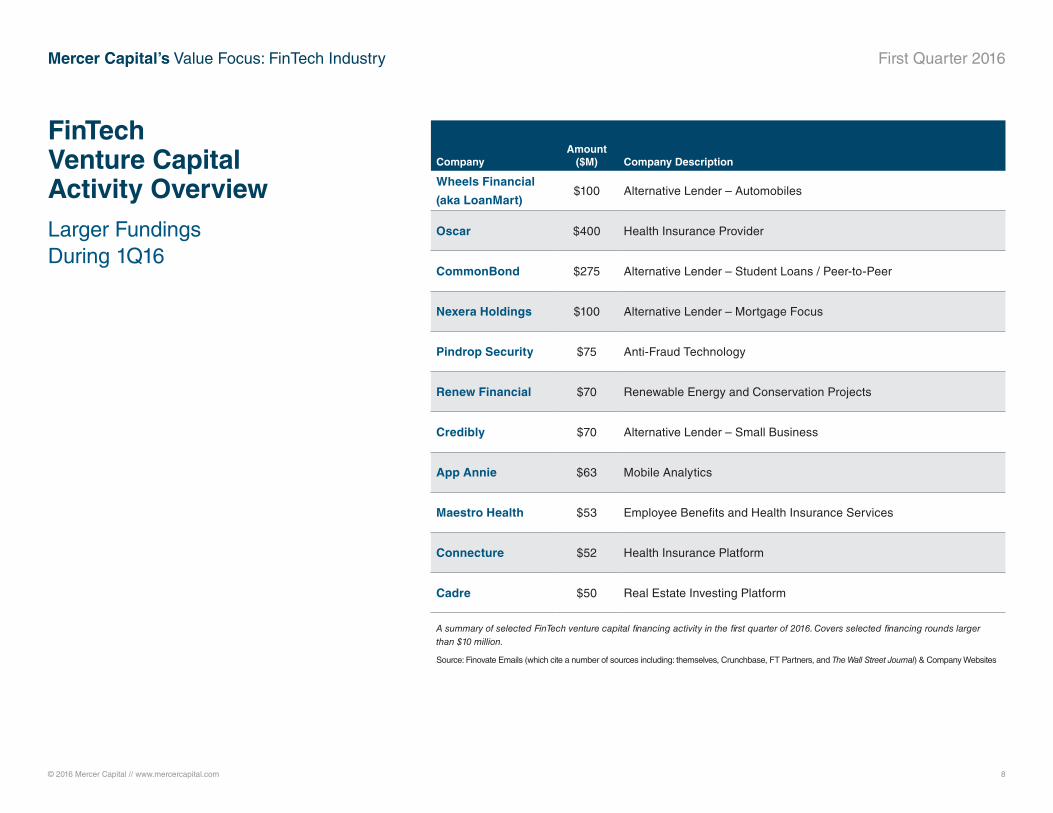
FinTech Venture Capital Activity OverviewLarger Fundings During 1Q16
CompanyAmount
($M) Company Description
Wheels Financial
(aka LoanMart)$100 Alternative Lender – Automobiles
Oscar $400 Health Insurance Provider
CommonBond $275 Alternative Lender – Student Loans / Peer-to-Peer
Nexera Holdings $100 Alternative Lender – Mortgage Focus
Pindrop Security $75 Anti-Fraud Technology
Renew Financial $70 Renewable Energy and Conservation Projects
Credibly $70 Alternative Lender – Small Business
App Annie $63 Mobile Analytics
Maestro Health $53 Employee Benefits and Health Insurance Services
Connecture $52 Health Insurance Platform
Cadre $50 Real Estate Investing Platform
A summary of selected FinTech venture capital financing activity in the first quarter of 2016. Covers selected financing rounds larger than $10 million.
Source: Finovate Emails (which cite a number of sources including: themselves, Crunchbase, FT Partners, and The Wall Street Journal) & Company Websites
© 2016 Mercer Capital // www.mercercapital.com 9
Mercer Capital’s Value Focus: FinTech Industry First Quarter 2016
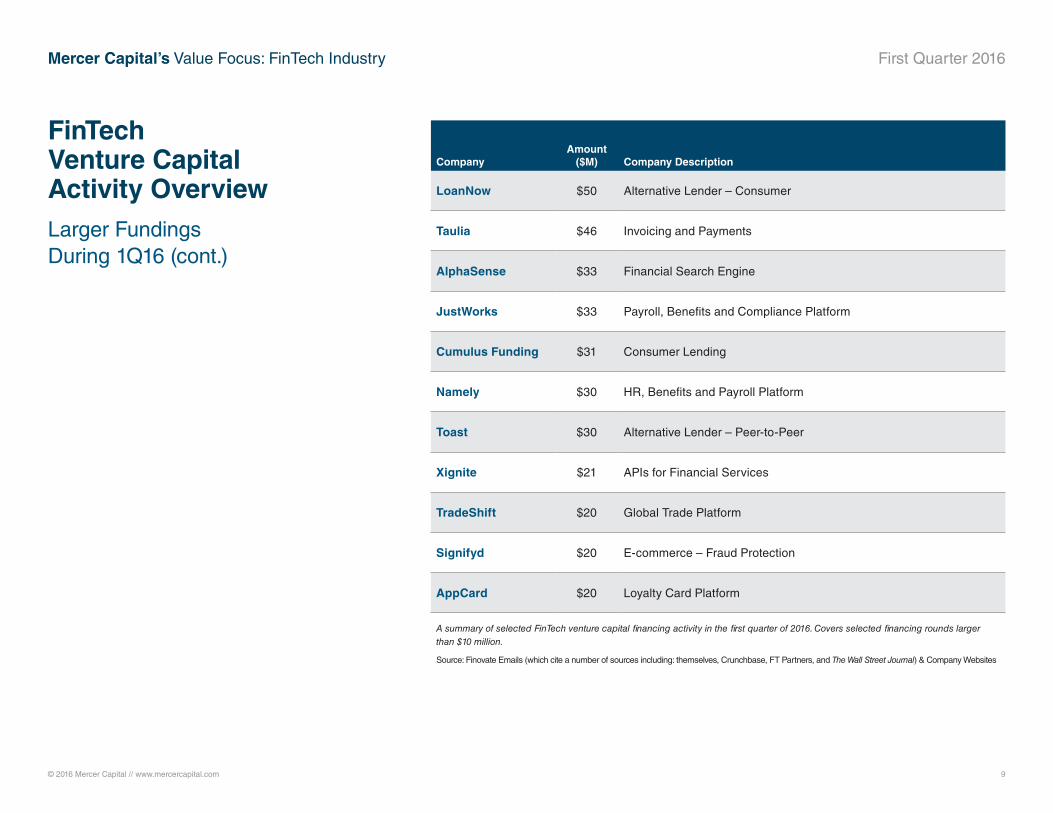
FinTech Venture Capital Activity OverviewLarger Fundings During 1Q16 (cont.)
CompanyAmount
($M) Company Description
LoanNow $50 Alternative Lender – Consumer
Taulia $46 Invoicing and Payments
AlphaSense $33 Financial Search Engine
JustWorks $33 Payroll, Benefits and Compliance Platform
Cumulus Funding $31 Consumer Lending
Namely $30 HR, Benefits and Payroll Platform
Toast $30 Alternative Lender – Peer-to-Peer
Xignite $21 APIs for Financial Services
TradeShift $20 Global Trade Platform
Signifyd $20 E-commerce – Fraud Protection
AppCard $20 Loyalty Card Platform
A summary of selected FinTech venture capital financing activity in the first quarter of 2016. Covers selected financing rounds larger than $10 million.
Source: Finovate Emails (which cite a number of sources including: themselves, Crunchbase, FT Partners, and The Wall Street Journal) & Company Websites
© 2016 Mercer Capital // www.mercercapital.com 10
Mercer Capital’s Value Focus: FinTech Industry First Quarter 2016
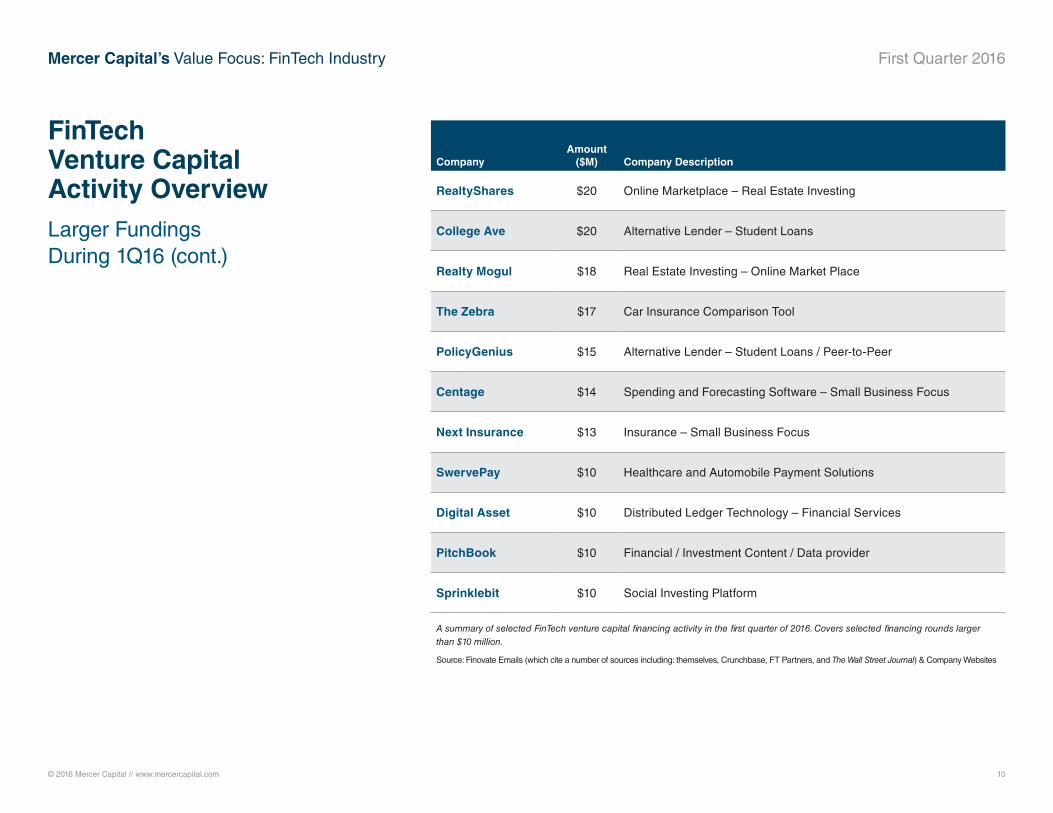
FinTech Venture Capital Activity OverviewLarger Fundings During 1Q16 (cont.)
CompanyAmount
($M) Company Description
RealtyShares $20 Online Marketplace – Real Estate Investing
College Ave $20 Alternative Lender – Student Loans
Realty Mogul $18 Real Estate Investing – Online Market Place
The Zebra $17 Car Insurance Comparison Tool
PolicyGenius $15 Alternative Lender – Student Loans / Peer-to-Peer
Centage $14 Spending and Forecasting Software – Small Business Focus
Next Insurance $13 Insurance – Small Business Focus
SwervePay $10 Healthcare and Automobile Payment Solutions
Digital Asset $10 Distributed Ledger Technology – Financial Services
PitchBook $10 Financial / Investment Content / Data provider
Sprinklebit $10 Social Investing Platform
A summary of selected FinTech venture capital financing activity in the first quarter of 2016. Covers selected financing rounds larger than $10 million.
Source: Finovate Emails (which cite a number of sources including: themselves, Crunchbase, FT Partners, and The Wall Street Journal) & Company Websites
© 2016 Mercer Capital // www.mercercapital.com 11
Mercer Capital’s Value Focus: FinTech Industry First Quarter 2016
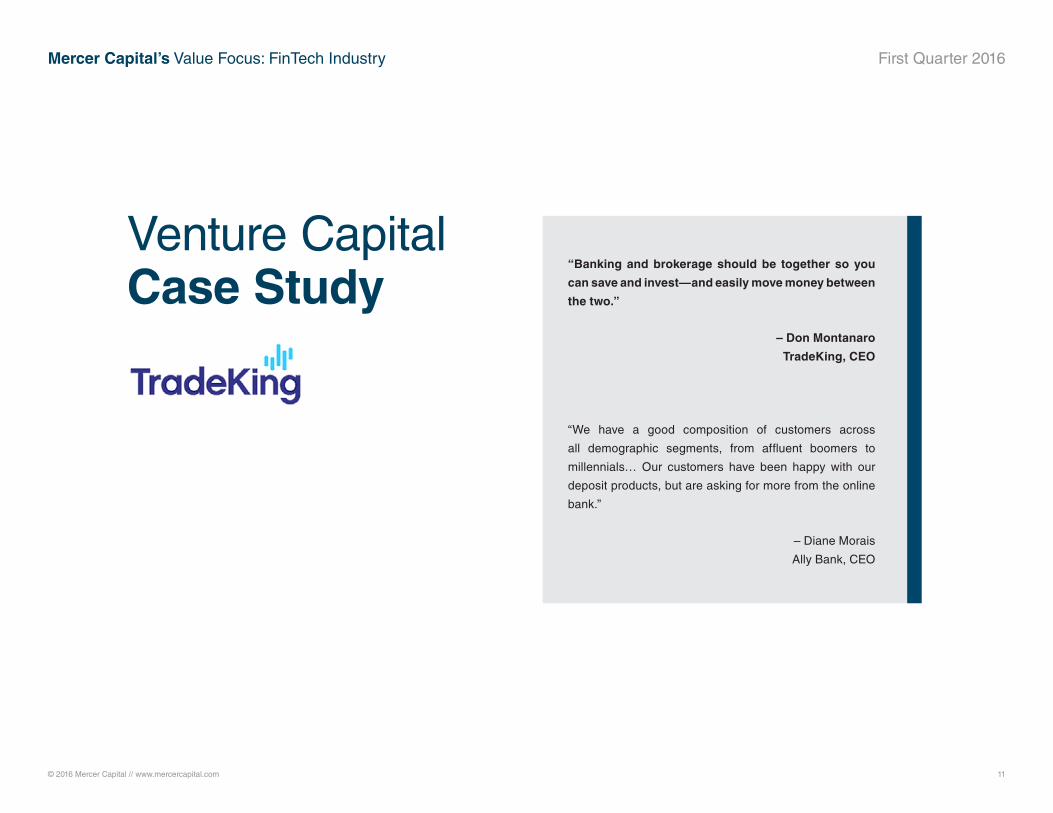
Venture Capital Case Study
“Banking and brokerage should be together so you
can save and invest—and easily move money between
the two.”
– Don Montanaro
TradeKing, CEO
“We have a good composition of customers across
all demographic segments, from affluent boomers to
millennials… Our customers have been happy with our
deposit products, but are asking for more from the online
bank.”
– Diane Morais
Ally Bank, CEO
© 2016 Mercer Capital // www.mercercapital.com 12
Mercer Capital’s Value Focus: FinTech Industry First Quarter 2016
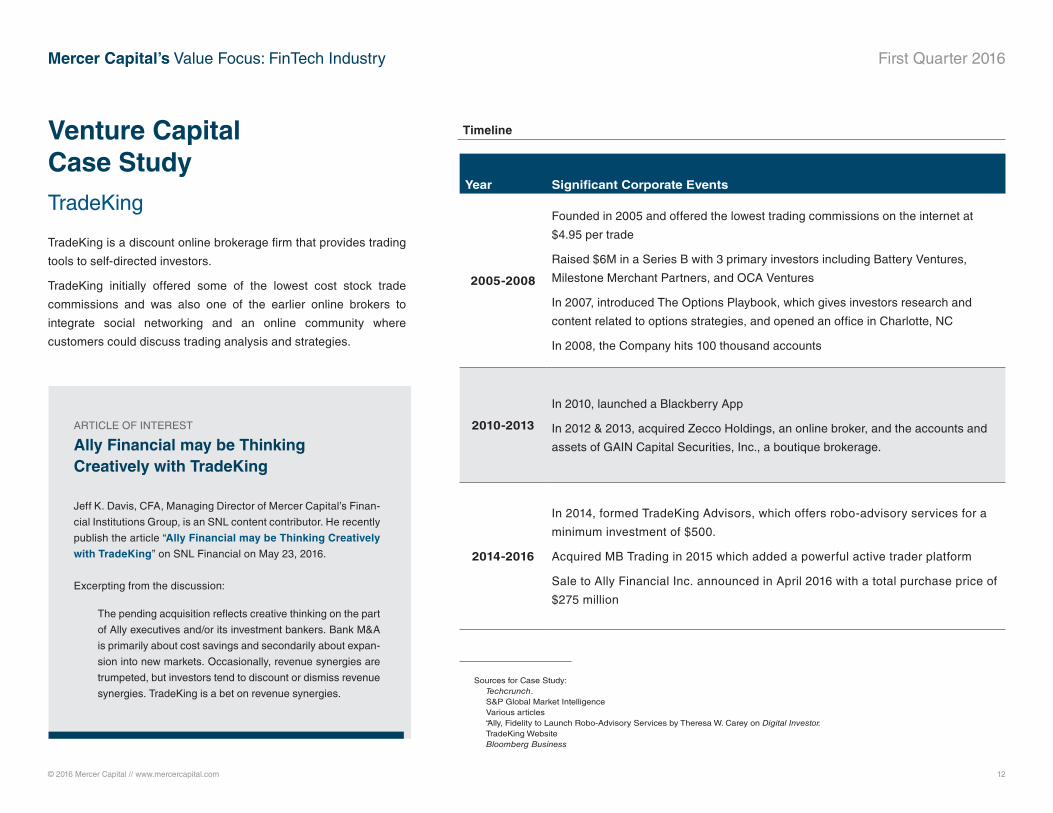
Venture Capital Case StudyTradeKing
TradeKing is a discount online brokerage firm that provides trading
tools to self-directed investors.
TradeKing initially offered some of the lowest cost stock trade
commissions and was also one of the earlier online brokers to
integrate social networking and an online community where
customers could discuss trading analysis and strategies.
Year Significant Corporate Events
2005-2008
Founded in 2005 and offered the lowest trading commissions on the internet at
$4.95 per trade
Raised $6M in a Series B with 3 primary investors including Battery Ventures,
Milestone Merchant Partners, and OCA Ventures
In 2007, introduced The Options Playbook, which gives investors research and
content related to options strategies, and opened an office in Charlotte, NC
In 2008, the Company hits 100 thousand accounts
2010-2013
In 2010, launched a Blackberry App
In 2012 & 2013, acquired Zecco Holdings, an online broker, and the accounts and
assets of GAIN Capital Securities, Inc., a boutique brokerage.
2014-2016
In 2014, formed TradeKing Advisors, which offers robo-advisory services for a
minimum investment of $500.
Acquired MB Trading in 2015 which added a powerful active trader platform
Sale to Ally Financial Inc. announced in April 2016 with a total purchase price of
$275 million
Timeline
Sources for Case Study:Techcrunch.S&P Global Market IntelligenceVarious articles“Ally, Fidelity to Launch Robo-Advisory Services by Theresa W. Carey on Digital Investor.TradeKing WebsiteBloomberg Business
ARTICLE OF INTEREST
Ally Financial may be Thinking Creatively with TradeKing
Jeff K. Davis, CFA, Managing Director of Mercer Capital’s Finan-
cial Institutions Group, is an SNL content contributor. He recently
publish the article “Ally Financial may be Thinking Creatively
with TradeKing” on SNL Financial on May 23, 2016.
Excerpting from the discussion:
The pending acquisition reflects creative thinking on the part
of Ally executives and/or its investment bankers. Bank M&A
is primarily about cost savings and secondarily about expan-
sion into new markets. Occasionally, revenue synergies are
trumpeted, but investors tend to discount or dismiss revenue
synergies. TradeKing is a bet on revenue synergies.
© 2016 Mercer Capital // www.mercercapital.com 13
Mercer Capital’s Value Focus: FinTech Industry First Quarter 2016
Venture Capital Case Study TradeKing
1. Another sign of more interest in traditional incumbents like banks in
acquisitions/partnerships with FinTech companies.
As we noted in a recent article, this transaction represents a creative approach
for a bank in that the potential for performance improvement from the transaction
relies upon acquiring a FinTech company to enhance revenue through new/
expanded service offerings as opposed to the typical focus when acquiring a
bank on expense savings and synergies.
2. Continues the trend of banks attempting to create value through wealth
management.
We have previously written extensively on the potential for trust/wealth
management services to improve bank revenues. Interestingly, Ally noted
that it wasn’t interested in traditional advisor led investment services but it was
interested in digital offerings such as robo-advisors and robo-advisory was cited
as a primary consideration for Ally’s interest in TradeKing.
3. Another sign of interest in FinTech companies with acquisitions/
partnerships with traditional incumbents like bank.
While a number of FinTech companies are focused solely on disrupting traditional
financial institutions like banks and insurance companies, others are looking to
enhance partnerships and combine the strengths of FinTech with those traditional
incumbents. This transaction is an example of a FinTech company taking the
partnership route. TradeKing’s CEO Dan Montanaro said in a recent article
“Banking and brokerage should be together so you can save and invest—and
easily move money between the two.”
Key Takeaways
Industry Articles of Note
Sheila Bair goes the FinTech Route
CNBC: Jon Marino
Are Fintech and Community Banks a
Perfect Match?
American Banker: Robert Barba
Supporting Responsible Innovation
in the Federal Banking System: An
OCC Perspective
OCC
San Francisco Fed Head Sees Banks
Coexisting with FinTech Startups
SNL: Edward Lane
(subscription required)
© 2016 Mercer Capital // www.mercercapital.com // Source: S&P Global Market Intelligence 14
Mercer Capital’s Value Focus: FinTech Industry First Quarter 2016
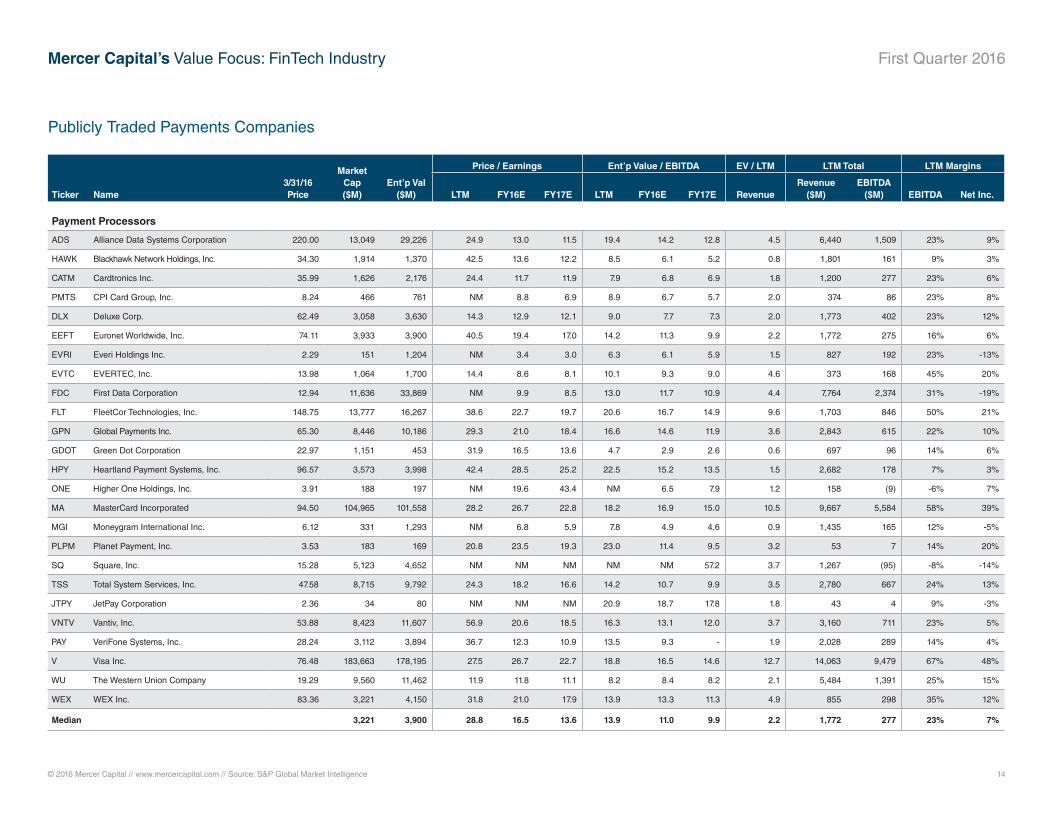
Publicly Traded Payments Companies
Ticker Name3/31/16Price
Market Cap ($M)
Ent’p Val ($M)
Price / Earnings Ent’p Value / EBITDA EV / LTM LTM Total LTM Margins
LTM FY16E FY17E LTM FY16E FY17E RevenueRevenue
($M)EBITDA
($M) EBITDA Net Inc.
Payment Processors
ADS Alliance Data Systems Corporation 220.00 13,049 29,226 24.9 13.0 11.5 19.4 14.2 12.8 4.5 6,440 1,509 23% 9%
HAWK Blackhawk Network Holdings, Inc. 34.30 1,914 1,370 42.5 13.6 12.2 8.5 6.1 5.2 0.8 1,801 161 9% 3%
CATM Cardtronics Inc. 35.99 1,626 2,176 24.4 11.7 11.9 7.9 6.8 6.9 1.8 1,200 277 23% 6%
PMTS CPI Card Group, Inc. 8.24 466 761 NM 8.8 6.9 8.9 6.7 5.7 2.0 374 86 23% 8%
DLX Deluxe Corp. 62.49 3,058 3,630 14.3 12.9 12.1 9.0 7.7 7.3 2.0 1,773 402 23% 12%
EEFT Euronet Worldwide, Inc. 74.11 3,933 3,900 40.5 19.4 17.0 14.2 11.3 9.9 2.2 1,772 275 16% 6%
EVRI Everi Holdings Inc. 2.29 151 1,204 NM 3.4 3.0 6.3 6.1 5.9 1.5 827 192 23% -13%
EVTC EVERTEC, Inc. 13.98 1,064 1,700 14.4 8.6 8.1 10.1 9.3 9.0 4.6 373 168 45% 20%
FDC First Data Corporation 12.94 11,636 33,869 NM 9.9 8.5 13.0 11.7 10.9 4.4 7,764 2,374 31% -19%
FLT FleetCor Technologies, Inc. 148.75 13,777 16,267 38.6 22.7 19.7 20.6 16.7 14.9 9.6 1,703 846 50% 21%
GPN Global Payments Inc. 65.30 8,446 10,186 29.3 21.0 18.4 16.6 14.6 11.9 3.6 2,843 615 22% 10%
GDOT Green Dot Corporation 22.97 1,151 453 31.9 16.5 13.6 4.7 2.9 2.6 0.6 697 96 14% 6%
HPY Heartland Payment Systems, Inc. 96.57 3,573 3,998 42.4 28.5 25.2 22.5 15.2 13.5 1.5 2,682 178 7% 3%
ONE Higher One Holdings, Inc. 3.91 188 197 NM 19.6 43.4 NM 6.5 7.9 1.2 158 (9) -6% 7%
MA MasterCard Incorporated 94.50 104,965 101,558 28.2 26.7 22.8 18.2 16.9 15.0 10.5 9,667 5,584 58% 39%
MGI Moneygram International Inc. 6.12 331 1,293 NM 6.8 5.9 7.8 4.9 4.6 0.9 1,435 165 12% -5%
PLPM Planet Payment, Inc. 3.53 183 169 20.8 23.5 19.3 23.0 11.4 9.5 3.2 53 7 14% 20%
SQ Square, Inc. 15.28 5,123 4,652 NM NM NM NM NM 57.2 3.7 1,267 (95) -8% -14%
TSS Total System Services, Inc. 47.58 8,715 9,792 24.3 18.2 16.6 14.2 10.7 9.9 3.5 2,780 667 24% 13%
JTPY JetPay Corporation 2.36 34 80 NM NM NM 20.9 18.7 17.8 1.8 43 4 9% -3%
VNTV Vantiv, Inc. 53.88 8,423 11,607 56.9 20.6 18.5 16.3 13.1 12.0 3.7 3,160 711 23% 5%
PAY VeriFone Systems, Inc. 28.24 3,112 3,894 36.7 12.3 10.9 13.5 9.3 - 1.9 2,028 289 14% 4%
V Visa Inc. 76.48 183,663 178,195 27.5 26.7 22.7 18.8 16.5 14.6 12.7 14,063 9,479 67% 48%
WU The Western Union Company 19.29 9,560 11,462 11.9 11.8 11.1 8.2 8.4 8.2 2.1 5,484 1,391 25% 15%
WEX WEX Inc. 83.36 3,221 4,150 31.8 21.0 17.9 13.9 13.3 11.3 4.9 855 298 35% 12%
Median 3,221 3,900 28.8 16.5 13.6 13.9 11.0 9.9 2.2 1,772 277 23% 7%
© 2016 Mercer Capital // www.mercercapital.com // Source: S&P Global Market Intelligence 15
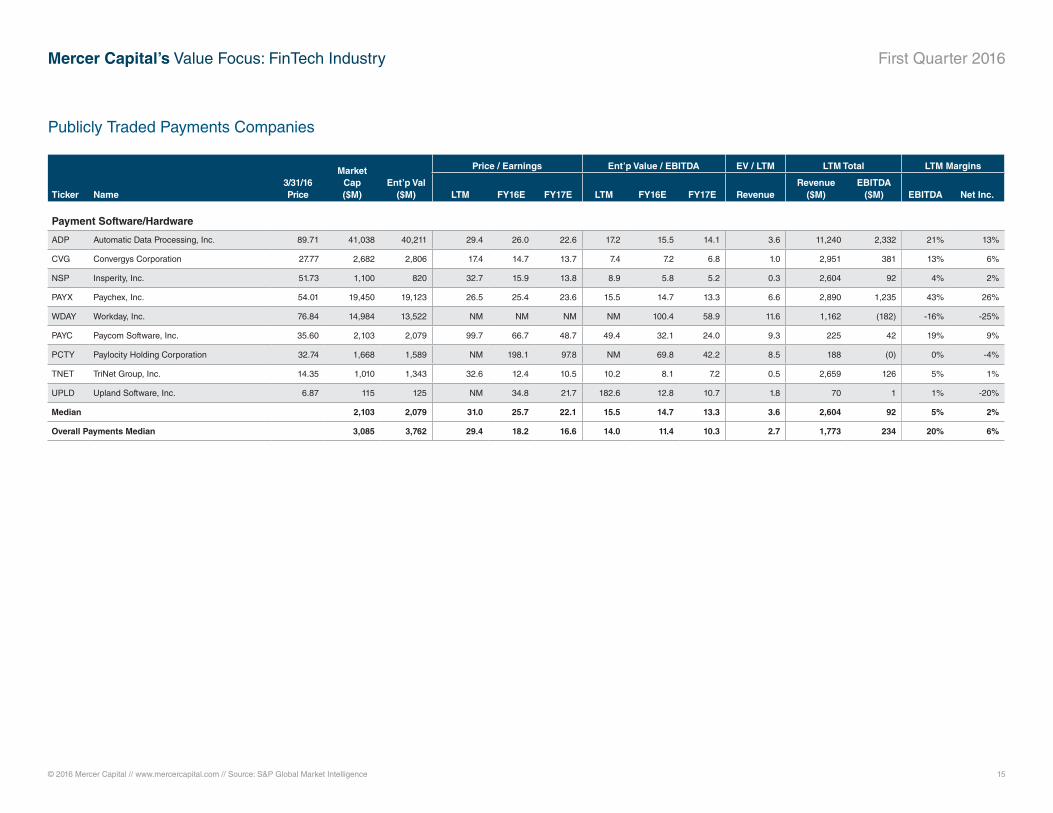
Mercer Capital’s Value Focus: FinTech Industry First Quarter 2016
Publicly Traded Payments Companies
Ticker Name3/31/16Price
Market Cap ($M)
Ent’p Val ($M)
Price / Earnings Ent’p Value / EBITDA EV / LTM LTM Total LTM Margins
LTM FY16E FY17E LTM FY16E FY17E RevenueRevenue
($M)EBITDA
($M) EBITDA Net Inc.
Payment Software/Hardware
ADP Automatic Data Processing, Inc. 89.71 41,038 40,211 29.4 26.0 22.6 17.2 15.5 14.1 3.6 11,240 2,332 21% 13%
CVG Convergys Corporation 27.77 2,682 2,806 17.4 14.7 13.7 7.4 7.2 6.8 1.0 2,951 381 13% 6%
NSP Insperity, Inc. 51.73 1,100 820 32.7 15.9 13.8 8.9 5.8 5.2 0.3 2,604 92 4% 2%
PAYX Paychex, Inc. 54.01 19,450 19,123 26.5 25.4 23.6 15.5 14.7 13.3 6.6 2,890 1,235 43% 26%
WDAY Workday, Inc. 76.84 14,984 13,522 NM NM NM NM 100.4 58.9 11.6 1,162 (182) -16% -25%
PAYC Paycom Software, Inc. 35.60 2,103 2,079 99.7 66.7 48.7 49.4 32.1 24.0 9.3 225 42 19% 9%
PCTY Paylocity Holding Corporation 32.74 1,668 1,589 NM 198.1 97.8 NM 69.8 42.2 8.5 188 (0) 0% -4%
TNET TriNet Group, Inc. 14.35 1,010 1,343 32.6 12.4 10.5 10.2 8.1 7.2 0.5 2,659 126 5% 1%
UPLD Upland Software, Inc. 6.87 115 125 NM 34.8 21.7 182.6 12.8 10.7 1.8 70 1 1% -20%
Median 2,103 2,079 31.0 25.7 22.1 15.5 14.7 13.3 3.6 2,604 92 5% 2%
Overall Payments Median 3,085 3,762 29.4 18.2 16.6 14.0 11.4 10.3 2.7 1,773 234 20% 6%
© 2016 Mercer Capital // www.mercercapital.com // Source: S&P Global Market Intelligence 16
Mercer Capital’s Value Focus: FinTech Industry First Quarter 2016
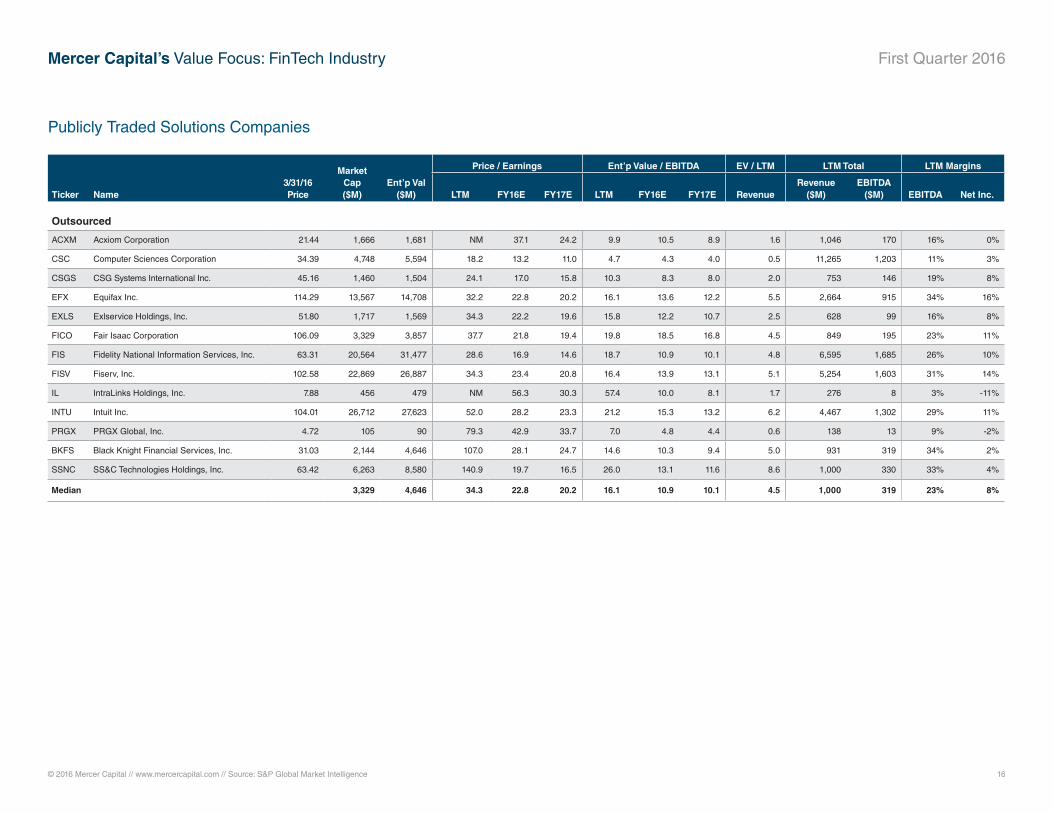
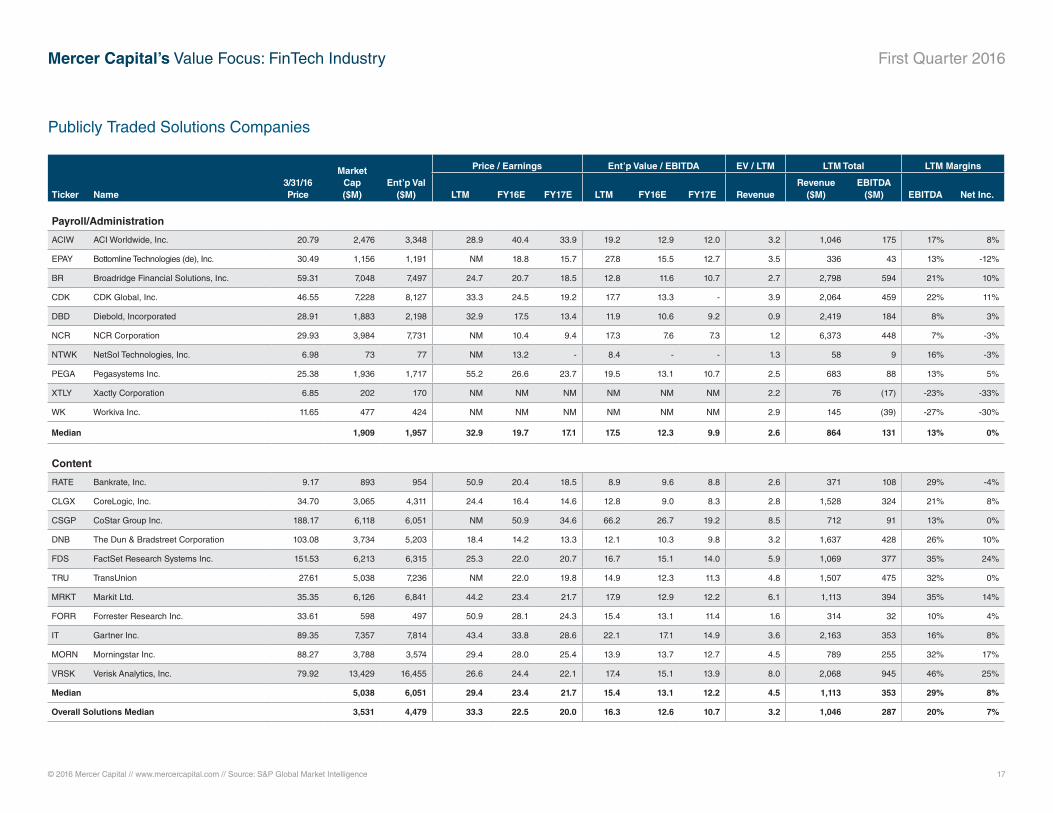
Publicly Traded Solutions Companies
Ticker Name3/31/16Price
Market Cap ($M)
Ent’p Val ($M)
Price / Earnings Ent’p Value / EBITDA EV / LTM LTM Total LTM Margins
LTM FY16E FY17E LTM FY16E FY17E RevenueRevenue
($M)EBITDA
($M) EBITDA Net Inc.
Outsourced
ACXM Acxiom Corporation 21.44 1,666 1,681 NM 37.1 24.2 9.9 10.5 8.9 1.6 1,046 170 16% 0%
CSC Computer Sciences Corporation 34.39 4,748 5,594 18.2 13.2 11.0 4.7 4.3 4.0 0.5 11,265 1,203 11% 3%
CSGS CSG Systems International Inc. 45.16 1,460 1,504 24.1 17.0 15.8 10.3 8.3 8.0 2.0 753 146 19% 8%
EFX Equifax Inc. 114.29 13,567 14,708 32.2 22.8 20.2 16.1 13.6 12.2 5.5 2,664 915 34% 16%
EXLS Exlservice Holdings, Inc. 51.80 1,717 1,569 34.3 22.2 19.6 15.8 12.2 10.7 2.5 628 99 16% 8%
FICO Fair Isaac Corporation 106.09 3,329 3,857 37.7 21.8 19.4 19.8 18.5 16.8 4.5 849 195 23% 11%
FIS Fidelity National Information Services, Inc. 63.31 20,564 31,477 28.6 16.9 14.6 18.7 10.9 10.1 4.8 6,595 1,685 26% 10%
FISV Fiserv, Inc. 102.58 22,869 26,887 34.3 23.4 20.8 16.4 13.9 13.1 5.1 5,254 1,603 31% 14%
IL IntraLinks Holdings, Inc. 7.88 456 479 NM 56.3 30.3 57.4 10.0 8.1 1.7 276 8 3% -11%
INTU Intuit Inc. 104.01 26,712 27,623 52.0 28.2 23.3 21.2 15.3 13.2 6.2 4,467 1,302 29% 11%
PRGX PRGX Global, Inc. 4.72 105 90 79.3 42.9 33.7 7.0 4.8 4.4 0.6 138 13 9% -2%
BKFS Black Knight Financial Services, Inc. 31.03 2,144 4,646 107.0 28.1 24.7 14.6 10.3 9.4 5.0 931 319 34% 2%
SSNC SS&C Technologies Holdings, Inc. 63.42 6,263 8,580 140.9 19.7 16.5 26.0 13.1 11.6 8.6 1,000 330 33% 4%
Median 3,329 4,646 34.3 22.8 20.2 16.1 10.9 10.1 4.5 1,000 319 23% 8%
© 2016 Mercer Capital // www.mercercapital.com // Source: S&P Global Market Intelligence 17
Mercer Capital’s Value Focus: FinTech Industry First Quarter 2016
Publicly Traded Solutions Companies
Ticker Name3/31/16Price
Market Cap ($M)
Ent’p Val ($M)
Price / Earnings Ent’p Value / EBITDA EV / LTM LTM Total LTM Margins
LTM FY16E FY17E LTM FY16E FY17E RevenueRevenue
($M)EBITDA
($M) EBITDA Net Inc.
Payroll/Administration
ACIW ACI Worldwide, Inc. 20.79 2,476 3,348 28.9 40.4 33.9 19.2 12.9 12.0 3.2 1,046 175 17% 8%
EPAY Bottomline Technologies (de), Inc. 30.49 1,156 1,191 NM 18.8 15.7 27.8 15.5 12.7 3.5 336 43 13% -12%
BR Broadridge Financial Solutions, Inc. 59.31 7,048 7,497 24.7 20.7 18.5 12.8 11.6 10.7 2.7 2,798 594 21% 10%
CDK CDK Global, Inc. 46.55 7,228 8,127 33.3 24.5 19.2 17.7 13.3 - 3.9 2,064 459 22% 11%
DBD Diebold, Incorporated 28.91 1,883 2,198 32.9 17.5 13.4 11.9 10.6 9.2 0.9 2,419 184 8% 3%
NCR NCR Corporation 29.93 3,984 7,731 NM 10.4 9.4 17.3 7.6 7.3 1.2 6,373 448 7% -3%
NTWK NetSol Technologies, Inc. 6.98 73 77 NM 13.2 - 8.4 - - 1.3 58 9 16% -3%
PEGA Pegasystems Inc. 25.38 1,936 1,717 55.2 26.6 23.7 19.5 13.1 10.7 2.5 683 88 13% 5%
XTLY Xactly Corporation 6.85 202 170 NM NM NM NM NM NM 2.2 76 (17) -23% -33%
WK Workiva Inc. 11.65 477 424 NM NM NM NM NM NM 2.9 145 (39) -27% -30%
Median 1,909 1,957 32.9 19.7 17.1 17.5 12.3 9.9 2.6 864 131 13% 0%
Content
RATE Bankrate, Inc. 9.17 893 954 50.9 20.4 18.5 8.9 9.6 8.8 2.6 371 108 29% -4%
CLGX CoreLogic, Inc. 34.70 3,065 4,311 24.4 16.4 14.6 12.8 9.0 8.3 2.8 1,528 324 21% 8%
CSGP CoStar Group Inc. 188.17 6,118 6,051 NM 50.9 34.6 66.2 26.7 19.2 8.5 712 91 13% 0%
DNB The Dun & Bradstreet Corporation 103.08 3,734 5,203 18.4 14.2 13.3 12.1 10.3 9.8 3.2 1,637 428 26% 10%
FDS FactSet Research Systems Inc. 151.53 6,213 6,315 25.3 22.0 20.7 16.7 15.1 14.0 5.9 1,069 377 35% 24%
TRU TransUnion 27.61 5,038 7,236 NM 22.0 19.8 14.9 12.3 11.3 4.8 1,507 475 32% 0%
MRKT Markit Ltd. 35.35 6,126 6,841 44.2 23.4 21.7 17.9 12.9 12.2 6.1 1,113 394 35% 14%
FORR Forrester Research Inc. 33.61 598 497 50.9 28.1 24.3 15.4 13.1 11.4 1.6 314 32 10% 4%
IT Gartner Inc. 89.35 7,357 7,814 43.4 33.8 28.6 22.1 17.1 14.9 3.6 2,163 353 16% 8%
MORN Morningstar Inc. 88.27 3,788 3,574 29.4 28.0 25.4 13.9 13.7 12.7 4.5 789 255 32% 17%
VRSK Verisk Analytics, Inc. 79.92 13,429 16,455 26.6 24.4 22.1 17.4 15.1 13.9 8.0 2,068 945 46% 25%
Median 5,038 6,051 29.4 23.4 21.7 15.4 13.1 12.2 4.5 1,113 353 29% 8%
Overall Solutions Median 3,531 4,479 33.3 22.5 20.0 16.3 12.6 10.7 3.2 1,046 287 20% 7%
© 2016 Mercer Capital // www.mercercapital.com // Source: S&P Global Market Intelligence 18
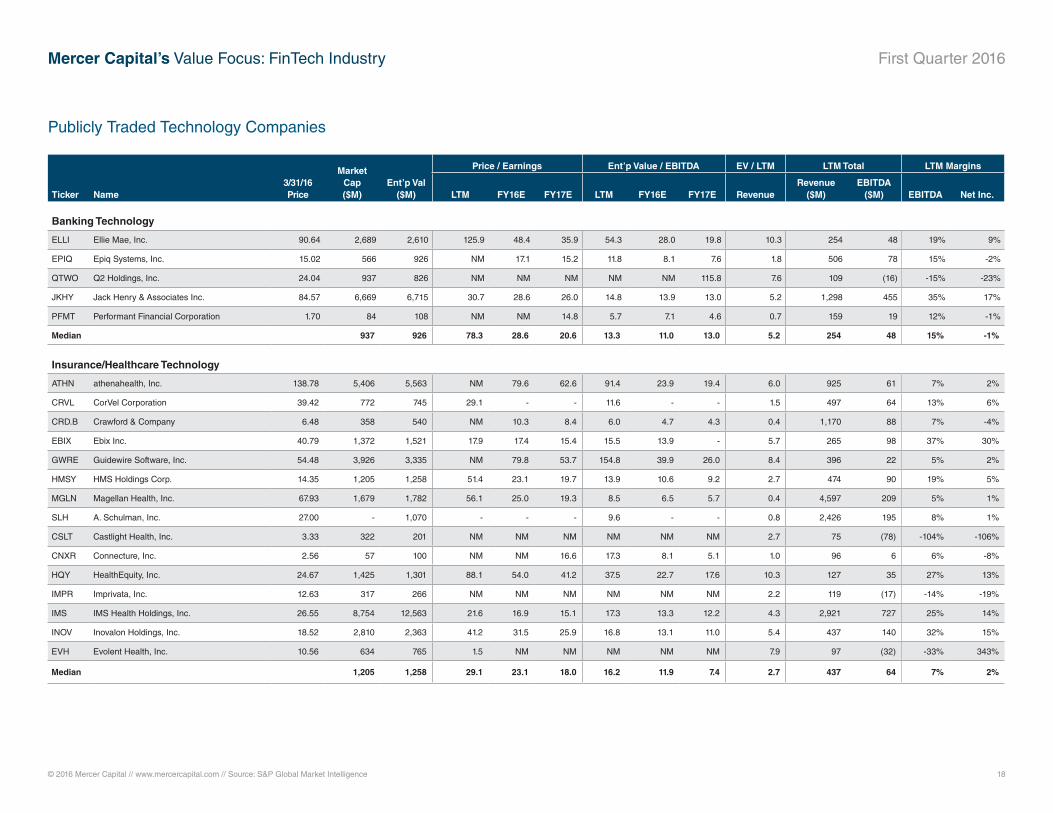
Mercer Capital’s Value Focus: FinTech Industry First Quarter 2016
Publicly Traded Technology Companies
Ticker Name3/31/16Price
Market Cap ($M)
Ent’p Val ($M)
Price / Earnings Ent’p Value / EBITDA EV / LTM LTM Total LTM Margins
LTM FY16E FY17E LTM FY16E FY17E RevenueRevenue
($M)EBITDA
($M) EBITDA Net Inc.
Banking Technology
ELLI Ellie Mae, Inc. 90.64 2,689 2,610 125.9 48.4 35.9 54.3 28.0 19.8 10.3 254 48 19% 9%
EPIQ Epiq Systems, Inc. 15.02 566 926 NM 17.1 15.2 11.8 8.1 7.6 1.8 506 78 15% -2%
QTWO Q2 Holdings, Inc. 24.04 937 826 NM NM NM NM NM 115.8 7.6 109 (16) -15% -23%
JKHY Jack Henry & Associates Inc. 84.57 6,669 6,715 30.7 28.6 26.0 14.8 13.9 13.0 5.2 1,298 455 35% 17%
PFMT Performant Financial Corporation 1.70 84 108 NM NM 14.8 5.7 7.1 4.6 0.7 159 19 12% -1%
Median 937 926 78.3 28.6 20.6 13.3 11.0 13.0 5.2 254 48 15% -1%
Insurance/Healthcare Technology
ATHN athenahealth, Inc. 138.78 5,406 5,563 NM 79.6 62.6 91.4 23.9 19.4 6.0 925 61 7% 2%
CRVL CorVel Corporation 39.42 772 745 29.1 - - 11.6 - - 1.5 497 64 13% 6%
CRD.B Crawford & Company 6.48 358 540 NM 10.3 8.4 6.0 4.7 4.3 0.4 1,170 88 7% -4%
EBIX Ebix Inc. 40.79 1,372 1,521 17.9 17.4 15.4 15.5 13.9 - 5.7 265 98 37% 30%
GWRE Guidewire Software, Inc. 54.48 3,926 3,335 NM 79.8 53.7 154.8 39.9 26.0 8.4 396 22 5% 2%
HMSY HMS Holdings Corp. 14.35 1,205 1,258 51.4 23.1 19.7 13.9 10.6 9.2 2.7 474 90 19% 5%
MGLN Magellan Health, Inc. 67.93 1,679 1,782 56.1 25.0 19.3 8.5 6.5 5.7 0.4 4,597 209 5% 1%
SLH A. Schulman, Inc. 27.00 - 1,070 - - - 9.6 - - 0.8 2,426 195 8% 1%
CSLT Castlight Health, Inc. 3.33 322 201 NM NM NM NM NM NM 2.7 75 (78) -104% -106%
CNXR Connecture, Inc. 2.56 57 100 NM NM 16.6 17.3 8.1 5.1 1.0 96 6 6% -8%
HQY HealthEquity, Inc. 24.67 1,425 1,301 88.1 54.0 41.2 37.5 22.7 17.6 10.3 127 35 27% 13%
IMPR Imprivata, Inc. 12.63 317 266 NM NM NM NM NM NM 2.2 119 (17) -14% -19%
IMS IMS Health Holdings, Inc. 26.55 8,754 12,563 21.6 16.9 15.1 17.3 13.3 12.2 4.3 2,921 727 25% 14%
INOV Inovalon Holdings, Inc. 18.52 2,810 2,363 41.2 31.5 25.9 16.8 13.1 11.0 5.4 437 140 32% 15%
EVH Evolent Health, Inc. 10.56 634 765 1.5 NM NM NM NM NM 7.9 97 (32) -33% 343%
Median 1,205 1,258 29.1 23.1 18.0 16.2 11.9 7.4 2.7 437 64 7% 2%
© 2016 Mercer Capital // www.mercercapital.com // Source: S&P Global Market Intelligence 19
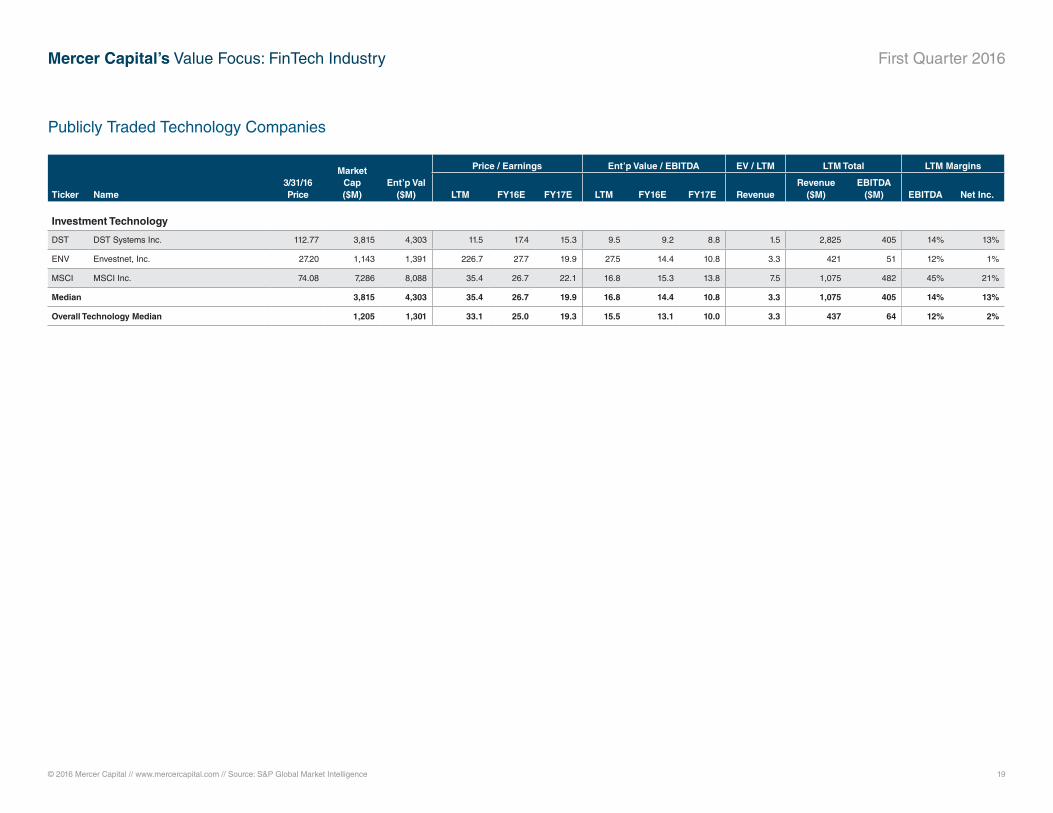
Mercer Capital’s Value Focus: FinTech Industry First Quarter 2016
Publicly Traded Technology Companies
Ticker Name3/31/16Price
Market Cap ($M)
Ent’p Val ($M)
Price / Earnings Ent’p Value / EBITDA EV / LTM LTM Total LTM Margins
LTM FY16E FY17E LTM FY16E FY17E RevenueRevenue
($M)EBITDA
($M) EBITDA Net Inc.
Investment Technology
DST DST Systems Inc. 112.77 3,815 4,303 11.5 17.4 15.3 9.5 9.2 8.8 1.5 2,825 405 14% 13%
ENV Envestnet, Inc. 27.20 1,143 1,391 226.7 27.7 19.9 27.5 14.4 10.8 3.3 421 51 12% 1%
MSCI MSCI Inc. 74.08 7,286 8,088 35.4 26.7 22.1 16.8 15.3 13.8 7.5 1,075 482 45% 21%
Median 3,815 4,303 35.4 26.7 19.9 16.8 14.4 10.8 3.3 1,075 405 14% 13%
Overall Technology Median 1,205 1,301 33.1 25.0 19.3 15.5 13.1 10.0 3.3 437 64 12% 2%
Mercer CapitalFinancial Technology Industry Services
Contact Us
Copyright © 2016 Mercer Capital Management, Inc. All rights reserved. It is illegal under Federal law to reproduce this publication or any portion of its contents without the publisher’s permission. Media quotations with source attribution are encouraged. Reporters
requesting additional information or editorial comment should contact Barbara Walters Price at 901.685.2120. Mercer Capital’s Industry Focus is published quarterly and does not constitute legal or financial consulting advice. It is offered as an information service to
our clients and friends. Those interested in specific guidance for legal or accounting matters should seek competent professional advice. Inquiries to discuss specific valuation matters are welcomed. To add your name to our mailing list to receive this complimentary
publication, visit our web site at www.mercercapital.com.
Mercer Capital provides financial technology companies with valuation, financial advisory, and consulting services.
Contact a Mercer Capital professional to discuss your needs in confidence.
Jay D. Wilson, CFA, ASA, [email protected]
Matthew R. Crow, CFA, [email protected]
Jeff K. Davis, [email protected]
MERCER CAPITAL
Memphis5100 Poplar Avenue, Suite 2600Memphis, Tennessee 38137901.685.2120
Dallas12201 Merit Drive, Suite 480Dallas, Texas 75251214.468.8400
Nashville102 Woodmont Blvd., Suite 231Nashville, Tennessee 37205615.345.0350
www.mercercapital.com
BUSINESS VALUATION & FINANCIAL ADVISORY SERVICES
Mercer Capital provides valuations for a variety of purposes including, corporate/strategic planning, transactions (fairness
opinion and M&A), equity compensation (409A compliance, ESOPs, and stock option programs), and financial statement
reporting (purchase price allocations, impairment testing, equity compensation). Additionally, Mercer Capital provides
related financial advisory and consulting services for companies across the corporate lifecycle — from start-ups to more
mature companies.
Services Provided
• Valuation of financial technology companies
• Financial advisory/valuations for acquisitions and divestitures
• Valuations for purchase accounting and impairment testing
• Fairness and solvency opinions
• Litigation support for economic damages and valuation and shareholder disputes
• Consulting and board presentations for corporate and strategic planning