membrane proteins in the outer mebrane of plastids and mitochondria · membrane proteins in the...
TRANSCRIPT
Membrane proteins
in the outer membrane of plastids and mitochondria
vorgelegt von
Iryna Ilkavets
Dissertation der Fakultät für Biologie
der Ludwig-Maximilians-Universität München
München
19.12.2005

Gutachter:
1. Prof. Dr. J. Soll
2. PD Dr. J. Meurer
Date of the exam: 13.02.2006

1
Contents
Summary 4
Zusammenfassung 5
Abbreviations 6
1. Introduction 7
2. Materials and methods 9 2.1 Bacterial strains 9
2.2 Plant material 9
2.3 DNA methods 9
2.3.1 Isolation of genomic DNA from Arabidopsis thaliana 10 2.3.2 Polymerase Chain Reaction 10 2.3.3 Southern hybridisation 10
2.4 Cloning 11
2.4.1 Conventional cloning 11 2.4.2 Site directed mutagenesis 11 2.4.3 GATEWAY cloning 11
2.5 RNA methods 12
2.5.1 RNA isolation from plant material 12 2.5.2 cDNA synthesis 12 2.5.3 Semi-quantitative RT-PCR 12 2.5.4 cDNA macroarray analysis of wild type and Atoep16.1-p knockout mutant 12 2.5.5 Affymetrix genechip analysis 13
2.6 Overexpression of recombinant proteins and antibody purification 13
2.6.1 Heterologous expression of proteins in E.coli 14 2.6.2 Inclusion bodies preparation 15 2.6.3 Purification of overexpressed protein 15 2.6.4 Antibody production 15
2.7 GFP, RFP-fusion protein analysis 16
2.7.1 Cloning of constructs with the C-terminal reporter protein fusions 16 2.7.2 Biolistic bombardment 16
2.7.2.1 DNA coating on the gold particles 16 2.7.2.2 DNA bombardment 17
2.7.3 Arabidopsis protoplasts isolation and PEG-mediated DNA transformation 17 2.7.4 Fluorescent microscopy 17
2.8 Promoter-GUS analysis 18
2.8.1 Construction of plasmids 18 2.8.2 Transformation of Agrobacterium tumefaciens 18
2
2.8.3 Stable transformation of Arabidopsis with floral dip method 19 2.8.4 GUS – staining 19 2.8.5 In vitro pollen tube germination 19
2.9 Isolation of organelles and suborganellar fractions 20
2.9.1 Isolation of intact chloroplasts from Arabidopsis 20 2.9.2 Isolation of mitochondria from Arabidopsis 20 2.9.3 Isolation of chloroplastic fractions from pea 21 2.9.4 Isolation of membrane fraction proteins from pea and Arabidopsis 21
2.10 PAGE and Immunoblotting 22
2.11 T-DNA knockout mutants 22
2.11.1 Screening of the Atoep16.1-p knockout mutant 22 2.11.2 Conventional screening of the Arabidopsis knockout mutants 24 2.11.3 Abs Arabidopsis double knockout mutant generation 25
2.12 In silico analysis 25
3. Results 26 3.1 Characterisation of the OEP16 protein family 27
3.1.1 The OEP16 protein from Pisum sativum 27
3.1.1.1 Decomposition of fluorescence spectra of the PsOEP16 protein 27 3.1.1.2 Topology model of PsOEP16 protein 28
3.1.2 The OEP16 protein family from Arabidopsis thaliana 28
3.1.2.1 In silico protein sequence analysis of the Arabidopsis OEP16 orthologs 29
3.1.2.2 Isolation of AtOEP16.1, AtOEP16.2, AtOEP16.3 and AtOEP16.4 31
3.1.2.3 Intracellular distribution of the AtOEP16 proteins 34 A) Intracellular localization via GFP-protein fusion 34 B) Immunoblot analysis of subcellular localization of the AtOEP16 family 39
3.1.2.4 Gene expression patterns of the AtOEP16 family 41 A) Affymetrix analysis of the AtOEP16 family 41 B) RT-PCR analysis of the AtOEP16.1, AtOEP16.2 and AtOEP16.4 distribution in Arabidopsis 42 C) Promoter-GUS analysis of AtOEP16.1, AtOEP16.2 and AtOEP16.4 43
3.1.2.5 Mutants of the AtOEP16 gene family 47 A) Isolation and characterisation of Arabidopsis OEP16.1 knockout
mutants 47 B) cDNA macroarray analysis of the Atoep16.1-p knockout mutant 50
B) Isolation and characterisation of Arabidopsis OEP16.2 knockout mutant 52 C) Isolation and characterisation of Arabidopsis OEP16.4 knockout
mutants 54 E) Double knockout mutants 57
3.1.2.6 Electrophysiological analysis of the recombinant AtOEP16.2 protein 57

3
3.2 OEP37 in Pisum sativum and in Arabidopsis thaliana 58
3.2.1 Isolation of OEP37 from Arabidopsis 58
3.2.2 Subcellular and suborganellar localisation of the AtOEP37 and
PsOEP37 proteins 60
3.2.3 OEP37 expression analysis 62
3.2.3.1 AtOEP37 mRNA distribution within the Arabidopsis plant 62
3.2.3.2 The AtOEP37 gene expression in leaves depending on plant age 63
3.2.3.3 AtOEP37 promoter::GUS analysis 63
3.2.3.4 Tissue-specific expression of the PsOEP37 protein 64
3.2.4 Isolation and characterization of an AtOEP37 knock out mutant 67
3.2.5 Electrophysiological analysis of the recombinant PsOEP37 protein 66
3.3 VDAC in Pisum sativum and Arabidopsis thaliana 68
3.3.1 Pea and Arabidopsis VDAC orthologous proteins 68
3.3.2 Subcellular localization of the VDAC proteins 70
3.3.3 The VDACs mRNA levels in leaves and roots of Arabidopsis 71
4. Discussion 73 4.1 The OEP16 family in pea and Arabidopsis thaliana 73
4.1.1 Structure and topology of the OEP16 proteins 73
4.1.2 Subcellular localization of the AtOEP16.1-4 proteins 75
4.1.3 AtOEP16.1-4 gene expression 75
4.1.4 Arabidopsis OEP16 knockout mutants 80
4.1.5 Proposed function of proteins from the Arabidopsis OEP16 family 81
4.2 OEP37 proteins in pea and Arabidopsis 83
4.3 VDAC proteins in pea and Arabidopsis 84
5 References 85
6 Appendix 92
Curriculum vitae 95
Publications 96
Acknowledgements 97
Ehrenwörtliche Versicherung 98
4
Summary
Channels of the plastid and mitochondrial outer membranes facilitate the turnover of
molecules and ions via these membranes. Although channels have been studied many
questions pertaining to the whole diversity of plastid and mitochondrial channels in
Arabidopsis thaliana and Pisum sativum remain unanswered. In this thesis I studied OEP16,
OEP37 and VDAC families in two model plants, in Arabidopsis and pea.
The Arabidopsis OEP16 family represents four channels of α-helical structure, similar to the
pea OEP16 protein. These channels are suggested to transport amino acids and compounds
with primary amino groups. Immunoblot analysis, GFP/RFP protein fusion expression, as
well as proteomic analysis showed that AtOEP16.1, AtOEP16.2 and AtOEP16.4 are located
in the outer envelope membrane of plastids, while AtOEP16.3 is in mitochondria. The gene
expression and immunoblot analyses revealed that AtOEP16.1 and AtOEP16.3 proteins are
highly abundant and ubiquitous; expression of AtOEP16.1 is regulated by light and cold.
AtOEP16.2 is highly expressed in pollen, seeds and seedlings. AtOEP16.4 is a low expressed
housekeeping protein. Single knockout mutants of AtOEP16.1, AtOEP16.2 and AtOEP16.4,
and double mutants of AtOEP16 gene family did not show any remarkable phenotype.
However, macroarray analysis of Atoep16.1-p T-DNA mutant revealed 10 down-regulated
and 6 up-regulated genes.
In contrast to the α-helical OEP16 proteins, the OEP37 and VDAC proteins are of β-barrel
structure. The PsOEP37 and AtOEP37 channel proteins form a selective barrier in the outer
envelope of chloroplasts. Electrophysiological studies in lipid bilayer membranes showed that
the PsOEP37 channel is permeable for cations. Specific expression profiles showed that
AtOEP37 and PsOEP37 are highly expressed in the entire plant.
The isolated PsVDAC gene encodes a protein, which is located in mitochondria. In
Arabidopsis gene database, five Arabidopsis genes, which code for VDAC-like proteins were
announced. One gene was not detected, whereas four of these genes expressed in leaves,
roots, flower buds and pollen.

5
Zusammenfassung
Kanäle in den äußeren Hülmembranen von Chloroplasten und Mitochondrien ermöglichen
den Transport von Molekülen und Ionen über diese Membranen. Trotz intensiver Forschung
an vielen Kanälen bleiben einige Fragen, die plastidäre und mitochondriale Kanäle betreffen,
offen. In dieser Arbeit habe ich Kanäle der OEP16, OEP37 and VDAC-Familien in zwei
Modellpflanzen Arabidopsis und Erbse untersucht.
Die OEP16 Familie aus Arabidopsis umfasst vier Kanäle mit vorwiegend α-helikaler Struktur.
Auch die Struktur von OEP16 aus Erbse ist vorwiegend α-helikal. Putative Substrate dieser
Kanäle sind Aminosäuren und andere Stoffe mit primären Aminogruppen. Immunoblot
Analysen, GFP/RFP-Fusionen sowie Proteom-Analysen zeigen, dass AtOEP16.1, AtOEP16.2
und AtOEP16.4 in dir äußeren Membran von Plastiden lokalisiert ist, während AtOEP16.3 in
der äußeren Membran von Mitochondrien zu finden ist. Geneexpressionstudien und
Immunoblot Analysen machen deutlich, dass AtOEP16.1 und AtOEP16.3 stark exprimiert
werden und in allen Geweben vorhanden sind. Die Expression von AtOEP16.1 wird durch
Licht und Kälte reguliert. AtOEP16.2 wird stark in Pollen, Samen und Keimlingen exprimiert.
AtOEP16.4 ist überall nur schwachexprimiert. Knock-out Mutanten von AtOEP16.1,
AtOEP16.2 und AtOEP16.4 und Doppelmutanten der AtOEP16-Familie zeigen keinen
Phänotyp. Macroarray-Analysen von AtOEP16.1 T-DNA-Insertionsmutanten ergaben 10
Gene, deren Expression herunterreguliert war und 6 Gene, deren Expression hochreguliert
war.
Im Gegensatz zu den α-helikalen OEP16 Kanälen, bestehen die OEP37 und VDAC Kanäle
vorwiegend aus β-Faltblättern. OEP37 Proteine aus Pisum sativum und Arabidopsis thaliana
bilden eine selektive Barriere in der äußeren Membran von Chloroplasten.
Elektrophysiologische Messungen von PsOEP37 zeigen, dass OEP37 einen Kation-selectiven
Kanal bildet. Expressionstudien ergaben, dass AtOEP37 und PsOEP37 in allen pflanzlichen
Organen stark exprimiert werden.
Das isolierte PsVDAC Gen kodiert für ein Protein, das in der äußeren Hüllmembran von
Mitochondrien lokalisiert ist. In der Arabidopsis Gendatenbank gibt es fünf Gene, die für
VDAC-ähnliche Proteine kodieren. Wärend bei einem Gen der Ort der Expression bis jetzt
nicht nachgewiesen werden konnte, wurde für die vier anderen die Expression in Blättern,
Wurzeln, Blütenknospen und Pollen nachgewiesen.

6
Abbreviations 35S 35S promoter from Cauliflower Mosaic Virus
DLD dihydrolipoamide dehydrogenase
mSSU mature form of SSU
No RT no reverse transcription
OEP outer envelope protein
ON over night
ORF open reading frame
PCR Polymerase Chain Reaction
PEG polyethylene glycol
RT room temperature
SSU small subunit of ribulose 1,5 biphosphate carboxylase-oxygenase (RuBisCo)
VDAC voltage-dependent anion channel
Plant yeast and bacterial species:
At Arabidopsis thaliana
Bi Bromus intermis
Col-0 Columbia-0 ecotype of Arabidopsis
E. coli Escherichia coli
Hv Hordeum vulgaris
Os Oryza sativa
Ps Pisum sativum
Sc Saccharomices cerevisae
WS Wasilevskiya ecotype of Arabidopsis
7
1. Introduction
Biological membranes are built as lipid bilayers. Lipid bilayers show little permeability for
hydrophilic solutes. Therefore, membranes contain channel-forming proteins, which allow
transmembrane passage of molecules. Among the outer membrane proteins of Gram-negative
bacteria are channels, which transport molecules up to 600 Da of size (Delcour, 2002, 2003;
Robertson and Tieleman, 2002; Philippsen et al., 2002; Nikaido 2003; Nestorovich et al.,
2003). A nonspecific channel forming protein, porin from the outer membrane of Salmonella
typhimurium, was discovered in 1976 (Nakae, 1976) and the word “porin” was proposed for
this class of proteins forming nonspecific diffusion channels. Now, several families of
bacterial porins are known: (i) General diffusion pores (OmpF, OmpC, and PhoE from E.
coli), which show general preferences for charge and size of the solute. While OmpF and
OmpC prefer cations over anions, PhoE is anion-selective. Furthermore, OmpF allows the
permeation of slightly larger solutes than OmpC (Watanabe Y et al., 2005). (ii) Slow porins
(OprF from E. coli) which allow a much slower diffusion of small solutes, e.g. the influx of
arabinose was 50 times slower via OprF than through the OmpF channel (Nestorovich et al.,
2003). (iii) Ligand-gated pores, e.g. E. coli ferric enterobactin channels (FepA), providing
energy-dependent uptake of iron into bacteria (Jiang et al., 1997).
Many outer membrane proteins in Gram-negative bacteria are known to form β-barrels. As
shown by X-ray crystallography, these β-barrels are oligomeric, often trimeric structures.
(Hancock et a., 1990; Jeanteur et al., 1991). In contrast to proteins located in outer envelope
membranes, those of inner membrane are mostly α-helical (Sukharev at al., 1997;
Bhattacharjee et al., 2000; Gier 2005).
The ancestral relation between mitochondria and plastids with Gram-negative bacteria
(Osteryoung, 1998) suggests the presence of multiple channel proteins in the chloroplast and
mitochondria outer membranes. Chloroplasts and mitochondria as well as Gram-negative
bacteria, are both surrounded by two membranes, which separate the organelles from the
cytosol and which allow solute translocation between these compartments and the import of
nuclear-encoded proteins.
The outer envelope membrane of chloroplasts has been assumed earlier to be freely permeable
for molecules with a weight up to 10 kDa, whereas the inner envelope membrane of
chloroplasts has been shown to be a main selective barrier for exchange of metabolites
(Flugge et al., 1998). This idea was based on the identification of specific carriers in the inner
envelope membrane, whereas an unselective large conductance allowing the diffusion of

8
molecules was measured in the outer envelope membrane. However, recently, several
channels of the outer envelope of chloroplasts have been characterized at the molecular level.
These channels were named according to their location and their molecular weight. The outer
envelope protein of 16 kDa (OEP16), isolated from pea, is a cation-selective high
conductance channel with permeability to amino acids and compounds with primary amino
groups (Pohlmeyer et al., 1997). OEP21 forms an anion-selective channel with permeability
to triosephostates (Bölter et al., 1999). The OEP24 protein is a non-selective channel, similar
to the general diffusion pores of Gram-negative bacteria (Pohlmeyer et al., 1998). Although
slightly cation-selective, the channel allows the passage of triosephosphates, ATP, PPi,
dicarboxylate, and positively or negatively charged amino acids in a reconstituted system.
OEP37 is a newly identified β-barrel protein from pea of still unknown function (Schleiff et
al., 2003). All chloroplastic channels are encoded in the nucleus.
Porins in the mitochondrial outer membrane show permeability for hydrophilic molecules up
to a molecular mass of 4-5 kDa. They are called voltage-dependent anion-selective channels
(VDAC; Schein et al., 1976; Schein et al., 1976; Colombini, 1979; Benz, 1985). Isolation and
reconstitution of the mitochondrial porins from protist Paramecium (Schein et al., 1976),
yeast (Forte et al., 1987; Ludwig et al., 1988), rice (Colombini et al., 1980), and pea (Schmid
et al., 1992) led to a detailed analysis of their biochemical and biophysical properties. At low
membrane potentials, VDACs are weakly anion-selective in the "open" state. At voltages
higher than 20 mV, the pore switches to the cation-selective "closed" state. The large, water-
filled pore is probably built up by 16 membrane-spanning antiparallel β-strands. The N
terminus of the protein and the large extramembrane loops are located at the cytosolic side of
the membrane (De Pinto et al., 1991). The mitochondrial porins are encoded in the nucleus
without any cleavable N-terminal extensions, similar to chloroplastic outer envelope channels.
Surprisingly to that postulate that VDACs are mitochondrial porins, Fischer et al., (1994)
showed the presence of a VDAC-like porin of 30 kDa in pea root plastids. In vitro synthesized
protein was analyzed in import studies into different plastids and found to be specifically
imported into non-green plastids but not into chloroplasts.
Despite isolation of some genes and proteins of the outer envelope of pea chloroplasts, the
question, whether outer envelope of chloroplasts is a selectivity barrier or not, is still under
doubt. Therefore, the goal of this work was to study the proteins localized in the outer
envelope of chloroplasts, OEP16, OEP37 and VDAC.

9
2 Materials and Methods
2.1 Bacterial strains
For general cloning techniques, the E. coli strains DH5α, TOP10 and TOP10F' (Novagen) and
for overexpression of recombinant proteins E.coli BL21 (DE3) (Novagen) strain were used. E.
coli strains were transformed with use of a heat shock method according to Hanahan (1988).
For stable transformation of Arabidopsis plants, Agrobacterium tumefaciens strain GV3101
containing the binary vector pMP90 (Clough and Bent, 1998) was used.
2.2 Plant material
Two different plants Arabidopsis thaliana and Pisum sativum were used to study the function
or regulation of gene promoters or genes coding for proteins in the outer envelope of
chloroplasts and mitochondria. Growth chambers were supplied with artificial light at a long
day cycle (16-h light / 8-h dark regime) for Arabidopsis thaliana and a 14-h light / 10-h dark
cycle for Pisum sativum. The temperature was maintained at 21°C (day), 16°C (night), unless
stated otherwise. The Arabidopsis ecotypes Columbia (Col-0) and Wasilevskiya (WS) were
used as wild-type (Lehle seeds, USA). Seeds of Arabidopsis were sterilized by rinsing them in
70% (v/v) ethanol for 1 min followed by a rinse in 0.05% (v/v) Triton X-100 for 5 min and
100% ethanol for 10 min. Before plating the seeds on 1 x Murashige Skoog medium (Sigma)
containing 0.5% (w/v) sucrose, 1 x vitamins (Sigma) and 0.8% agar, seeds were washed 5
times with autoclaved ddH2O. Then seed dormancy was broken at 4°C for 3 days.
Germinating seedlings were grown for two weeks on medium before transferring them to soil.
The pea (Pisum sativum L.) cultivar “Golf” (Raiffeisen Nord AG, Kiel) was grown in
vermiculite.
2.3 DNA methods
PCR fragment isolations were made by the NucleoSpin Extract Kit (Qiagen GmbH, Hilden)
according to the manual. Plasmid DNA isolations were made by the Plasmid Mini Kit or
Plasmid Midi Kit (Qiagen GmbH, Hilden) following the manufacturers instructions. DNA
was sequenced using the automated ABI377 sequencing equipment in the lab of Prof. Dr.
Hermann (Botanik I, Botanisches Institut, LMU, München).

10
2.3.1 Isolation of genomic DNA from Arabidopsis thaliana
The rapid plant DNA extraction was carried out according to Edwards et al (1991). One leaf
(~100 mg) was ground in 450 µl extraction buffer containing 200 mM Tris, pH 7.5, 250 mM
NaCl, 25 mM EDTA and 5% SDS and was incubated at 37°C for 5 min. Cell debris was
pelleted by centrifugation for 10 min in a table centrifuge at maximum speed. Then 300 µl
isopropanol was added to 300 µl of the supernatant, transferred to a fresh tube, and DNA was
precipitated for 5 min at room temperature. The DNA precipitate was then sedimented by
centrifugation for 10 min at full speed in a table centrifuge, once washed with ice-cold
ethanol, dried and resuspended in 50 µl H2O. 5 µl were used for PCR experiments.
2.3.2 Polymerase Chain Reaction
PCR was done using Taq DNA polymerase (Eppendorf) with program according to the
manufacturers manual instructions with an annealing temperature 5°C below melting
temperature for primers. The elongation time was calculated by taking 1 min for 1000 bp.
Products of PCR were resolved electrophoretically on 1% agarose gel in TAE buffer. The
synthesis of the oligodesoxyribonucleotids was done in MWG Biotech AG, München.
2.3.3 Southern blotting
Southern blotting was performed for AtOEP16.1 knockout mutant screen. For Southern
hybridizations, PCR products were separated electrophoretically in a 1% agarose gel, which
was after depurination in 0.25 N HCl transferred onto a Hybond-N+ nylon membrane
(Amersham-Pharmacia) using alkali capillary blots (0.4 M NaOH) for 16 hours.
Pre-hybridization was carried out (to prevent non-specific hybridization) at 68°C for 30 min
in prehybridization solution (6xSSC, 10xDenhards, 0.5% SDS, 0.1 mg/ml denaturated salmon
sperm DNA). A DIG-labeled probe for the AtOEP16.1 gene was generated by PCR using Taq
DNA polymerase (Eppendorf) and DIG-11-dUTP as described in Roche Applied Science DIG
System User's Guide for Filter Hybridization. Primers for PCR were At2gN and At2gC (see
primer sequences in Appendix). The DIG-labeled probe was denaturated by boiling and added
in fresh hybridization solution to the blot and hybridized at 68°C overnight. Then the
membrane was washed twice with 2xSSPE/0.1% (w/v) SDS at room temperature (RT), twice
with 1xSSPE/0.1% (w/v) SDS at RT, and once with 0.5xSSPE/0.1% (w/v) SDS at 68°C for
15 min each. After blocking for 30 min in buffer 1, containing 100 mM maleic acid, 150 mM
NaCl, pH 7.5/NaOH, 2.5 % (w/v) milk powder, the membrane was hybridized with Anti-
11
DIG-AP Fab fragments in dilution 1 to 5000 in the buffer 1 at RT for 1 h. After washing in
buffer 1 additionally containing 0.3 % (v/v) Tween 20 the membrane was developed using
NBT and BCIP reagents according to manufacturers instructions.
2.4 Cloning
2.4.1 Conventional cloning
The standard molecular cloning methods (restriction digestion, ligation) were performed
according to Sambrook et al., (1989). All DNA fragments were separated on 1% agarose gels
stained with ethidium bromide (0.5 mg/ml), electrophoresed in TAE buffer (50 x TAE buffer:
242 gm Tris base, 57.1 ml acetic acid, 100 ml 0.1 M EDTA for 1 L ddH2O) and visualized
with an UV transilluminator.
2.4.2 Site directed mutagenesis
To obtain single tryptophan mutants of PsOEP16, polymerase chain reaction (PCR)-based site
directed mutagenesis was used. In the first step, two separate PCR reactions were performed
for each mutant. The OEP16 cDNA inserted in the PET21b expression vector was used as a
template. The primers were, for PsOEP16W77/F mutant, (i) OEP16W77/FN and T7 promoter
primer and (ii) OEP16W77/FC and T7 terminator primer. For PsOEP16W100/F mutant, (i)
OEP16W100/FN and T7 promoter primer and (ii) OEP16W100/FC and T7 terminator primer.
The fragments for the W77F and W100F mutants were then annealed together in a second
PCR step to amplify the complete mutated gene using T7 promoter and terminator primers.
The resulting PCR products were digested with NdeI and XhoI restriction enzymes and ligated
into the corresponding sites of the pET21b expression vector. They were named W77F-
pET21b and W100F-pET21b, respectively. The correct mutations were confirmed by
sequencing.
2.4.3 GATEWAY cloning
For GATEWAY (Invitrogen) cloning attB-PCR products were generated by a two-step
adaptor PCR. The first-step PCR was performed with 10 cycles using primers designed to
have flanking regions with the part of attB recombination sequences, a ribosome-binding site,
the Kozak sequence and the gene-specific open reading frame or promoter region for gene of
interest. Second-step PCR was done for 15 cycles using short attB1adapter and attB2adapter
12
primers containing attB recombination sequences. The attB recombination sequences
conferred directionality to the PCR product. The resulting attB-PCR product was
recombinated with pDONR201 vector (Invitrogen) using BP Clonase (Invitrogen) according
to the instructions of manufacturers. After selection, purification and sequencing, the resulting
clone was then recombinated with a desired binary destination vector with LR Clonase
(Invitrogen). The expression clones were used (i) for the transient expression of the
fluorescent reporter GFP protein fused to the C-terminal part of investigated proteins directed
by 35S CaMV promoter and (ii) for Agrobacterium-mediated stable transformation of plants
for promoter-GUS analysis (see in Appendix list of clones).
2.5 RNA methods
2.5.1 RNA isolation from plant material
Total RNA isolation was performed using RNeasy Plant Mini Kit (Qiagen GmbH, Hilden)
according to the manual's instructions.
2.5.2 cDNA synthesis
cDNA was synthesized using MMLV reverse transcriptase (Promega) and SMART RACE
5'CDS primer for 1,5 h at 42°C with 2 µg total RNA (secondary structure was denaturated for
2 min at 70°C) as a template.
2.5.3 Semi-quantitative RT-PCR
For quantification of all transcripts, RT-PCR was performed with gene-specific primers with
SuperScript One-Step RT-PCR kit (Invitrogen). Total RNA or mRNA was used as a template.
Transcript levels were normalized using actin 2 (At3g18780), actin2/7 (At5g09810) or 18S
rRNA (At2g01010) genes as internal control.
2.5.4 cDNA macroarray analysis of wild-type and Atoep16.1-p knockout
mutant
Experiments were done during my stay in the lab of Dr. Schäffner (GFS Forschungszentrum,
München) within the DFG SPP 1108 project. The macroarray filters containing 600 ESTs
clones of Arabidopsis membrane proteins were supplied by Dr. Schäffner.

13
The cDNA was synthesized using Superscript II RTase (Invitrogen) and mRNA from leaves
of 4-week-old Arabidopsis, isolated using Oligo (dT)25 Dynabeads (Invitrogen), followed by
conventional random primed labelling using DNA labelling kit (Fermentas) with [α-33P]dATP
(50 µCi) according manufacturers protocols. After pre-hybridisation of the cDNA filters for
2,5 hours at 42° C in buffer containing 20x SSC, 100x Denhardt, 20% SDS, 10 mg/ml Salmon
Sperm DNA, the hybridisation of the labeled cDNA to cDNA filters was carried out in the
same buffer at 42 °C over night. Then filters were washed shortly in 2x SSC/0,1% SDS at RT,
followed by 30min in 2x SSC/0,1% SDS at 42°C, shortly in 0,2x SSC/0,1% SDS, 30 min in
0,2x SSC/0,1% SDS at 42°C. Then filters were exposed to an imaging plate ON (Fuji Film).
The radioactive images were obtained with a high-resolution Storm scanner. The mean pixel
intensity within a defined area around each spot was collected using ArrayVision (Amersham
Biosciences). Enhanced or repressed genes in Atoep16.1-p leaves compared with wt leaves
were detected by the Aida program (Tusher et al., 2001).
2.5.5 Affymetrix gene chip analysis
Affymetrix gene chip analysis was done by Dr. Rowena Thomson within DFG
“Schwerpunktprogramm” SPP-1108 “Dynamik und Regulation des pflanzlichen
Membrantransport bei der Ausprägung zell- und orhanspezifischer Eigenschaften”. mRNA
was extracted from leaves and roots of 4-week-old wild-type Arabidopsis plants.
2.6 Overexpression and purification of recombinant proteins
To obtain antisera against the respective OEP16 and OEP37 proteins, recombinant proteins
were overexpressed in E. coli and purified by affinity chromatography.
A 363 bp region of the AtOEP16.1 gene, corresponding to the N-terminal 131 amino acid
residue part of the protein, was amplified by PCR with flanking restriction sites for EcoRI (5’)
and XhoI (3’) and ligated into the pET21b plasmid vector (Novagen). pET21b possesses a C-
terminal tag, consisting of six consecutive histidine residues to facilitate protein purification.
After overexpression in BL21(DE3) E. coli cells (Novagen, see 2.6.2), the AtOEP16.1 protein
was recovered in the form of inclusion bodies (see 2.6.3). It was then denaturalised in a buffer
containing 8 M Urea and the pure protein was isolated using affinity chromatography (see
2.6.4).
The coding sequence of the full-length AtOEP16.2 in pET21d was heterologously
overexpressed in BL21(DH3E) E. coli cells and the protein was purified as described for
14
AtOEP16.1. This purified protein was used for antisera generation as well as for
electrophysiological studies in lipid-bilayers.
The overexpression of the full length coding sequence of AtOEP16.3 and AtOEP16.4 (in
pET21b) in BL21 (DE3) E. coli cells could not be obtained. Therefore, different strains of E.
coli cells and different conditions were tested to get the overexpressed proteins. The E. coli
strains, BL21 Star, BL21 Rosetta and BL21 pMICO (Novagen) were grown at 37°C and
induced at 12°C, 20°C, 37°C with 1mM IPTG. These conditions also failed to overexpress the
proteins. Then the synthesis of proteins in a cell free system using the rapid translation system
RTS 100 E. coli HV kit (Roche) was tested without any success. Therefore, antibodies
directed against peptide of AtOEP16.3 and AtOEP16.4 proteins were raised. The protein
sequences of synthesized peptides (Pineda, Antikörper Service, Berlin) were as follows, (i)
PRVERNVALPGLIRT and (ii) TRVDNGREYYPYTVEKRAE for AtOEP16.3; and for
AtOEP16.4, (i) 15 amino acid residues from the N-terminus starting methionine,
(MEEELLSAVPCSSLT), (ii) 15 amino acid residues from the C-terminus
(VLANCTRTENPNNTN) and (iii) a mixture of both.
For subcloning of PsOEP37, which was originally cloned in pBluescript vector (Schleiff et
al., 2003), a PCR using the forward primer 37peaNdeIf incorporating a NdeI restriction site at
the N terminus and the reverse primer 37peaBamHIr incorporating a BamHI restriction site at
the C-terminus was performed. The resulting fragment was digested with NdeI and BamHI
and ligated into the NdeI-BamHI-digested plasmid vector pET14b (Novagen) containing N-
terminal tag consisting of six consecutive histidine residues (6-His) to facilitate purification.
The plasmid was named PsOEP37/pET14b. The cDNA of AtOEP37 was cloned using the
forward O37araXhoIs and reverse O37araNcoIr primers into pRSETA vector with an N-
terminal 6-His-tag between XhoI (5’) and NcoI (3’) sites for restriction enzymes. The coding
sequence of full-length PsOEP37 in pET14b (Novagen) with a N-terminal 6-His-tag and of
AtOEP37 in pET21b (Novagen) were heterologously overexpressed in BL21(DH3E) E. coli
cells. The proteins were purified as described for AtOEP16.1.
2.6.1 Heterologous expression of proteins in E. coli
The liquid LB broth (3ml, appropriate antibiotic) was inoculated with a single colony of E.
coli BL21(DE3) cells, harbouring the respective plasmid construct and incubated at 37°C with
shaking at 250 rpm for about 3h. Then 1 ml of the culture was inoculated into 500 ml LB
media and shaken at 37°C at 250 rpm for about 3 h to reach an OD600 of 0.8. The expression
of recombinant proteins was induced with 1 mM isopropyl-1-thio-β-D-galactoside (IPTG) for

15
3 hours. Afterwards, bacteria were placed on ice for 5min and harvested by centrifugation at
10000 rpm for 10 min at 4 °C.
2.6.2 Inclusion bodies preparation
Lysis buffer (50 mM TRIS/HCl pH 8.0, 25% (w/v) sucrose, 1 mM EDTA) was added to the
bacterial pellet and resuspended cells were passed through a French Press and three times for
20 sec sonificated. The inclusion bodies were separated from bacterial debris by
centrifugation for 15 min at 20,000 rpm at 4°C and washed once in buffer, containing 20 mM
NaCl, 20 mM TRIS/HCl pH 7.5, 2 mM EDTA, 0.07% (v/v) β-mercaptoethanol, 25 mM
MEGA 9 and twice in buffer, containing 1 mM EDTA, 20 mM TRIS/HCl pH 7.5, 0.07%
(v/v) β-mercaptoethanol, 25 mM MEGA 9. Washing was performed by vortexing for 5 min
and centrifugation at 10,000 rpm for 5 min at 4°C. The detergent was removed by washing of
the inclusion bodies for four times in buffer containing 50 mM TRIS/HCl pH 8.0, 1 mM
EDTA, 10 mM DTT.
2.6.3 Purification of overexpressed protein
The inclusion bodies of a protein having a 6-His-tag on its C- or N-terminal end were
solubilised in the loading/washing buffer containing 20 mM TRIS pH 8.0, 100 mM NaCl, 8
M Urea. After 5 min centrifugation in a table centrifuge at maximum speed, the supernatant
was loaded onto a TALON column (Clohtech), pre-equilibrated with the same buffer. The
bound protein was washed with 10 ml of loading/washing buffer and eluted with a buffer
containing 20 mM TRIS pH 8.0, 100 mM NaCl, 6 M Urea and 100 mM Imidazole. Purified
proteins were tested by SDS PAGE gel analysis.
2.6.4 Antibody production
Antibodies against all purified proteins or peptides were produced in rabbit by Pineda,
Antikörper Service, Berlin. Antibodies were obtained as polyclonal serum of 61-220 days
after immunization and tested by western blotting on the respective antigen or plant tissue.
16
2.7 GFP, RFP-fusion protein analysis
2.7.1 Cloning of constructs with the C-terminal reporter protein fusions
The full length AtOEP16.1 was cloned in two plasmid vectors, pOL-GFP and pOL-RFP
(Asseeva et al., 2004) with a conventional cloning procedure. For PCR, two primers with (i)
5’-introduced site for SpeI restriction (oep16araSpeI) and (ii) 3’-containing site for SalI
(oep16araSalIr) and AtOEP16.1/pCRII as a template were used.
The full length AtOEP16.2 was cloned in pK7FWG2 plasmid vector (Karimi et al., 2005),
which contains C-terminal GFP fusion. It was performed a GATEWAY cloning (see 2.4.3).
As a template for the first round of adaptor PCR, the AtOEP16.2/pET21d plasmid and
16seedGATf and 16seedGAT-stopR were used.
The full length AtOEP16.3 was conventionally cloned into pOL-GFP vector using PCR with
cDNA from Arabidopsis as a template and forward 42210SpeIf primer with restriction sites
for SpeI on 5’ end of PCR product and reverse 42210SalIr primer with sites for SalI
restriction.
The full length AtOEP16.4 was cloned in pK7FWG2 plasmid vector using GATEWAY
cloning procedure. For first round of adaptor PCR, an AtOEP16.4/pET21b template and
62880GATf and 62880GAT-stopR primers were used.
The full length VDAC from pea was cloned into the pOL vector by conventional cloning. For
PCR, a VDAC-GFP2 plasmid (Clausen et al., 2004) as a template and primers introducing (i)
SpeI restriction site on 5’-terminal (VDACSpeIf) of the PCR product and (ii) SalI restriction
site on 3’-terminal (VDACsalIr) were used. See sequences of primers in Appendix.
2.7.2 Biolistic bombardment
2.7.2.1 DNA coating on the gold particles
Gold particles (Biorad) with a diameter of 0.6 micron were suspended at 60 mg/ml in 100%
ethanol and vortexed for 1 min to resuspend and disrupt agglomerated particles. A 35 µl
aliquot of the gold particles was then pelleted at 14,000 rpm for 10 sec in a microcentrifuge,
was washed 2 times in distilled water (with centrifugation steps 14 000 rpm for 1 min) and
mixed with 245 µl DNA of a total concentration of 25-50 µg, 50 µl spermidin (0.1 M) and
250µl CaCl2 (2.5 M). Afterwards, the DNA mixture was continuously vortexed for 30 min at
4°C. The gold with coated DNA was washed two times in 70% ethanol by vortexing for 1 min
and centrifugation for 1 min at full speed in a microfuge and finally resuspended in 72 µl of
100% ethanol. 7 µl aliquots were used for biolistic DNA bombardment. An aliquot of gold

17
coated with DNA was pipetted in the centre of a macrocarrier (Biorad) and left until the
ethanol evaporated.
2.7.2.2 DNA bombardment
The roots of 5-day-old P. sativum plants cut into pieces of 2 cm length and placed on pre-
wetted 1 MM Whatmann paper were bombarded with DNA-gold particles using the Biorad
Biolistic PDS-1000yHE Particle Delivery System. Optimised biolistic parameters were with a
target distance of 6 cm and 1100-psi particle acceleration pressure. After the bombardment
the roots were incubated in the dark at 21°C for 24 hours. Before fluorescent microscopy
roots were fixed in 4% glutaraldehyde (Serva) for 15 min.
2.7.3 Arabidopsis protoplasts isolation and PEG-mediated DNA
transformation
Mesophyll protoplast isolation and transient transformation with plasmid DNA were
performed from leaves of 4-6-week-old Arabidopsis as described in Koop et al., (1996). The
intactness of the protoplasts was controlled by fluorescence microscopy using the chlorophyll
fluorescence as an indicator.
2.7.4 Fluorescent microscopy
The epi-fluorescence microscope (Polychrome IV System, Photonics GmbH) was used for
detection of the GFP fluorescence observed at excitation with the monochromatic laser light
at 470 nm and GFP TILL filter set. Fluorescence of the RFP having constructs and
Mitotracker Orange signals were measured with the monochromatic laser light at 554 nm or
551 nm, respectively, and Phodamine TILL filter set. Pictures were taken using an IR CCD
Camera (Polychrome IV System, Photonics GmbH) mounted on the microscope and operated
by the TILLvisION 4.0 software (Photonics GmbH).

18
2.8 Promoter-GUS analysis
2.8.1 Construction of plasmids
1.5 kb promoter fragments of the AtOEP16.1, AtOEP16.4, AtOEP37 genes and a 0.728 kb
promoter fragment of the AtOEP16.2 gene were amplified by adaptor PCR (see 2.4.3). For
first round of PCR, next primers were used: (i) 16GUSgateF and 16GUSgateR for the
AtOEP16.1 promoter region, (ii) SeedGUSgateF and SeedGUSgateR for the AtOEP16.2
promoter region, (iii) 62GUSgateF and 62GUSgateR for the AtOEP16.4 gene 5’ upstream
region, and (iv) 37GUSgateF and 37GUSgateR for the AtOEP37 promoter region. Primers for
the PCR amplification of the promoter region are listed in Appendix. PCR products cloned by
GATEWAY technology with BP clonase mix into the pDONR201 (Invitrogen) vector
followed by LR clonase recombination with the pKGWFS7 binary destination vector (Karimi
et al., 2005). The resulting AtOEP16.1/pKGWFS7, AtOEP16.2/pKGWFS7,
AtOEP16.4/pKGWFS7 and AtOEP37/pKGWFS7 expression clones possess C-terminal coding
sequence of GUS and GFP.
2.8.2 Transformation of Agrobacterium tumefaciens
Chemically competent Agrobacterium tumefaciens, strain GV3101, possessing the disarmed
Ti plasmid pMP90, were prepared according to Clough et al., (1991). Therefore, inoculated
with GV3101, 5 ml of LB broth supplemented with antibiotics (0,15 mg/ml rifampycin, 15
µg/ml gentamycin) was grown to early saturation stage (1 day) at 28°C with shaking at 200
rpm. Then 2 ml of the culture was inoculated into 50 ml LB broth (0,1 mg/ml rifampycin, 15
µg/ml gentamycin). After the cell density reached OD600 of 1.0 (approximately 4h), the
culture was harvested by centrifugation at 3,000 g for 15 min. The bacterial pellet was
resuspended in 1 ml ice-cold 10 mM CaCl2, aliquoted (100 µl) and frozen in liquid N2. The
cells were stored at – 80°C.
For transformation 1 µg plasmid DNA was pipetted on top of 100 µl frozen agrobacteria and
after 5 min incubation at 37°C, 1 ml LB medium supplemented with rifampycin was added
and the cells were placed on shaker for 3-4 hours at 28°C. Then the Agrobacteria were
pelleted for 2 min at 12,000 g, resuspended in 100 µl LB, plated on LB-rifampicin-
gentamycin-spectinomycin media and grown at 28°C for 3 days. To verify the intactness of
the insert in the binary vector, plasmid mini-prep on the Agrobacterium clone was done and
DNA was then transformed into E. coli DH5α cells. Mini-prep of plasmid from E. coli was
19
used for a control PCR by taking the plasmid specific primers. The prepared glycerol stocks
from the positive clones were used for the transformation of Arabidopsis plants.
2.8.3 Stable transformation of Arabidopsis with floral dip method
The respective transformed Agrobacteria cells were grown at 28°C with 200 rpm shaking in
YEB-rifampycin-kanamycin-spectinomycin media. 25 ml of media was inoculated with 50 µl
glycerol stock culture and was grown overnight. 5 ml overnight culture was transferred into
500 ml broth and was shaken till an OD600 value of 1,2 –1,5 was reached. Then bacteria were
centrifuged for 10 min at 14,000 rpm and the pellet was resuspended in 100 ml inoculation
medium containing 5.0% sucrose and 0.05% (i.e. 500 µl/L) surfactant Silwet L-77 (OSi
Specialties, Inc., Danbury, CT, USA). After growth of Arabidopsis plants for three weeks, the
emerging bolts were cut to induce the growth of secondary bolts. One week after the clipping,
the plants possessing numerous unopened floral buds were submerged into inoculation
medium of Agrobacterium tumefaciens, containing a vector with a promoter of interest. The
plants were then placed on their side and kept at high humidity under plastic wrap. After 24h,
they were uncovered and set upright. Harvested seeds were grown on kanamycin (100 µg/ml)
containing media to select transformants. The presence of transformed T-DNA insertion in
selected transgenic plants was confirmed by PCR. For the GUS-analysis plants of T-2 and T-3
generations were used.
2.8.4 GUS - staining
Plant material was prefixed for 15 minutes in 0.3% paraformaldehyde in X-gluc buffer
containing 100mM NaH2PO4 (pH 7.2), 10mM Na2EDTA, 0.5mM K ferrocyanide, 0.5mM K
ferricyanide and 0.0025% Triton X-100. Tissue was rinsed once with X-gluc buffer and then
stained in 2 mg/ml 5-bromo-4-chloro-3-indoyl glucuronide (X-gluc) in X-gluc buffer. Triton
X-100 for 6-18 hours until the desired intensity of staining was achieved. Stained samples
were rinsed with X-gluc buffer and fixed in 4% paraformaldehyde for 15 min. After rinsing
twice with X-gluc buffer, the samples were incubated in 70% ethanol to remove chlorophyll.
2.8.5 In vitro pollen tube germination
Freshly anther-containing flowers were dipped onto the surface of agar plates (35 mm
diameter Petri dishes) with a thin layer of medium for in vitro pollen germination, containing
5 mM MES (pH 5.8 adjusted with TRIS), 1 mM KCl, 10 mM CaCl2, 0.8 mM MgSO4, 1.5 mM
20
boric acid, 1% (w/v) agar, 16.6% (w/v) sucrose, 3.65% (w/v) sorbitol, and 10 µg ml-1 myo-
inositol to transfer the pollen grains (based upon Fan et al., 2001). Following pollen
application, the dishes were immediately transferred to a chamber at 21 °C with 100% relative
humidity in the light. Germinated pollen were stained for GUS analysis as described in 2.8.4.
2.9 Isolation of organelles and suborganellar fractions
2.9.1 Isolation of intact chloroplasts from Arabidopsis
During the isolation procedure, plant material was kept at 4°C according to Aronsson et al.,
(2002). About 10 g of leaves of Arabidopsis seedlings grown for 10 days on plates with MS
media and 0.5% (w/v) sucrose were homogenised 5 times in a polytron in 20 ml isolation
buffer (0.3 M sorbitol, 5 mM MgCl2, 5 mM EGTA, 5 mM EDTA, 20 mM HEPES/KOH, pH
8.0, 10 mM NaHCO3, 50 mM ascorbic acid) with a subsequent filtration of homogenate
through a double layer of Miracloth. Then the homogenate was centrifuged at 1000 g for 5
min (brake on) and the resuspended chloroplasts were loaded on a two-step gradient which
consisted of a bottom layer (3 ml) comprising 2.55 ml percoll solution (95% (w/v) percoll, 3%
(w/v) PEG 6000, 1% (w/v) ficol, 1% (w/v) BSA) and 0,45 ml gradient mixture (25 mM
HEPES-NaOH, pH 8.0, 10 mM EDTA, 5% (w/v) sorbitol) and the top layer (7 ml)
comprising 2.94 ml percoll solution and 4.06 ml gradient mixture. The two-step gradients
were centrifuged in a swing-out rotor at 1,500 g for 10 min (brake off). Intact chloroplasts
(the band that appeared between the phases) were recovered using a 1-ml Gilson pipette tip,
cut at the end. Then chloroplasts were washed in buffer containing 50 mM HEPES/KOH, pH
8.0, 3 mM MgSO4, 0.3 M sorbitol, 50 mM ascorbic acid) and centrifuged in a swing –out
rotor at 1,000 g for 5 min (brake on). The supernatant was decanted and discarded, and the
pellet was resuspended in the residual washing buffer.
2.9.2 Isolation of mitochondria from Arabidopsis
Mitochondria were isolated from 50 g of leaves of 10-days-old Arabidopsis by grinding with
mortar and pestle as outlined in Day et al., (1985).
2.9.3 Isolation of chloroplastic fractions from pea
Chloroplasts compartments from pea were purified as described in Schleiff et al., (2003).
Therefore, pea leaves were harvested and minced in 15 liter of buffer A (20 mM Mops, 13

21
mM Tris, 0.1 mM MgCl2, 330 mM sorbitol, 0.05% BSA, 0.1 mM PMSF, 2 mM β-
mercaptoethanol, pH 7.9) using a blender. The cell fragments were removed by passing the
solution through four layers of cheesecloth and one layer of 25 µm gaze. The suspension was
pelleted at 1,500 g for 5 min at 4° C. The supernatant was centrifuged again for 5 min at 1,500
g at 4° C, and both pellets were thoroughly resuspended in buffer A, combined and adjusted
to 680 ml. The suspension was layered on top of 34 Percoll gradients formed by 12 ml of 40%
and 7 ml of 80% Percoll in 330 mM sorbitol, 50 mM Mops, 0.1 mM PMSF, 2 mM β-
mercaptoethanol, pH 7.9, and centrifuged for 10 min at 5,000 g. Chloroplasts on top of the
80% Percoll layer were combined and diluted to 1 liter using 330 mM sorbitol, 0.1 mM
PMSF, 2 mM β-mercaptoethanol, pH 7.6. Chloroplasts were repelleted at 2,250 g for 5 min at
4° C. The pellet was resuspended again in 1 liter of buffer, and the process was repeated.
Pellets were resuspended to a final volume of 240 ml in 0.65 M sucrose, 10 mM Tricine, 1
mM EDTA, 0.1 mM PMSF, 2 mM β-mercaptoethanol, pH 7.9, and kept on ice for 10 min.
Chloroplasts were ruptured by 50 strokes in a Dounce homogenizer. The volume was then
adjusted to 720 ml by slow addition of buffer B (10 mM Tricine, 1 mM EDTA, 0.1 mM
PMSF, 2 mM β-mercaptoethanol, pH 7.9), and the suspension was centrifuged for 10 min at
4,000 g at 4° C. The volume of supernatant was adjusted again using buffer B to 720 ml and
centrifuged for 30 min at 30,000 g and 60 min at 150,000 g at 4° C. The pellet was carefully
washed to resuspend the envelopes present on top of the thylakoids. The envelope suspension
was diluted to 120 ml using buffer B, and 10-ml fractions were layered on top of a sucrose
step gradient (8 ml 0.465 M sucrose, 10 ml 0.8 M sucrose, and 8 ml 0.996 M sucrose in buffer
C [10 mM sodium phosphate, 1 mM EDTA, 2 mM β-mercaptoethanol, pH 7.9]). The
gradients were centrifuged for 3 h at 100,000 g at 4° C. The layer on top of the 0.8 M sucrose
layer contained the outer envelope. The chloroplast fractions were collected, diluted three
times using buffer C, and pelleted by centrifugation for 1 h at 100,000 g at 4° C. The pellet
was resuspended in 3 ml of buffer C, directly frozen in liquid nitrogen, and stored at –80° C
for further use. The amount of the outer envelope membranes was determined using the Bio-
Rad protein assay (BioRad, Germany; Bradford 1976).
2.9.4 Isolation of membrane fraction proteins from pea and Arabidopsis
Plant material (100 mg) was grinded in liquid nitrogen and the proteins were extracted by
vortexing for 30 s and incubation for 15 at 4°C in buffer containing 0,05 M TRIS/HCl pH 8.0,
2% LDS and 0,1 mM PMSF. The soluble membrane fraction was separated from cell debris
22
by centrifugation for 15 min at 15000 rpm at 4°C. Protein concentration of membrane fraction
were estimated using the Biorad protein assay reagent (BioRad, Germany; Bradford, 1976),
and 50 mM EDTA and 0,15% DTT (final) were added to rest of the sample which was stored
at – 80°C.
2.10 PAGE and Immunoblotting
Proteins were separated on a 12.5% (w/v) SDS-polyacrylamide gel electrophoresis. Samples
were visualised either by Coomassie blue staining or by Western blotting. After
electrophoresis, proteins were transferred in blotting buffer (0.25 M Tris, 0.192 M glycine,
20% methanol, 0.1% SDS) to a nitrocellulose membrane (Schleier&Schuell) at 300 mA for 1
h. The membrane was blocked using 3% Milk Powder, 0.1% Tween 20 in TN buffer (10 mM
Tris pH 8, 150 mM NaCl) for 1 h at RT to prevent non-specific binding of the antibody,
followed by overnight incubation at 4°C in an 1:1,000 dilution of the primary antibody. After
three washes with 0,1% Tween 20 in TN buffer, the membrane was incubated in TN buffer
containing 3% Milk Powder, 0,1% Tween 20 with secondary antibodies (anti-mouse or anti-
rabbit alkaline phosphatase conjugate, Amersham) for 1 h at RT in an 1:20,000 dilution. Then
the blot was washed for three times with TN buffer, and protein/antibody complex bands were
visualized by detection of alkaline phosphatase activity using 5-bromo-4-chloro-3-indolyl
phosphate/nitroblue tetrasolium as a precipitating substrate (Sigma) in AP buffer (0.1 M Tris,
0.1 M NaCl, 5 mM MgCl2, pH 9.5).
2.11 T-DNA knockout mutants
2.11.1 Screening of the Atoep16.1-p knockout mutant
An Atoep16.1-p knockout mutant was found in the 72960 lines T-DNA library (basta
population) generated in the Rick Amasino lab (Gene Knockout Service Facility of the
AFGC, Biotechnology Center of the University of Wisconsin, USA). The T-DNA library was
generated by transformation of Arabidopsis plants (ecotype WS) with an activation-tagging
vector pSKI015 (GenBank accession AF187951) containing the BAR gene conferring the
basta resistance for plan selection in soil.
The screen of the T-DNA insertion library was performed in two “PCR rounds” (Sussman et
al., 2000), which involved PCR and southern blot analysis of the PCR products. The PCRs
were carried out in the Gene Knockout Service Facility, University of Wisconsin. For
reaction, the pooled Arabidopsis genomic DNA isolated from mutants of the T-DNA insertion
23
library was used as a template. One of two AtOEP16.1 gene-specific primers (forward,
At2gN, or reverse, At2gC) and the T-DNA left border-specific primer JL202 were used to
amplify junction sequence between the T-DNA left border (LB202) and the disrupted
AtOEP16.1 gene.
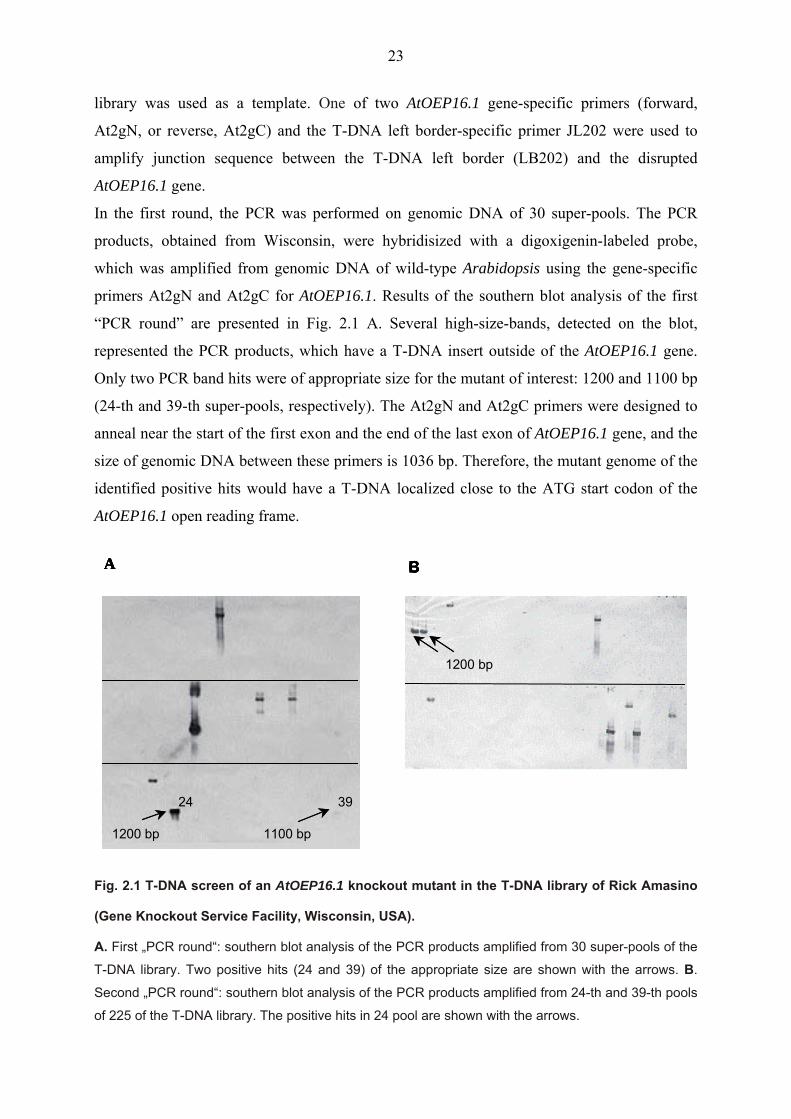
In the first round, the PCR was performed on genomic DNA of 30 super-pools. The PCR
products, obtained from Wisconsin, were hybridisized with a digoxigenin-labeled probe,
which was amplified from genomic DNA of wild-type Arabidopsis using the gene-specific
primers At2gN and At2gC for AtOEP16.1. Results of the southern blot analysis of the first
“PCR round” are presented in Fig. 2.1 A. Several high-size-bands, detected on the blot,
represented the PCR products, which have a T-DNA insert outside of the AtOEP16.1 gene.
Only two PCR band hits were of appropriate size for the mutant of interest: 1200 and 1100 bp
(24-th and 39-th super-pools, respectively). The At2gN and At2gC primers were designed to
anneal near the start of the first exon and the end of the last exon of AtOEP16.1 gene, and the
size of genomic DNA between these primers is 1036 bp. Therefore, the mutant genome of the
identified positive hits would have a T-DNA localized close to the ATG start codon of the
AtOEP16.1 open reading frame.
Fig. 2.1 T-DNA screen of an AtOEP16.1 knockout mutant in the T-DNA library of Rick Amasino
(Gene Knockout Service Facility, Wisconsin, USA).
A. First „PCR round“: southern blot analysis of the PCR products amplified from 30 super-pools of the
T-DNA library. Two positive hits (24 and 39) of the appropriate size are shown with the arrows. B.
Second „PCR round“: southern blot analysis of the PCR products amplified from 24-th and 39-th pools
of 225 of the T-DNA library. The positive hits in 24 pool are shown with the arrows.
CA
1200 bp 1100 bp
24 39
1200 bp
BA
1200 bp 1100 bp
24 39
1200 bp 1100 bp
24 39
1200 bp1200 bp
CA
1200 bp 1100 bp
24 39
1200 bp 1100 bp
24 39
1200 bp1200 bp
BA
1200 bp 1100 bp
24 39
1200 bp 1100 bp
24 39
1200 bp1200 bp1200 bp1200 bp
24
These two super pools (samples 24 and 39) were chosen for a second “PCR round” of the T-
DNA screen. Subsequently, PCR products of the second “PCR round” were used for southern
blot analysis, which resulted in 2 hits of about 1200 bp (Fig. 3.23 B). Unfortunately, the PCR
product corresponding to pool 39 was absent on the blot. Sequencing of the two positive 1200
bp PCR products with the JL202 primer showed that these products represent one identical
line with a T-DNA localized 68 bp upstream of the first ATG codon in the open reading frame
of AtOEP16.1. Therefore, seeds of one mutant line (24-th super pool, 9-th row, G column, P45
plate) were ordered from the Gene Knockout Service Facility, Wisconsin and were used in
further experiments. That mutant line was named Atoep16.1-p.
2.11.2 Conventional screening of the Arabidopsis knockout mutants
Arabidopsis knockout mutant database (SIGnAL with SALK, SAIL, GABI lines) were
searched for lines containing T-DNA insertion in the genes of interest. Seeds of the chosen
lines were ordered and plants were grown, followed by DNA analysis experiments for the
determination of T-DNA presence in the gene of interest. A second knockout mutant of the
AtOEP16.1 locus was found in the T-DNA insertion mutant SALK database. This mutant
line, SALK_024018, was generated by transformation of Arabidopsis plants with the binary
T-DNA vector pROK2, harboring kanamycin resistance to allow the selection of mutants in
Col-0 background. An Atoep16.2 knockout mutant was found by the web search in the
Syngenta’s T-DNA insertion library, which was created by Arabidopsis transformation with
pDAP101 vector (basta resistance) in Col-0 background. Two mutants of AtOEP16.4 locus
were screened, one in SALK database (SALK_109275), and another in Syngenta database
(Garlic 769 E11). A search in the GABI T-DNA insertion library revealed a knockout mutant
line GABI 722C01 (Col-0 background) in the AtOEP37 locus (GABI-Kat, Rosso et al., 2003).
Information about lines, which were used in this work, is summarized in Table 1.1.
Table 1.1 Arabidopsis knockout mutants.
Gene name, T-DNA knockout mutant name; source of mutant line (-1); plasmid, which was used for T-
DNA mutant generation (-2) are given.
gene mutant name source1 plasmid2
1 AtOEP16.1 Atoep16.1-p Gene Knockout Service Facility pSKI015
2 AtOEP16.1 Atoep16.1-e SALK pROK2 3 AtOEP16.2 Atoep16.2 Syngenta pDAP101 4 AtOEP16.4 Atoep16.4-e Syngenta pDAP101 5 AtOEP16.4 Atoep16.4-i SALK pROK2 6 AtOEP37 Atoep37 GABI PGABI1
25
2.11.3 Arabidopsis double knockout mutant generation
For crossing of two individual single knockout lines the female and male parent flowers were
chosen. Flowers of the female parent were not yet self-fertilized, although the stigma was
mature. This was achieved by choosing flowers in which the sepals are still closed, and a
stigma is protruding from the end of the flower. The sepals, petals and stamens were stripped
away from the chosen flowers, leaving the pistil. 4-5 flowers on the same inflorescence was
castrated and crossed. Flowers of the male parent were full-blown with visible pollen on the
anthers. For crossing, the removed whole male flower was dabbed at the stigma of the
castrated female flower. Generated double mutants were named according to the single
mutant names in the following order: female parent/ male parent. The F1 and F2 generation of
the double mutants were tested with PCR for presence T-DNA in both genes, followed by
screening homozygous double knockout lines.
2.12 In silico analysis
Arabidopsis web sites TAIR http://www.arabidopsis.org/
MIPS http://www.mips.biochem.mpg.de/proj/thal/
NASC http://nasc.nott.ac.uk/
Homology search Blast P http://searchlauncher.bcm.tmc.edu/
Secondary structure, PROFsec http://cubic.bioc.columbia.edu/predictprotein/
domains THMM http://www.CBS.dk/
Prosite http://au.expasy.org/prosite/
Subcellular location Target P http://www.cbs.dtu.dk/services/TargetP/
Predator http://www.inra.fr/predator/
Aramemnon http://www.aramemnon.botanik.uni-koeln.de/
Cloro P http://www.cbs.dtu.dk/services/ChloroP/
cis-elements NSITE-PL http://www.softberry.com/ Mutant search SIGnAL (SALK, GABI, SAIL lines) http://signal.salk.edu/
Expression NASCArrays, AtGenExpress
http://affymetrix.arabidopsis.info/narrays/experimentbrowse.pl
• Smith - Gene expression and carbohydrate metabolism through the diurnal cycle.
• Nover - Stress treatments (cold stress).
• Honys - Transcriptome analysis of Arabidopsis microgametogenesis.
• Bergua - Functional genomics of shoot meristem dormancy.
26
3. Results
3.1 Characterization of the OEP16 protein family
3.1.1 The OEP16 protein from Pisum sativum
OEP16, the 16-kDa transmembrane outer envelope protein of chloroplasts, was first identified
in Pisum sativum (Pohlmeyer et al., 1997). PsOEP16 represents a channel, facilitating
metabolic communication between cytosol and chloroplasts, namely by the transport of amino
acids and compounds with primary amino groups via the outer envelope (see Introduction).
PsOEP16 is a cation-selective, high-conductance channel most likely forming dimers for its
function (Pohlmeyer et al., 1997, Steinkamp et al., 2000).
3.1.1.1 Decomposition of fluorescence spectra of the PsOEP16 protein
The open reading frame of the PsOEP16 gene contains two nucleotide triplets encoding for
the aromatic amino acid tryptophan (Trp-77 and Trp-100), which contribute to the intrinsic
fluorescence of the refolded protein by excitation at 280 nm. The emission spectrum of the
tryptophan residues is usually highly dependent on the polarity of the surrounding
microenvironment. Therefore, a study of the contribution of both tryptophan residues in the
fluorescence spectrum of PsOEP16 was performed to elucidate the local tryptophan
environment. For this purpose, two single mutants of PsOEP16 with substitution of the
tryptophans by a phenylalanin residue, Trp-77→Phe-77 (W77F) and Trp-100→Phe-100
(W100F), were constructed by using recombinant PCR and subsequent subcloning into the
pET21b expression vector (see 2.4.2). Then the wild-type PsOEP16 and mutants in pET21b
were overexpressed in BL21 E.coli cells. After reconstitution in a buffer containing 20 mM
HEPES/KOH pH 7.6, 1 mM EDTA, and 0.03% octaethyleneglycol-monododecylether
(C12E8), the refolded proteins were used for fluorescence spectra measurements. All
fluorescence spectra, circular dichroism and stopped flow measurements were done by Dirk
Linke, Max Volmer Laboratorium, Institut für Chemie der Technischen Universität Berlin,
Berlin.
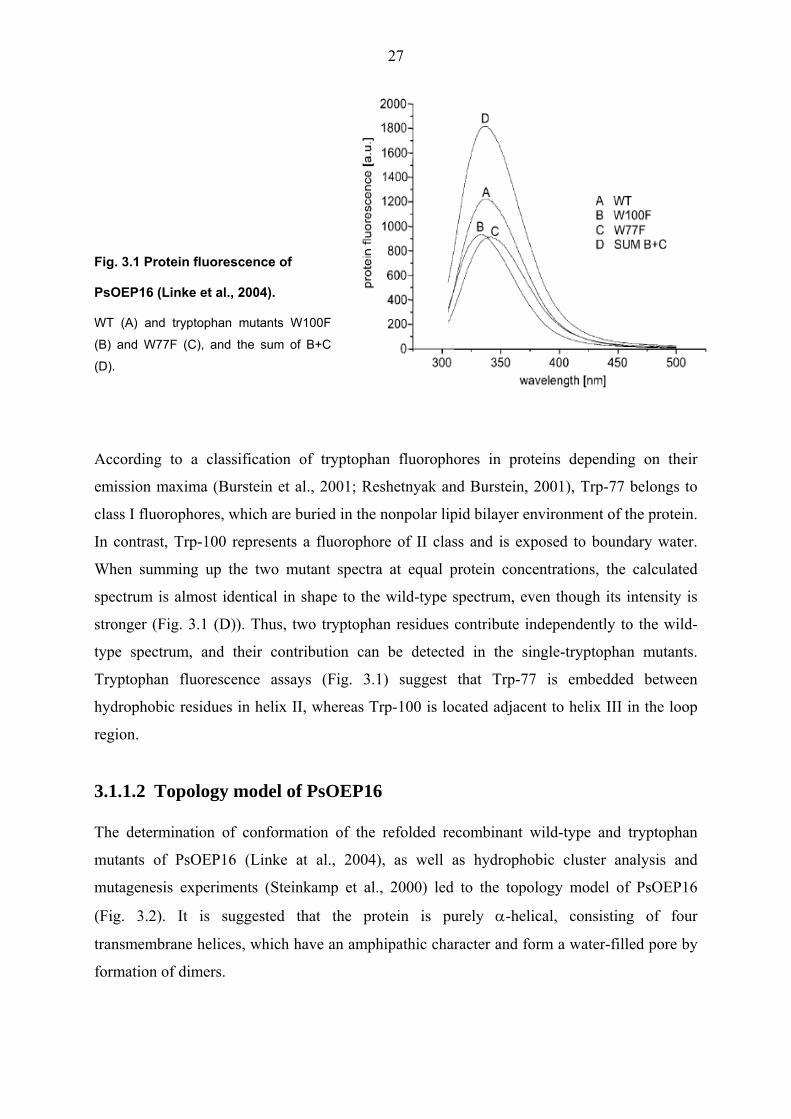
The results show that the wild-type spectrum has its fluorescence maximum at 336 nm (Fig.
3.1). In contrast to this, the emission spectra of the mutants have shifts; W77F has a peak at
340 nm and W100F at 333 nm.
27
Fig. 3.1 Protein fluorescence of
PsOEP16 (Linke et al., 2004).
WT (A) and tryptophan mutants W100F
(B) and W77F (C), and the sum of B+C
(D).
According to a classification of tryptophan fluorophores in proteins depending on their
emission maxima (Burstein et al., 2001; Reshetnyak and Burstein, 2001), Trp-77 belongs to
class I fluorophores, which are buried in the nonpolar lipid bilayer environment of the protein.
In contrast, Trp-100 represents a fluorophore of II class and is exposed to boundary water.
When summing up the two mutant spectra at equal protein concentrations, the calculated
spectrum is almost identical in shape to the wild-type spectrum, even though its intensity is
stronger (Fig. 3.1 (D)). Thus, two tryptophan residues contribute independently to the wild-
type spectrum, and their contribution can be detected in the single-tryptophan mutants.
Tryptophan fluorescence assays (Fig. 3.1) suggest that Trp-77 is embedded between
hydrophobic residues in helix II, whereas Trp-100 is located adjacent to helix III in the loop
region.
3.1.1.2 Topology model of PsOEP16
The determination of conformation of the refolded recombinant wild-type and tryptophan
mutants of PsOEP16 (Linke at al., 2004), as well as hydrophobic cluster analysis and
mutagenesis experiments (Steinkamp et al., 2000) led to the topology model of PsOEP16
(Fig. 3.2). It is suggested that the protein is purely α-helical, consisting of four
transmembrane helices, which have an amphipathic character and form a water-filled pore by
formation of dimers.

28
Fig. 3.2 Topology model of PsOEP16 insertion in the lipid membrane (Linke et al., 2004).
The tryptophan residues 77 and 100 (W) are highlighted, as are charged residues within predicted
transmembrane α-helices. Helix I contains charged residues in a central position, helices II and IV
have similar patterns of charged residues at their ends. IMS, intermembrane space, and cytosol are
indicated. According to Pohlmeyer (1997), the N-terminus is located in the cytosol.
On one hand, the transmembrane domains contain stretches of hydrophobic amino acids
which have contact with the lipid membrane, on the other hand the α-helices I, II and IV
contain charged residues (glutamate, aspartate and lysine). In a functional channel these
charged amino acids are most probably coordinated in a fashion such that positively charged
sidegroups on one helix have their negatively charged counterparts on another helix.
However, the proportion of the negatively charged amino acids is higher and therefore this
could determine the selectivity of PsOEP16 for cations.
3.1.2 The OEP16 protein family from Arabidopsis thaliana
In Pisum sativum only one OEP16 gene has been identified so far. In the Arabidopsis
genome, which tends to have predominance of small multigene families, one could expect to
find several genes encoding orthologous proteins with common features (Cooke et al., 1997).
Indeed, a BLASTP analysis of PsOEP16 against the Arabidopsis genome revealed high
IMS
cytosol
IMS
cytosol

29
similarities to four proteins. On the amino acid level, PsOEP16 showed highest identity to the
gene product of At2g28900 (62%), followed by At4g16160, At3g62880 and At2g42210 (27-
34%). In the following these genes were named AtOEP16.1 (At2g28900), AtOEP16.2
(At4g16160), AtOEP16.3 (At2g42210) and AtOEP16.4 (At3g62880). Table 3.1 summarizes
the obtained BLAST results. In the following these genes were selected for the study as
possible ion channels transporting amino acids across the outer envelope of chloroplasts in
Arabidopsis.
Table 3.1 The genes identified by BLASTP search of the PsOEP16 orthologs in Arabidopsis.
AGI code from the MIPS database, GenBank accession number, amino acid identity and similarity to
PsOEP16 are listed for AtOEP16.1, AtOEP16.2, AtOEP16.3 and AtOEP16.4.
3.1.2.1 In silico protein sequence analysis of Arabidopsis OEP16 orthologs
To predict membrane topology and structure of the above-mentioned proteins, several
approaches were used: an alignment of the protein sequences of PsOEP16 and all four
orthologues from Arabidopsis (Fig. 3.3), the secondary structure prediction (see methods).
It is very likely that all AtOEP16 family proteins are composed of 4 α-helical transmembrane
domains, which are connected by soluble loops exposed to the cytoplasm or intermembrane
space of chloroplasts. Secondary structure analysis showed that the predicted alpha-helical
transmembrane regions of the AtOEP16.1-4 proteins have amphiphilic nature. The N-terminal
soluble regions of AtOEP16.1-4 are predicted to be located in the cytoplasm. The N-termini
vary in length, e.g. 10 (AtOEP16.4), 15 (AtOEP16.3), 24 (PsOEP16 and AtOEP16.1) and 27
(AtOEP16.2) amino acid residues.
46%48%50%79%Amino acid similarity to PsOEP16
27%34%30%62%Amino acid identity to PsOEP16
CAB83138AAM63925.1AAM65873.1AAM60853.1GenBank accesion number
At3g62880At2g42210At4g16160At2g28900AGI code
AtOEP16.4AtOEP16.3AtOEP16.2AtOEP16.1
46%48%50%79%Amino acid similarity to PsOEP16
27%34%30%62%Amino acid identity to PsOEP16
CAB83138AAM63925.1AAM65873.1AAM60853.1GenBank accesion number
At3g62880At2g42210At4g16160At2g28900AGI code
AtOEP16.4AtOEP16.3AtOEP16.2AtOEP16.1
30
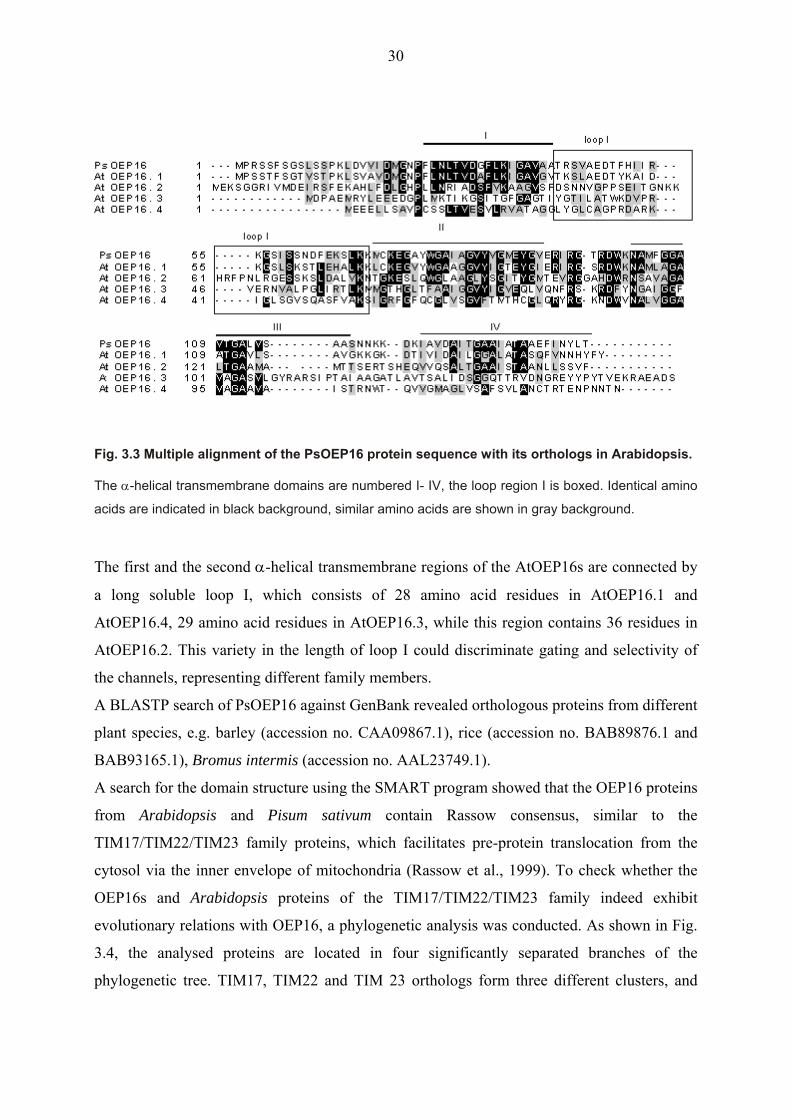
Fig. 3.3 Multiple alignment of the PsOEP16 protein sequence with its orthologs in Arabidopsis.
The α-helical transmembrane domains are numbered I- IV, the loop region I is boxed. Identical amino
acids are indicated in black background, similar amino acids are shown in gray background.
The first and the second α-helical transmembrane regions of the AtOEP16s are connected by
a long soluble loop I, which consists of 28 amino acid residues in AtOEP16.1 and
AtOEP16.4, 29 amino acid residues in AtOEP16.3, while this region contains 36 residues in
AtOEP16.2. This variety in the length of loop I could discriminate gating and selectivity of
the channels, representing different family members.
A BLASTP search of PsOEP16 against GenBank revealed orthologous proteins from different
plant species, e.g. barley (accession no. CAA09867.1), rice (accession no. BAB89876.1 and
BAB93165.1), Bromus intermis (accession no. AAL23749.1).
A search for the domain structure using the SMART program showed that the OEP16 proteins
from Arabidopsis and Pisum sativum contain Rassow consensus, similar to the
TIM17/TIM22/TIM23 family proteins, which facilitates pre-protein translocation from the
cytosol via the inner envelope of mitochondria (Rassow et al., 1999). To check whether the
OEP16s and Arabidopsis proteins of the TIM17/TIM22/TIM23 family indeed exhibit
evolutionary relations with OEP16, a phylogenetic analysis was conducted. As shown in Fig.
3.4, the analysed proteins are located in four significantly separated branches of the
phylogenetic tree. TIM17, TIM22 and TIM 23 orthologs form three different clusters, and
31
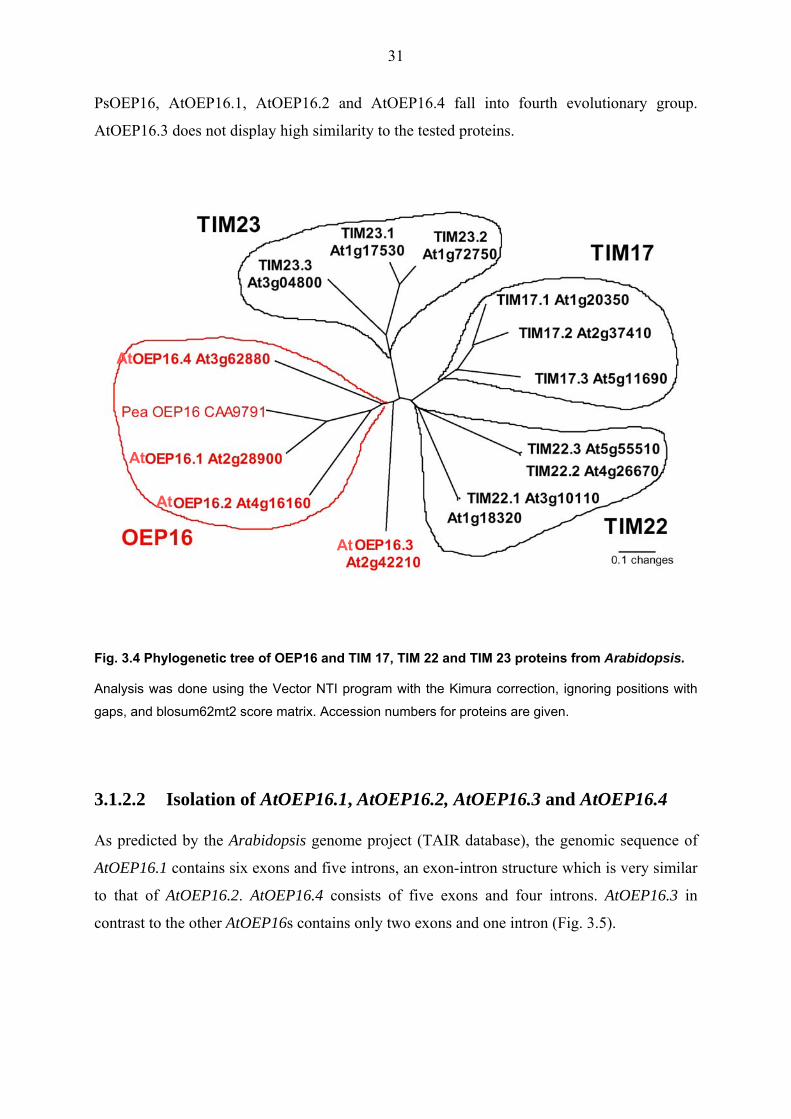
PsOEP16, AtOEP16.1, AtOEP16.2 and AtOEP16.4 fall into fourth evolutionary group.
AtOEP16.3 does not display high similarity to the tested proteins.
Fig. 3.4 Phylogenetic tree of OEP16 and TIM 17, TIM 22 and TIM 23 proteins from Arabidopsis.
Analysis was done using the Vector NTI program with the Kimura correction, ignoring positions with
gaps, and blosum62mt2 score matrix. Accession numbers for proteins are given.
3.1.2.2 Isolation of AtOEP16.1, AtOEP16.2, AtOEP16.3 and AtOEP16.4
As predicted by the Arabidopsis genome project (TAIR database), the genomic sequence of
AtOEP16.1 contains six exons and five introns, an exon-intron structure which is very similar
to that of AtOEP16.2. AtOEP16.4 consists of five exons and four introns. AtOEP16.3 in
contrast to the other AtOEP16s contains only two exons and one intron (Fig. 3.5).
At
At
At
At
At
At
At
At

32
Fig. 3.5 Genomic organisation of AtOEP16.1, AtOEP16.2, AtOEP16.3 and AtOEP16.4.
The 5’ and 3’ untranslated regions (5’ UTR and 3’ UTR, respectively) and several sites for restriction
enzymes are illustrated. Exons are shown as black arrows, introns in grey lines.
The coding regions for AtOEP16.1, AtOEP16.3 and AtOEP16.4 were amplified by PCR from
cDNA synthesized using reverse transcription of total RNA from whole 4-week old
Arabidopsis plants. The PCR primers were designed to introduce appropriate sites for
AtOEP16.1At2g28900
AtOEP16.2At4g16160
AtOEP16.4At3g62880
3' UTR5' UTR
HindIII (125) NcoI (986) Cla I (1471)
Cla I (1912)
ClaI (1972)
Eco RI (1767)HindIII (543)
Hind III (744) HindIII (1710)5' UTR
3' UTR
3' UTR5' UTR
ClaI (365)EcoRI (1162)HindIII (271) HindIII (1484)
AtOEP16.3At2g42210
3' UTR
5' UTRAva I (1025)BamHI (504)Eco RI (121)
Nco I (693) Pst I (1331) Pst I (1650)
AtOEP16.1At2g28900
AtOEP16.2At4g16160
AtOEP16.4At3g62880
3' UTR5' UTR
HindIII (125) NcoI (986) Cla I (1471)
Cla I (1912)
ClaI (1972)
Eco RI (1767)HindIII (543)
Hind III (744) HindIII (1710)5' UTR
3' UTR
Eco RI (1767)HindIII (543)
Hind III (744) HindIII (1710)5' UTR
3' UTR
3' UTR5' UTR
ClaI (365)EcoRI (1162)HindIII (271) HindIII (1484)
3' UTR5' UTR
ClaI (365)EcoRI (1162)HindIII (271) HindIII (1484)
AtOEP16.3At2g42210
3' UTR
5' UTRAva I (1025)BamHI (504)Eco RI (121)
Nco I (693) Pst I (1331) Pst I (1650)
33
restriction enzymes to facilitate the subsequent cloning into different plasmid vectors.
AtOEP16.2 was originally obtained from Dr. T. Kavanagh (Department of Genetics,
University of Dublin, Dublin) as a full-length cDNA clone containing 5' and 3' untranslated
regions cloned between EcoRI (5') and XhoI (3') sites in the pBluescript SK vector.
AtOEP16.2 was subsequently subcloned into the pET21d expression vector. The cloning
strategy and destination vectors for AtOEP16.1-4 are summarized in Table 3.2.
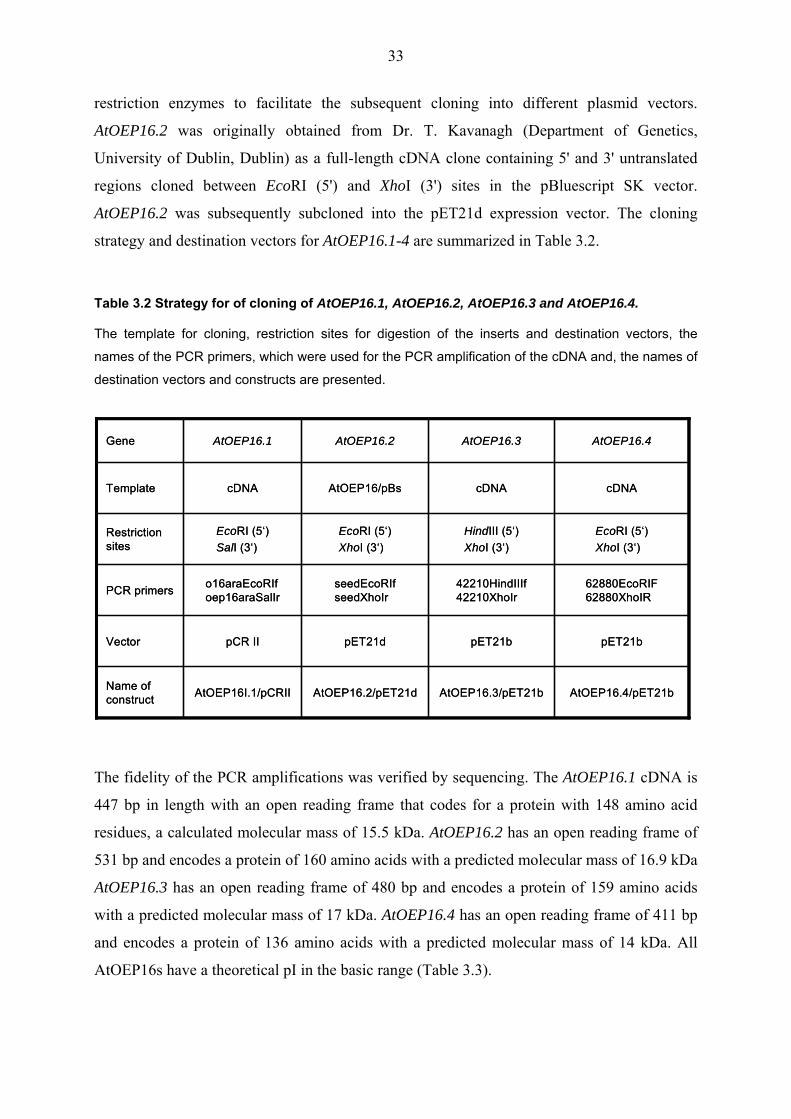
Table 3.2 Strategy for of cloning of AtOEP16.1, AtOEP16.2, AtOEP16.3 and AtOEP16.4.
The template for cloning, restriction sites for digestion of the inserts and destination vectors, the
names of the PCR primers, which were used for the PCR amplification of the cDNA and, the names of
destination vectors and constructs are presented.
The fidelity of the PCR amplifications was verified by sequencing. The AtOEP16.1 cDNA is
447 bp in length with an open reading frame that codes for a protein with 148 amino acid
residues, a calculated molecular mass of 15.5 kDa. AtOEP16.2 has an open reading frame of
531 bp and encodes a protein of 160 amino acids with a predicted molecular mass of 16.9 kDa
AtOEP16.3 has an open reading frame of 480 bp and encodes a protein of 159 amino acids
with a predicted molecular mass of 17 kDa. AtOEP16.4 has an open reading frame of 411 bp
and encodes a protein of 136 amino acids with a predicted molecular mass of 14 kDa. All
AtOEP16s have a theoretical pI in the basic range (Table 3.3).
AtOEP16.4/pET21bAtOEP16.3/pET21bAtOEP16.2/pET21dAtOEP16I.1/pCRIIName of construct
pET21bpET21bpET21dpCR IIVector
62880EcoRIF62880XhoIR
42210HindIIIf42210XhoIr
seedEcoRIfseedXhoIr
o16araEcoRIfoep16araSalIrPCR primers
EcoRI (5‘)XhoI (3‘)
HindIII (5‘)XhoI (3‘)
EcoRI (5‘)XhoI (3‘)
EcoRI (5‘)SalI (3‘)
Restriction sites
cDNAcDNAAtOEP16/pBscDNATemplate
AtOEP16.4AtOEP16.3AtOEP16.2AtOEP16.1Gene
34
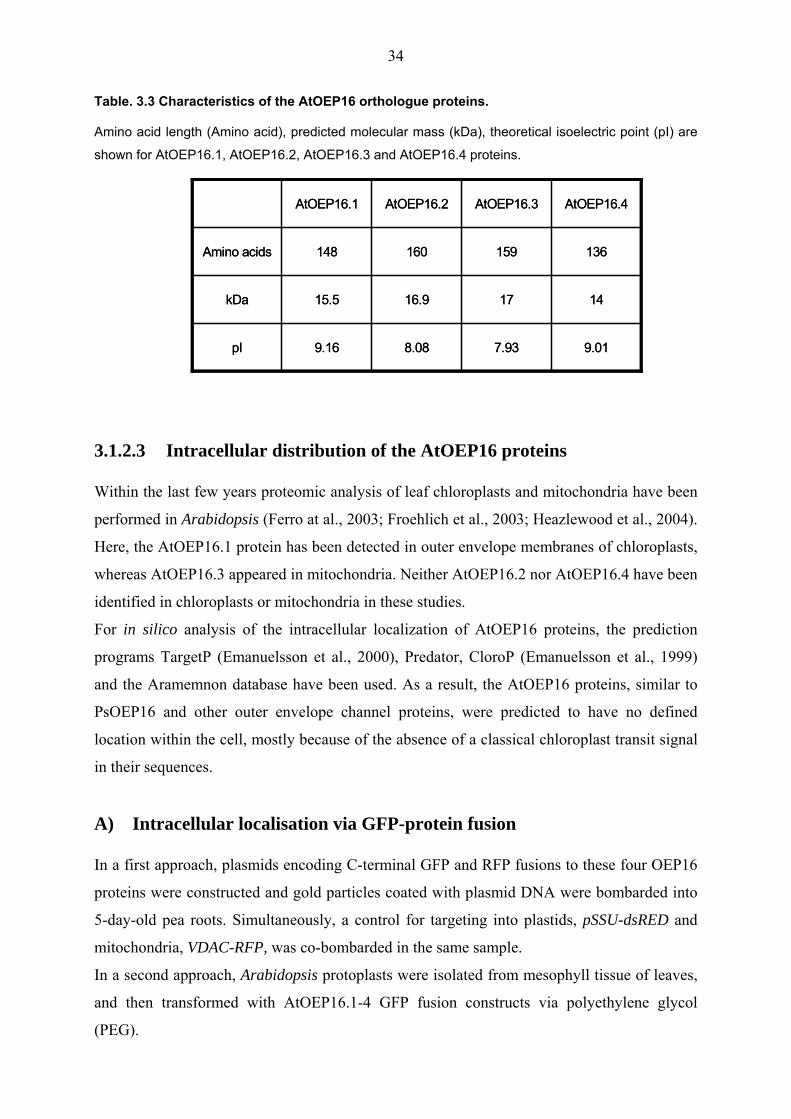
Table. 3.3 Characteristics of the AtOEP16 orthologue proteins.
Amino acid length (Amino acid), predicted molecular mass (kDa), theoretical isoelectric point (pI) are
shown for AtOEP16.1, AtOEP16.2, AtOEP16.3 and AtOEP16.4 proteins.
3.1.2.3 Intracellular distribution of the AtOEP16 proteins
Within the last few years proteomic analysis of leaf chloroplasts and mitochondria have been
performed in Arabidopsis (Ferro at al., 2003; Froehlich et al., 2003; Heazlewood et al., 2004).
Here, the AtOEP16.1 protein has been detected in outer envelope membranes of chloroplasts,
whereas AtOEP16.3 appeared in mitochondria. Neither AtOEP16.2 nor AtOEP16.4 have been
identified in chloroplasts or mitochondria in these studies.
For in silico analysis of the intracellular localization of AtOEP16 proteins, the prediction
programs TargetP (Emanuelsson et al., 2000), Predator, CloroP (Emanuelsson et al., 1999)
and the Aramemnon database have been used. As a result, the AtOEP16 proteins, similar to
PsOEP16 and other outer envelope channel proteins, were predicted to have no defined
location within the cell, mostly because of the absence of a classical chloroplast transit signal
in their sequences.
A) Intracellular localisation via GFP-protein fusion
In a first approach, plasmids encoding C-terminal GFP and RFP fusions to these four OEP16
proteins were constructed and gold particles coated with plasmid DNA were bombarded into
5-day-old pea roots. Simultaneously, a control for targeting into plastids, pSSU-dsRED and
mitochondria, VDAC-RFP, was co-bombarded in the same sample.
In a second approach, Arabidopsis protoplasts were isolated from mesophyll tissue of leaves,
and then transformed with AtOEP16.1-4 GFP fusion constructs via polyethylene glycol
(PEG).
9.017.938.089.16pI
141716.915.5kDa
136159160148Amino acids
AtOEP16.4AtOEP16.3AtOEP16.2AtOEP16.1
9.017.938.089.16pI
141716.915.5kDa
136159160148Amino acids
AtOEP16.4AtOEP16.3AtOEP16.2AtOEP16.1
35
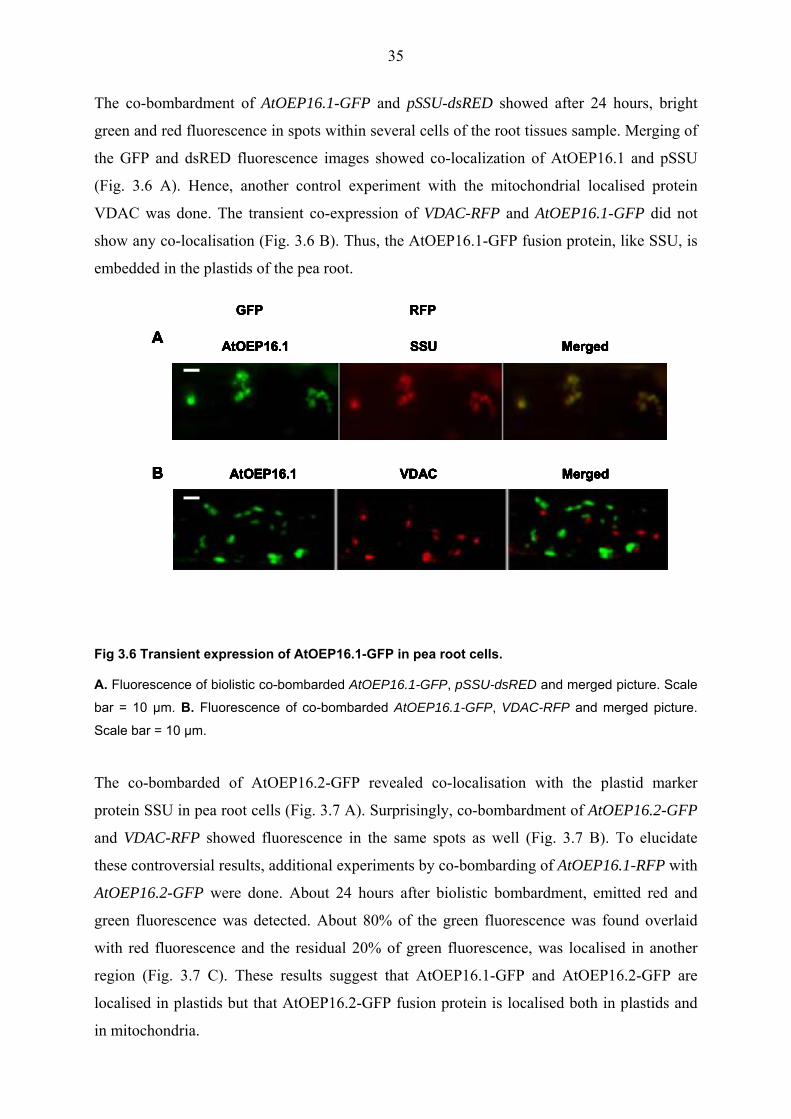
The co-bombardment of AtOEP16.1-GFP and pSSU-dsRED showed after 24 hours, bright
green and red fluorescence in spots within several cells of the root tissues sample. Merging of
the GFP and dsRED fluorescence images showed co-localization of AtOEP16.1 and pSSU
(Fig. 3.6 A). Hence, another control experiment with the mitochondrial localised protein
VDAC was done. The transient co-expression of VDAC-RFP and AtOEP16.1-GFP did not
show any co-localisation (Fig. 3.6 B). Thus, the AtOEP16.1-GFP fusion protein, like SSU, is
embedded in the plastids of the pea root.
Fig 3.6 Transient expression of AtOEP16.1-GFP in pea root cells.
A. Fluorescence of biolistic co-bombarded AtOEP16.1-GFP, pSSU-dsRED and merged picture. Scale
bar = 10 µm. B. Fluorescence of co-bombarded AtOEP16.1-GFP, VDAC-RFP and merged picture.
Scale bar = 10 µm.
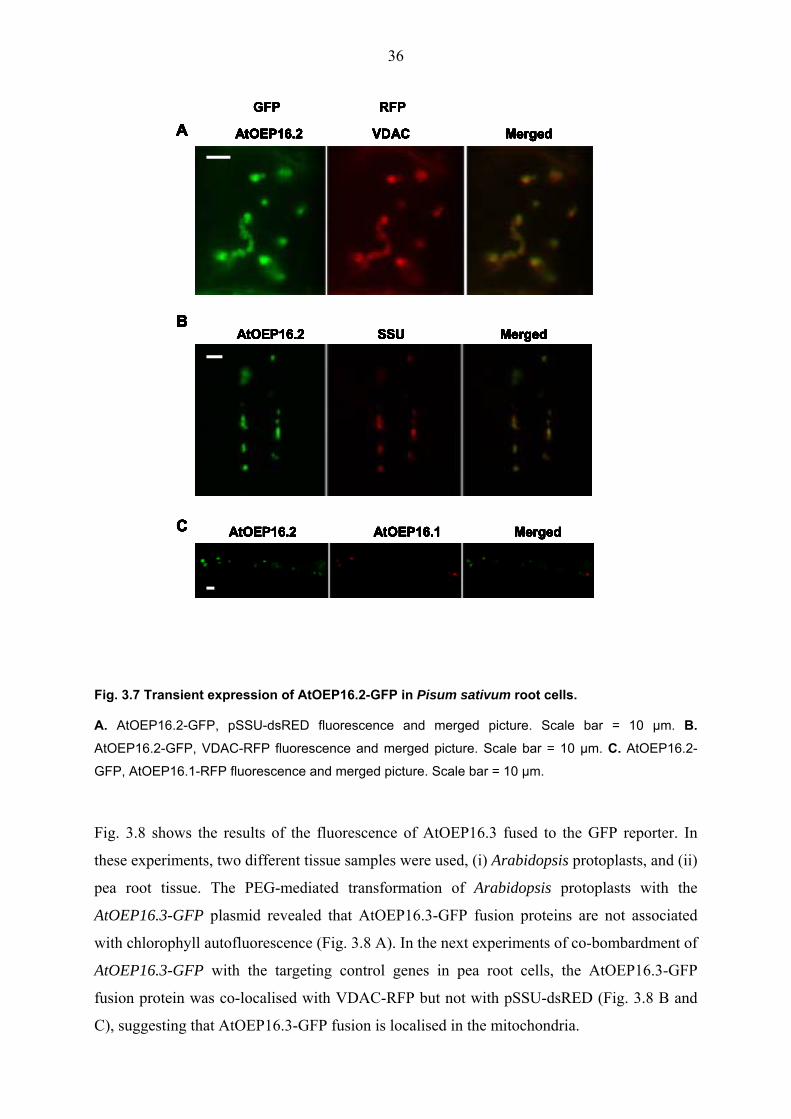
The co-bombarded of AtOEP16.2-GFP revealed co-localisation with the plastid marker
protein SSU in pea root cells (Fig. 3.7 A). Surprisingly, co-bombardment of AtOEP16.2-GFP
and VDAC-RFP showed fluorescence in the same spots as well (Fig. 3.7 B). To elucidate
these controversial results, additional experiments by co-bombarding of AtOEP16.1-RFP with
AtOEP16.2-GFP were done. About 24 hours after biolistic bombardment, emitted red and
green fluorescence was detected. About 80% of the green fluorescence was found overlaid
with red fluorescence and the residual 20% of green fluorescence, was localised in another
region (Fig. 3.7 C). These results suggest that AtOEP16.1-GFP and AtOEP16.2-GFP are
localised in plastids but that AtOEP16.2-GFP fusion protein is localised both in plastids and
in mitochondria.
A
B
AtOEP16.1 SSU Merged
AtOEP16.1 VDAC Merged
GFP RFP
A
B
AtOEP16.1 SSU Merged
AtOEP16.1 VDAC Merged
A
B
AtOEP16.1 SSU Merged
AtOEP16.1 VDAC Merged
GFP RFP
A
B
AtOEP16.1 SSU Merged
AtOEP16.1 VDAC Merged
GFP RFP
A
B
AtOEP16.1 SSU Merged
AtOEP16.1 VDAC Merged
A
B
AtOEP16.1 SSU Merged
AtOEP16.1 VDAC Merged
GFP RFP
36
Fig. 3.7 Transient expression of AtOEP16.2-GFP in Pisum sativum root cells.
A. AtOEP16.2-GFP, pSSU-dsRED fluorescence and merged picture. Scale bar = 10 µm. B. AtOEP16.2-GFP, VDAC-RFP fluorescence and merged picture. Scale bar = 10 µm. C. AtOEP16.2-
GFP, AtOEP16.1-RFP fluorescence and merged picture. Scale bar = 10 µm.
Fig. 3.8 shows the results of the fluorescence of AtOEP16.3 fused to the GFP reporter. In
these experiments, two different tissue samples were used, (i) Arabidopsis protoplasts, and (ii)
pea root tissue. The PEG-mediated transformation of Arabidopsis protoplasts with the
AtOEP16.3-GFP plasmid revealed that AtOEP16.3-GFP fusion proteins are not associated
with chlorophyll autofluorescence (Fig. 3.8 A). In the next experiments of co-bombardment of
AtOEP16.3-GFP with the targeting control genes in pea root cells, the AtOEP16.3-GFP
fusion protein was co-localised with VDAC-RFP but not with pSSU-dsRED (Fig. 3.8 B and
C), suggesting that AtOEP16.3-GFP fusion is localised in the mitochondria.
A
B
C
AtOEP16.2 VDAC Merged
AtOEP16.2 SSU Merged
AtOEP16.2 AtOEP16.1 Merged
GFP RFP
A
B
C
AtOEP16.2 VDAC Merged
AtOEP16.2 SSU Merged
AtOEP16.2 AtOEP16.1 Merged
A
B
C
AtOEP16.2 VDAC Merged
AtOEP16.2 SSU Merged
AtOEP16.2 AtOEP16.1 Merged
GFP RFP
A
B
C
AtOEP16.2 VDAC Merged
AtOEP16.2 SSU Merged
AtOEP16.2 AtOEP16.1 Merged
A
B
C
AtOEP16.2 VDAC Merged
AtOEP16.2 SSU Merged
AtOEP16.2 AtOEP16.1 Merged
GFP RFP
A
B
C
AtOEP16.2 VDAC Merged
AtOEP16.2 SSU Merged
AtOEP16.2 AtOEP16.1 Merged
A
B
C
AtOEP16.2 VDAC Merged
AtOEP16.2 SSU Merged
AtOEP16.2 AtOEP16.1 Merged
GFP RFP
A
B
C
AtOEP16.2 VDAC Merged
AtOEP16.2 SSU Merged
AtOEP16.2 AtOEP16.1 Merged
A
B
C
AtOEP16.2 VDAC Merged
AtOEP16.2 SSU Merged
AtOEP16.2 AtOEP16.1 Merged
GFP RFP
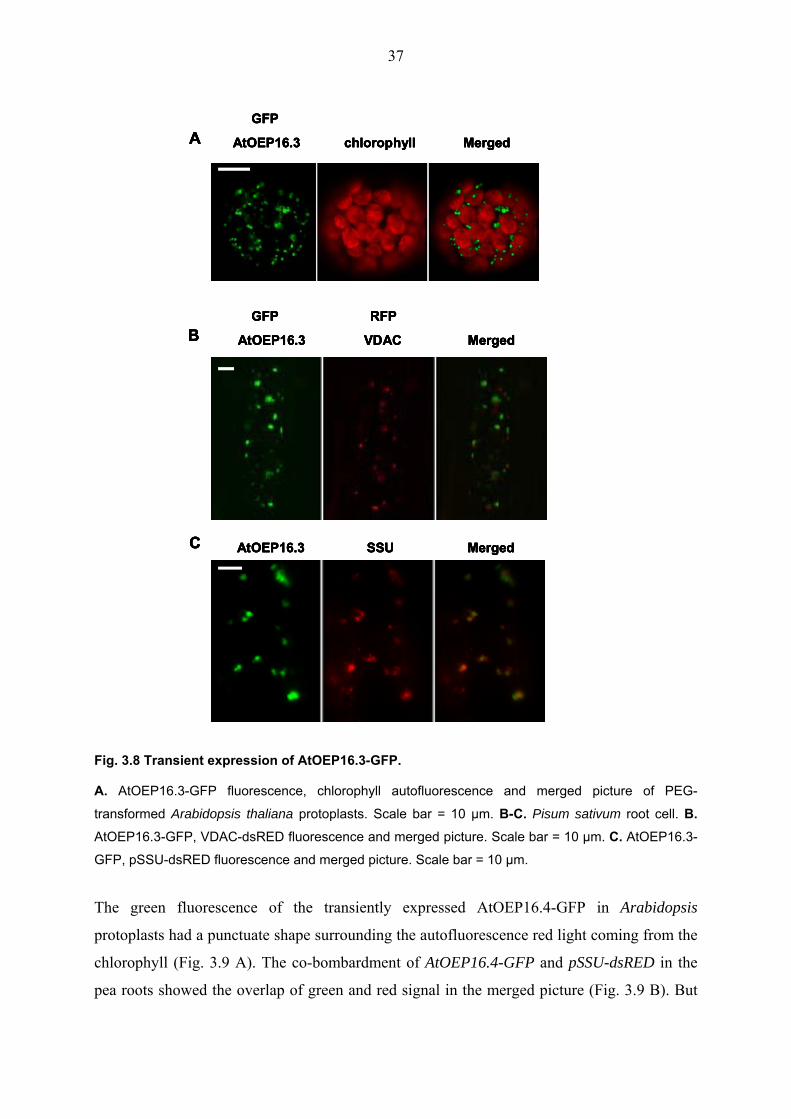
37
Fig. 3.8 Transient expression of AtOEP16.3-GFP.
A. AtOEP16.3-GFP fluorescence, chlorophyll autofluorescence and merged picture of PEG-
transformed Arabidopsis thaliana protoplasts. Scale bar = 10 µm. B-C. Pisum sativum root cell. B. AtOEP16.3-GFP, VDAC-dsRED fluorescence and merged picture. Scale bar = 10 µm. C. AtOEP16.3-
GFP, pSSU-dsRED fluorescence and merged picture. Scale bar = 10 µm.
The green fluorescence of the transiently expressed AtOEP16.4-GFP in Arabidopsis
protoplasts had a punctuate shape surrounding the autofluorescence red light coming from the
chlorophyll (Fig. 3.9 A). The co-bombardment of AtOEP16.4-GFP and pSSU-dsRED in the
pea roots showed the overlap of green and red signal in the merged picture (Fig. 3.9 B). But
A
B
C
AtOEP16.3 VDAC Merged
AtOEP16.3 SSU Merged
AtOEP16.3 chlorophyll Merged
GFP
GFP RFP
A
B
C
AtOEP16.3 VDAC Merged
AtOEP16.3 SSU Merged
AtOEP16.3 chlorophyll Merged
GFP
GFP RFP
A
B
C
AtOEP16.3 VDAC Merged
AtOEP16.3 SSU Merged
AtOEP16.3 chlorophyll Merged
GFP
GFP RFP
A
B
C
AtOEP16.3 VDAC Merged
AtOEP16.3 SSU Merged
AtOEP16.3 chlorophyll Merged
GFP
GFP RFP

38
the co-bombardment of AtOEP16.4-GFP with the mitochondrial control also showed the
same pattern (Fig. 3.9 C), suggesting a dual localization for AtOEP16.4.
Fig. 3.9 Transient expression of AtOEP16.4-GFP.
A. AtOEP16.4-GFP fluorescence, chlorophyll autofluorescence and merged picture of PEG-
transformed Arabidopsis thaliana protoplasts. Scale bar = 10 µm. B-C. Pisum sativum root cell. Scale
bar = 10 µm. B. AtOEP16.4-GFP, pSSU-dsRED fluorescence and merged picture. C. AtOEP16.4-
GFP, VDAC-dsRED fluorescence and merged picture.
A AtOEP16.4 chlorophyll Merged
C AtOEP16.4 VDAC Merged
B AtOEP16.4 SSU Merged
GFP
GFP RFP
A AtOEP16.4 chlorophyll Merged
C AtOEP16.4 VDAC Merged
B AtOEP16.4 SSU Merged
GFP
GFP RFP
A AtOEP16.4 chlorophyll Merged
C AtOEP16.4 VDAC Merged
B AtOEP16.4 SSU Merged
GFP
GFP RFP
A AtOEP16.4 chlorophyll Merged
C AtOEP16.4 VDAC Merged
B AtOEP16.4 SSU Merged
GFP
GFP RFP
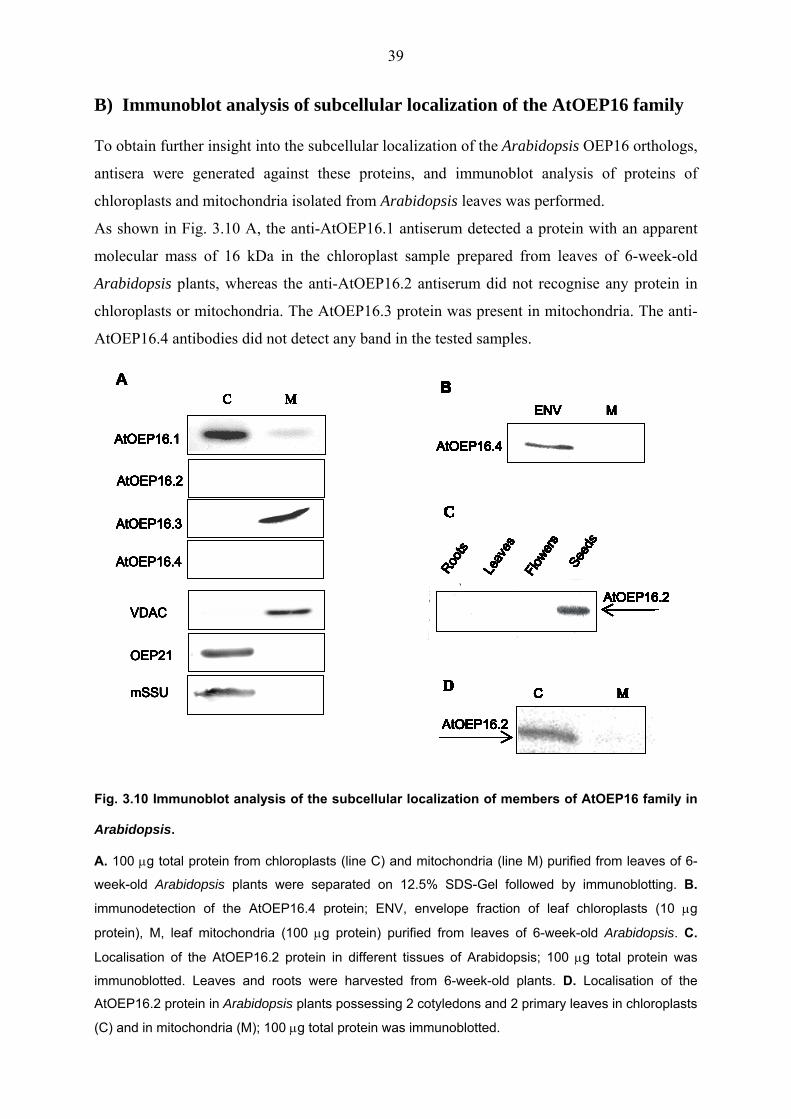
39
B) Immunoblot analysis of subcellular localization of the AtOEP16 family
To obtain further insight into the subcellular localization of the Arabidopsis OEP16 orthologs,
antisera were generated against these proteins, and immunoblot analysis of proteins of
chloroplasts and mitochondria isolated from Arabidopsis leaves was performed.
As shown in Fig. 3.10 A, the anti-AtOEP16.1 antiserum detected a protein with an apparent
molecular mass of 16 kDa in the chloroplast sample prepared from leaves of 6-week-old
Arabidopsis plants, whereas the anti-AtOEP16.2 antiserum did not recognise any protein in
chloroplasts or mitochondria. The AtOEP16.3 protein was present in mitochondria. The anti-
AtOEP16.4 antibodies did not detect any band in the tested samples.
Fig. 3.10 Immunoblot analysis of the subcellular localization of members of AtOEP16 family in
Arabidopsis.
A. 100 µg total protein from chloroplasts (line C) and mitochondria (line M) purified from leaves of 6-
week-old Arabidopsis plants were separated on 12.5% SDS-Gel followed by immunoblotting. B.
immunodetection of the AtOEP16.4 protein; ENV, envelope fraction of leaf chloroplasts (10 µg
protein), M, leaf mitochondria (100 µg protein) purified from leaves of 6-week-old Arabidopsis. C.
Localisation of the AtOEP16.2 protein in different tissues of Arabidopsis; 100 µg total protein was
immunoblotted. Leaves and roots were harvested from 6-week-old plants. D. Localisation of the
AtOEP16.2 protein in Arabidopsis plants possessing 2 cotyledons and 2 primary leaves in chloroplasts
(C) and in mitochondria (M); 100 µg total protein was immunoblotted.
AtOEP16.2
C
Roots
Leav
esFl
ower
sSe
eds
C MC M
AtOEP16.2
D
AtOEP16.4
BENV M
A
mSSU
OEP21
VDAC
AtOEP16.2
AtOEP16.3
C MC M
AtOEP16.1
AtOEP16.4
AtOEP16.2
C
Roots
Leav
esFl
ower
sSe
eds
AtOEP16.2
C
Roots
Leav
esFl
ower
sSe
eds
AtOEP16.2
C
Roots
Leav
esFl
ower
sSe
eds
AtOEP16.2
C
Roots
Leav
esFl
ower
sSe
eds
C MC M
AtOEP16.2
D C MC M
AtOEP16.2
D C MC M
AtOEP16.2
D
AtOEP16.4
BENV M
AtOEP16.4
BENV M
AtOEP16.4
BENV M
A
mSSU
OEP21
VDAC
AtOEP16.2
AtOEP16.3
C MC M
AtOEP16.1
AtOEP16.2
AtOEP16.3
C MC M
AtOEP16.1
AtOEP16.4
AtOEP16.2
C
Roots
Leav
esFl
ower
sSe
eds
AtOEP16.2
C
Roots
Leav
esFl
ower
sSe
eds
AtOEP16.2
C
Roots
Leav
esFl
ower
sSe
eds
C MC M
AtOEP16.2
D C MC M
AtOEP16.2
D
AtOEP16.4
BENV M
AtOEP16.4
BENV M
AtOEP16.4
BENV M
A
mSSU
OEP21
VDAC
AtOEP16.2
AtOEP16.3
C MC M
AtOEP16.1
AtOEP16.4
AtOEP16.2
C
Roots
Leav
esFl
ower
sSe
eds
AtOEP16.2
C
Roots
Leav
esFl
ower
sSe
eds
AtOEP16.2
C
Roots
Leav
esFl
ower
sSe
eds
AtOEP16.2
C
Roots
Leav
esFl
ower
sSe
eds
AtOEP16.2
C
Roots
Leav
esFl
ower
sSe
eds
AtOEP16.2
C
Roots
Leav
esFl
ower
sSe
eds
AtOEP16.2
C
Roots
Leav
esFl
ower
sSe
eds
C MC M
AtOEP16.2
D C MC M
AtOEP16.2
D C MC M
AtOEP16.2
D C MC M
AtOEP16.2
D
AtOEP16.4
BENV M
AtOEP16.4
BENV M
AtOEP16.4
BENV M
AtOEP16.4
BENV M
A
mSSU
OEP21
VDAC
AtOEP16.2
AtOEP16.3
C MC M
AtOEP16.1
AtOEP16.2
AtOEP16.3
C MC M
AtOEP16.1
AtOEP16.4
AtOEP16.2
C
Roots
Leav
esFl
ower
sSe
eds
AtOEP16.2
C
Roots
Leav
esFl
ower
sSe
eds
AtOEP16.2
C
Roots
Leav
esFl
ower
sSe
eds
C MC M
AtOEP16.2
D C MC M
AtOEP16.2
D
AtOEP16.4
BENV M
AtOEP16.4
BENV M
A
mSSU
OEP21
VDAC
AtOEP16.2
AtOEP16.3
C MC M
AtOEP16.1
AtOEP16.4
AtOEP16.2
C
Roots
Leav
esFl
ower
sSe
eds
AtOEP16.2
C
Roots
Leav
esFl
ower
sSe
eds
AtOEP16.2
C
Roots
Leav
esFl
ower
sSe
eds
AtOEP16.2
C
Roots
Leav
esFl
ower
sSe
eds
AtOEP16.2
C
Roots
Leav
esFl
ower
sSe
eds
AtOEP16.2
C
Roots
Leav
esFl
ower
sSe
eds
AtOEP16.2
C
Roots
Leav
esFl
ower
sSe
eds
C MC M
AtOEP16.2
D C MC M
AtOEP16.2
D C MC M
AtOEP16.2
D C MC M
AtOEP16.2
D
AtOEP16.4
BENV M
AtOEP16.4
BENV M
AtOEP16.4
BENV M
AtOEP16.4
BENV M
A
mSSU
OEP21
VDAC
AtOEP16.2
AtOEP16.3
C MC M
AtOEP16.1
AtOEP16.2
AtOEP16.3
C MC M
AtOEP16.1
AtOEP16.4
AtOEP16.2
C
Roots
Leav
esFl
ower
sSe
eds
AtOEP16.2
C
Roots
Leav
esFl
ower
sSe
eds
AtOEP16.2
C
Roots
Leav
esFl
ower
sSe
eds
AtOEP16.2
C
Roots
Leav
esFl
ower
sSe
eds
C MC M
AtOEP16.2
D C MC M
AtOEP16.2
D
AtOEP16.4
BENV M
AtOEP16.4
BENV M
AtOEP16.4
BENV M
AtOEP16.4
BENV M
A
mSSU
OEP21
VDAC
AtOEP16.2
AtOEP16.3
C MC M
AtOEP16.1
AtOEP16.4
AtOEP16.2
C
Roots
Leav
esFl
ower
sSe
eds
AtOEP16.2
C
Roots
Leav
esFl
ower
sSe
eds
AtOEP16.2
C
Roots
Leav
esFl
ower
sSe
eds
AtOEP16.2
C
Roots
Leav
esFl
ower
sSe
eds
AtOEP16.2
C
Roots
Leav
esFl
ower
sSe
eds
AtOEP16.2
C
Roots
Leav
esFl
ower
sSe
eds
AtOEP16.2
C
Roots
Leav
esFl
ower
sSe
eds
AtOEP16.2
C
Roots
Leav
esFl
ower
sSe
eds
C MC M
AtOEP16.2
D C MC M
AtOEP16.2
D C MC M
AtOEP16.2
D C MC M
AtOEP16.2
D
AtOEP16.4
BENV M
AtOEP16.4
BENV M
AtOEP16.4
BENV M
AtOEP16.4
BENV M
A
mSSU
OEP21
VDAC
AtOEP16.2
AtOEP16.3
C MC M
AtOEP16.1
AtOEP16.2
AtOEP16.3
C MC M
AtOEP16.1
AtOEP16.4
AtOEP16.3
C MC M
AtOEP16.1
AtOEP16.2
AtOEP16.3
C MC M
AtOEP16.1
AtOEP16.4
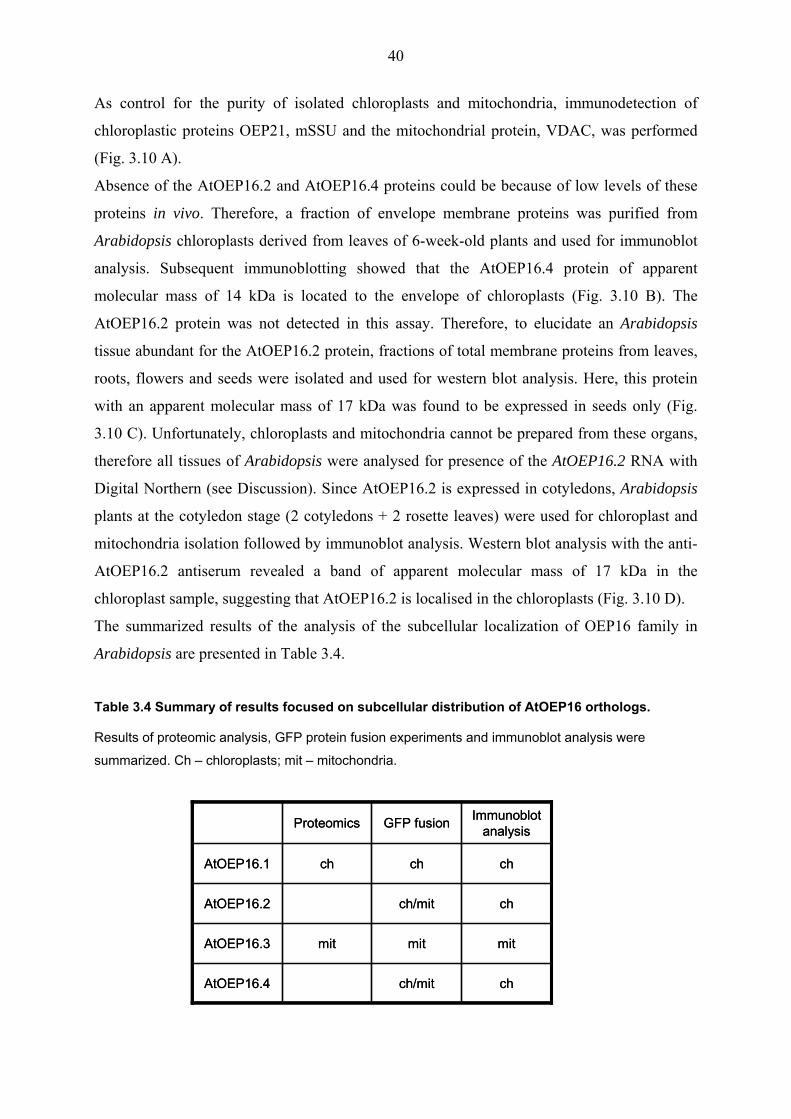
40
As control for the purity of isolated chloroplasts and mitochondria, immunodetection of
chloroplastic proteins OEP21, mSSU and the mitochondrial protein, VDAC, was performed
(Fig. 3.10 A).
Absence of the AtOEP16.2 and AtOEP16.4 proteins could be because of low levels of these
proteins in vivo. Therefore, a fraction of envelope membrane proteins was purified from
Arabidopsis chloroplasts derived from leaves of 6-week-old plants and used for immunoblot
analysis. Subsequent immunoblotting showed that the AtOEP16.4 protein of apparent
molecular mass of 14 kDa is located to the envelope of chloroplasts (Fig. 3.10 B). The
AtOEP16.2 protein was not detected in this assay. Therefore, to elucidate an Arabidopsis
tissue abundant for the AtOEP16.2 protein, fractions of total membrane proteins from leaves,
roots, flowers and seeds were isolated and used for western blot analysis. Here, this protein
with an apparent molecular mass of 17 kDa was found to be expressed in seeds only (Fig.
3.10 C). Unfortunately, chloroplasts and mitochondria cannot be prepared from these organs,
therefore all tissues of Arabidopsis were analysed for presence of the AtOEP16.2 RNA with
Digital Northern (see Discussion). Since AtOEP16.2 is expressed in cotyledons, Arabidopsis
plants at the cotyledon stage (2 cotyledons + 2 rosette leaves) were used for chloroplast and
mitochondria isolation followed by immunoblot analysis. Western blot analysis with the anti-
AtOEP16.2 antiserum revealed a band of apparent molecular mass of 17 kDa in the
chloroplast sample, suggesting that AtOEP16.2 is localised in the chloroplasts (Fig. 3.10 D).
The summarized results of the analysis of the subcellular localization of OEP16 family in
Arabidopsis are presented in Table 3.4.
Table 3.4 Summary of results focused on subcellular distribution of AtOEP16 orthologs.
Results of proteomic analysis, GFP protein fusion experiments and immunoblot analysis were
summarized. Ch – chloroplasts; mit – mitochondria.
chch/mitAtOEP16.4
mitmitmitAtOEP16.3
chch/mitAtOEP16.2
chchchAtOEP16.1
Immunoblot analysisGFP fusionProteomics
chch/mitAtOEP16.4
mitmitmitAtOEP16.3
chch/mitAtOEP16.2
chchchAtOEP16.1
Immunoblot analysisGFP fusionProteomics

41
3.1.2.4 Gene expression patterns of the AtOEP16 family
A) Affymetrix analysis of the AtOEP16 family. With the knowledge that the PsOEP16 protein is expressed in the whole pea plant in equal
amounts (Pohlmeyer et al., 1997), the attention was first turned to the transcript content of the
Arabidopsis OEP16s genes in photosynthetic (leaf) and non-photosynthetic (root) tissues. For
this purpose, Affymetrix gene chip analysis on mRNA samples purified from 4-week old
Arabidopsis leaves and roots was performed. Experiments were done by Dr. Rowena
Thomson (Department Biologie I, Botanik LMU, München) within the DFG SPP-1108
project.
Fig. 3.11 Affymetrix Arabidopsis genome microarray analysis of the AtOEP16.1, AtOEP16.2, AtOEP16.3 and AtOEP16.4 mRNA levels in leaves and roots of 4-week-old Arabidopsis plants. mRNA levels are depicted in arbitrary units. Error bars denote standard deviation SD of n=3 biological
replicas (Dr. Thomson, Dept. Biologie, LMU, München, DFG SPP-1108 project)
Under standard 16-h-photoperiod growth conditions, the AtOEP16.1 and AtOEP16.4 genes
were expressed in relatively same levels in leaves and roots (Fig. 3.11). A signal for the
transcript of the AtOEP16.2 gene in the tested tissues could not be detected, suggesting that
AtOEP16.2 mRNA is absent in leaves and roots of 4-weeks old plants. These results are in
line with immunoblot analysis results (Fig. 3.10). The amount of AtOEP16.3 mRNA was
about 8-10-fold higher than for the AtOEP16.1 and AtOEP16.4 transcript levels and was of
811 ± 50 signal level in leaves and 869.36 ± 56 signal level in roots.
0
200
400
600
800
1000
AtOEP16.1 AtOEP16.2 AtOEP16.3 AtOEP16.4
LeavesRoots
mR
NA
con
tent
( ar b
it ra r
y un
it s)
0
200
400
600
800
1000
AtOEP16.1 AtOEP16.2 AtOEP16.3 AtOEP16.4
LeavesRoots
mR
NA
con
tent
( ar b
it ra r
y un
it s)

42
B) RT-PCR analysis of the AtOEP16.1, AtOEP16.2 and AtOEP16.4
distribution in Arabidopsis.
Since the current study was aimed to investigate the chloroplast localised OEP16 genes, all
following experiments concentrated on the AtOEP16.1, AtOEP16.2 and AtOEP16.4 genes and
gene products. To confirm the results from Affymetrix microarray analysis, RT-PCR assays
on total RNA, isolated from leaves and roots of 4-week-old plants and from flowers and
siliques, was performed. RT-PCR results represent end-point PCR with the quantification not
as exact as Affymetrix.
Fig. 3.12 RT-PCR analysis of the AtOEP16.1, AtOEP16.2 and AtOEP16.4 mRNA in Arabidopsis.
For one-step RT-PCR analysis, 20 ng of total RNA isolated from 4-week-old Arabidopsis was used.
Primers for assay were next: o16araClaIa and o16araXhoIr (for AtOEP16.1), oep16SNBamH1-1 and
oep16scPst1-2 (for AtOEP16.2), 62880XhoIR and 62880EcoRIF (for AtOEP16.4) and 18SF and 18SR
(for 18S rRNA, house-keeping control).
The analysis showed the presence of specific PCR product bands of 400 bp size,
corresponding to the AtOEP16.1, AtOEP16.2 and AtOEP16.4 mRNA (Fig. 3.12). The signal
of the AtOEP16.1 PCR products was strong in roots, leaves, flowers and siliques. The
AtOEP16.2 mRNA amplification gave weak signals in the flowers and siliques only. The
presence of the AtOEP16.4 PCR product was detected in all tissues. In roots, leaves and
flowers the AtOEP16.4 signals were weak, whereas in siliques it was strong. 18S rRNA was
used as a house-keeping control in this assay. These results confirmed the Affymetrix results
and revealed expression of AtOEP16.2 in flowers and siliques.
AtOEP16.1
AtOEP16.2
AtOEP16.4
18S rRNA
Roots
Leav
esFl
ower
sSi
lique
sNo R
NA
AtOEP16.1
AtOEP16.2
AtOEP16.4
18S rRNA
Roots
Leav
esFl
ower
sSi
lique
sNo R
NA
AtOEP16.1
AtOEP16.2
AtOEP16.4
18S rRNA
Roots
Leav
esFl
ower
sSi
lique
sNo R
NA
AtOEP16.1
AtOEP16.2
AtOEP16.4
18S rRNA
Roots
Leav
esFl
ower
sSi
lique
sNo R
NA
43
C) Promoter-GUS analysis of AtOEP16.1, AtOEP16.2 and AtOEP16.4
For further analysis, the expression patterns and functional role of the AtOEP16s promoters
were examined. For this purpose the promoter regions of AtOEP16.1, AtOEP16.2 and
AtOEP16.4 were fused to the b-glucuronidase (GUS) reporter gene uidA in the pKGWFS7
vector (Karimi et al., 2005). Plasmid DNA was then transferred to Arabidopsis plants via floral
dip infiltration, mediated by Agrobacterium tumefaciens to allow expression of the
promoter::GUS fusion protein under control of the respective OEP16 promoters.
Histochemical staining of 8 independent transgenic Arabidopsis lines of T1 and T2 progeny
harboring the AtOEP16.1 promoter::GUS construct gave intensive blue staining in the
different organs of the plant at different developmental stages (Fig. 3.13). In the flowers GUS
expression was detected in the vegetative tissues, e.g. in the flower stalks of the flower buds
(Fig. 3.13 A, B), in the filaments of the stamens (Fig. 3.13 C), in the carpels but not in the
stigma (Fig. 3.13 D), in the siliques (Fig. 3.13 E, F) and in the abscission zone of the petals
and sepals (base of the silique) (Fig. 3.13 E). In the developing and germinating seeds the
GUS staining was observed in the cotyledons of the embryo (Fig. 3.13 G, H). No GUS
activity was detected in the radicle. After germination for 3 days in the light, Arabidopsis
seedlings showed GUS expression in the cotyledons and the primary root, but not in the root
tip (Fig. 3.13 I, J). In older plants, the GUS staining was observed mostly in the hydatodes of
leaves as shown in Fig. 3.13 K-N.

44
Fig. 3.13 β-glucuronidase staining of Arabidopsis transformants harboring AtOEP16.1 promoter::GUS construct. A, B, flower bud(s); C, flower with flower stalk; D, the part of pistil with stigma; E, silique; F, opened
silique with seeds; G, seed with seed coat (stage 0.10), imbibition in water for 3 days; H, seed without
seed coat (stage 0.10), imbibition in water for 3 days; I, J, seedling (stage 1.0), 3 days of imbibition in
water + 3 days of growth in light; K, Arabidopsis plant, stage 1.04; L, leaf of plant in K; M, leaf,
hydatode region. Growth stages are given according to Boyes et al., 2001. Scale bars for A-J and L, N
= 1 mm, for K = 1 cm.
45
The GUS expression under control of the AtOEP16.2 gene promoter region, monitored by
histochemical GUS analysis of the several individual lines of T1 and T2 progeny, transformed
with AtOEP16.2 promoter::GUS construct, showed blue staining in the flowers first when
their stamens are developed (Fig. 3.14 A, B). Here signals were found in the anthers, this blue
staining further could be specified to pollen grains. Observation by microscopy of the flower
staining showed that GUS activity around the carpel stigmas in the flowers and the stigma in
the siliques was due to pollen attached to the stigmas rather than to the stigmas themselves
(Fig. 3.14 J). In the in vitro germinating pollen, AtOEP16.2-GUS expression was detected
also in the emerging and pollen tube (Fig. 3.14 K-N).
The developing and germinating seeds of transgenic plants harboring AtOEP16.2 promoter-
GUS construct were tested for GUS activity. GUS staining was not detected during early
embryogenesis (Fig. 3.14 O), i.e. before pattern formation was completed (Goldberg et al.,
1994). Transformants showed intense staining in maturing embryos or in desiccating seeds
(Fig. 3.14 P, R). Germinating seeds showed the same embryo-staining patterns (Fig. 3.14 S,
T). A significant level of GUS staining was detectable in seeds after imbibition on water
medium at 4° C for 3 days. No staining was observed in the seed coat of developing or
germinating seeds. After germination the 2-cotyledon-seedlings and plants of next
developmental stages express GUS in the cotyledons and hypocotyl (Fig. 3.14 U-W). No
GUS activity was detected and rosette or cauline leaves nor in roots (Fig. 3.14 V). Therefore,
AtOEP16.2 expression was regulated in a tissue- and time- dependent manner.
Several independent lines of Arabidopsis transformants harboring the 1500 bp promoter
region of the AtOEP16.4 gene, fused to GUS reporter gene, exhibited no GUS staining in all
tissues (data not shown). An analysis of the 1500 bp upstream sequence of the AtOEP16.4
gene revealed a putative TATA box in position of –1242 and several predicted cis-acting
elements, but it seems likely that transcription of AtOEP16.4 gene in Arabidopsis is too low
to detect its with GUS-staining assay.
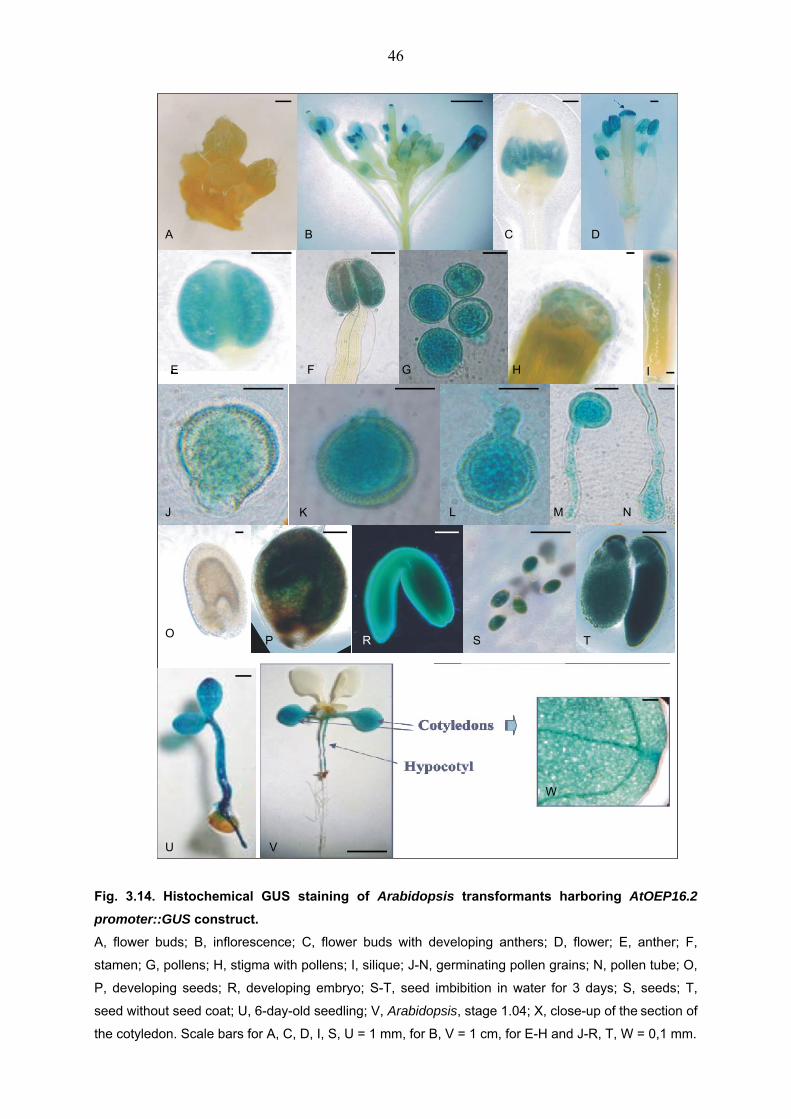
46
Fig. 3.14. Histochemical GUS staining of Arabidopsis transformants harboring AtOEP16.2 promoter::GUS construct. A, flower buds; B, inflorescence; C, flower buds with developing anthers; D, flower; E, anther; F,
stamen; G, pollens; H, stigma with pollens; I, silique; J-N, germinating pollen grains; N, pollen tube; O,
P, developing seeds; R, developing embryo; S-T, seed imbibition in water for 3 days; S, seeds; T,
seed without seed coat; U, 6-day-old seedling; V, Arabidopsis, stage 1.04; X, close-up of the section of
the cotyledon. Scale bars for A, C, D, I, S, U = 1 mm, for B, V = 1 cm, for E-H and J-R, T, W = 0,1 mm.
A B C D
E F G H I
J K L M N
O P R S T
U V
W
A B C D
E F G H I
J K L M N
O P R S T
U V
W
A B C D
E F G H I
J K L M N
O P R S T
U V
W
A B C D
E F G H I
J K L M N
O P R S T
U V
W
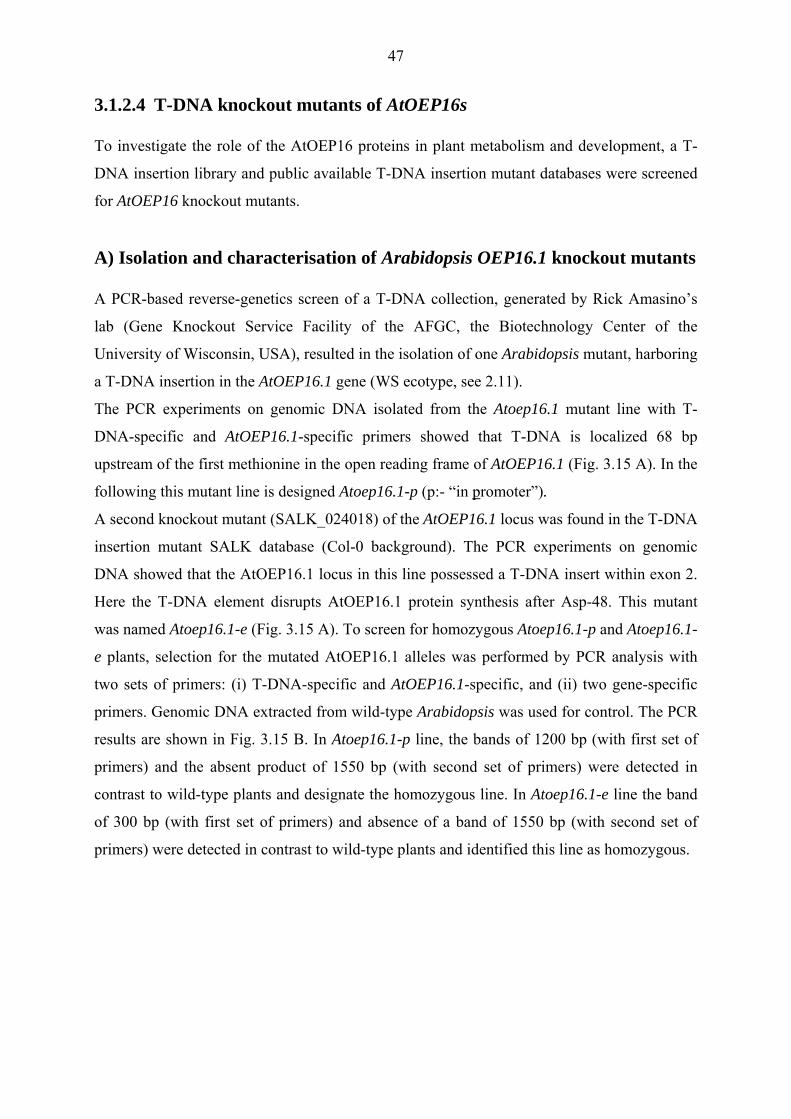
47
3.1.2.4 T-DNA knockout mutants of AtOEP16s
To investigate the role of the AtOEP16 proteins in plant metabolism and development, a T-
DNA insertion library and public available T-DNA insertion mutant databases were screened
for AtOEP16 knockout mutants.
A) Isolation and characterisation of Arabidopsis OEP16.1 knockout mutants
A PCR-based reverse-genetics screen of a T-DNA collection, generated by Rick Amasino’s
lab (Gene Knockout Service Facility of the AFGC, the Biotechnology Center of the
University of Wisconsin, USA), resulted in the isolation of one Arabidopsis mutant, harboring
a T-DNA insertion in the AtOEP16.1 gene (WS ecotype, see 2.11).
The PCR experiments on genomic DNA isolated from the Atoep16.1 mutant line with T-
DNA-specific and AtOEP16.1-specific primers showed that T-DNA is localized 68 bp
upstream of the first methionine in the open reading frame of AtOEP16.1 (Fig. 3.15 A). In the
following this mutant line is designed Atoep16.1-p (p:- “in promoter”).
A second knockout mutant (SALK_024018) of the AtOEP16.1 locus was found in the T-DNA
insertion mutant SALK database (Col-0 background). The PCR experiments on genomic
DNA showed that the AtOEP16.1 locus in this line possessed a T-DNA insert within exon 2.
Here the T-DNA element disrupts AtOEP16.1 protein synthesis after Asp-48. This mutant
was named Atoep16.1-e (Fig. 3.15 A). To screen for homozygous Atoep16.1-p and Atoep16.1-
e plants, selection for the mutated AtOEP16.1 alleles was performed by PCR analysis with
two sets of primers: (i) T-DNA-specific and AtOEP16.1-specific, and (ii) two gene-specific
primers. Genomic DNA extracted from wild-type Arabidopsis was used for control. The PCR
results are shown in Fig. 3.15 B. In Atoep16.1-p line, the bands of 1200 bp (with first set of
primers) and the absent product of 1550 bp (with second set of primers) were detected in
contrast to wild-type plants and designate the homozygous line. In Atoep16.1-e line the band
of 300 bp (with first set of primers) and absence of a band of 1550 bp (with second set of
primers) were detected in contrast to wild-type plants and identified this line as homozygous.

48
Fig. 3.15 The Atoep16.1-p and Atoep16.1-e knockout mutants identification and analysis.
A. Schematic diagram of the T-DNA insert localization (i) at position –68 upstream of the first putative
start codon in the open reading frame of AtOEP16.1 in Atoep16.1-p mutant and (ii) in the second exon
of AtOEP16.1 in Atoep16.1-e mutant. T-DNA disrupts ORF after Asp*48 in Atoep16.1-e mutant. For
the T-DNA orientation, position of left (LB) and right (RB) borders is shown. The ORF for the
AtOEP16.1 gene is depicted in bold. Positions of JL202, At2gC, 28900Fbeg primers are shown. Exons
are shown as black arrows. B. PCR analysis of wild-type and Atoep16.1-p and Atoep16.1-e individual
homozygous lines using following primers pairs for Atoep16.1-p (i) T-DNA specific JL202 and gene-
specific At2gC, and (ii) gene-specific 28900Fbeg and At2gC; and for Atoep16.1-e (i) T-DNA specific
LBb1ROK2 and gene-specific 28900Fbeg, and (ii) gene-specific 28900Fbeg and At2gC. Mut, mutant;
WT, wild-type.
A
B
Ato
ep16
.1-p 3' UTR
5' UTRHindIII(125) Nco I (986) Cla I (1471)
Cla I (1912)
ClaI (1972)
3' UTR5' UTR
HindIII(125) Nco I (986) Cla I (1471)
Cla I (1912)
ClaI (1972)
JL202
At2gC28900Fbeg
Ato
ep16
.1-e
44-
WT
WT
Primers JL202 28900Fbeg for PCR At2gC At2gC
1550 bp1200 bp
Atoep16.1-p
WT
WT
Primers JL202 28900Fbeg for PCR At2gC At2gC
1550 bp1200 bp
mut
mut
WT
WT
LBb1pROK2 28900Fbeg28900Fbeg At2gC
1550 bp300 bp
mut
mu t
Atoep16.1-e
A
B
Ato
ep16
.1-p 3' UTR
5' UTRHindIII(125) Nco I (986) Cla I (1471)
Cla I (1912)
ClaI (1972)
3' UTR5' UTR
HindIII(125) Nco I (986) Cla I (1471)
Cla I (1912)
ClaI (1972)
JL202
At2gC28900Fbeg
Ato
ep16
.1-e
44-44-
WT
WT
Primers JL202 28900Fbeg for PCR At2gC At2gC
1550 bp1200 bp
Atoep16.1-p
WT
WT
Primers JL202 28900Fbeg for PCR At2gC At2gC
1550 bp1200 bp
mut
mut
WT
WT
LBb1pROK2 28900Fbeg28900Fbeg At2gC
1550 bp300 bp
mut
mu t
Atoep16.1-e
WT
WT
Primers JL202 28900Fbeg for PCR At2gC At2gC
1550 bp1200 bp
Atoep16.1-p
WT
WT
Primers JL202 28900Fbeg for PCR At2gC At2gC
1550 bp1200 bp
mut
mut
WT
WT
LBb1pROK2 28900Fbeg28900Fbeg At2gC
1550 bp300 bp
mut
mu t
Atoep16.1-e
WT
WT
LBb1pROK2 28900Fbeg28900Fbeg At2gC
1550 bp300 bp
mut
mu t
Atoep16.1-e
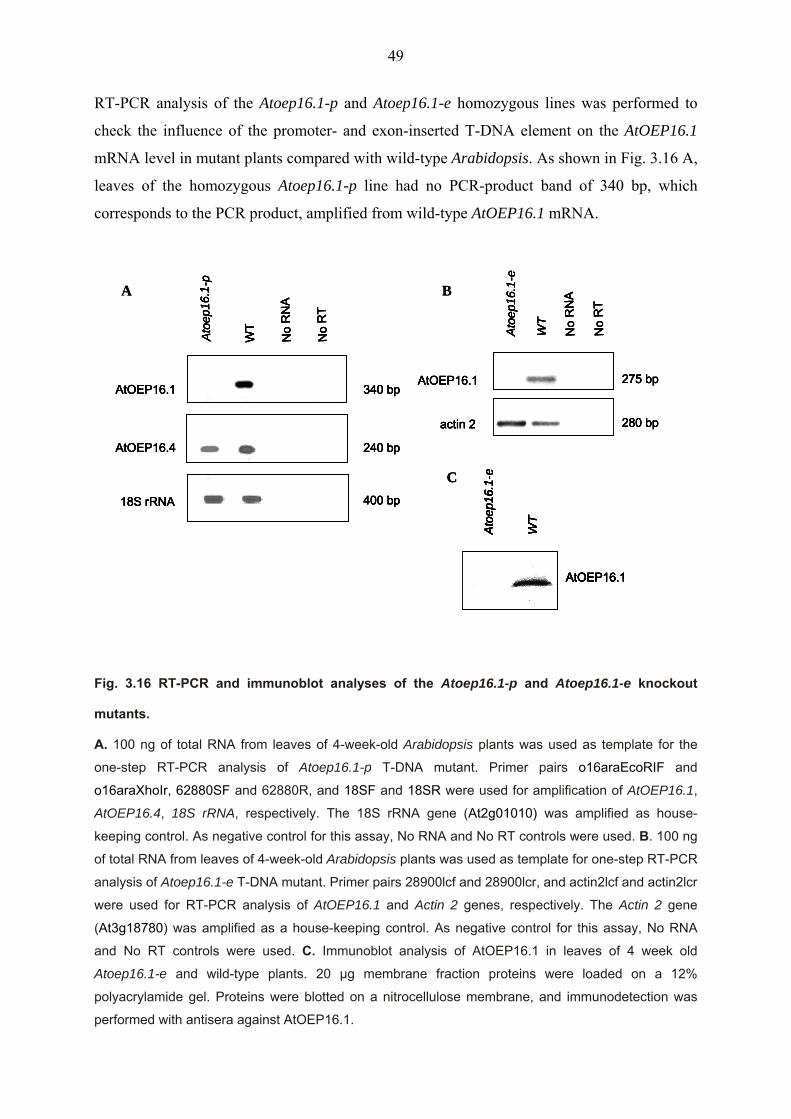
49
RT-PCR analysis of the Atoep16.1-p and Atoep16.1-e homozygous lines was performed to
check the influence of the promoter- and exon-inserted T-DNA element on the AtOEP16.1
mRNA level in mutant plants compared with wild-type Arabidopsis. As shown in Fig. 3.16 A,
leaves of the homozygous Atoep16.1-p line had no PCR-product band of 340 bp, which
corresponds to the PCR product, amplified from wild-type AtOEP16.1 mRNA.
Fig. 3.16 RT-PCR and immunoblot analyses of the Atoep16.1-p and Atoep16.1-e knockout
mutants.
A. 100 ng of total RNA from leaves of 4-week-old Arabidopsis plants was used as template for the
one-step RT-PCR analysis of Atoep16.1-p T-DNA mutant. Primer pairs o16araEcoRIF and
o16araXhoIr, 62880SF and 62880R, and 18SF and 18SR were used for amplification of AtOEP16.1,
AtOEP16.4, 18S rRNA, respectively. The 18S rRNA gene (At2g01010) was amplified as house-
keeping control. As negative control for this assay, No RNA and No RT controls were used. B. 100 ng
of total RNA from leaves of 4-week-old Arabidopsis plants was used as template for one-step RT-PCR
analysis of Atoep16.1-e T-DNA mutant. Primer pairs 28900lcf and 28900lcr, and actin2lcf and actin2lcr
were used for RT-PCR analysis of AtOEP16.1 and Actin 2 genes, respectively. The Actin 2 gene
(At3g18780) was amplified as a house-keeping control. As negative control for this assay, No RNA
and No RT controls were used. C. Immunoblot analysis of AtOEP16.1 in leaves of 4 week old
Atoep16.1-e and wild-type plants. 20 µg membrane fraction proteins were loaded on a 12%
polyacrylamide gel. Proteins were blotted on a nitrocellulose membrane, and immunodetection was
performed with antisera against AtOEP16.1.
A
Ato
ep16
.1-e
WT
275 bp
280 bp
AtOEP16.1
actin 2
No
RN
A
No
RT
Ato
ep16
.1-e
WT
B
275 bp
280 bp
AtOEP16.1
actin 2
No
RN
A
No
RT
AtOEP16.1
CA
toep
16.1
-e
WT
AtOEP16.1
Ato
ep16
.1-e
WT
AtOEP16.1
Ato
ep16
.1-p
WT
No
RN
A
No
RT
18S rRNA
AtOEP16.4
340 bp
240 bp
400 bp
AtOEP16.1
Ato
ep16
.1-p
WT
No
RN
A
No
RT
18S rRNA
AtOEP16.4
340 bp
240 bp
400 bp
A
Ato
ep16
.1-e
WT
275 bp
280 bp
AtOEP16.1
actin 2
No
RN
A
No
RT
Ato
ep16
.1-e
WT
B
275 bp
280 bp
AtOEP16.1
actin 2
No
RN
A
No
RT
AtOEP16.1
CA
toep
16.1
-e
WT
AtOEP16.1
Ato
ep16
.1-e
WT
AtOEP16.1
CA
toep
16.1
-e
WT
AtOEP16.1
Ato
ep16
.1-e
WT
AtOEP16.1
Ato
ep16
.1-p
WT
No
RN
A
No
RT
18S rRNA
AtOEP16.4
340 bp
240 bp
400 bp
AtOEP16.1
Ato
ep16
.1-p
WT
No
RN
A
No
RT
18S rRNA
AtOEP16.4
340 bp
240 bp
400 bp

50
To test whether the disruption of AtOEP16.1 gene expression affects the mRNA level of the
AtOEP16.4 gene, the closest relative to AtOEP16.1, RT-PCR analysis of AtOEP16.4 in the
homozygous Atoep16.1-p line was performed. The RT-PCR analysis showed that the
knockout line and wild-type plants possessed a 240 bp band of almost the same intensity,
representing AtOEP16.4 mRNA. RT-PCR of the 18S rRNA gene was used as a house-keeping
control in this assay.
As shown in Fig. 3.16 B, representing results of RT-PCR analysis of Atoep16.1-e knockout
mutant, wild-type plants possessed a amplified PCR product band of 275 bp, which is the
expected size of the AtOEP16.1 PCR product with amplification with two AtOEP16.1 gene-
specific primers. The Atoep16.1-e homozygous plants possessed no detectable PCR product
band of the same size. RT-PCR of the Actin2 gene was used as a house-keeping control in this
assay.
To analyze the effect of the T-DNA insertion on the production of the AtOEP16.1
polypeptide, proteins were extracted from leaves of 4-week-old plants of Atoep16.1-e
homozygous as well as wild-type plants. These proteins were tested in an immunoblot with
polyclonal antibodies raised against the AtOEP16.1 protein. As shown in Fig. 3.16 C, the
antibodies recognized an intense AtOEP16.1 protein band in wild-type plants. Homozygous
plants for the AtOEP16.1 knock out possessed no detectable AtOEP16.1 polypeptide band.
The phenotype of the homozygous Atoep16.1-p and Atoep16.1-e knockout mutants was
inspected and compared with wild-type under standard growth conditions. No detectable
difference was observed at any growth stage, including seed germination, plant morphology
and growth, flowering time, fertility, silique development, and seed dormancy (data not
shown). Cold stress (4°C for 3 days) also did not influence the phenotype of the knock out
mutants as well.
B) cDNA macroarray analysis of the Atoep16.1-p knockout mutant
To compare gene expression in leaves of 4-week-old Atoep16.1-p knockout mutant plants
with gene expression in leaves in wild-type, cDNA macroarray analysis on membranes with
spotted cDNAs, was conducted during my stay in the lab of Dr. Schäffner (GSF
Forschungszentrum, München) within the DFG SPP 1108 project. This macroarray consists
of 700 membrane transporter cDNAs (Clomibitza et al., 2004).
When hybridized to an array (Fig. 3.17 A, B), 16 genes showed changes in expression more
than 2.5-fold higher or lower. Several channels were down-regulated in the Atoep16.1-p
knockout mutant (Table 3.4). The mRNA level of LHT1 (At5g40780), amino acid permease,
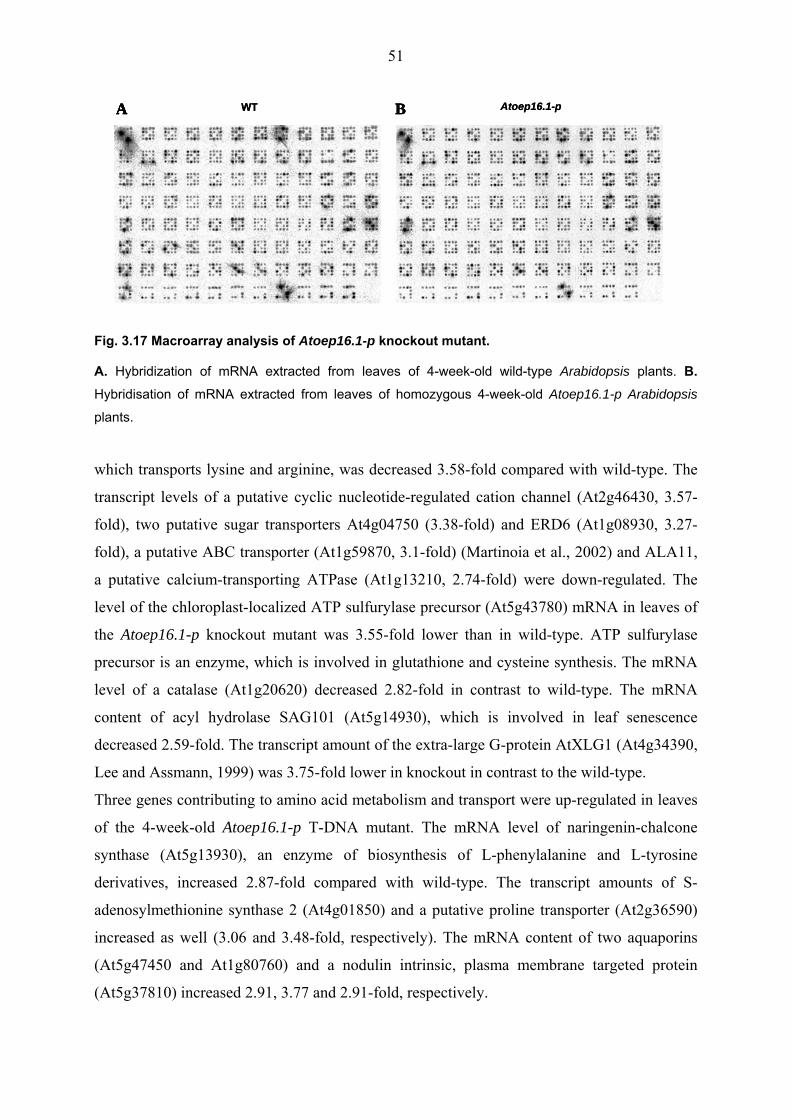
51
Fig. 3.17 Macroarray analysis of Atoep16.1-p knockout mutant.
A. Hybridization of mRNA extracted from leaves of 4-week-old wild-type Arabidopsis plants. B. Hybridisation of mRNA extracted from leaves of homozygous 4-week-old Atoep16.1-p Arabidopsis
plants.
which transports lysine and arginine, was decreased 3.58-fold compared with wild-type. The
transcript levels of a putative cyclic nucleotide-regulated cation channel (At2g46430, 3.57-
fold), two putative sugar transporters At4g04750 (3.38-fold) and ERD6 (At1g08930, 3.27-
fold), a putative ABC transporter (At1g59870, 3.1-fold) (Martinoia et al., 2002) and ALA11,
a putative calcium-transporting ATPase (At1g13210, 2.74-fold) were down-regulated. The
level of the chloroplast-localized ATP sulfurylase precursor (At5g43780) mRNA in leaves of
the Atoep16.1-p knockout mutant was 3.55-fold lower than in wild-type. ATP sulfurylase
precursor is an enzyme, which is involved in glutathione and cysteine synthesis. The mRNA
level of a catalase (At1g20620) decreased 2.82-fold in contrast to wild-type. The mRNA
content of acyl hydrolase SAG101 (At5g14930), which is involved in leaf senescence
decreased 2.59-fold. The transcript amount of the extra-large G-protein AtXLG1 (At4g34390,
Lee and Assmann, 1999) was 3.75-fold lower in knockout in contrast to the wild-type.
Three genes contributing to amino acid metabolism and transport were up-regulated in leaves
of the 4-week-old Atoep16.1-p T-DNA mutant. The mRNA level of naringenin-chalcone
synthase (At5g13930), an enzyme of biosynthesis of L-phenylalanine and L-tyrosine
derivatives, increased 2.87-fold compared with wild-type. The transcript amounts of S-
adenosylmethionine synthase 2 (At4g01850) and a putative proline transporter (At2g36590)
increased as well (3.06 and 3.48-fold, respectively). The mRNA content of two aquaporins
(At5g47450 and At1g80760) and a nodulin intrinsic, plasma membrane targeted protein
(At5g37810) increased 2.91, 3.77 and 2.91-fold, respectively.
A BA BWT Atoep16.1-pA BA BWT Atoep16.1-p
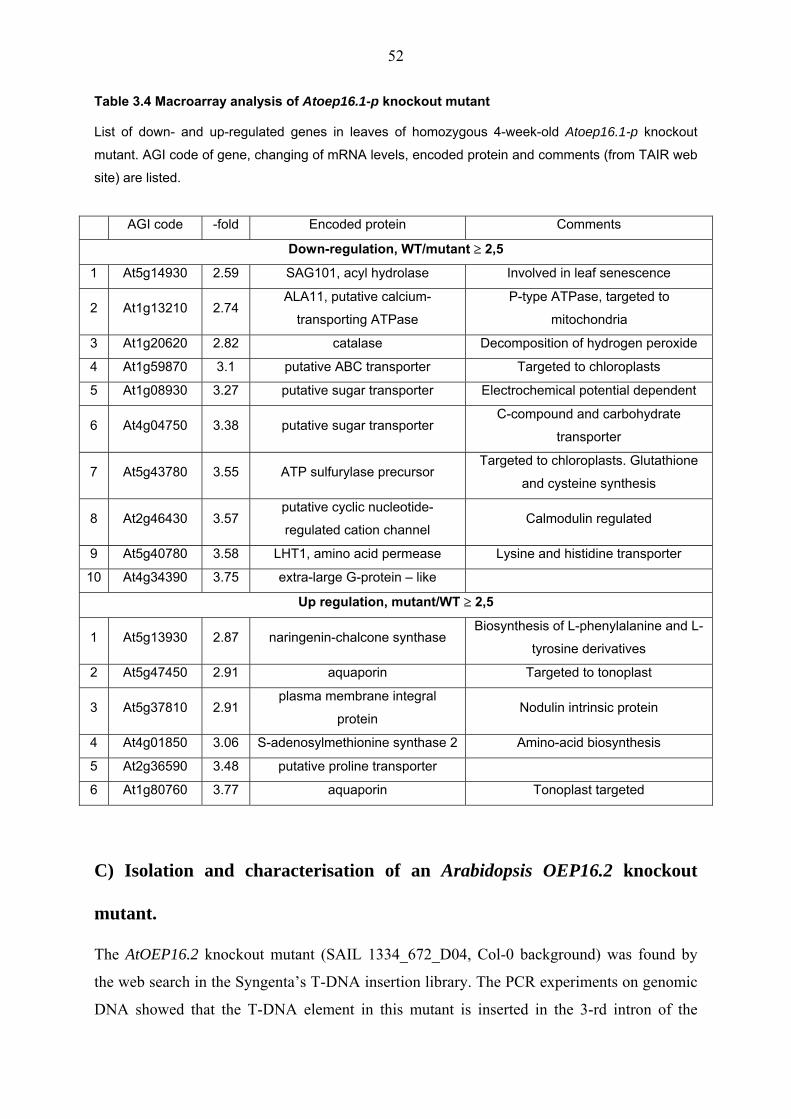
52
Table 3.4 Macroarray analysis of Atoep16.1-p knockout mutant
List of down- and up-regulated genes in leaves of homozygous 4-week-old Atoep16.1-p knockout
mutant. AGI code of gene, changing of mRNA levels, encoded protein and comments (from TAIR web
site) are listed.
AGI code -fold Encoded protein Comments
Down-regulation, WT/mutant ≥ 2,5
1 At5g14930 2.59 SAG101, acyl hydrolase Involved in leaf senescence
2 At1g13210 2.74 ALA11, putative calcium-
transporting ATPase
P-type ATPase, targeted to
mitochondria
3 At1g20620 2.82 catalase Decomposition of hydrogen peroxide
4 At1g59870 3.1 putative ABC transporter Targeted to chloroplasts
5 At1g08930 3.27 putative sugar transporter Electrochemical potential dependent
6 At4g04750 3.38 putative sugar transporter C-compound and carbohydrate
transporter
7 At5g43780 3.55 ATP sulfurylase precursor Targeted to chloroplasts. Glutathione
and cysteine synthesis
8 At2g46430 3.57 putative cyclic nucleotide-
regulated cation channel Calmodulin regulated
9 At5g40780 3.58 LHT1, amino acid permease Lysine and histidine transporter
10 At4g34390 3.75 extra-large G-protein – like
Up regulation, mutant/WT ≥ 2,5
1 At5g13930 2.87 naringenin-chalcone synthase Biosynthesis of L-phenylalanine and L-
tyrosine derivatives
2 At5g47450 2.91 aquaporin Targeted to tonoplast
3 At5g37810 2.91 plasma membrane integral
protein Nodulin intrinsic protein
4 At4g01850 3.06 S-adenosylmethionine synthase 2 Amino-acid biosynthesis
5 At2g36590 3.48 putative proline transporter
6 At1g80760 3.77 aquaporin Tonoplast targeted
C) Isolation and characterisation of an Arabidopsis OEP16.2 knockout
mutant.
The AtOEP16.2 knockout mutant (SAIL 1334_672_D04, Col-0 background) was found by
the web search in the Syngenta’s T-DNA insertion library. The PCR experiments on genomic
DNA showed that the T-DNA element in this mutant is inserted in the 3-rd intron of the

53
AtOEP16.2 locus. A schematic diagram of the T-DNA insert location and orientation is
shown in Fig. 3.18 A. The T-DNA junction was amplified with the left border T-DNA
specific primer and with the gene-specific primer. Homozygous mutant lines were screened
with the two gene-specific primers (Fig. 3.18 B).
Fig. 3.18 Screening and analysis of the Atoep16.2 T-DNA mutant.
A. Schematic diagram of the T-DNA element localization in the third intron of AtOEP16.2 locus. For T-
DNA the orientation of left and right borders are shown. Exons are shown as black arrows. B. PCR
analysis of the individual homozygous lane of the Atoep16.2 knockout mutant and wild-type (Col-0)
using (i) T-DNA specific LB3 and gene-specific At4gN, and (ii) two gene-specific At4gN and At4gC
primers. Mut, mutant; WT, wild-type. C. RT-PCR analysis of the Atoep16.2 T-DNA mutant. 100 ng of
total RNA from siliques from Atoep16.2 and wild-type (WT) Arabidopsis plants was used for one-step
RT-PCR with primers 16160lcf and 16160lcr for AtOEP16.2, and actin2lcf and actin2lcr for Actin 2
gene, which was used as a house-keeping control in this assay. As negative control for the assay, No
RNA and No RT controls were used.
LB3
At4gCAt4gN
Eco RI (1767)HindIII (543)
Hind III (744)HindIII (1710)5' UTR
3' UTR
A
B
Eco RI (1767)HindIII (543)
Hind III (744)HindIII (1710)5' UTR
3' UTR
Eco RI (1767)HindIII (543)
Hind III (744)HindIII (1710)5' UTR
3' UTR
A
mut
WT
WT
Primers LB3 At4gNAt4gN At4gC
500 bp 1200 bp
WT
WT
Primers LB3 At4gNAt4gN At4gC
LB3
At4gCAt4gN
mut
280 bpActin 2
WT
No
RN
A
No
RT
270 bp
mut
WT
AtOEP16.2
C
LB3
At4gCAt4gN
Eco RI (1767)HindIII (543)
Hind III (744)HindIII (1710)5' UTR
3' UTR
Eco RI (1767)HindIII (543)
Hind III (744)HindIII (1710)5' UTR
3' UTR
A
B
Eco RI (1767)HindIII (543)
Hind III (744)HindIII (1710)5' UTR
3' UTR
Eco RI (1767)HindIII (543)
Hind III (744)HindIII (1710)5' UTR
3' UTR
A
mut
WT
WT
Primers LB3 At4gNAt4gN At4gC
500 bp 1200 bp
WT
WT
Primers LB3 At4gNAt4gN At4gC
LB3
At4gCAt4gN
mut
280 bpActin 2
WT
No
RN
A
No
RT
270 bp
mut
WT
AtOEP16.2
C

54
To test the effect of T-DNA insertion into intron 3 of the AtOEP16.2 gene on the mRNA
level, RT-PCR analysis of homozygous Atoep16.2 plants compared with wild-type
Arabidopsis was performed. Since expression of the AtOEP16.2 is seed specific (see 3.1.2.4
C), total RNA was isolated from developing siliques. As shown in Fig. 3.18 C, wild-type
plants possessed a PCR product band of 270 bp. This band corresponds to AtOEP16.2
mRNA. In contrast to wild-type, no band was detected in the Atoep16.2 T-DNA mutant. As
internal control, the amplification of Actin 2 was used in this assay.
The phenotype of the homozygous Atoep16.2 knockout mutant was observed under standard
growth conditions and compared with wild-type. No detectable difference was found at any
growth stage, including seed germination, plant morphology and growth, flowering time,
fertility, silique development, and seed dormancy (data not shown).
D) Isolation and characterisation of Arabidopsis OEP16.4 knockout mutants
To obtain an Arabidopsis OEP16.4 knockout mutant, we screened T-DNA insertion mutants
of the SALK database. One candidate knockout line, SALK 109275, was found. The PCR
experiments on genomic DNA with the left-border T-DNA specific and gene-specific primers
were performed to characterize the genomic region of the AtOEP16.4 mutant locus. The
sequencing showed that the AtOEP16.4 locus in this line possessed a T-DNA insert within
intron 3. Therefore, this mutant was named Atoep16.4-i. A second Atoeop16.4 knockout
mutant (Garlic 769 E11) was found by the web search in the Syngenta’s T-DNA insertion
library. The PCR experiments on genomic DNA in this mutant line with the left border T-
DNA specific and with gene-specific primers showed that the T-DNA element is inserted in
the last exon of the AtOEP16.4 locus, therefore this mutant line was named Atoep16.4-e. A
schematic diagram of the T-DNA location and orientation in the AtOEP16.4 gene of these T-
DNA mutants is shown in Fig. 3.19 A.
To screen for homozygous Atoep16.4-i and Atoep16.4-e mutant plants, PCR analysis was
performed. Two sets of primers were used (i) the T-DNA left border specific primer and
gene-specific primer, and (ii) two gene-specific primers. The PCR results are shown in the
Fig. 3.19 B and C, respectively. In the Atoep16.4-i line the band of 1200 bp (with first set of
primers) and absence of the 800 bp band (with second set of primers) were detected in
contrast to wild-type plants. In Atoep16.4-e line the band of 400 bp (with first set of primers)
and absence of a band of 800 bp (with second set of primers) were detected in contrast to
wild-type plants and identified this line as homozygous.
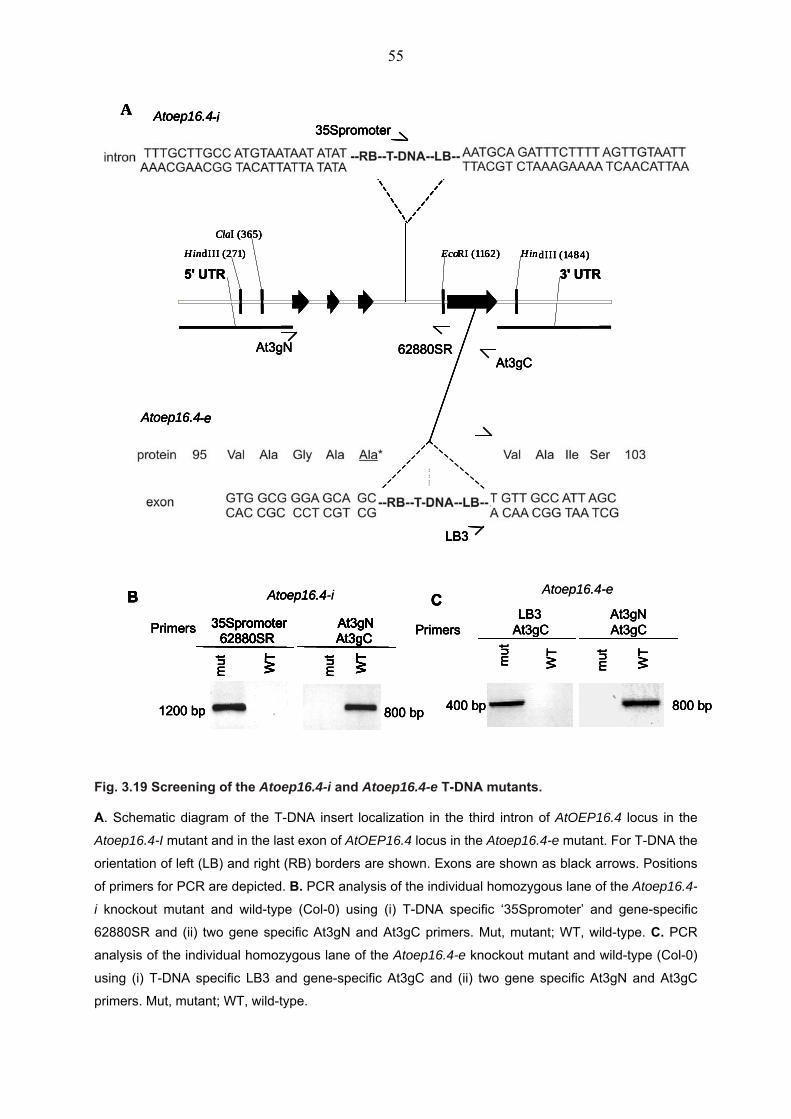
55
Fig. 3.19 Screening of the Atoep16.4-i and Atoep16.4-e T-DNA mutants.
A. Schematic diagram of the T-DNA insert localization in the third intron of AtOEP16.4 locus in the
Atoep16.4-I mutant and in the last exon of AtOEP16.4 locus in the Atoep16.4-e mutant. For T-DNA the
orientation of left (LB) and right (RB) borders are shown. Exons are shown as black arrows. Positions
of primers for PCR are depicted. B. PCR analysis of the individual homozygous lane of the Atoep16.4-
i knockout mutant and wild-type (Col-0) using (i) T-DNA specific ‘35Spromoter’ and gene-specific
62880SR and (ii) two gene specific At3gN and At3gC primers. Mut, mutant; WT, wild-type. C. PCR
analysis of the individual homozygous lane of the Atoep16.4-e knockout mutant and wild-type (Col-0)
using (i) T-DNA specific LB3 and gene-specific At3gC and (ii) two gene specific At3gN and At3gC
primers. Mut, mutant; WT, wild-type.
35Spromoter
At3gNAt3gC
62880SR
C
3' UTR5' UTR
ClaI (365)
EcoRI (1162)HindIII (271) HindIII (1484)
A
B Atoep16.4
WT
WT
35Spromoter At3gN62880SR At3gC
mutWT
WT
Primers 35Spromoter At3gN62880SR At3gC
1200 bp 800 bp
mut m
ut
mut
WT
WT
Primers LB3 At3gN
At3gC At3gC
400 bp 800 bp
LB3
Atoep16.4-i
Atoep16.4-e
35Spromoter
At3gNAt3gC
62880SR
C
3' UTR5' UTR
ClaI (365)
EcoRI (1162)HindIII (271) HindIII (1484)
A
B Atoep16.4-i
WT
WT
35Spromoter At3gN62880SR At3gC
mutWT
WT
Primers 35Spromoter At3gN62880SR At3gC
1200 bp 800 bp
mut m
ut
mut
WT
WT
Primers LB3 At3gN
At3gC At3gC
400 bp 800 bp
LB3
Atoep16.4-i
Atoep16.4-e
Atoep16.4-e
35Spromoter
At3gNAt3gC
62880SR
C
3' UTR5' UTR
ClaI (365)
EcoRI (1162)HindIII (271) HindIII (1484)
A
B Atoep16.4
WT
WT
35Spromoter At3gN62880SR At3gC
mutWT
WT
Primers 35Spromoter At3gN62880SR At3gC
1200 bp 800 bp
mut m
ut
mut
WT
WT
Primers LB3 At3gN
At3gC At3gC
400 bp 800 bp
LB3
Atoep16.4-i
Atoep16.4-e
35Spromoter
At3gNAt3gC
62880SR
C
3' UTR5' UTR
ClaI (365)
EcoRI (1162)HindIII (271) HindIII (1484)
A
B Atoep16.4-i
WT
WT
35Spromoter At3gN62880SR At3gC
mutWT
WT
Primers 35Spromoter At3gN62880SR At3gC
1200 bp 800 bp
mut m
ut
mut
WT
WT
Primers LB3 At3gN
At3gC At3gC
400 bp 800 bp
LB3
Atoep16.4-i
Atoep16.4-e
Atoep16.4-e
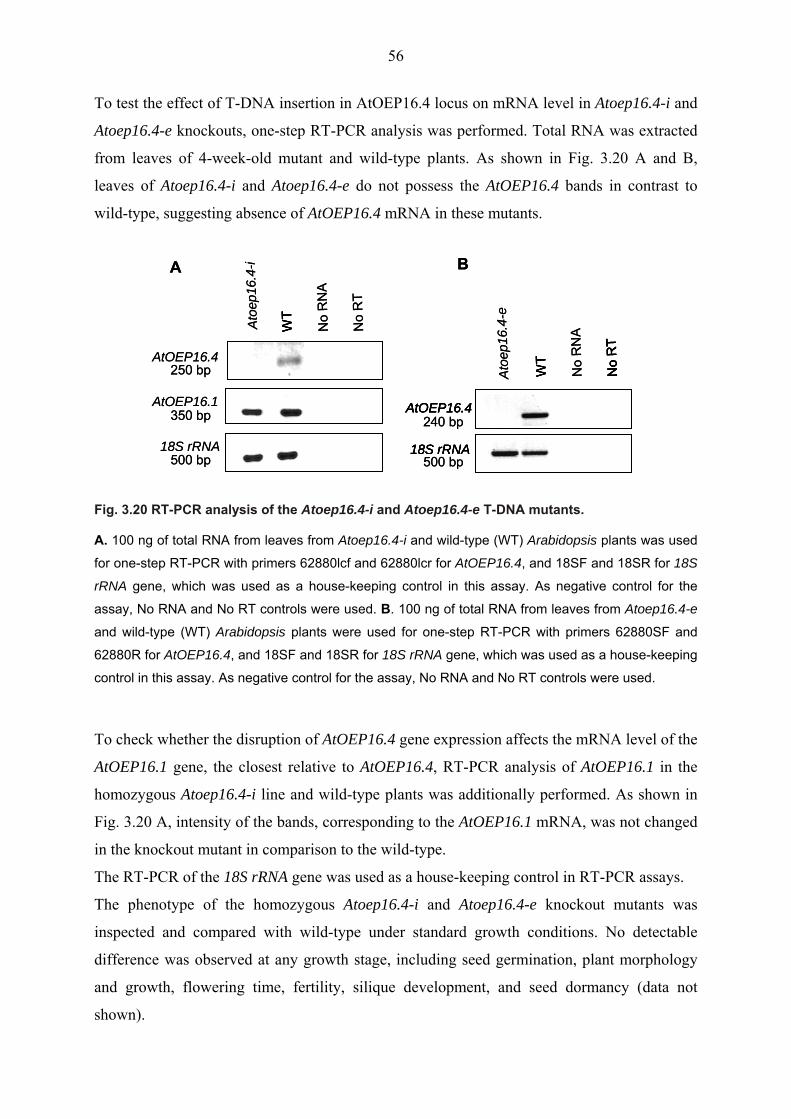
56
To test the effect of T-DNA insertion in AtOEP16.4 locus on mRNA level in Atoep16.4-i and
Atoep16.4-e knockouts, one-step RT-PCR analysis was performed. Total RNA was extracted
from leaves of 4-week-old mutant and wild-type plants. As shown in Fig. 3.20 A and B,
leaves of Atoep16.4-i and Atoep16.4-e do not possess the AtOEP16.4 bands in contrast to
wild-type, suggesting absence of AtOEP16.4 mRNA in these mutants.
Fig. 3.20 RT-PCR analysis of the Atoep16.4-i and Atoep16.4-e T-DNA mutants.
A. 100 ng of total RNA from leaves from Atoep16.4-i and wild-type (WT) Arabidopsis plants was used
for one-step RT-PCR with primers 62880lcf and 62880lcr for AtOEP16.4, and 18SF and 18SR for 18S
rRNA gene, which was used as a house-keeping control in this assay. As negative control for the
assay, No RNA and No RT controls were used. B. 100 ng of total RNA from leaves from Atoep16.4-e
and wild-type (WT) Arabidopsis plants were used for one-step RT-PCR with primers 62880SF and
62880R for AtOEP16.4, and 18SF and 18SR for 18S rRNA gene, which was used as a house-keeping
control in this assay. As negative control for the assay, No RNA and No RT controls were used.
To check whether the disruption of AtOEP16.4 gene expression affects the mRNA level of the
AtOEP16.1 gene, the closest relative to AtOEP16.4, RT-PCR analysis of AtOEP16.1 in the
homozygous Atoep16.4-i line and wild-type plants was additionally performed. As shown in
Fig. 3.20 A, intensity of the bands, corresponding to the AtOEP16.1 mRNA, was not changed
in the knockout mutant in comparison to the wild-type.
The RT-PCR of the 18S rRNA gene was used as a house-keeping control in RT-PCR assays.
The phenotype of the homozygous Atoep16.4-i and Atoep16.4-e knockout mutants was
inspected and compared with wild-type under standard growth conditions. No detectable
difference was observed at any growth stage, including seed germination, plant morphology
and growth, flowering time, fertility, silique development, and seed dormancy (data not
shown).
AtOEP16.4
18S rRNA
AtOEP16.1
Atoe
p16.
4-i
WT
No
RN
A
No
RT
250 bp
350 bp
500 bp
WT
Ato
ep16
.4-e
WT
No
RN
A
No
RT
AtOEP16.4
18S rRNA
WT
No
RT
240 bpAtOEP16.4
500 bp18S rRNA
A B
AtOEP16.4
18S rRNA
AtOEP16.1
Atoe
p16.
4-i
WT
No
RN
A
No
RT
250 bp
350 bp
500 bp
WT
Ato
ep16
.4-e
WT
No
RN
A
No
RT
AtOEP16.4
18S rRNA
WT
No
RT
240 bpAtOEP16.4
500 bp18S rRNA
A B
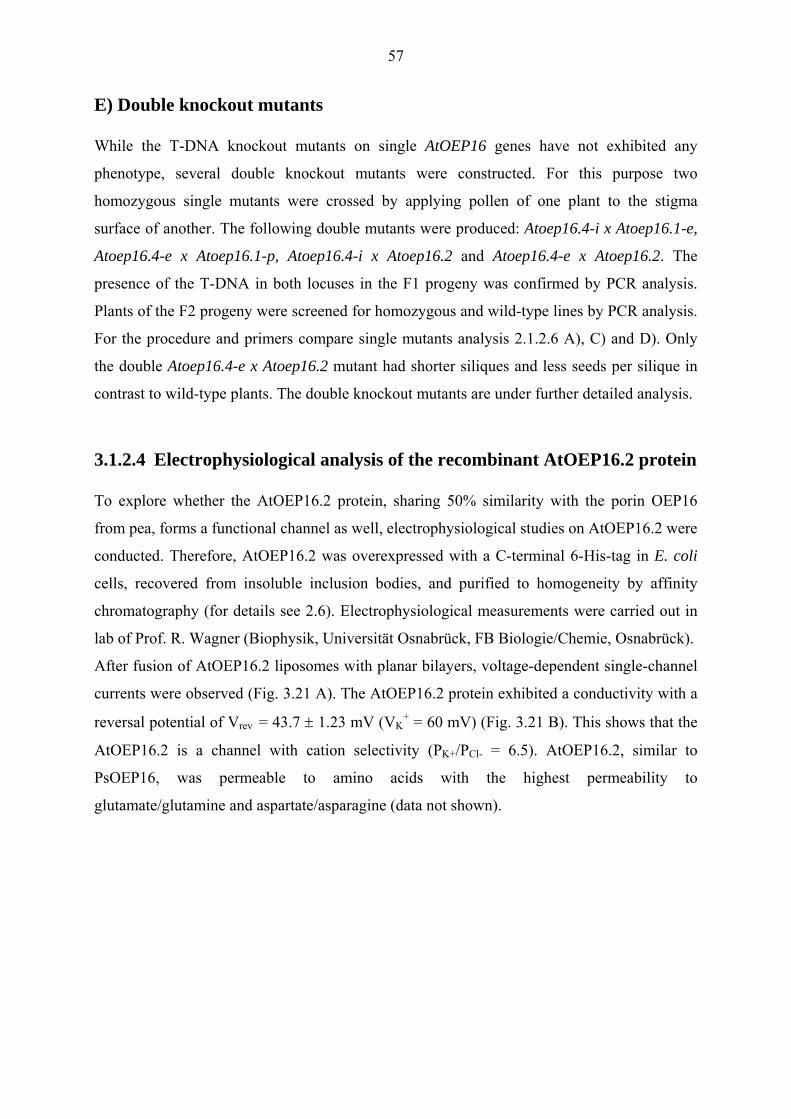
57
E) Double knockout mutants
While the T-DNA knockout mutants on single AtOEP16 genes have not exhibited any
phenotype, several double knockout mutants were constructed. For this purpose two
homozygous single mutants were crossed by applying pollen of one plant to the stigma
surface of another. The following double mutants were produced: Atoep16.4-i x Atoep16.1-e,
Atoep16.4-e x Atoep16.1-p, Atoep16.4-i x Atoep16.2 and Atoep16.4-e x Atoep16.2. The
presence of the T-DNA in both locuses in the F1 progeny was confirmed by PCR analysis.
Plants of the F2 progeny were screened for homozygous and wild-type lines by PCR analysis.
For the procedure and primers compare single mutants analysis 2.1.2.6 A), C) and D). Only
the double Atoep16.4-e x Atoep16.2 mutant had shorter siliques and less seeds per silique in
contrast to wild-type plants. The double knockout mutants are under further detailed analysis.
3.1.2.4 Electrophysiological analysis of the recombinant AtOEP16.2 protein
To explore whether the AtOEP16.2 protein, sharing 50% similarity with the porin OEP16
from pea, forms a functional channel as well, electrophysiological studies on AtOEP16.2 were
conducted. Therefore, AtOEP16.2 was overexpressed with a C-terminal 6-His-tag in E. coli
cells, recovered from insoluble inclusion bodies, and purified to homogeneity by affinity
chromatography (for details see 2.6). Electrophysiological measurements were carried out in
lab of Prof. R. Wagner (Biophysik, Universität Osnabrück, FB Biologie/Chemie, Osnabrück).
After fusion of AtOEP16.2 liposomes with planar bilayers, voltage-dependent single-channel
currents were observed (Fig. 3.21 A). The AtOEP16.2 protein exhibited a conductivity with a
reversal potential of Vrev = 43.7 ± 1.23 mV (VK+ = 60 mV) (Fig. 3.21 B). This shows that the
AtOEP16.2 is a channel with cation selectivity (PK+/PCl- = 6.5). AtOEP16.2, similar to
PsOEP16, was permeable to amino acids with the highest permeability to
glutamate/glutamine and aspartate/asparagine (data not shown).

58
Fig. 3.21 Reconstituted AtOEP16.2 constitutes a voltage-sensitive, cation-selective pore.
A. Liposomes containing E.coli-overexpressed AtOEP16.2 were fused to black lipid membranes. The
cis chamber contained 250 mM KCl and the trans chamber 20 mM KCl. A current from bilayer
containing 3 active pores (3 solid lines) is shown. B. Current-voltage relationship from the data
presented in A (n=3±SD). The electrophysiological experiments were carried out in lab of Prof. R.
Wagner (Biophysik, Universität Osnabrück, FB Biologie/Chemie, Osnabrück).
3.2 OEP37 in Pisum sativum and in Arabidopsis thaliana
PsOEP37 (Pisum sativum outer envelope protein, 37 kDa) protein from pea chloroplast outer
envelopes was described in Schleiff et al., 2003. The PsOEP37 gene has an open reading
frame of 990 bp encoding a protein comprising 329 amino acid residues with a predicted
molecular mass of 37,5 kDa and a pI of 8.2.
3.2.1 Isolation of OEP37 from Arabidopsis
A BLASTP search analysis in GenBank revealed only one orthologue of PsOEP37 in
Arabidopsis. This protein is named AtOEP37, which is encoded by the At2g43950 gene. The
AtOEP37 gene lies on chromosome 2 and has 6 exons and 5 introns. A schematic diagram of
the gene organisation is given in Fig.3.22 A.
Total RNA from roots, leaves, flowers and siliques was isolated and analyzed by one-step
RT-PCR with 20 ng of total RNA as a template. Fig. 3.22 B shows, that RT-PCR with
primers specific for the AtOEP37 gene gave a PCR product bands of 1200 bp in all tested
organs with the highest level in leaves. This RT-PCR product was used for a full-length
-160 -120 -80- -40-20 0 40 80 120 160 200
-200
-150
-100
-50
0
50
100
150
200
Current [pA]
Voltage [mV]
-150 -100 -50 0 50 100 150
-40
-30
-20
-10
0
10
20
30
40
ErevdI [pA]
Voltage [mV]
A B
-160 -120 -80- -40-20 0 40 80 120 160 200
-200
-150
-100
-50
0
50
100
150
200
Current [pA]
Voltage [mV]-160 -120 -80- -40-20 0 40 80 120 160 200
-200
-150
-100
-50
0
50
100
150
200
Current [pA]
Voltage [mV]
-150 -100 -50 0 50 100 150
-40
-30
-20
-10
0
10
20
30
40
ErevdI [pA]
Voltage [mV]-150 -100 -50 0 50 100 150
-40
-30
-20
-10
0
10
20
30
40
ErevdI [pA]
Voltage [mV]
A B

59
Fig. 3.22 OEP37 in Arabidopsis.
A. Schematic diagram of the AtOEP37 gene structure. The initiator ATG and terminator ATT codons,
as well as 5’ and 3’ untranslated regions (5’ UTR and 3’ UTR, respectively) and several sites for
restriction enzymes are illustrated. Exons are shown as black arrows, introns in grey lines. B. One-
step RT-PCR analysis of AtOEP37 in different tissues of Arabidopsis. 20 ng of total RNA was used for
reaction with the o37aXhoIr and o37araXbaIs primers for AtOEP37, and 18SF and 18SR for the
house-keeping control, 18S rRNA. As negative control for this assay, No RNA control was used.
cDNA cloning. The cDNA has a 1032 bp open reading frame for a protein of 343 amino acid
residues with a deduced molecular mass of 38,8 kDa and a pI of 9,16. The protein sequence
alignment showed that the PsOEP37 and the AtOEP37 proteins share 60% identity and 75%
similarity over their entire sequence length (Fig. 3.23).
Fig. 3.23 Protein sequence alignment of PsOEP37 and AtOEP37
Identical amino acids are shown in black background, similar amino acids are indicated in gray
background.
PsOEP37AtOEP37
PsOEP37AtOEP37
PsOEP37AtOEP37
PsOEP37AtOEP37
PsOEP37AtOEP37
PsOEP37AtOEP37
PsOEP37AtOEP37
PsOEP37AtOEP37
PsOEP37AtOEP37
PsOEP37AtOEP37
PsOEP37AtOEP37
PsOEP37AtOEP37
ATG
ATT
3' UTR5' UTR
Eco RI (682)
BamHI (510) BamHI (1667)Pst I (1476)
Pst I (1568)
HindIII (748)
Hin dIII (2407)
Hin dIII (2710)
ATG
ATT
3' UTR5' UTR
Eco RI (682)
BamHI (510) BamHI (1667)Pst I (1476)
Pst I (1568)
HindIII (748)
Hin dIII (2407)
Hin dIII (2710)
AtOEP37
Roots
Leav
esFl
ower
sSi
lique
sNo
RNA
1200 bp
400 bp18S rRNA
A B
ATG
ATT
3' UTR5' UTR
Eco RI (682)
BamHI (510) BamHI (1667)Pst I (1476)
Pst I (1568)
HindIII (748)
Hin dIII (2407)
Hin dIII (2710)
ATG
ATT
3' UTR5' UTR
Eco RI (682)
BamHI (510) BamHI (1667)Pst I (1476)
Pst I (1568)
HindIII (748)
Hin dIII (2407)
Hin dIII (2710)
AtOEP37
Roots
Leav
esFl
ower
sSi
lique
sNo
RNA
1200 bp
400 bp18S rRNA
A B

60
Modelling of the channel topology (Schleiff et al., 2003) revealed that the AtOEP37 and
PsOEP37 proteins are transmembrane proteins composed of 12 β-sheets, which form a β-
barrel within the membrane (Fig. 3.24). The proteins contain large soluble domains at both
sides of the outer envelope membrane.
Fig. 3.24 The topological model of AtOEP37 (Schleiff et al., 2003).
The AtOEP37 protein represents a β-barrel channel-forming protein, and the proposed topology is
shown. A black line presents the amino acid sequences connecting the transmembrane β-sheets (gray
boxes). Cytosol and intermembrane space and N (NT) and C terminal (CT) of protein are indicated.
3.2.2 Subcellular and suborganellar localization of the AtOEP37 and
PsOEP37 proteins
To identify the subcellular localization of the AtOEP37 protein, chloroplasts and
mitochondria from 10-day-old Arabidopsis seedlings were isolated and immunodetection was
performed. Fig. 3.25 shows that polyclonal antibodies against the AtOEP37 protein
recognised a band of approximately 40 kDa in chloroplasts. For control of chloroplasts and
mitochondria purity, immunodetection of VDAC, OEP21, and mSSU with corresponding
antisera was performed.
NT CTNT CT
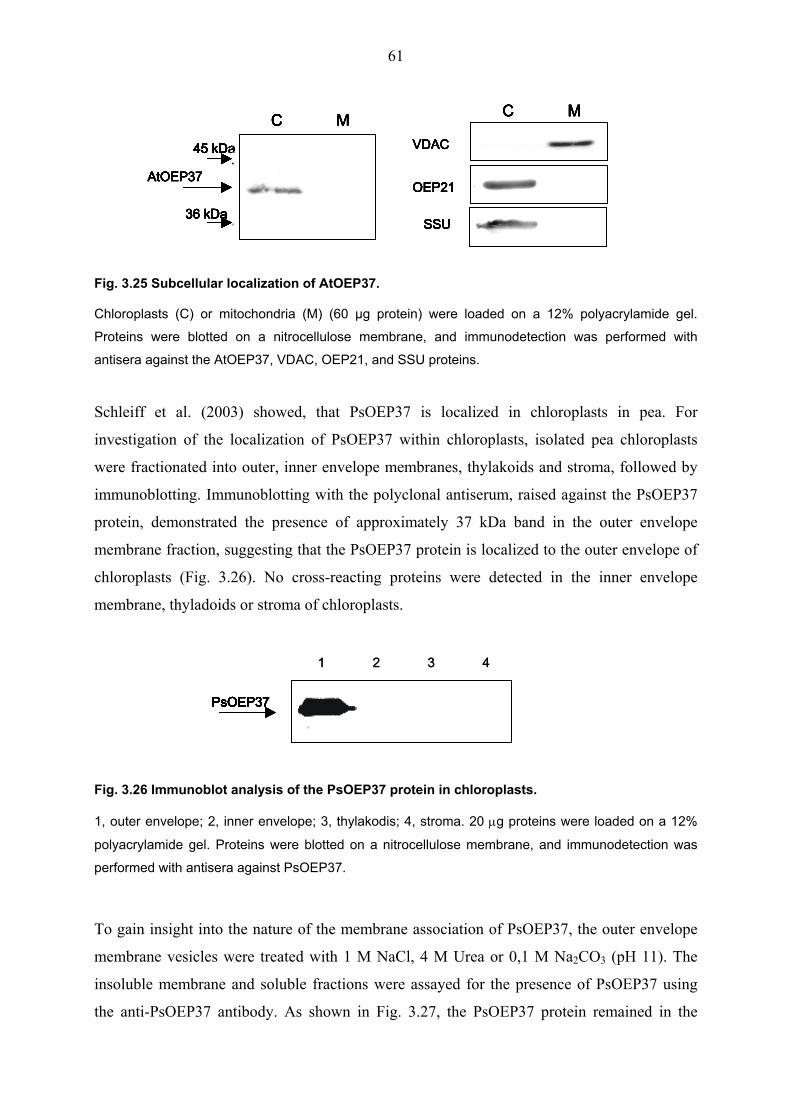
61
Fig. 3.25 Subcellular localization of AtOEP37.
Chloroplasts (C) or mitochondria (M) (60 µg protein) were loaded on a 12% polyacrylamide gel.
Proteins were blotted on a nitrocellulose membrane, and immunodetection was performed with
antisera against the AtOEP37, VDAC, OEP21, and SSU proteins.
Schleiff et al. (2003) showed, that PsOEP37 is localized in chloroplasts in pea. For
investigation of the localization of PsOEP37 within chloroplasts, isolated pea chloroplasts
were fractionated into outer, inner envelope membranes, thylakoids and stroma, followed by
immunoblotting. Immunoblotting with the polyclonal antiserum, raised against the PsOEP37
protein, demonstrated the presence of approximately 37 kDa band in the outer envelope
membrane fraction, suggesting that the PsOEP37 protein is localized to the outer envelope of
chloroplasts (Fig. 3.26). No cross-reacting proteins were detected in the inner envelope
membrane, thyladoids or stroma of chloroplasts.
Fig. 3.26 Immunoblot analysis of the PsOEP37 protein in chloroplasts.
1, outer envelope; 2, inner envelope; 3, thylakodis; 4, stroma. 20 µg proteins were loaded on a 12%
polyacrylamide gel. Proteins were blotted on a nitrocellulose membrane, and immunodetection was
performed with antisera against PsOEP37.
To gain insight into the nature of the membrane association of PsOEP37, the outer envelope
membrane vesicles were treated with 1 M NaCl, 4 M Urea or 0,1 M Na2CO3 (pH 11). The
insoluble membrane and soluble fractions were assayed for the presence of PsOEP37 using
the anti-PsOEP37 antibody. As shown in Fig. 3.27, the PsOEP37 protein remained in the
45 kDa
36 kDa
AtOEP37
C M
SSU
OEP21
VDAC45 kDa
36 kDa
AtOEP37
C M
SSU
OEP21
VDAC45 kDa
36 kDa
AtOEP37
C M
SSU
OEP21
VDAC45 kDa
36 kDa
C MC MC M
45 kDa
36 kDa
AtOEP37
C M
SSU
OEP21
VDAC45 kDa
36 kDa
AtOEP37
C M
SSU
OEP21
VDAC45 kDa
36 kDa
AtOEP37
C M
SSU
OEP21
VDAC45 kDa
36 kDa
C MC MC M
PsOEP37PsOEP37PsOEP37
1 2 3 4
PsOEP37PsOEP37PsOEP37PsOEP37
1 2 3 4
PsOEP37PsOEP37

62
membrane fraction but not in the soluble fraction. Since these procedures are known to strip
peripheral proteins from membranes, it is suggested that PsOEP37 is an integral membrane
protein.
Fig. 3.27 Immunoblot analysis of chloroplastic outer envelope membrane vesicles.
Outer envelope membrane vesicles (20 µg protein) were untreated (oe) or treated with NaCl, Urea or
Na2CO3 and then separated into the membrane (M) and soluble (S) fractions. After blotting reacted
with a polyclonal rabbit antiserum against the recombinant PsOEP37 protein.
3.2.3 OEP37 expression analysis
3.2.3.1 AtOEP37 mRNA distribution within the Arabidopsis plant
To investigate the distribution of AtOEP37 within the Arabidopsis plant, monitoring of the
AtOEP37 mRNA content in various organs was done using several approaches. First, mRNA
from leaves and roots of 4-week-old plants was extracted and Affymetrix genome array
analysis was performed (Dr. Rowena Thomson, Dept. Biologie, LMU, München, DFG SPP-
1108 project). As shown in Fig. 3.28, the AtOEP37 transcript levels in Arabidopsis were low
in the tested organs. The leaves possessed 153 ± 16 of the AtOEP37 transcript, whereas the
roots contained 91 ± 9 of mRNA (n=3).
Fig. 3.28 Affymetrix Arabidopsis genome array analysis of AtOEP37 mRNA levels in leaves and roots of 4 weeks old Arabidopsis plants. mRNA levels are depicted in arbitrary units. Error
bars denote standard deviation SD of n=3 biological
replicas (Dr. Rowena Thomson, Dept. Biologie,
LMU, München, DFG SPP-1108 project).
PsOEP37
oe M S M S M S
1 M NaCl 4 M Urea 0,1 M Na2CO3
PsOEP37
oe M S M S M S
1 M NaCl 4 M Urea 0,1 M Na2CO3
leaves rootsleaves rootsleaves roots0
leaves roots
mR
NA
leve
l(ar
bitra
ry u
nits
)
50
150
leaves roots
100
200
leaves rootsleaves rootsleaves rootsleaves roots0
leaves roots
mR
NA
leve
l(ar
bitra
ry u
nits
)
50
150
leaves roots
100
200
leaves roots

63
3.2.3.2 The AtOEP37 gene expression in leaves depending on plant age
To check the AtOEP37 mRNA levels in leaves in dependence of plant age, total RNA from
leaves of 1 to 7-week-old Arabidopsis plants (1 week step) was used for one-step RT-PCR
analysis. As shown in Fig. 3.29, RT-PCR with the AtOEP37 specific primers gave the PCR
product bands of 550 bp in leaves of 1-7 week-old Arabidopsis in equal intensity. RT-PCR of
Actin 2/7 was used as a house-keeping control in this assay. The RNA levels did not change
significantly within the first to seven weeks of development.
Fig. 3.29 One-step RT-PCR analysis of 1-7-week-old Arabidopsis plants.
50 ng total RNA was used for RT-PCR. Primers for AtOEP37 were 037araSR and o37araXbaIs; for
Actin 2/7 were Actin2/7F and Actin2/7R. As negative control for this assay, No RNA control was used.
3.2.3.3 AtOEP37 promoter::GUS analysis
The expression pattern of AtOEP37 with respect to specific tissues and developmental stages
was examined by fusing 1.5 kb of the AtOEP37 upstream promoter region with GUS and
transformation in Arabidopsis plants as described in Methods (see 2.4.3 and 2.8). Two
positive independent plants of T1 and T2 progeny were analysed for GUS activity by staining
various organs of the plants (Fig. 3.30).
In the seeds, which were imbibed before germination, GUS staining was observed in the
hilum, attaching seed to placenta in the siliques (Fig. 3.30 A). No blue staining was detected
in embryos (Fig. 3.30 B). In 3- and 7-day-old seedlings, GUS staining was detected in
cotyledons, roots, including meristematic, vascular, cortical cell types the transition zone (Fig.
3.30 G- I) and epidermally derived hair roots (Fig. 3.30 C-F). No staining was observed in the
root cap (Fig. 3.30 G). In the etiolated 7 day-old seedlings, GUS staining was observed only
in cotyledons (Fig. 3.30 J). In 2 to 3-week old juvenile plants, weak level of staining was
observed only in aerial portions: in cotyledons, rosette leaf primordium in the subepidermal
and cortical cells (shoot apex), and expanded rosette leaves (Fig. 3.30 K-M). No GUS
AtOEP37
weeks 1 2 3 4 5 6 7 No RNA
550 bp
Actin 2/7 1100 bp
AtOEP37AtOEP37
weeks 1 2 3 4 5 6 7 No RNA
550 bp
Actin 2/7 1100 bpActin 2/7 1100 bp
AtOEP37

64
expression in roots was detected with that method in contrast to more sensitive RT-PCR and
Affymetrix analyses. In inflorescence, blue staining was observed in flower stalks and petals
(Fig. 3.30 N and O, respectively). Fig. 3.30 GUS staining of the va-
rious organs/tissues of the
Arabidopsis plants expressing
AtOEP37::GUS construct.
A, seed imbibed at 4°C for 3 days.
B, embryo prepared from seeds in
A. C, D, 3-day old seedlings. E-I, 7-
day-old light-grown seedlings: E,
seedling; F, cotyledons of E; G,
root with root cap; H, middle portion
of root; I, transition zone of root. J,
7-day-old etiolated seedling. K-O 2-
to 6-week-old Arabidopsis. K,
seedling; L, shoot apex; M, portion
of rosette leaf; N, inflorescence; O,
petal. Scale bars for A, B, L, M =
0,1 mm, for C-J = 0,5 mm, for K, N
= 0,5 cm, for O = 1 mm.
3.2.3.4 Tissue-specific expression of the PsOEP37 protein
To investigate the distribution of the PsOEP37 protein in Pisum sativum plants, membrane
fractions of proteins were isolated from roots, rosette and cauline leaves, flowers, siliques and
seeds of pea. Western blot analysis was performed with these protein fractions.
Fig. 3.31 Immunoblotting of PsOEP37 localization in Pisum sativum plants.
60 µg of membrane fraction proteins isolated from roots (1), rosette (2) and cauline (3) leaves, flowers
(4), siliques (5) and seeds (6) were loaded on a 12% polyacrylamide gel and blotted against the anti-
PsOEP37 antibodies.
PsOEP37
37 kDa
1 2 3 4 5 6
PsOEP37
37 kDa
1 2 3 4 5 6
A B C D
E F G IH
J
K L M N O
A B C DC D
E F G IHE F G IH
J
K L M N O
A B C D
E F G IH
J
K L M N O
A B C DC D
E F G IHE F G IH
J
K L M N O

65
Immunoblotting with the polyclonal antiserum against the PsOEP37 protein demonstrated the
presence of a 37 kDa protein in all tested organs, with the highest level in roots, rosette
leaves, siliques and seeds (Fig.3.31). The lowest levels of PsOEP37 were detected in cauline
leaves and flowers.
3.2.4 Isolation and characterization of an AtOEP37 knockout mutant
A search in the GABI T-DNA insertion library revealed one candidate line GABI 722C01
(GABI-Kat, Rosso et al., 2003) for a knockout mutant in the AtOEP37 locus (Col-0
background). Amplification of the T-DNA flanking genomic fragment with the left border T-
DNA specific and the AtOEP37 gene-specific primers gave a 1000 bp PCR product, which
was sequenced. Sequencing showed that the T-DNA insert is localized in the end of exon 2,
interrupting the ORF at the last amino acid of exon 2. A schematic diagram of T-DNA
element localisation and orientation in the AtOEP37 gene is shown in Fig. 3.32.
Fig. 3.32 The Atoep37 T-DNA insertion knockout mutant.
Schematic diagram of T-DNA insert localization in the AtOEP37 locus. T-DNA disrupts ORF after
Tyr*168. For T-DNA element, the orientation of left (LB) and right (RB) borders is shown. Primer
annealing positions are depicted.
A homozygous Atoep37 line was identified by PCR analysis with two sets of primers: (i) T-
DNA specific and the AtOEP37 gene-specific primers, and (ii) two AtOEP37 gene-specific
pGABI1
o37araSRo37araXhoIs
ATG
ATT
3' UTR5' UTR
Eco RI (682)
BamHI (510) BamHI (1667)Pst I (1476)
Pst I (1568)
HindIII (748)
Hin dIII (2407)
Hin dIII (2710)
163
ATG
ATT
3' UTR5' UTR
Eco RI (682)
BamHI (510) BamHI (1667)Pst I (1476)
Pst I (1568)
HindIII (748)
Hin dIII (2407)
Hin dIII (2710)
163
ATG
ATT
3' UTR5' UTR
Eco RI (682)
BamHI (510) BamHI (1667)Pst I (1476)
Pst I (1568)
HindIII (748)
Hin dIII (2407)
Hin dIII (2710)
163
ATG
ATT
3' UTR5' UTR
Eco RI (682)
BamHI (510) BamHI (1667)Pst I (1476)
Pst I (1568)
HindIII (748)
Hin dIII (2407)
Hin dIII (2710)
163
ATG
ATT
3' UTR5' UTR
Eco RI (682)
BamHI (510) BamHI (1667)Pst I (1476)
Pst I (1568)
HindIII (748)
Hin dIII (2407)
Hin dIII (2710)
163
ATG
ATT
3' UTR5' UTR
Eco RI (682)
BamHI (510) BamHI (1667)Pst I (1476)
Pst I (1568)
HindIII (748)
Hin dIII (2407)
Hin dIII (2710)

66
primers (Fig. 3.33). The phenotype of the homozygous Atoep37 knockout mutant was
inspected and compared with wild-type under standard growth conditions. No detectable
difference was observed.
Fig. 3.33 PCR analysis of individual homozygous line Atoep37 and wild-type (Col). For PCR next primers were used: (i) T-DNA
specific pGABI1 and gene-specific o37araSR,
and (ii) two gene-specific o37araXhoIs and
o37araSR. Mut, mutant; WT, wild-type.
3.2.5 Electrophysiological analysis of the recombinant PsOEP37 protein
Overexpression of the PsOEP37 protein was performed in E. coli BL21(DH3) cells after
IPTG-induction of T7 promoter in the PsOEP37/pET14b plasmid (see 2.6). To check protein
overexpression, the E. coli cells, harvested before and 3 hours after IPTG induction were
lysed and proteins were separated on PAGE. Fig. 3.34 A shows that the IPTG-induced E. coli
lysat contained a 37 kDa band corresponding to the overexpressed PsOEP37. The E. coli
cells, harvested before IPTG induction, did not possess this band. The recombinant PsOEP37
protein was purified in form of inclusion bodies and Ni-affinity chromatography of the urea-
Fig. 3.34 PAGE analysis of overexpressed and purified of the PsOEP37 protein.
A. Overexpression of PsOEP37 in E. coli cells BL21(DH3). 1 and 4, protein marker; 2, E. coli lysat
before induction; 3, E. coli lysat after IPTG induction. B. Purification of the recombinant PsOEP37
protein using affinity chromatography. 1, protein marker; 2, eluted recombinant PsOEP37 protein.
1 2 3 4A
37 kDa
B
37 kDa
1 21 2 3 4A
37 kDa
1 2 3 4A
37 kDa
B
37 kDa
1 21 2 3 4A
37 kDa
mut
mutWT
WT
Primers pGABI1 o37araXhoIsfor PCR o37araSR o37araSR
1000 bp 500 bp
mut
mutWT
WT
Primers pGABI1 o37araXhoIsfor PCR o37araSR o37araSR
1000 bp 500 bp
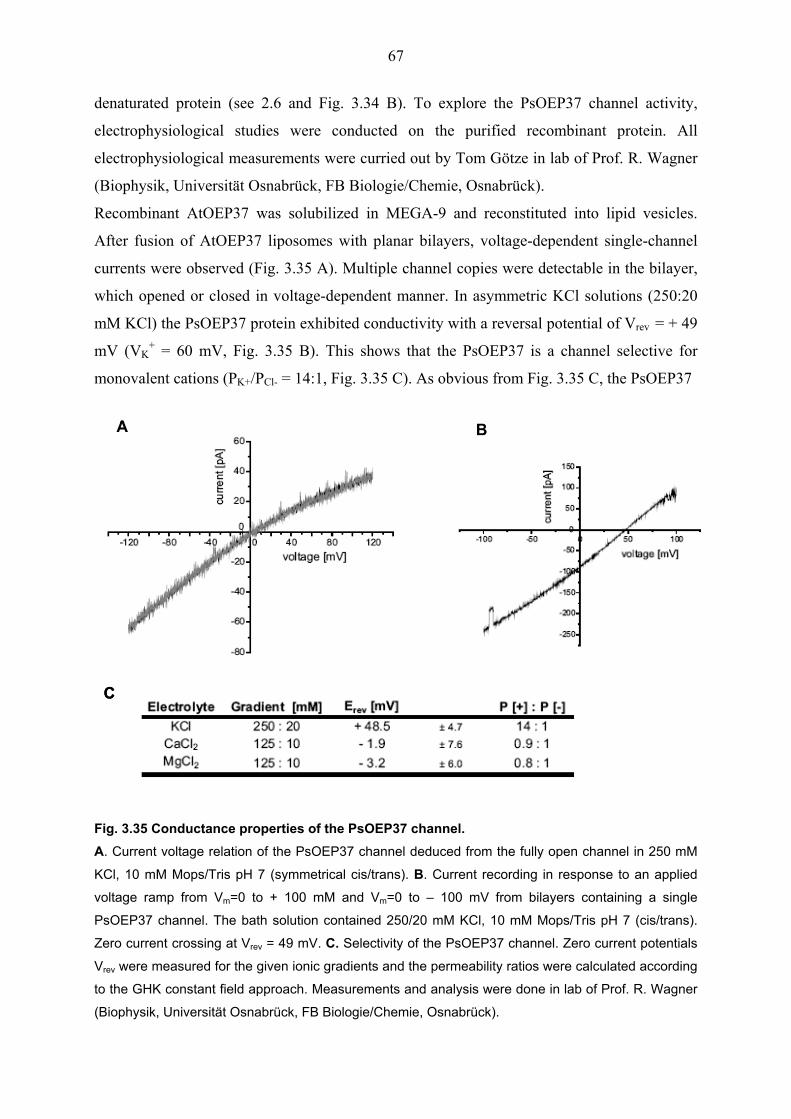
67
denaturated protein (see 2.6 and Fig. 3.34 B). To explore the PsOEP37 channel activity,
electrophysiological studies were conducted on the purified recombinant protein. All
electrophysiological measurements were curried out by Tom Götze in lab of Prof. R. Wagner
(Biophysik, Universität Osnabrück, FB Biologie/Chemie, Osnabrück).
Recombinant AtOEP37 was solubilized in MEGA-9 and reconstituted into lipid vesicles.
After fusion of AtOEP37 liposomes with planar bilayers, voltage-dependent single-channel
currents were observed (Fig. 3.35 A). Multiple channel copies were detectable in the bilayer,
which opened or closed in voltage-dependent manner. In asymmetric KCl solutions (250:20
mM KCl) the PsOEP37 protein exhibited conductivity with a reversal potential of Vrev = + 49
mV (VK+ = 60 mV, Fig. 3.35 B). This shows that the PsOEP37 is a channel selective for
monovalent cations (PK+/PCl- = 14:1, Fig. 3.35 C). As obvious from Fig. 3.35 C, the PsOEP37
Fig. 3.35 Conductance properties of the PsOEP37 channel. A. Current voltage relation of the PsOEP37 channel deduced from the fully open channel in 250 mM
KCl, 10 mM Mops/Tris pH 7 (symmetrical cis/trans). B. Current recording in response to an applied
voltage ramp from Vm=0 to + 100 mM and Vm=0 to – 100 mV from bilayers containing a single
PsOEP37 channel. The bath solution contained 250/20 mM KCl, 10 mM Mops/Tris pH 7 (cis/trans).
Zero current crossing at Vrev = 49 mV. C. Selectivity of the PsOEP37 channel. Zero current potentials
Vrev were measured for the given ionic gradients and the permeability ratios were calculated according
to the GHK constant field approach. Measurements and analysis were done in lab of Prof. R. Wagner
(Biophysik, Universität Osnabrück, FB Biologie/Chemie, Osnabrück).
C
A B
C
A B
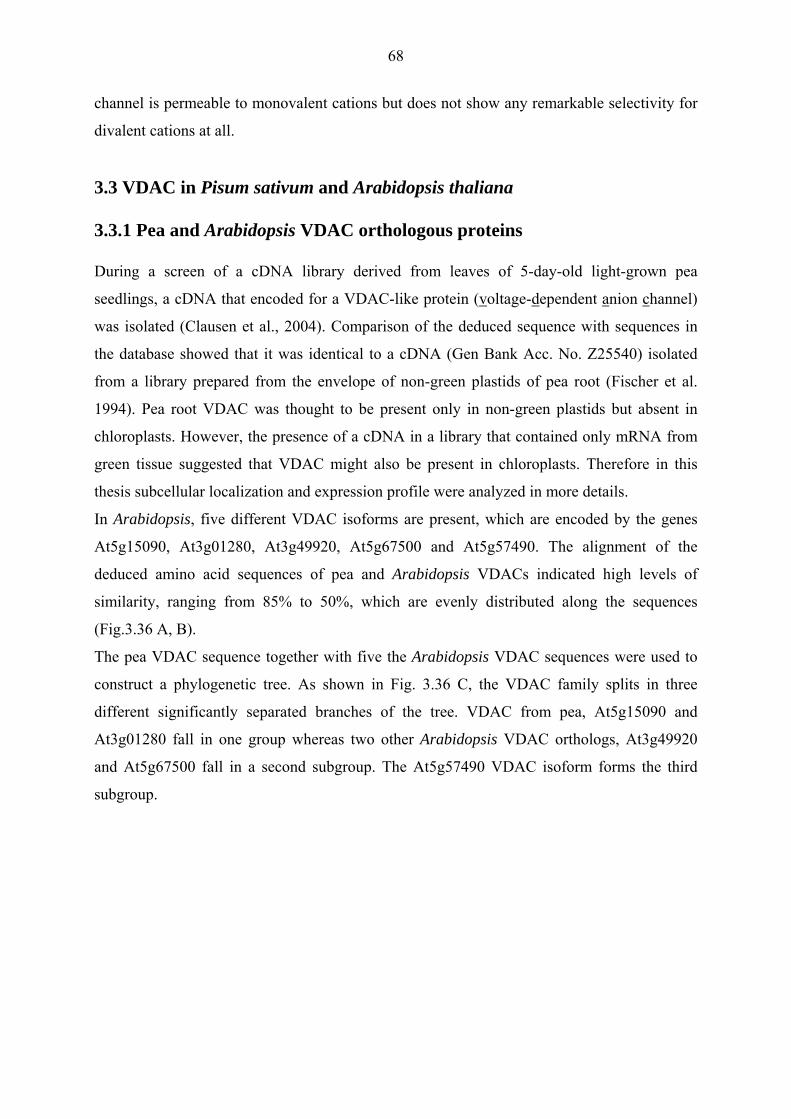
68
channel is permeable to monovalent cations but does not show any remarkable selectivity for
divalent cations at all.
3.3 VDAC in Pisum sativum and Arabidopsis thaliana
3.3.1 Pea and Arabidopsis VDAC orthologous proteins
During a screen of a cDNA library derived from leaves of 5-day-old light-grown pea
seedlings, a cDNA that encoded for a VDAC-like protein (voltage-dependent anion channel)
was isolated (Clausen et al., 2004). Comparison of the deduced sequence with sequences in
the database showed that it was identical to a cDNA (Gen Bank Acc. No. Z25540) isolated
from a library prepared from the envelope of non-green plastids of pea root (Fischer et al.
1994). Pea root VDAC was thought to be present only in non-green plastids but absent in
chloroplasts. However, the presence of a cDNA in a library that contained only mRNA from
green tissue suggested that VDAC might also be present in chloroplasts. Therefore in this
thesis subcellular localization and expression profile were analyzed in more details.
In Arabidopsis, five different VDAC isoforms are present, which are encoded by the genes
At5g15090, At3g01280, At3g49920, At5g67500 and At5g57490. The alignment of the
deduced amino acid sequences of pea and Arabidopsis VDACs indicated high levels of
similarity, ranging from 85% to 50%, which are evenly distributed along the sequences
(Fig.3.36 A, B).
The pea VDAC sequence together with five the Arabidopsis VDAC sequences were used to
construct a phylogenetic tree. As shown in Fig. 3.36 C, the VDAC family splits in three
different significantly separated branches of the tree. VDAC from pea, At5g15090 and
At3g01280 fall in one group whereas two other Arabidopsis VDAC orthologs, At3g49920
and At5g67500 fall in a second subgroup. The At5g57490 VDAC isoform forms the third
subgroup.

69
Fig. 3.36 VDAC orthologs in pea and Arabidopsis. A. Amino acid alignment of VDAC from Pisum sativum with VDAC isoforms from Arabidopsis. Identical
amino acids are boxed in black; similar exchanges are shaded in grey. B. Identity and similarity of the
Arabidopsis VDAC proteins with pea VDAC. C. Phylogenetic tree of VDAC from Pisum sativum
(VDAC) and five VDAC isoforms from Arabidopsis (Atg numbers from TAIR database are given). Tree
was constructed using Multalin 5.4.1 program (blosum62, F.Corpet, 1988).
50%31%At3g49920
66%44%At5g57490
69%49%At5g67500
80%64%At5g15090
85%69%At3g01280
Similarity (%)Identity (%)
50%31%At3g49920
66%44%At5g57490
69%49%At5g67500
80%64%At5g15090
85%69%At3g01280
Similarity (%)Identity (%)VDAC
At5g15090
At3g01280
At3g49920
At5g67500
At5g57490
10 PAM
VDAC
At5g15090
At3g01280
At3g49920
At5g67500
At5g57490
10 PAM
A
B C
50%31%At3g49920
66%44%At5g57490
69%49%At5g67500
80%64%At5g15090
85%69%At3g01280
Similarity (%)Identity (%)
50%31%At3g49920
66%44%At5g57490
69%49%At5g67500
80%64%At5g15090
85%69%At3g01280
Similarity (%)Identity (%)VDAC
At5g15090
At3g01280
At3g49920
At5g67500
At5g57490
10 PAM
VDAC
At5g15090
At3g01280
At3g49920
At5g67500
At5g57490
10 PAM
A
B C
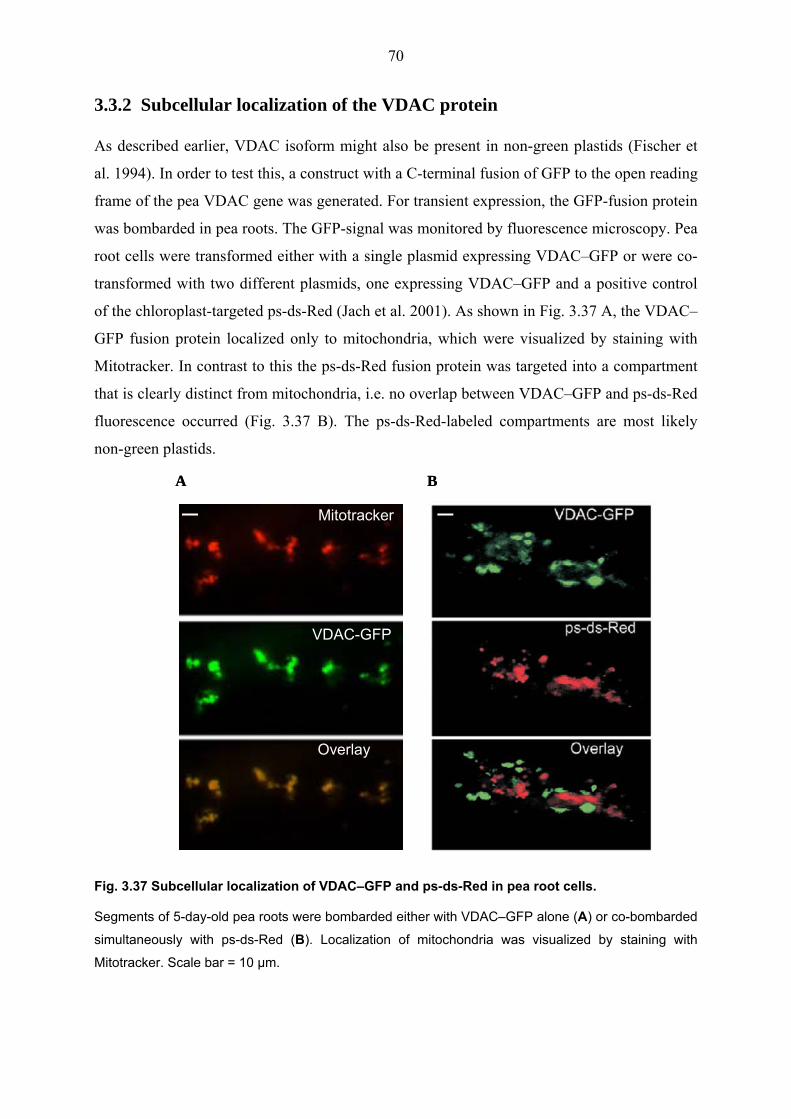
70
3.3.2 Subcellular localization of the VDAC protein
As described earlier, VDAC isoform might also be present in non-green plastids (Fischer et
al. 1994). In order to test this, a construct with a C-terminal fusion of GFP to the open reading
frame of the pea VDAC gene was generated. For transient expression, the GFP-fusion protein
was bombarded in pea roots. The GFP-signal was monitored by fluorescence microscopy. Pea
root cells were transformed either with a single plasmid expressing VDAC–GFP or were co-
transformed with two different plasmids, one expressing VDAC–GFP and a positive control
of the chloroplast-targeted ps-ds-Red (Jach et al. 2001). As shown in Fig. 3.37 A, the VDAC–
GFP fusion protein localized only to mitochondria, which were visualized by staining with
Mitotracker. In contrast to this the ps-ds-Red fusion protein was targeted into a compartment
that is clearly distinct from mitochondria, i.e. no overlap between VDAC–GFP and ps-ds-Red
fluorescence occurred (Fig. 3.37 B). The ps-ds-Red-labeled compartments are most likely
non-green plastids.
Fig. 3.37 Subcellular localization of VDAC–GFP and ps-ds-Red in pea root cells.
Segments of 5-day-old pea roots were bombarded either with VDAC–GFP alone (A) or co-bombarded
simultaneously with ps-ds-Red (B). Localization of mitochondria was visualized by staining with
Mitotracker. Scale bar = 10 µm.
Mitotracker
VDAC-GFP
Overlay
BA
Mitotracker
VDAC-GFP
Overlay
BA
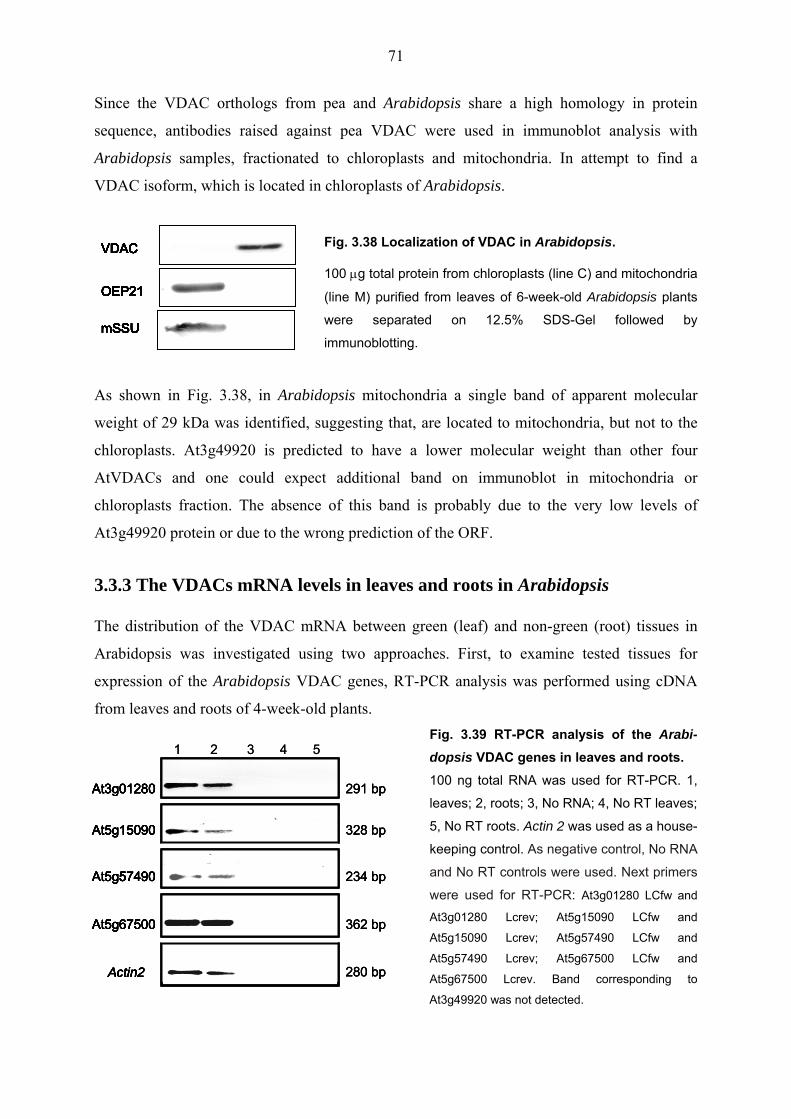
71
Since the VDAC orthologs from pea and Arabidopsis share a high homology in protein
sequence, antibodies raised against pea VDAC were used in immunoblot analysis with
Arabidopsis samples, fractionated to chloroplasts and mitochondria. In attempt to find a
VDAC isoform, which is located in chloroplasts of Arabidopsis.
Fig. 3.38 Localization of VDAC in Arabidopsis.
100 µg total protein from chloroplasts (line C) and mitochondria
(line M) purified from leaves of 6-week-old Arabidopsis plants
were separated on 12.5% SDS-Gel followed by
immunoblotting.
As shown in Fig. 3.38, in Arabidopsis mitochondria a single band of apparent molecular
weight of 29 kDa was identified, suggesting that, are located to mitochondria, but not to the
chloroplasts. At3g49920 is predicted to have a lower molecular weight than other four
AtVDACs and one could expect additional band on immunoblot in mitochondria or
chloroplasts fraction. The absence of this band is probably due to the very low levels of
At3g49920 protein or due to the wrong prediction of the ORF.
3.3.3 The VDACs mRNA levels in leaves and roots in Arabidopsis
The distribution of the VDAC mRNA between green (leaf) and non-green (root) tissues in
Arabidopsis was investigated using two approaches. First, to examine tested tissues for
expression of the Arabidopsis VDAC genes, RT-PCR analysis was performed using cDNA
from leaves and roots of 4-week-old plants. Fig. 3.39 RT-PCR analysis of the Arabi-dopsis VDAC genes in leaves and roots. 100 ng total RNA was used for RT-PCR. 1,
leaves; 2, roots; 3, No RNA; 4, No RT leaves;
5, No RT roots. Actin 2 was used as a house-
keeping control. As negative control, No RNA
and No RT controls were used. Next primers
were used for RT-PCR: At3g01280 LCfw and
At3g01280 Lcrev; At5g15090 LCfw and
At5g15090 Lcrev; At5g57490 LCfw and
At5g57490 Lcrev; At5g67500 LCfw and
At5g67500 Lcrev. Band corresponding to
At3g49920 was not detected.
mSSU
OEP21
VDAC
mSSU
OEP21
VDAC
mSSU
OEP21
VDAC
mSSU
OEP21
VDAC
mSSU
OEP21
VDAC
mSSU
OEP21
VDAC
mSSU
OEP21
VDAC
mSSU
OEP21
VDAC
mSSU
OEP21
VDAC
mSSU
OEP21
VDAC
mSSU
OEP21
VDAC
mSSU
OEP21
VDAC
mSSU
OEP21
VDAC
mSSU
OEP21
VDAC
At3g01280
At5g15090
At5g57490
Actin2
At5g67500
280 bp
362 bp
234 bp
328 bp
291 bp
5
At3g01280
At5g15090
At5g57490
Actin2
At5g67500
1 2 3 4 5
At3g01280
At5g15090
At5g57490
Actin2
At5g67500
280 bp
362 bp
234 bp
328 bp
291 bp
5
At3g01280
At5g15090
At5g57490
Actin2
At5g67500
At3g01280
At5g15090
At5g57490
Actin2
At5g67500
280 bp
362 bp
234 bp
328 bp
291 bp
5
At3g01280
At5g15090
At5g57490
Actin2
At5g67500
1 2 3 4 5
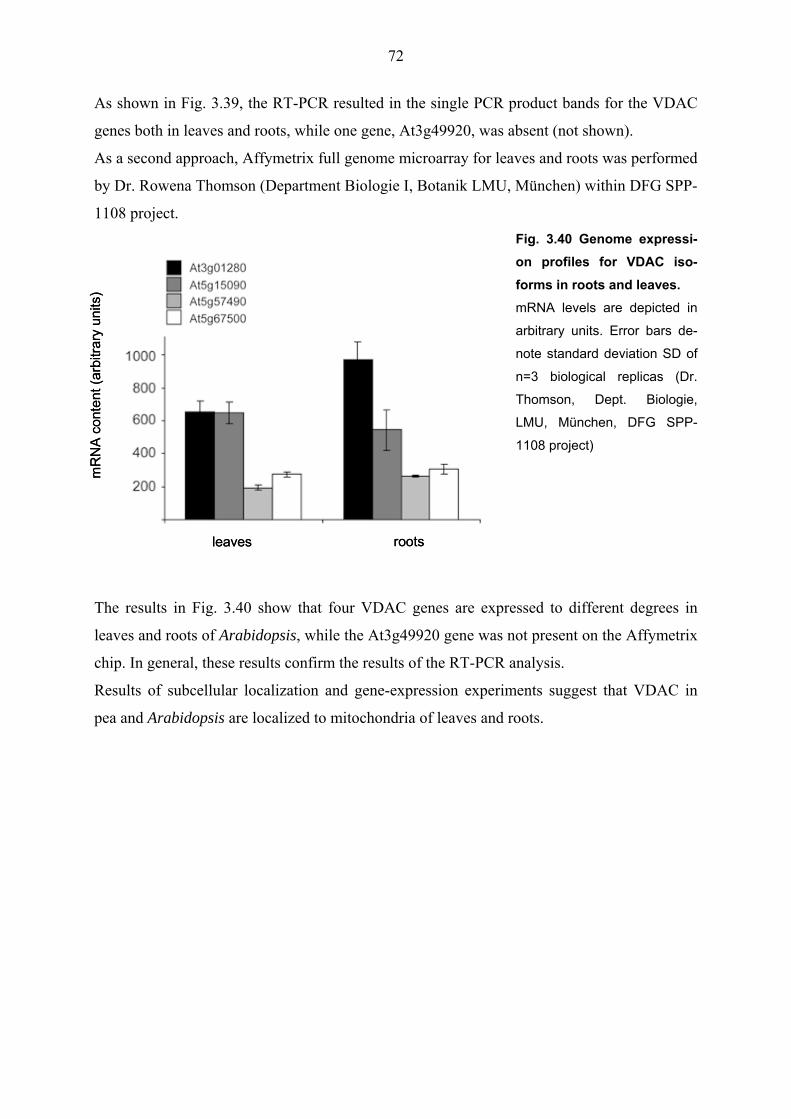
72
As shown in Fig. 3.39, the RT-PCR resulted in the single PCR product bands for the VDAC
genes both in leaves and roots, while one gene, At3g49920, was absent (not shown).
As a second approach, Affymetrix full genome microarray for leaves and roots was performed
by Dr. Rowena Thomson (Department Biologie I, Botanik LMU, München) within DFG SPP-
1108 project. Fig. 3.40 Genome expressi-on profiles for VDAC iso-forms in roots and leaves. mRNA levels are depicted in
arbitrary units. Error bars de-
note standard deviation SD of
n=3 biological replicas (Dr.
Thomson, Dept. Biologie,
LMU, München, DFG SPP-
1108 project)
The results in Fig. 3.40 show that four VDAC genes are expressed to different degrees in
leaves and roots of Arabidopsis, while the At3g49920 gene was not present on the Affymetrix
chip. In general, these results confirm the results of the RT-PCR analysis.
Results of subcellular localization and gene-expression experiments suggest that VDAC in
pea and Arabidopsis are localized to mitochondria of leaves and roots.
leaves roots
mR
NA
cont
ent (
arbi
trary
uni
ts)
leaves roots
mR
NA
cont
ent (
arbi
trary
uni
ts)

73
4 Discussion
Chloroplasts and mitochondria are semiautonomous organelles that are involved in different
metabolic pathways essential for the whole plant cell. Two membranes, outer and inner
envelopes, which separate the chloroplasts stroma and mitochondria matrix from the
cytoplasm, surround these organelles.
4.1 The OEP16 family in pea and Arabidopsis thaliana
Pea chloroplasts so far contain one identified channel isoform protein PsOEP16 located in the
outer envelope membrane (Pohlmeyer et al., 1997), whereas Arabidopsis possesses four
orthologs: AtOEP16.1, AtOEP16.2, AtOEP16.3 and AtOEP16.4. The Arabidopsis OEP16
isoforms share 79-46% homology in protein sequence with PsOEP16 and have a theoretical pI
in the basic range suggesting chloroplast outer envelope or at least membrane location of all
AtOEP16s. The domain structure and phylogenetic analyses revealed that the OEP16 proteins
belong to the TIM17/TIM22/TIM23 family, which facilitates pre-protein translocation from
the cytosol into mitochondria (Rassow et al., 1999), and form a new family of pre-protein and
amino acid transporters, called PRAT. Although all AtOEP16 proteins of Arabidopsis are
similar to mitochondrial TIMs, it could be shown that AtOEP16.1, AtOEP16.2 and
AtOEP16.4 are located in chloroplasts and only AtOEP16.3 is in mitochondria (see below).
4.1.1 Structure and topology of the OEP16 proteins
All topology and structure analyses have been done on PsOEP16. Due to the high similarity,
the same topology and structure are suggested for Arabidopsis orthologs. Based on site-
directed mutagenesis and spectrometric analyses of recombinant PsOEP16 (Linke et al., 2004)
the topology model for OEP16 with four α-helical domains was developed (see Fig. 3.2). The
α-helical structure is known for several membrane proteins, e.g. for the mitochondrial
TIM17/22/23 proteins and for LivH, an amino acid transporter of the E. coli (Milisav et al.,
2001; Folsch et al., 1998; Meier et al., 2005; Nazos et al., 1986). The transmembrane α-
helices of the OEP16 proteins are encoded by a 16-22 stretch of predominantly hydrophobic
residues.
The transmembrane α-helix I of the OEP16 orthologs is responsible for substrate specifity
and, together with helix II, for pore formation (Pohlmeyer et al., 1997; Steinkamp et al.,
74
2000). It is amphiphilic due to its partial exposure to the water-filled pore, containing two
charged residues in the middle of the membrane.
Pohlmeyer et al. (1997) showed that the N-terminal part of PsOEP16 is exposed to the
cytoplasm, therefore the hydrophilic loop domain connecting the transmembrane domains I
and II is faced to the chloroplast interior or packed in the water-filled pore formed by the
transmembrane regions. Similarly to PsOEP16, the AtOEP16s channels contain this soluble
loop domain I with 28 amino acid residues in PsOEP16, AtOEP16.1 and AtOEP16.4, 29
amino acid residues in AtOEP16.3 and 36 amino acid residues in AtOEP16.2. This loop
region contains a high proportion of small polar residues like Ala, Ser, Gly and Thr and
charged amino acid residues like Lys, Arg, Asp and Glu. The soluble loop domain I has no
strong sequence similarity among the AtOEP16s and may form part of the selectivity filter or
facilitate the gating of the OEP16 proteins. Such long soluble loop domain is common for the
porin proteins from Gram-negative bacteria (Conlan et. al., 2000).
In the position just before the start of the first α-helix spanning the membrane, all OEP16s
share a conservative proline residue, which has a very rigid cyclic ring and therefore, presence
of proline in protein sequence allows the disruption of the a-helical turn and the creation of a
fixed kink in the beginning of the first transmembrane domain.
The AtOEP16.1 protein contains a cysteine residue at position 71, in the beginning of the
second transmembrane domain. This cysteine residue, having a reactive sulfhydryl group
could be responsible for forming a disulfide bridge, which might trigger the correct folding of
the AtOEP16.1 channel in a dimeric form in the membrane. At the same position of the
PsOEP16 there is also cysteine residue, which was shown to form homodimers in cross-link
experiments (Pohlmeyer et al., 1997). In contrast, AtOEP16.2 and AtOEP16.3 do not possess
any cysteine residues. Interestingly, AtOEP16.4 contains five cysteine residues, one in the
first and fourth transmembrane region, one in the first soluble loop and two cysteines in the
second transmembrane segment.
The PsOEP16 and AtOEP16.1 proteins possess histidine residues at different positions of
their soluble loop I, whereas AtOEP16.2 has histidine residues in all the soluble parts of the
protein sequence. The imidazole side chain of histidine has a pKa of 6.8 at the pH of
cytoplasm. Small shifts of cellular pH change the charge of histidine side chain. Histidine is
frequently found in protein active sites and can play a role in binding to specific amino acids,
such as proline or other amino acids possessing an aromatic ring (Macias et al., 2002). Ability
of the histidine residues in the soluble loop I of the AtOEP16.2 protein as well as the longest
75
length (36 residues) of this loop in contrast to other AtOEP16s might determine the selectivity
of AtOEP16.2 protein.
PsOEP16, AtOEP16.1 and AtOEP16.2 contain aspartate residue in transmembrane domain I
and Lys and Glu residues in transmembrane region II. These amino acid residues might
facilitate the selective transport of charged solutes, e.g. charged amino acids or other
compounds with primary amino groups like it was shown for PsOEP16.
4.1.2 Subcellular localization of the AtOEP16.1-4 proteins
A combination of strategies is usually required for the determination of the subcellular
localization of membrane proteins. In silico prediction analysis did not show any target
organelle for the AtOEP16.1-4 proteins, since a classical N-terminal cleavable transit signal
sequence defining a destiny organelle was not identified.
Transient expression of the AtOEP16.1-4 proteins fused to fluorescent reporter proteins in pea
roots and Arabidopsis protoplasts as well as immunoblot analysis revealed that AtOEP16.1,
AtOEP16.2 and AtOEP16.4 are located in plastids, whereas AtOEP16.3 was found in
mitochondria.
Several mass spectrometry-based proteomic studies of Arabidopsis leaf chloroplasts and
mitochondria have been done (Wijk et al., 2000; Millar et al., 2005; Bardel et al., 2002; Ferro
et al., 2003; Froehlich et al., 2003) and localization of a lot of proteins was elucidated. Thus,
AtOEP16.1 has been found in the outer membrane of plastids, whereas AtOEP16.3 was
shown to be in mitochondria. The AtOEP16.2 and AtOEP16.4 proteins have not been
detected, probably because of the specific (AtOEP16.2) or the low level of expression
(AtOEP16.4) in leaf tissue (compare 4.1.4) and limitations of the above-mentioned proteomic
studies. These results are in line with our findings.
In summary, these results point to localization of the AtOEP16.1, AtOEP16.2 and AtOEP16.4
proteins in plastids, while AtOEP16.3 is in mitochondria.
4.1.3 AtOEP16.1-4 gene expression
To obtain evidence about the tissue-specific distribution of the members of the OEP16 family
in Arabidopsis, several approaches were used, namely immunoblot analysis, RT-PCR
analysis, Affymetrix microarray analysis and analysis of Arabidopsis plants transformed with
promoter-GUS transcriptional fusions from each gene. The data derived from these
approaches were complemented by a sequence-based analysis of the promoter regions in an
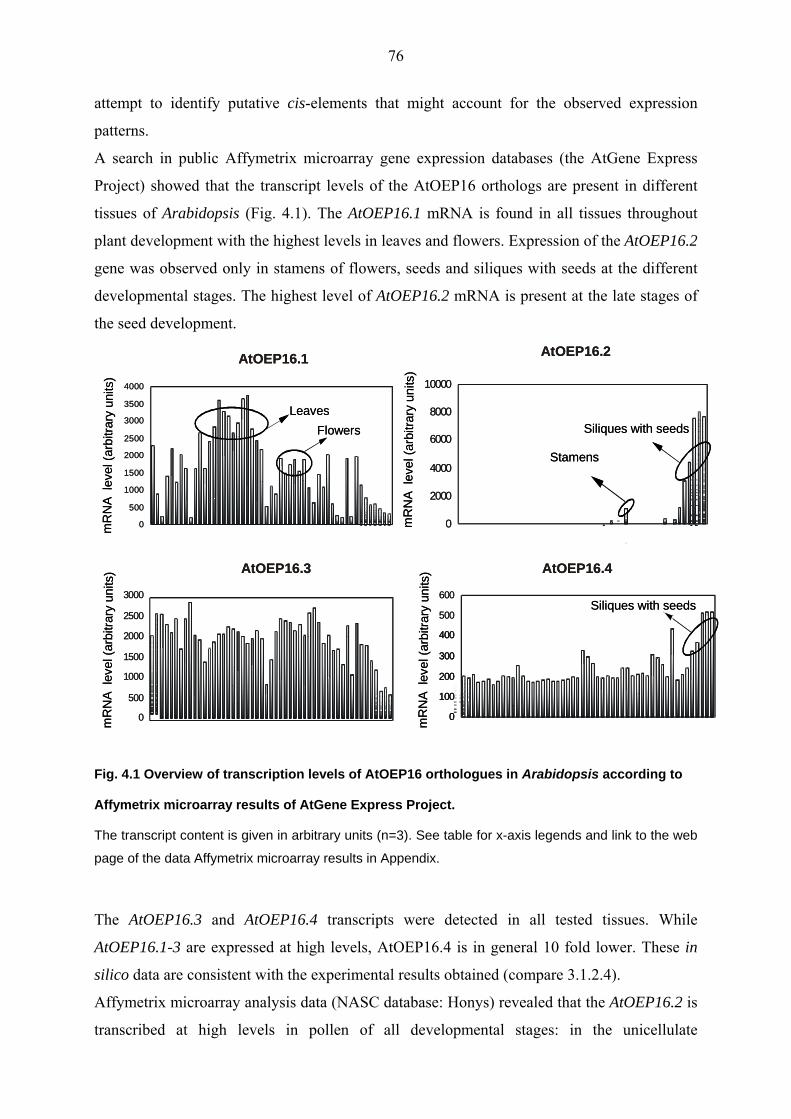
76
attempt to identify putative cis-elements that might account for the observed expression
patterns.
A search in public Affymetrix microarray gene expression databases (the AtGene Express
Project) showed that the transcript levels of the AtOEP16 orthologs are present in different
tissues of Arabidopsis (Fig. 4.1). The AtOEP16.1 mRNA is found in all tissues throughout
plant development with the highest levels in leaves and flowers. Expression of the AtOEP16.2
gene was observed only in stamens of flowers, seeds and siliques with seeds at the different
developmental stages. The highest level of AtOEP16.2 mRNA is present at the late stages of
the seed development.
Fig. 4.1 Overview of transcription levels of AtOEP16 orthologues in Arabidopsis according to
Affymetrix microarray results of AtGene Express Project.
The transcript content is given in arbitrary units (n=3). See table for x-axis legends and link to the web
page of the data Affymetrix microarray results in Appendix.
The AtOEP16.3 and AtOEP16.4 transcripts were detected in all tested tissues. While
AtOEP16.1-3 are expressed at high levels, AtOEP16.4 is in general 10 fold lower. These in
silico data are consistent with the experimental results obtained (compare 3.1.2.4).
Affymetrix microarray analysis data (NASC database: Honys) revealed that the AtOEP16.2 is
transcribed at high levels in pollen of all developmental stages: in the unicellulate
0
500
1000
1500
2000
2500
3000
AtOEP16.3
0
500
1000
1500
2000
2500
3000
3500
4000
AtOEP16.1
FlowersLeaves
0
2000
4000
6000
8000
10000
AtOEP16.2
Siliques with seeds
Stamens
0
100
200
300
400
500
600
AtOEP16.4
Siliques with seeds
mR
NA
leve
l (ar
bit ra
r y u
nits
) m
RN
A le
vel (
arbi
t rar y
uni
ts)
mR
NA
leve
l (ar
bit ra
r y u
nits
) m
RN
A l e
vel (
arbi
tr ary
uni
t s)
0
500
1000
1500
2000
2500
3000
AtOEP16.3
0
500
1000
1500
2000
2500
3000
3500
4000
AtOEP16.1
FlowersLeaves
0
2000
4000
6000
8000
10000
AtOEP16.2
Siliques with seeds
Stamens
0
100
200
300
400
0
100
200
300
400
500
600
AtOEP16.4
Siliques with seeds
mR
NA
leve
l (ar
bit ra
r y u
nits
) m
RN
A le
vel (
arbi
t rar y
uni
ts)
mR
NA
leve
l (ar
bit ra
r y u
nits
) m
RN
A l e
vel (
arbi
tr ary
uni
t s)

77
microspores, the bicellular and tricellular pollen (Fig. 4.2 A). In the mature pollen the levels
of the AtOEP16.2 gene transcript decreases. The data of the Affymetrix microarray analysis
of the transcript levels in Arabidopsis seeds (NASC database: Bergua) showed that developed
seeds, which were harvested from no-open yellow siliques, contain high levels of the
AtOEP16.2 transcript (Fig. 4.2 B). The mRNA level is decreasing 3-fold with seed
maturation.
Fig. 4.2 Affymetrix microarray analysis of the AtOEP16.2 transcript levels in Arabidopsis. A, AtOEP16.2 transcript levels in microspores and pollen (NASC database: Honys). B, AtOEP16.2
transcript levels in fresh (from no-open yellow siliques) and mature (2 months after harvesting) seeds
(NASC database: Bergua). The transcript content is given in arbitrary units (n=2±SD).
Considering that Arabidopsis expresses four OEP16 genes encoding proteins targeted to
chloroplasts and mitochondria it seems likely that these orthologs carry out diverse
physiological functions. If this is the case, one would expect to observe differences in the
regulated expression of these proteins and their mRNAs in response to environmental stimuli.
One such environmental stimulus tested is light, which influences expression of a multitude of
plant genes, for example chloroplast genes, such as the small subunit of ribulose bisphosphate
carboxylase (rbcS) (Pilgrim et al., 1993), proteins of ELIP proteins (Grimm et al., 1987; Hutin
et al., 2003), CAB, chlorophyll a/b binding protein (Beator and Kloppstech, 1993) and POR
proteins (Su et al., 2001). Therefore, available online data of Affymetrix microarrays analysis
of Arabidopsis throughout the diurnal cycle were checked.
As shown in Fig. 4.3, only the AtOEP16.1 mRNA showed a diurnal oscillation. The leaf
AtOEP16.1 mRNA level was high in onset of dark, followed by the progressive transcript
degradation during a 12-hours dark period and within the next two hours of the light-onset (13
0
500
1000
1500
2000
Unicellulate Bicellular Tricellular Maturemicrospores pollen pollen pollen
mR
NA
cont
ent/a
rbitr
ary
units
0
1000
2000
3000
4000
Fresh seeds Mature seeds
mR
NA
cont
ent/a
rbitr
ary
units
A B
0
500
1000
1500
2000
Unicellulate Bicellular Tricellular Maturemicrospores pollen pollen pollen
mR
NA
cont
ent/a
rbitr
ary
units
0
500
1000
1500
2000
Unicellulate Bicellular Tricellular Maturemicrospores pollen pollen pollen
mR
NA
cont
ent/a
rbitr
ary
units
0
1000
2000
3000
4000
Fresh seeds Mature seeds
mR
NA
cont
ent/a
rbitr
ary
units
0
1000
2000
3000
4000
Fresh seeds Mature seeds
mR
NA
cont
ent/a
rbitr
ary
units
A B

78
and 14 hours time points on the plot). After following 2 hours of light, a re-accumulation of
the AtOEP16.1 transcript started and reached a maximum at the 12-hours of light-onset. In
contrast to AtOEP16.1, transcripts encoding AtOEP16.3 and AtOEP16.4 did not change over
the time-course of the experiment.
Fig. 4.3 Affymetrix microarray analysis of diurnal dependence of the AtOEP16.1, AtOEP16.3
and AtOEP16.4 transcript levels in leaves of Arabidopsis.
Leaves were harvested from Arabidopsis plants (Col-0) at growth stage 3.90 (Boyes et al., 2001)
grown under a diurnal cycle of 12 hours dark - 12 hours light. Within this cycle, leaves were harvested
at 0 (end of day), 1, 2, 4, 8, 12 (end of night), 13, 14, 16, 20 and 24 hours. The transcript content is
given in arbitrary units (n=2±SD). The dark and light periods are indicated (NASC database: Smith).
Another environmental stimulus, which was tested, was a cold stress. Cold temperatures
trigger the transcription of many cold-responsive genes, which encode a diverse array of
proteins such as enzymes involved in respiration and metabolism of carbohydrates, lipids,
phenylpropanoids and antioxidants; molecular chaperones, antifreeze proteins (Guy 1999; Liu
2002; Jang et al. 2004; Teige et al., 2004). Therefore, attempts to explore whether the
transcription of the AtOEP16.1-4 genes is changed in answer to cold stress, corresponding
Affymetrix microarray results were checked.
As shown in Fig. 4.4, the transcript levels of AtOEP16.1 in shoots increased 2-fold after 3
hours and drastically after 6-24 hours of cold stress. Transcript levels of AtOEP16.3 and
AtOEP16.4 were not changed. Interestingly, that mRNA levels of cold responsive protein
0
500
1000
1500
2000
2500
0 1 2 4 8 12 13 14 16 20 24
Time, hours
mR
NA
leve
l (ar
bitra
ry u
nits
)
AtOEP16.4AtOEP16.3AtOEP16.1
DARK LIGHT
0
500
1000
1500
2000
2500
0 1 2 4 8 12 13 14 16 20 24
Time, hours
mR
NA
leve
l (ar
bitra
ry u
nits
)
AtOEP16.4AtOEP16.3AtOEP16.1
0
500
1000
1500
2000
2500
0 1 2 4 8 12 13 14 16 20 24
Time, hours
mR
NA
leve
l (ar
bitra
ry u
nits
)
0
500
1000
1500
2000
2500
0 1 2 4 8 12 13 14 16 20 24
Time, hours
mR
NA
leve
l (ar
bitra
ry u
nits
)
AtOEP16.4AtOEP16.3AtOEP16.1
AtOEP16.4AtOEP16.3AtOEP16.1AtOEP16.1
DARK LIGHT
0
500
1000
1500
2000
2500
0 1 2 4 8 12 13 14 16 20 24
Time, hours
mR
NA
leve
l (ar
bitra
ry u
nits
)
0
500
1000
1500
2000
2500
0 1 2 4 8 12 13 14 16 20 24
Time, hours
mR
NA
leve
l (ar
bitra
ry u
nits
)
AtOEP16.4AtOEP16.3AtOEP16.1
AtOEP16.4AtOEP16.3AtOEP16.1AtOEP16.1
0
500
1000
1500
2000
2500
0 1 2 4 8 12 13 14 16 20 24
Time, hours
mR
NA
leve
l (ar
bitra
ry u
nits
)
0
500
1000
1500
2000
2500
0 1 2 4 8 12 13 14 16 20 24
Time, hours
mR
NA
leve
l (ar
bitra
ry u
nits
)
AtOEP16.4AtOEP16.3AtOEP16.1AtOEP16.1
AtOEP16.4AtOEP16.3AtOEP16.1AtOEP16.1
DARK LIGHT

79
Cor15b (At2g42530, Chinnusamy et al., 2003) and cold acclimation protein FL3-5A3
(At2g15970, Seki et al., 2001) showed the same response patterns as well as AtOEP16.1.
Fig. 4.4 Affymetrix microarray analysis of influence of cold stress (4°C) in Arabidopsis. The mRNA levels of AtOEP16.1, AtOEP16.3, AtOEP16.4, At2g42530 and At2g15970 in shoots after
0.5, 1, 3, 6, 12 and 24 hours of cold stress. The transcript content is given in arbitrary units (n=2±SD).
(NASC database: Nover).
A search for cis-acting elements using the NSITE-PL program revealed the presence of
various binding sites in the AtOEP16.1, AtOEP16.2 promoter regions, underlining the RT-
PCR, Affymetrix microarray and promoter::GUS analysis results.
The sequence region of 1500 bp, chosen for promoter-GUS analysis of AtOEP16.1, possesses
several putative regulatory elements (Fig. 4.5 A) involved in responses to (i) light - GT-1/16
JJ1 (Yukio Nagano et al., 2001) and GATA box (Gilmartin et al., 1990; Reyes et al., 2004)
and (ii) cold - DRE/CRT (Yamaguchi-Shinozaki et al., 1994) and MYC (Chinnusamy et al.,
2003).
The sequence of the AtOEP16.2 promoter region (728 bp upstream from ATG start codon)
contains several putative cis-acting elements (Fig. 4.5 B) responsible for (i) embryogenesis
and seed germination - box d motif (Mena, 2002; Isabel-LaMoneda, 2003), ABRE A and
ABRE6/2 (Bensmihen, 2002; Lopez-Molina, 2003) and (ii) pollen development -
Pollen1LELAT52 (Bate el al., 1989) and GTGANTG10 (Rogers et al., 2001).
mR
NA
leve
l (ar
bitra
ry u
nits
)
0
1000
2000
3000
4000
5000
6000
7000
0.5 1 3 6 12 24
AtOEP16.1AtOEP16.3AtOEP16.4At2g42530At2g15970
hours
mR
NA
leve
l (ar
bitra
ry u
nits
)
0
1000
2000
3000
4000
5000
6000
7000
0.5 1 3 6 12 24
AtOEP16.1AtOEP16.3AtOEP16.4At2g42530At2g15970
hours
mR
NA
leve
l (ar
bitra
ry u
nits
)
0
1000
2000
3000
4000
5000
6000
7000
0.5 1 3 6 12 24
AtOEP16.1AtOEP16.3AtOEP16.4At2g42530At2g15970
hours
mR
NA
leve
l (ar
bitra
ry u
nits
)
0
1000
2000
3000
4000
5000
6000
7000
0.5 1 3 6 12 24
AtOEP16.1AtOEP16.3AtOEP16.4At2g42530At2g15970
hours
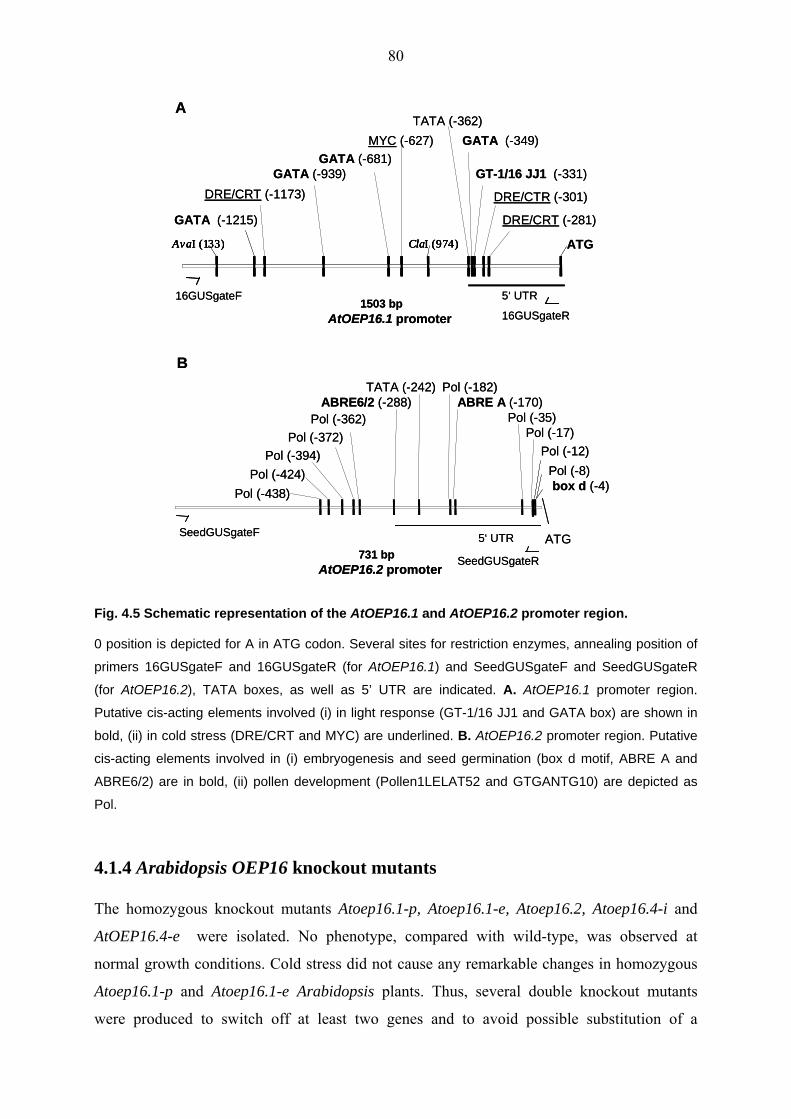
80
Fig. 4.5 Schematic representation of the AtOEP16.1 and AtOEP16.2 promoter region.
0 position is depicted for A in ATG codon. Several sites for restriction enzymes, annealing position of
primers 16GUSgateF and 16GUSgateR (for AtOEP16.1) and SeedGUSgateF and SeedGUSgateR
(for AtOEP16.2), TATA boxes, as well as 5’ UTR are indicated. A. AtOEP16.1 promoter region.
Putative cis-acting elements involved (i) in light response (GT-1/16 JJ1 and GATA box) are shown in
bold, (ii) in cold stress (DRE/CRT and MYC) are underlined. B. AtOEP16.2 promoter region. Putative
cis-acting elements involved in (i) embryogenesis and seed germination (box d motif, ABRE A and
ABRE6/2) are in bold, (ii) pollen development (Pollen1LELAT52 and GTGANTG10) are depicted as
Pol.
4.1.4 Arabidopsis OEP16 knockout mutants
The homozygous knockout mutants Atoep16.1-p, Atoep16.1-e, Atoep16.2, Atoep16.4-i and
AtOEP16.4-e were isolated. No phenotype, compared with wild-type, was observed at
normal growth conditions. Cold stress did not cause any remarkable changes in homozygous
Atoep16.1-p and Atoep16.1-e Arabidopsis plants. Thus, several double knockout mutants
were produced to switch off at least two genes and to avoid possible substitution of a
ATGAvaI (133) ClaI (974)
16GUSgateF
16GUSgateRAtOEP16.1 promoter1503 bp
DRE/CRT (-281)
DRE/CRT (-1173) DRE/CTR (-301)
GT-1/16 JJ1 (-331)GATA (-939)
MYC (-627)
GATA (-1215)
TATA (-362)
AvaI (133) ClaI (974)
5‘ UTR
GATA (-349)GATA (-681)
5‘ UTR ATGSeedGUSgateF
SeedGUSgateR
box d (-4)
ABRE6/2 (-288)TATA (-242)
ABRE A (-170)
Pol (-372)
AtOEP16.2 promoter731 bp
Pol (-394)Pol (-424)
Pol (-438)
Pol (-362)
Pol (-182)
Pol (-35)
Pol (-12)Pol (-17)
Pol (-8)
A
B
81
disrupted gene with another, still functional in a single knockout mutant. The following
double mutants were produced: Atoep16.4-i x Atoep16.1-e, Atoep16.4-e x Atoep16.1-p,
Atoep16.4-i x Atoep16.2, Atoep16.4-e x Atoep16.2. Only the double Atoep16.4-e x Atoep16.2
mutant had shorter siliques and less seeds per silique in contrast to wild-type plants. The
double mutants are currently under investigation.
To analyse the changes in gene expression in leaves of the homozygous Atoep16.1-p
knockout plants, cDNA macroarrays have been carried out. Three genes playing a role in
amino acid metabolism and transport were up-regulated in leaves of the 4-week-old
Atoep16.1-p T-DNA mutant, namely (i) naringenin-chalcone synthase, an enzyme for
biosynthesis of L-phenylalanine and L-tyrosine derivatives, (ii) S-adenosylmethionine
synthase 2 and (iii) a putative proline transporter. Several genes were found with reduced
expression levels, namely LHT1, an amino acid permease, which transports lysine and
arginine; a chloroplast-localized ATP sulfurylase precursor, involved in glutathione and
cysteine synthesis; two putative sucrose transporters.
4.1.5 Proposed function of the Arabidopsis OEP16 proteins
AtOEP16.1-4 encode α-helical pore-forming membrane proteins. Similar to PsOEP16, it is
proposed that the AtOEP16.1 channel transports amino acids and compounds with primary
amino groups via the outer envelope of chloroplasts. Thus, the AtOEP16.1 channel is
involved in nitrogen assimilation and amino acid metabolism. In non-legume plants, nitrogen
assimilation begins with the uptake of inorganic nitrogen, nitrate or ammonium, from the soil.
Nitrate is subsequently reduced to ammonium (NH4+) and then assimilated into an organic
form as glutamate and glutamine. These amino acids are the nitrogen donors in the
biosynthesis of essentially all other amino acids and other important nitrogen-containing
compounds such as nucleic acids, chlorophyll, hormones and products of secondary
metabolism (Oliveira et al., 2002).
AtOEP16.1 is a highly expressed ubiquitous protein. Transcriptome analysis, using
Affymetrix ATH1 arrays, revealed that expression of the AtOEP16.1 gene in leaves is light
inducible and the AtOEP16.1 mRNA content is reduced in dark (Fig. 4.3).
Additionally, Affymetrix ATH1 array analysis revealed that AtOEP16.1 expression is induced
by cold (Fig. 4.4), therefore it is suggested that AtOEP16.1 allows the adaptation of plant to
the cold stress, as well as cold responsive protein Cor15b (At2g42530; Chinnusamy et al.,

82
2003) and cold acclimation protein FL3-5A3 (At2g15970), showing the same mRNA level
response patterns.
Electrophysiological studies of a second member of the AtOEP16 family, chloroplast
localized AtOEP16.2, showed that, in lipid bilayer, AtOEP16.2 form a channel transporting
amino acids. Structure analysis revealed that the AtOEP16.2 protein possesses a long
intermembrane space loop connecting the first and second transmembrane domains of the
pore. This loop is suggested to facilitate selective transport of amino acids through the
channel, preferentially acidic amino acids, glutamate and glutamine and aspartate and
asparagine, which make up to 64% of the total free amino acids found in leaf extracts in
Arabidopsis (Lam et al., 1995; Schultz, 1994).
The AtOEP16.2 is highly abundant in seeds and pollen. In seeds, the AtOEP16.2 channel
might transport amino acids or even small peptides necessary for seed storage proteins during
seed development as well as for mobilization during germination. The high expression of the
AtOEP16.2 channel at all stages of the pollen maturation could function as an amino acid
supplying source for the vegetative and/or generative pollen cells. The expression of
AtOEP16.2 during pollen tube germination indicates the transport activities of the AtOEP16.2
at this stage, when protein synthesis is very rapidly initiated. Interestingly, the AtOEP16.1
channel is highly expressed in the pistil of Arabidopsis flowers. Thus, these two amino acid
transporting channels play an important role in fertilization.
Transcription of the AtOEP16.2 gene is directed by a divergent promoter region. 410 bp
upstream of the ORF of the AtOEP16.2 gene is situated in “head to head” orientation an
adjacent ORF for a gene, which codes for a plastid targeted dihydrolipoamide dehydrogenase
(DLD) (Taylor et al., 1993; Lutziger and Oliver; 2000). This enzyme catalyzes the reduction
of the lipoamide group in the 2-oxoacid dehydrogenase and glycine decarboxylase
multienzyme complex, allowing the production of acetyl coenzyme A for use in fatty acids
biosynthesis. It is possible that AtOEP16.2 and DLD, simultaneously regulated by the same
divergent promoter, play an important role in nitrogen assimilation and amino acid re-
distribution within plant.
AtOEP16.3, in contrast to other AtOEP16s, is located in mitochondria and supposed to be a
highly expressed ubiquitous channel transporting amino acids in/out of mitochondria, which
accomplish the amino acids turnover, necessary for primary and secondary metabolism.
Several enzymes, involved in amino acid biosynthesis, have been identified in Arabidopsis
mitochondria, e.g. glutamate dehydrogenases At5g18170 (Melo-Oliveira et. al., 1996) and
At5g07440 (Turano et al., 1997), and an aspartate aminotransferase At2g30970 (Schultz and

83
Coruzzi, 1995). Additionally, glycine and serine are inter-converted within mitochondria by
glycine decarboxylase and serine hydroxymethyltransferase with production of large amounts
of photorespiratory CO2 (Bauwe and Kolukisaoglu, 2003).
AtOEP16.4 is low expressed ubiquitous protein, which is suggested to have a house-keeping
function.
4.2 OEP37 proteins in pea and Arabidopsis
PsOEP37 and AtOEP37 channel proteins forms a selective β-barrel pore in outer envelope of
chloroplasts. Immunoblot analysis showed expression of PsOEP37 in all tested pea organs,
namely roots, rosette and cauline leaves, flowers, siliques and seeds.
AtOEP37, an orthologous protein to PsOEP37, was isolated in Arabidopsis. The AtOEP37
and PsoEP37 proteins share 60% identity and 75% similarity over their entire sequence
length. The AtOEP37 gene is encoded by At2g43950 and represents a single copy gene in
Arabidopsis on chromosome 2. Immunoblot analysis showed that AtOEP37, similar to
PsOEP37, is located in chloroplasts. Expression pattern analysis using RT-PCR and
Affymetrix microarrays revealed that AtOEP37 transcripts are ubiquitous. Abundance of low
levels of AtOEP37 in almost all tissues suggests that AtOEP37 is a stable, house-keeping
protein throughout the various organs and developmental stages. Analysis of Arabidopsis
plants transformed with promoter-GUS translational fusions revealed that the AtOEP37 gene
promoter region is active in cotyledons; meristematic, vascular, cortical tissues, the transition
zone of roots and epidermis-derived hair roots in the 3- and 7-day-old seedlings. In 2 to 3-
Fig. 4.6 Overview of transcription levels of the AtOEP37 in Arabidopsis according to Affymetrix microarray results of AtGene Express Project. The transcript content is given in arbitrary units (n=2). See table for x-axis legends and link to the web
page of the data Affymetrix microarray results in Appendix.
Siliques with seeds
1200
1000
800
600
400
200
0mR
NA
sig
nal (
arbi
trary
uni
ts)
Siliques with seeds
1200
1000
800
600
400
200
0mR
NA
sig
nal (
arbi
trary
uni
ts)
84
week old juvenile plants, a weak level of staining was observed only in aerial portions: in
cotyledons, rosette leaf primordium in the subepidermal and cortical cells (shoot apex), and
expanded rosette leaves, flower stalks and petals. Additionally, a search in public Affymetrix
gene expression databases (AtGene Express Project) showed that expression of AtOEP37 was
detected in all developmental stages and tissues of the Arabidopsis plant with relatively low
levels and with high levels in developing seeds (Fig. 4.6).
4.3 VDAC proteins in pea and Arabidopsis
Voltage-dependent anion channels (VDAC), which are found in the outer membrane of
mitochondria from all organisms studied so far (Zalman et al., 1980; Colombini, 1980),
represent porins permeable for hydrophilic solutes. Each channel consists of a single
polypeptide of about 30 kDa that forms an aqueous pore of about 3 nm in diameter (Thomas
et al., 1991). VDAC proteins contain 46-50% hydrophilic amino acid residues and form the
pore with anti-parallel amphiphilic β-strands (Benz, 1994).
A full length VDAC cDNA was derived from leaves of 5-day-old light-grown pea seedlings.
Comparison of the deduced sequence with sequences in the database showed that it was
identical to a cDNA (Gen Bank Acc. No. Z25540) isolated from a library prepared from the
envelope of non-green plastids of pea root (Fischer et al. 1994). This protein had been shown
to immunoreact with antibodies against mitochondrial porins. It was proposed that the
VDAC-like porin is located in non-green plastids from roots only. However, isolation of the
same cDNA from green seedlings suggested localization of that protein in both, green and
non-green plastids. To test the localization of VDAC, a C-terminal fusion of VDAC to the
reporter protein GFP was constructed and, after bombardment, transiently expressed in pea
roots. Surprisingly, staining the pea roots, transfected by the VDAC-GFP fusion plasmid with
a marker for mitochondria, Mitotracker, showed that the fluorescent signals detected from
samples were co-localized, suggesting mitochondrial targeting of the VDAC protein.
Additional experiments with a marker for plastids, ps-ds-RED, revealed that VDAC is not
situated in plastids. In contrast to earlier results (Fischer et al., 1994) one could conclude that
this is a classical VDAC protein located to the mitochondria but not to the plastids.

85
5 References 1 Aronsson H, Jarvis P. A simple method for isolating import-competent Arabidopsis
chloroplasts. FEBS Lett 2002; 529(2-3):215-220.
2 Aseeva E, Ossenbuhl F, Eichacker LA, Wanner G, Soll J, Vothknecht UC. Complex Formation of Vipp1 Depends on Its {alpha}-Helical PspA-like Domain. J Biol Chem 2004; 279(34):35535-35541.
3 Bardel J, Louwagie M, Jaquinod M et al. A survey of the plant mitochondrial proteome in relation to development. Proteomics 2002; 2(7):880-898.
4 Bate N, Twell D. Functional architecture of a late pollen promoter: pollen-specific transcription is developmentally regulated by multiple stage-specific and co-dependent activator elements. Plant Molecular Biology 1998; 37(5):859-869.
5 Bauwe H, Kolukisaoglu U. Genetic manipulation of glycine decarboxylation. J Exp Bot 2003; 54(387):1523-1535.
6 Beator J, Kloppstech K. The Circadian Oscillator Coordinates the Synthesis of Apoproteins and Their Pigments during Chloroplast Development. Plant Physiol 1993; 103(1):191-196.
7 Bensmihen S, Rippa S, Lambert G et al. The homologous ABI5 and EEL transcription factors function antagonistically to fine-tune gene expression during late embryogenesis. Plant Cell 2002; 14(6):1391-1403.
8 Benz R. Porin from bacterial and mitochondrial outer membranes. CRC Crit Rev Biochem 1985; 19(2):145-190.
9 Benz R. Permeation of hydrophilic solutes through mitochondrial outer membranes: review on mitochondrial porins. Biochim Biophys Acta 1994; 1197(2):167-196.
10 Bhattacharjee H, Zhou T, Li J, Gatti DL, Walmsley AR, Rosen BP. Structure-function relationships in an anion-translocating ATPase. Biochem Soc Trans 2000; 28(4):520-526.
11 Bolter B, Soll J, Hill K, Hemmler R, Wagner R. A rectifying ATP-regulated solute channel in the chloroplastic outer envelope from pea. EMBO J 1999; 18(20):5505-5516.
12 Boyes DC, Zayed AM, Ascenzi R, McCaskill AJ, Hoffman NE, Davis KR, Gorlach J. Growth Stage-Based Phenotypic Analysis of Arabidopsis: A Model for High Throughput Functional Genomics in Plants. Plant Cell 2001; 13(7):1499-1510.
13 Bradford MM. A rapid and sensitive method for the quantitation of microgram quantities of protein utilizing the principle of protein-dye binding. Anal Biochem 1976; 72:248-254.
14 Chinnusamy V, Ohta M, Kanrar S et al. ICE1: a regulator of cold-induced transcriptome and freezing tolerance in Arabidopsis. Genes Dev 2003; 17(8):1043-1054.
86
15 Clausen C, Ilkavets I, Thomson R et al. Intracellular localization of VDAC proteins in plants. Planta 2004; 220(1):30-37.
16 Clough SJ, Bent AF. Floral dip: a simplified method forAgrobacterium-mediated transformation ofArabidopsis thaliana. The Plant Journal 1998; 16(6):735-743.
17 Colombini M. A candidate for the permeability pathway of the outer mitochondrial membrane. Nature 1979; 279(5714):643-645.
18 Colombini M. Structure and mode of action of a voltage dependent anion-selective channel (VDAC) located in the outer mitochondrial membrane. Ann N Y Acad Sci 1980; 341:552-563.
19 Conlan S, Zhang Y, Cheley S, Bayley H. Biochemical and biophysical characterization of OmpG: A monomeric porin. Biochemistry 2000; 39(39):11845-11854.
20 Davenport R. Glutamate Receptors in Plants. Ann Bot 2002; 90(5):549-557.
21 Day DA, Wiskich JT. Regulation of alternative oxidase activity in higher plants. J Bioenerg Biomembr 1995; 27(4):379-385.
22 De P, V, Prezioso G, Thinnes F, Link TA, Palmieri F. Peptide-specific antibodies and proteases as probes of the transmembrane topology of the bovine heart mitochondrial porin. Biochemistry 1991; 30(42):10191-10200.
23 Delcour AH. Solute uptake through general porins. Front Biosci 2003; 8:d1055-d1071.
24 Edwards K, Johnstone C, Thompson C. A simple and rapid method for the preparation of plant genomic DNA for PCR analysis. Nucleic Acids Res 1991; 19(6):1349.
25 Emanuelsson O, Nielsen H, von Heijne G. ChloroP, a neural network-based method for predicting chloroplast transit peptides and their cleavage sites. Protein Sci 1999; 8(5):978-984.
26 Emanuelsson O, Nielsen H, Brunak S, von Heijne G. Predicting subcellular localization of proteins based on their N-terminal amino acid sequence. J Mol Biol 2000; 300(4):1005-1016.
27 Ferro M, Salvi D, Brugiere S et al. Proteomics of the Chloroplast Envelope Membranes from Arabidopsis thaliana. Mol Cell Proteomics 2003; 2(5):325-345.
28 Fischer K, Weber A, Brink S et al. Porins from plants. Molecular cloning and functional characterization of two new members of the porin family. J Biol Chem 1994; 269(41):25754-25760.
29 Flugge UI. Metabolite transporters in plastids. Curr Opin Plant Biol 1998; 1(3):201-206.
30 Folsch H, Gaume B, Brunner M, Neupert W, Stuart RA. C- to N-terminal translocation of preproteins into mitochondria. EMBO J 1998; 17(22):6508-6515.
87
31 Forte M, Adelsberger-Mangan D, Colombini M. Purification and characterization of the voltage-dependent anion channel from the outer mitochondrial membrane of yeast. J Membr Biol 1987; 99(1):65-72.
32 Froehlich JE, Wilkerson CG, Ray WK et al. Proteomic study of the Arabidopsis thaliana chloroplastic envelope membrane utilizing alternatives to traditional two-dimensional electrophoresis. J Proteome Res 2003; 2(4):413-425.
33 Gier JW. Biogenesis of inner membrane proteins in Escherichia coli. Annu Rev Microbiol 2005; 59:329-355.
34 Gilmartin PM, Sarokin L, Memelink J, Chua NH. Molecular Light Switches for Plant Genes. Plant Cell 1990; 2(5):369-378.
35 Glombitza S, Dubuis Ph, Thulke O et al. Crosstalk and differential response to abiotic and biotic stressors reflected at the transcriptional level of effector genes from secondary metabolism. Plant Molecular Biology 2004; 54(6):817-835.
36 Grimm B, Kloppstech K. The early light-inducible proteins of barley. Characterization of two families of 2-h-specific nuclear-coded chloroplast proteins. Eur J Biochem 1987; 167(3):493-499.
37 Guy C. Molecular responses of plants to cold shock and cold acclimation. J Mol Microbiol Biotechnol 1999; 1(2):231-242.
38 Hancock RE, Siehnel R, Martin N. Outer membrane proteins of Pseudomonas. Mol Microbiol 1990; 4(7):1069-1075.
39 Heazlewood JL, Tonti-Filippini JS, Gout AM, Day DA, Whelan J, Millar AH. Experimental analysis of the Arabidopsis mitochondrial proteome highlights signalling and regulatory components, provides assessment of targeting prediction programs, and indicates plant-specific mitochondrial proteins. Plant Cell 2004; 16(1):241-256.
40 Hofmann K, Bucher P, Falquet L, Bairoch A. The PROSITE database, its status in 1999. Nucl Acids Res 1999; 27(1):215-219.
41 Hutin C, Nussaume L, Moise N, Moya I, Kloppstech K, Havaux M. Early light-induced proteins protect Arabidopsis from photooxidative stress. PNAS 2003; 100(8):4921-4926.
42 Isabel-LaMoneda I, Diaz I, Martinez M, Mena M, Carbonero P. SAD: a new DOF protein from barley that activates transcription of a cathepsin B-like thiol protease gene in the aleurone of germinating seeds. Plant J 2003; 33(2):329-340.
43 Jach G, Binot E, Frings S, Luxa K, Schell J. Use of red fluorescent protein from Discosoma sp. (dsRED) as a reporter for plant gene expression. Plant J 2001; 28(4):483-491.
44 Jang JY, Kim DG, Kim YO, Kim JS, Kang H. An expression analysis of a gene family encoding plasma membrane aquaporins in response to abiotic stresses in Arabidopsis thaliana. Plant Mol Biol 2004; 54(5):713-725.
45 Jeanteur D, Lakey JH, Pattus F. The bacterial porin superfamily: sequence alignment and structure prediction. Mol Microbiol 1991; 5(9):2153-2164.
88
46 Jiang X, Payne MA, Cao Z et al. Ligand-specific opening of a gated-porin channel in the outer membrane of living bacteria. Science 1997; 276(5316):1261-1264.
47 Karimi M, De Meyer B, Hilson P. Modular cloning in plant cells. Trends Plant Sci 2005; 10(3):103-105.
48 Koebnik R, Locher KP, Van Gelder P. Structure and function of bacterial outer membrane proteins: barrels in a nutshell. Molecular Microbiology 2000; 37(2):239-253.
49 Koop HU, Steinmuller K, Wagner H, Rossler C, Eibl C, Sacher L. Integration of foreign sequences into the tobacco plastome via polyethylene glycol-mediated protoplast transformation. Planta 1996; 199(2):193-201.
50 Kruft V, Eubel H, Jansch L, Werhahn W, Braun HP. Proteomic approach to identify novel mitochondrial proteins in Arabidopsis. Plant Physiol 2001; 127(4):1694-1710.
51 Kuhnen F, Barmettler K, Bhattacharjee S, Elimelech M, Kretzschmar R. Transport of Iron Oxide Colloids in Packed Quartz Sand Media: Monolayer and Multilayer Deposition. J Colloid Interface Sci 2000; 231(1):32-41.
52 Lam HM, Coschigano KT, Oliveira IC, Melo-Oliveira R, Coruzzi GM. The molecular genetics of nitrogen assimilation into amino acids in higher plants. Annu Rev Plant Physiol Plant Mol Biol 1996; 47:569-593.
53 Lam HM, Hsieh MH, Coruzzi G. Reciprocal regulation of distinct asparagine synthetase genes by light and metabolites in Arabidopsis thaliana. Plant J 1998; 16(3):345-353.
54 Lee YR, Assmann SM. Arabidopsis thaliana 'extra-large GTP-binding protein' (AtXLG1): a new class of G-protein. Plant Mol Biol 1999; 40(1):55-64.
55 Linke D, Frank J, Holzwarth JF, Soll J, Boettcher C, Fromme P. In vitro reconstitution and biophysical characterization of OEP16, an outer envelope pore protein of pea chloroplasts. Biochemistry 2000; 39(36):11050-11056.
56 Linke D, Frank J, Pope MS et al. Folding kinetics and structure of OEP16. Biophys J 2004; 86(3):1479-1487.
57 Liu J, Gilmour SJ, Thomashow MF, Van Nocker S. Cold signalling associated with vernalization in Arabidopsis thaliana does not involve CBF1 or abscisic acid. Physiol Plant 2002; 114(1):125-134.
58 Lopez-Molina L, Mongrand S, Kinoshita N, Chua NH. AFP is a novel negative regulator of ABA signalling that promotes ABI5 protein degradation. Genes Dev 2003; 17(3):410-418.
59 Ludwig O, Krause J, Hay R, Benz R. Purification and characterization of the pore forming protein of yeast mitochondrial outer membrane. Eur Biophys J 1988; 15(5):269-276.
60 Lutziger I, Oliver DJ. Molecular evidence of a unique lipoamide dehydrogenase in plastids: analysis of plastidic lipoamide dehydrogenase from Arabidopsis thaliana. FEBS Lett 2000; 484(1):12-16.

89
61 Macias MJ, Wiesner S, Sudol M. WW and SH3 domains, two different scaffolds to recognize proline-rich ligands. FEBS Lett 2002; 513(1):30-37.
62 Martinoia E, Klein M, Geisler M et al. Multifunctionality of plant ABC transporters--more than just detoxifiers. Planta 2002; 214(3):345-355.
63 Mascarenhas JP. Microspore and microgametophyte development in relation to biological activity of environmental pollutants. Environ Health Perspect 1981; 37:9-12.
64 Meier S, Neupert W, Herrmann JM. Conserved N-terminal Negative Charges in the Tim17 Subunit of the TIM23 Translocase Play a Critical Role in the Import of Preproteins into Mitochondria. J Biol Chem 2005; 280(9):7777-7785.
65 Melo-Oliveira R, Oliveira IC, Coruzzi GM. Arabidopsis mutant analysis and gene regulation define a nonredundant role for glutamate dehydrogenase in nitrogen assimilation. Proc Natl Acad Sci U S A 1996; 93(10):4718-4723.
66 Mena M, Cejudo FJ, Isabel-Lamoneda I, Carbonero P. A Role for the DOF Transcription Factor BPBF in the Regulation of Gibberellin-Responsive Genes in Barley Aleurone. Plant Physiol 2002; 130(1):111-119.
67 Milisav I, Moro F, Neupert W, Brunner M. Modular Structure of the TIM23 Preprotein Translocase of Mitochondria. J Biol Chem 2001; 276(28):25856-25861.
68 Millar AH, Heazlewood JL, Kristensen BK, Braun HP, Moller IM. The plant mitochondrial proteome. Trends Plant Sci 2005; 10(1):36-43.
69 Nakae T. Outer membrane of Salmonella. Isolation of protein complex that produces transmembrane channels. J Biol Chem 1976; 251(7):2176-2178.
70 Nazos PM, Antonucci TK, Landick R, Oxender DL. Cloning and characterization of livH, the structural gene encoding a component of the leucine transport system in Escherichia coli. J Bacteriol 1986; 166(2):565-573.
71 Nestorovich EM, Rostovtseva TK, Bezrukov SM. Residue Ionization and Ion Transport through OmpF Channels. Biophys J 2003; 85(6):3718-3729.
72 Nikaido H. Molecular Basis of Bacterial Outer Membrane Permeability Revisited. Microbiol Mol Biol Rev 2003; 67(4):593-656.
73 Oliveira IC, Brears T, Knight TJ, Clark A, Coruzzi GM. Overexpression of cytosolic glutamine synthetase. Relation to nitrogen, light, and photorespiration. Plant Physiol 2002; 129(3):1170-1180.
74 Osteryoung KW. Organelle fission in eukaryotes. Curr Opin Microbiol 2001; 4(6):639-646.
75 Philippsen A, Im W, Engel A, Schirmer T, Roux B, Muller DJ. Imaging the Electrostatic Potential of Transmembrane Channels: Atomic Probe Microscopy of OmpF Porin. Biophys J 2002; 82(3):1667-1676.
76 Pilgrim ML, McClung CR. Differential Involvement of the Circadian Clock in the Expression of Genes Required for Ribulose-1,5-Bisphosphate Carboxylase/Oxygenase

90
Synthesis, Assembly, and Activation in Arabidopsis thaliana. Plant Physiol 1993; 103(2):553-564.
77 Pohlmeyer K, Soll J, Steinkamp T, Hinnah S, Wagner R. Isolation and characterization of an amino acid-selective channel protein present in the chloroplastic outer envelope membrane. PNAS 1997; 94(17):9504-9509.
78 Pohlmeyer K, Soll J, Grimm R, Hill K, Wagner R. A High-Conductance Solute Channel in the Chloroplastic Outer Envelope from Pea. Plant Cell 1998; 10(7):1207-1216.
79 Reyes JC, Muro-Pastor MI, Florencio FJ. The GATA Family of Transcription Factors in Arabidopsis and Rice. Plant Physiol 2004; 134(4):1718-1732.
80 Robertson KM, Tieleman DP. Orientation and interactions of dipolar molecules during transport through OmpF porin. FEBS Lett 2002; 528(1-3):53-57.
81 Rogers HJ, Bate N, Combe J et al. Functional analysis of cis-regulatory elements within the promoter of the tobacco late pollen gene g10. Plant Molecular Biology 2001; 45(5):577-585.
82 Rohl T, Motzkus M, Soll J. The outer envelope protein OEP24 from pea chloroplasts can functionally replace the mitochondrial VDAC in yeast. FEBS Lett 1999; 460(3):491-494.
83 Rosso MG, Li Y, Strizhov N, Reiss B, Dekker K, Weisshaar B. An Arabidopsis thaliana T-DNA mutagenized population (GABI-Kat) for flanking sequence tag-based reverse genetics. Plant Mol Biol 2003; 53(1-2):247-259.
84 Sambrook JFEF&MT, Hrsg. Molecular Cloning - A Laboratory Manual, 2nd Edition. 1989. New York., Cold Spring Habour Laboratory Press. Ref Type: Generic
85 Schein SJ, Colombini M, Finkelstein A. Reconstitution in planar lipid bilayers of a voltage-dependent anion-selective channel obtained from paramecium mitochondria. J Membr Biol 1976; 30(2):99-120.
86 Schleiff E, Eichacker LA, Eckart K et al. Prediction of the plant {beta}-barrel proteome: A case study of the chloroplast outer envelope. Protein Sci 2003; 12(4):748-759.
87 Schmid A, Kromer S, Heldt HW, Benz R. Identification of two general diffusion channels in the outer membrane of pea mitochondria. Biochim Biophys Acta 1992; 1112(2):174-180.
88 Schultz CJ, Coruzzi GM. The aspartate aminotransferase gene family of Arabidopsis encodes isoenzymes localized to three distinct subcellular compartments. Plant J 1995; 7(1):61-75.
89 Seki M, Narusaka M, Abe H et al. Monitoring the expression pattern of 1300 Arabidopsis genes under drought and cold stresses by using a full-length cDNA microarray. Plant Cell 2001; 13(1):61-72.
90 Steinkamp T, Hill K, Hinnah SC et al. Identification of the Pore-forming Region of the Outer Chloroplast Envelope Protein OEP16. J Biol Chem 2000; 275(16):11758-11764.

91
91 Su Q, Frick G, Armstrong G, Apel K. POR C of Arabidopsis thaliana: a third light- and NADPH-dependent protochlorophyllide oxidoreductase that is differentially regulated by light. Plant Mol Biol 2001; 47(6):805-813.
92 Sukharev SI, Blount P, Martinac B, Kung C. Mechanosensitive channels of Escherichia coli: the MscL gene, protein, and activities. Annu Rev Physiol 1997; 59:633-657.
93 Sussman MR, Amasino RM, Young JC, Krysan PJ, Austin-Phillips S. The Arabidopsis Knockout Facility at the University of Wisconsin-Madison. Plant Physiol 2000; 124(4):1465-1467.
94 Taylor AE, Millar RE, Carmichael A, Cogdell RJ, Lindsay JG. Dihydrolipoamide dehydrogenase in plants: differences in the mitochondrial and chloroplastic forms. Biochem Soc Trans 1993; 21(1):38S.
95 Teige M, Scheikl E, Eulgem T et al. The MKK2 pathway mediates cold and salt stress signalling in Arabidopsis. Mol Cell 2004; 15(1):141-152.
96 Thomas L, Kocsis E, Colombini M, Erbe E, Trus BL, Steven AC. Surface topography and molecular stoichiometry of the mitochondrial channel, VDAC, in crystalline arrays. J Struct Biol 1991; 106(2):161-171.
97 Turano FJ, Thakkar SS, Fang T, Weisemann JM. Characterization and expression of NAD(H)-dependent glutamate dehydrogenase genes in Arabidopsis. Plant Physiol 1997; 113(4):1329-1341.
98 Tusher VG, Tibshirani R, Chu G. Significance analysis of microarrays applied to the ionizing radiation response. PNAS 2001; 98(9):5116-5121.
99 van Wijk KJ. Challenges and prospects of plant proteomics. Plant Physiol 2001; 126(2):501-508.
100 Watanabe Y, Inoko Y. Physicochemical characterization of the reassembled dimer of an integral membrane protein OmpF porin. Protein J 2005; 24(3):167-174.
101 Yamaguchi-Shinozaki K, Shinozaki K. A novel cis-acting element in an Arabidopsis gene is involved in responsiveness to drought, low-temperature, or high-salt stress. Plant Cell 1994; 6(2):251-264.
102 Zalman LS, Nikaido H, Kagawa Y. Mitochondrial outer membrane contains a protein producing nonspecific diffusion channels. J Biol Chem 1980; 255(5):1771-1774.

92
6 Appendix 6.1 The primers, used for PCR
Name of primer SEQUENCE (5‘-3‘) 1 At2gN GCCTTCAAGCACTTCTCCGGGACTGTTA 2 At2gC AAAGGAATCCACACCATATGAACCAAATT 3 OEP16W77/FN GCCGGCTATAGCTCCGAAGTATGCACCTTC
4 OEP16W77/FC GAAGGTGCATACTTCGGAGCTATAGCCGGC
5 OEP16W100/FN CATGGCATTCTTGAACTCCCTGGTGCCACG
6 OEP16W100/FC CGTGGCACCAGGGACTTCAAGAATGCCATG
7 oep16araSpeIf GGACTAGTATGCCTTCAAGCACATTC 8 oep16araSalIr ACGCGTCGACGTAGAAATAATGATTG 9 attB1adapter GGGGACAAGTTTGTACAAAAAAGCAGGCT 10 attB2 adapter GGGGACCACTTTGTACAAGAAAGCTGGGT 11 16seedGATf AAAAAGCAGGCTTAGAAGGAGATAGAACCATGGAGAAGAGTGGAGGAAG 12 16seedGAT-stopR AGAAAGCTGGGTCGAAAACGCTAGAAAGGAG 13 62880GATf AAAAAGCAGGCTTAGAAGGAGATAGAACCATGGAGGAAGAATTGCTCTCC 14 62880GAT-stopR AGAAAGCTGGGTCATTAGTGTTGTTTGGGTTTTCTCTCC 15 42210SpeIf GGACTAGTATGGATCCAGCTGAAATG 16 42210SalIr ACGCGTCGACGGGAATCAGCTTCAGCTC 17 VDACSpeIf GGACTAGTATGGTGAAGGGTCCTGG 18 VDACSalIr ACGCGTCGACAGGTTTGAGAGCC 19 42210HindIIIf CCCAAGCTTATGGATCCAGCTGAAATGAG 20 42210XhoIr CCGCTCGAGGGAATCAGCTTCAGCTCTTTTCTC 21 62880EcoRIF CCGGAATTCATGGAGGAAGAATTGCTCTC 22 62880XhoIR CCGCTCGAGATTAGTGTTGTTTGGGTTTTC 23 oep16araSalIr-2 ACGCGTCGACGGTAGAAATAATGATTG 24 o16araClaIa GGTAGCTAAATAGTGTCTTTGCCTTTCTTAC 25 16GUSgateF AAAAAGCAGGCTTAGAAGGAGATAGAACCCCGCAAACAATCGGGTGC 26 16GUSgateR AGAAAGCTGGGTCCTTTTCTTCTTCTTTCTTCC 27 SeedGUSgateF AAAAAGCAGGCTTAGAAGGAGATAGAACCCTTCTCGACGGCGTGCAATG 28 SeedGUSgateR AGAAAGCTGGGTCTTTTTTCTTTCTTTCTTCACTTGTTGC 29 62GUSgateF AAAAAGCAGGCTTAGAAGGAGATAGAACCTTAAGAAAAGAGTTGGAAAAG 30 62GUSgateR AGAAAGCTGGGTCCTCTGCAAAATTGAATTAGGAC 31 37GUSgateF AAAAAGCAGGCTTAGAAGGAGATAGAACCTAGTGGACAAGATTAAGAC 32 37GUSgateR AGAAAGCTGGGTCTGGAATTGGATTTGAGAGAATC 33 oep16SNBamH1-1 GAAAGAAAGGGATCCATGGAGAAG 34 oep16sPst1-2 AACTGCAGTTAGTAGACCTTTAGCGAATT 35 28900Fbeg CACTCTCCATACTCTGGTTTG 36 JL202 CATTTTATAACGCTGCGGACATCTAC 37 o16araEcoRIF CCGGAATTCATGCCTTCAAGCACATTCTC 38 o16araXhoIr CCGCTCGAGGCCTTTCTTACCAACCGCTGAG 39 62880SF ATAGGTTTAAGCGGCGTTTCTCAGGC 40 62880SR ATATCGTTGAAGCCCACAATGTGTC 41 62880R TTAATTAGTGTTGTTTGGGTTTTC 42 18SF TTGTGTTGGCTTCGGGATCGGAGTAAT 43 18SR TGCACCACCACCCATAGAATCAAGAA 44 LBb1pROK2 GCGTGGACCGCTTGCTGCAACT 45 28900lcf ATCGGAGCTGTTGGAGTCA 46 28900lcr CCTTTCTTACCAACCGCTGA 47 actin2lcf TGGTCGTACAACCGGTATTGT 48 actin2lcr TTCTCGATGGAAGAGCTGGT 49 At4gN GTAATGGATGAGATAAGAAGCTTTGAGAA 50 At4gC CTAGAAAGGAGATTAGCAGCGGTGGAAAT 51 LB3 TAGCATCTGAATTTCATAACCAATCTCGATACAC 52 16160lcf GGAGCTTTACAAGCCGTGTC 53 16160lcr CTGTTCCGCCAATCATGA 54 35Spromoter TTGGAGAGAACACGGGGGACT 55 At3gN TGCTCTTCCCTAACCGTCGAGTCAGTTCT 56 At3gC CTGTCCTGGTGCAATTAGCCAAAACACTA 57 LBb1ROK2 GCGTGGACCGCTTGCTGCAAC 58 62880lcf TTTCAATGCGGTCTTGTAAGTG 59 62880lcr TGGTGCAATTAGCCAAAACA 60 37peaNdeIf GGAATTCCATATGGATTCTGCTACGCGAAAC 61 37peaBamHIr CGCGGATCCTTAAATGTCCCATCTCTTCTTAAC

93
Name of primer SEQUENCE (5‘-3‘) 62 o37araXhoIs CCGCTCGAGATGGCGGATCCATCTTCTCA 63 o37aXhoIr CCGCTCGAGAATGTCCCATCTTTTCTTG 64 o37araXbaIs GCTCTAGAATGGCGGATCCATCTTCTCA 65 O37araNcoIr CATGCCATGGTCAAATGTCCCATCTTTTC 66 18SF TTGTGTTGGCTTCGGGATCGGAGTAAT 67 18SR TGCACCACCACCCATAGAATCAAGAA 68 O37araSF TTACCCAAGAGCAACTCTTAAATTCCCAC 69 037araSR GACGTTTGAGGATCCCATTAACAGATTC 70 Actin2/7F GTCGTACAACCGGTATTGTGCT 71 Actin2/7R GCTCGTAGTCAAGAGCGACAT 72 pGABI1 CCCATTTGGAGGTGAATGTAGACAC 73 pGABI2 ATATTGACCATCATACTCATTGC 74 At3g01280 LCfw CTCTGTGAAGGCTCGT 75 At3g01280 LCrev CTACAAATCCGGCAGG 76 At5g15090 LCfw TGTCGGAACTCAACACG 77 At5g15090 LCrev TACAAATCCCAACACCG 78 At5g57490 LCfw GGATGGTGGTCCAGAG 79 At5g57490 LCrev AAGTGATTCAATAACCCTACAAA 80 At5g67500 LCfw CTCGACAAATGAAAACACG 81 At5g67500 LCrev GCGGAACTATTTATTGATTCCA
6.2 Legend for x-axis of Fig.4.1 and Fig. 4.10
Tissue 1. cotyledons 2. hypocotyl 3. roots 4. shoot apex, vegetative + young leaves 5. leaves 6. shoot apex, vegetative 7. seedling, green parts 8. shoot apex, transition (before bolting) 9. roots 10. rosette leaf #4, 1cm long 11. rosette leaf #4, 1cm long 12. rosette leaf # 2 13. rosette leaf # 4 14. rosette leaf # 6 15. rosette leaf # 8 16. rosette leaf # 10 17. rosette leaf # 12 18. rosette leaf # 12 19. leaf 7, petiol 20. leaf 7, proximal half 21. leaf 7, distal half 22. developmental drift; whole plant after
transition, but before bolting 23. developmental drift; whole plant after
transition, but before bolting 24. developmental drift; whole plant after
transition, but before bolting
25. senescing leaves 26. cauline leaves 27. stem, 2nd internode 28. stem, 1st node 29. shoot apex, inflorescence (after bolting) 30. flowers stage 9 31. flowers stage 10/11 32. flowers stage 12 33. flowers stage 12, sepals 34. flowers stage 12, petals 35. flowers stage 12, stamens 36. flowers stage 12, carpels 37. flowers stage 15 38. flowers stage 15, pedicels 39. flowers stage 15, sepals 40. flowers stage 15, petals 41. flowers stage 15, stamen 42. flowers stage 15, carpels 43. mature pollen 44. siliques, w/ seeds stage 3 45. siliques, w/ seeds stage 4 46. siliques, w/ seeds stage 5 47. siliques, w/o seeds stage 6 48. siliques, w/o seeds stage 7 49. siliques, w/o seeds stage 8 50. siliques, w/o seeds stage 9 51. siliques, w/o seeds stage 10
6.3 Constructs Restr., restriction enzymes. Primers, primers for PCR (5’-3’). E.c. expression clone Insert Vector Template Restr Primers Comments
1 PsOEP16 pET21b (Pohlmeyer et al, 1997)
2 PsOEP16 pET21b PsOEP16/pET21b NdeI (5’) XhoI (3’)
OEP16W77/FN OEP16W77/FC W77F
3 PsOEP16 pET21b PsOEP16/pET21b NdeI (5’) OEP16W100/FN W100F

94
Insert Vector Template Restr Primers Comments XhoI (3’) OEP16W100/FC
4 AtOEP16.1 pCRII cDNA EcoRI (5’) SalI (3’)
o16araEcoRIf oep16araSalIr
5 AtOEP16.2 pET21d AtOEP16.2/pBs EcoRI (5’) XhoI (3’) seedEcoRIfseedXhoIr
6 AtOEP16.3 pET21b cDNA HindIII (5’) XhoI (3’)
42210HindIIIf 42210XhoIr
7 AtOEP16.4 pET21b cDNA EcoRI (5’) XhoI (3’)
62880EcoRIF 62880XhoIR
8 AtOEP16.1 pOL-GFP AtOEP16.1/pCRII Spe I (5‘) Sal I (3‘)
oep16araSpeIf oep16araSalIr-2
C-terminal GFP fusin
9 AtOEP16.1 pOL-RFP AtOEP16.1/pCRII Spe I (5‘) Sal I (3‘)
oep16araSpeIf oep16araSalIr-2
C-terminal RFP fusion
10 AtOEP16.2 pDONR202 AtOEP16.2/pET21d
1. 16seedGATf 16seedGAT-stopR
2. attB1adapter attB2adapter
Adapter PCR
Entry clone
11 AtOEP16.2 pK7FWG2 AtOEP16.2/pDONR202 E.c. GFP fusion
12 AtOEP16.3 pOL-GFP cDNA Spe I (5‘) Sal I (3‘)
422210SpeIf 42210SalIr
C-terminal GFP fusion
13 AtOEP16.4 pDONR202 AtOEP16.4/pET21b
1. 62880GATf 62880GAT-STOP 2. attB1adapter attB2adapter
Adapter PCR.
Entry clone
14 AtOEP16.4 pK7FWG2 AtOEP16.4/pDONR202 E.c. GFP fusion
15 VDAC pGFP2 Clausen et al, 2004
16 VDAC pOL-RFP VDAC/pGFP2 Sal I (5‘) Spe I (3‘)
17 pSSU dsRED Clausen et al, 2004
18 AtOEP16.1 pET21b cDNA EcoRI (5’) XhoI (3’)
O16araEcoRIf O16araXhoIr
131 amino acids, for antibodies
19 AtOEP16.1 promoter pDONR202 gDNA
1. 16GUSgateF 16GUSgateR
2. attB1adapter attB2adapter
Adapter PCR.
Entry clone
20 AtOEP16.1 (promoter) pKGWFS7 AtOEP16.1 promoter/
pDONR202 E.c. GUS fusion
21 AtOEP16.2 promoter pDONR202 gDNA
1. 16seedGUSgateF 16seedGUSgateR
2. attB1adapter attB2adapter
Adapter PCR.
Entry clone
22 AtOEP16.2 (promoter) pKGWFS7 AtOEP16.2 promoter/
pDONR202 E.c. GUS fusion
23 AtOEP16.4 promoter pDONR202 gDNA
1. 62GUSgateF 62GUSgateR
2. attB1adapter attB2adapter
Adapter PCR.
Entry clone
24 AtOEP16.4 (promoter) pKGWFS7 AtOEP16.4 promoter/
pDONR202 E.c. GUS fusion
25 AtOEP37 promoter pDONR202 gDNA
1. 37GUSgateF 37GUSgateR
2. attB1adapter attB2adapter
Adapter PCR.
Entry clone
26 AtOEP37 (promoter) pKGWFS7 AtOEP37 promoter/
pDONR202 E.c. GUS fusion
27 PsOEP37 pET14b PsOEP37/pBS (Schleiff et al., 222003)
NdeI BamHI
37peaNdeIf 37peaBamHIr
28 AtOEP37 pRSETA cDNA XhoI NcoI
O37araXhoIs O37araNcoIr
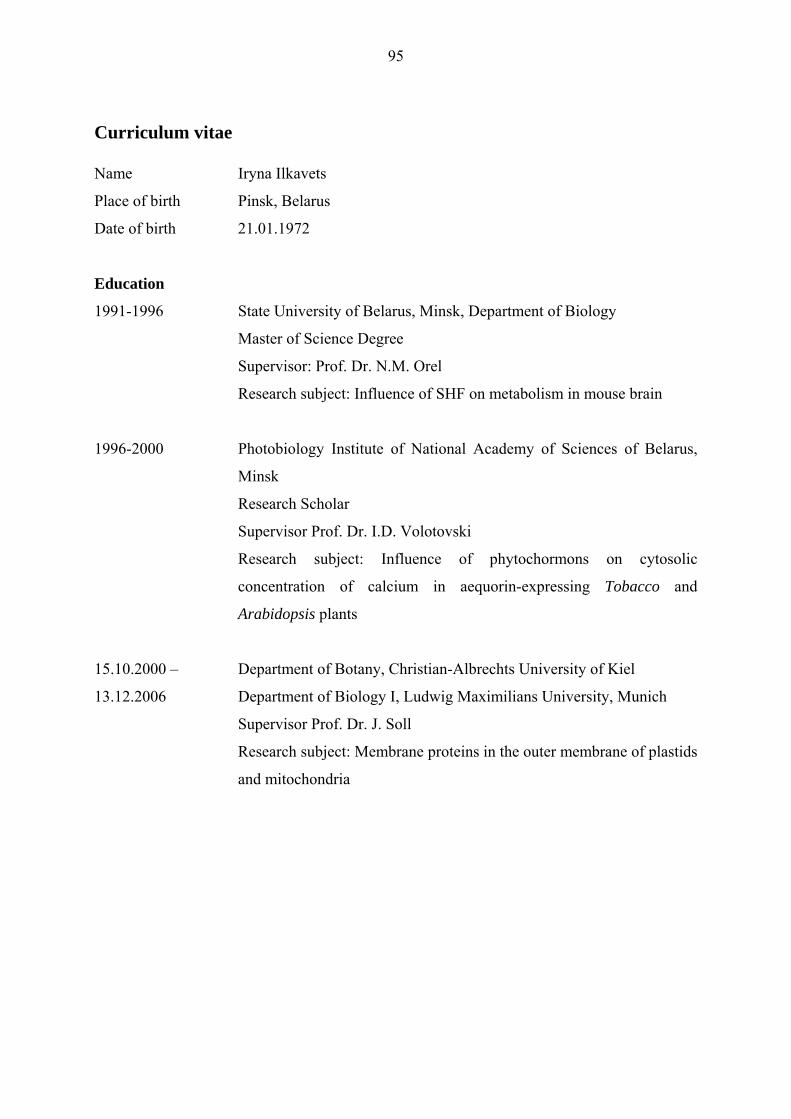
95
Curriculum vitae
Name Iryna Ilkavets
Place of birth Pinsk, Belarus
Date of birth 21.01.1972
Education
1991-1996 State University of Belarus, Minsk, Department of Biology
Master of Science Degree
Supervisor: Prof. Dr. N.M. Orel
Research subject: Influence of SHF on metabolism in mouse brain
1996-2000 Photobiology Institute of National Academy of Sciences of Belarus,
Minsk
Research Scholar
Supervisor Prof. Dr. I.D. Volotovski
Research subject: Influence of phytochormons on cytosolic
concentration of calcium in aequorin-expressing Tobacco and
Arabidopsis plants
15.10.2000 – Department of Botany, Christian-Albrechts University of Kiel
13.12.2006 Department of Biology I, Ludwig Maximilians University, Munich
Supervisor Prof. Dr. J. Soll
Research subject: Membrane proteins in the outer membrane of plastids
and mitochondria

96
Publications
♦ Götze T, Philippar K, Ilkavets I, J Soll, R. Wagner. OEP37 is a new member of the
chloroplast outer membrane ion channels. Accepted in JBC.
♦ Clausen CA, Ilkavets IA, Thomson R, Philippar K, Vojta A, Mohlmann T, Neuhaus E,
Fulgosi H, Soll J. Intracellular localization of VDAC proteins in plants. Planta. 2004,
220:30-37.
-A authors contributed equally
♦ Linke D, Frank J, Pope MS, Soll J, Ilkavets I, Fromme P, Burstein EA, Reshetnyak
YK, Emelyanenko. Folding kinetics and structure of OEP16. Biophys J. 2004;
86(3):1479-87.
Selected talks and posters on meetings
♦ Ilkavets I. and J. Soll. Solute channels in chloroplasts. DFG SP-1108, Hirschberg,
2003.
♦ Ilkavets I., Thomson R. and J. Soll. Outer membrane porins – evolution from bacteria
to mitochondria and chloroplasts. Origin and Evolution of Mitochondria and
Chloroplasts, FEBS Advanced Lecture Course, Hvar, Croatia, 2003.
♦ Philippar K., Ilkavets I., Thomson R., Oster U. and J. Soll. Towards the function of
membrane proteins in the outer envelope of Arabidopsis chloroplasts. 13th International
Workshop on Plant Membrane Biology. Montpeller, 2004.
♦ Thomson R., Ilkavets I., Soll J.. Die äußere Plastidenhüllmembran ist keine Sieb. 17.
Tagung Molekularbiologie der Pflanzen, Dabringhausen, 2004.

97
Acknowledgements
I am particularly grateful to Prof. Dr. Jürgen Soll for giving me the opportunity to join his
research group, for his supervision, guidance, helpful and stimulating discussions, for critical
reading of the dissertation.
I am very grateful to Katrin for encouragement, guidance, valuable suggestions in the end of
this work and for patience and critical reading of the dissertation.
I am thankful to Dr. Anton Schäffner, who introduced me to macroarray analysis and to Dr.
Engstler for introduction in fluorescent microscopy. I am thankful to Rowena for her guidance
and for the carrying out Affymetrix gene chip analysis.
I am thankful to Bettina, who introduced me to the project; to Ute and Enriko for helpful
discussions.
I am grateful to Ulrike for the constant help, discussions and moral support. I am thankful to
Karl and Ulrika for technical assistance and discussions. I am thankful to Gisela for growing
and watering of Arabidopsis plants. I am thankful to Lars and Andi for help with computer. I
am thankful to Lena for “russian” talks and to Fatima, Rita, Sonmia, Marko, Friderike,
Ahmed, Ranja, Torsten, Claudia, Eva, Lea, Alexander, Sunchana, Mislav, Tina, Dani, Manu,
Serena for nice conversations and moral support.
98
Ehrenwörtliche Versicherung Die vorliegende Dissertation wurde von Dipl. Biol. Iryna Ilkavets selbständig und ohne
unerlaubte Hilfe angefertigt. Der Verfasser hat zuvor nicht versucht, anderweitig eine
Dissertation einzureichen oder sich einer Doktorprüfung zu unterziehen. Die Dissertation
wurde keiner weiteren Prüfungskommision weder in Teilen noch als Ganzes vorgelegt.
19.12.2005
München