medical decision analysis with probabilistic graphical models · cost-effectiveness analysis markov...
TRANSCRIPT
1
Medical decision analysis
with probabilistic graphical models
Francisco Javier Díez
Dept. Artificial Intelligence. UNED
Madrid, Spain
www.ia.uned.es/~fjdiez
www.cisiad.uned.es
Institute for Technology Assessment
Boston, October 14, 2015
OVERVIEW
The naïve-Bayes method
Bayesian networks
Influence diagrams
Decision analysis networks
Cost-effectiveness analysis
Markov models
Conclusion
2
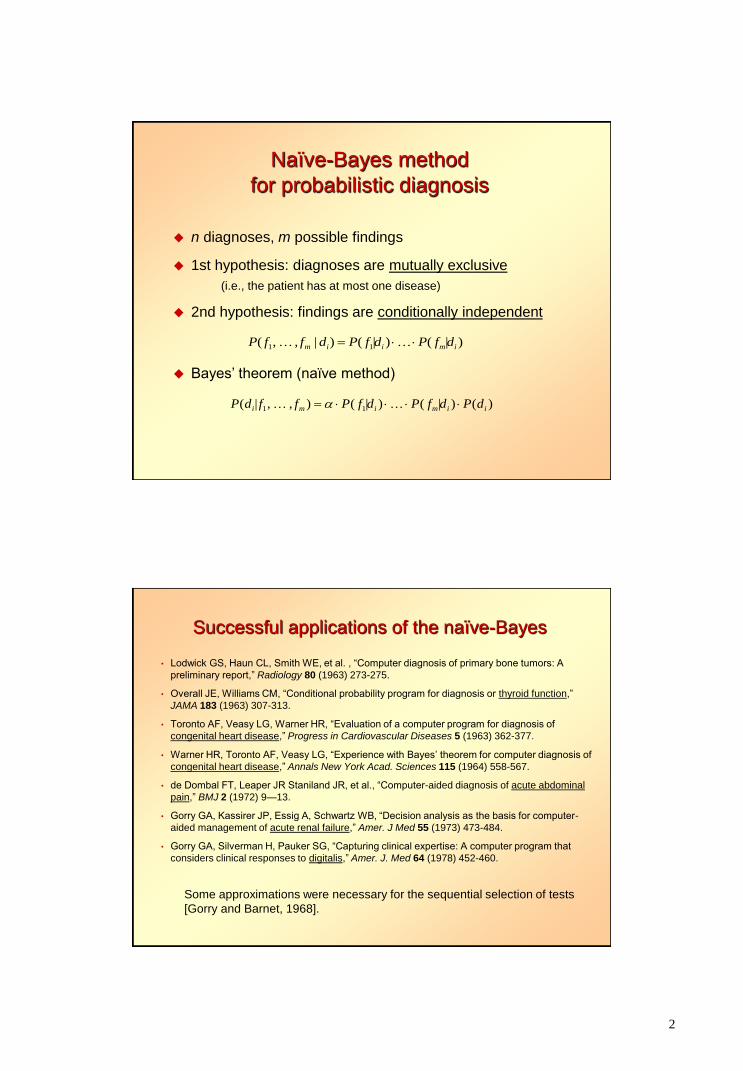
Naïve-Bayes method
for probabilistic diagnosis
n diagnoses, m possible findings
1st hypothesis: diagnoses are mutually exclusive
(i.e., the patient has at most one disease)
2nd hypothesis: findings are conditionally independent
)|()|()|,,( 11 imiim dfPdfPdffP
)()|()|(),,|( 11 iimimi dPdfPdfPffdP
Bayes’ theorem (naïve method)
Successful applications of the naïve-Bayes
• Lodwick GS, Haun CL, Smith WE, et al. , “Computer diagnosis of primary bone tumors: A
preliminary report,” Radiology 80 (1963) 273-275.
• Overall JE, Williams CM, “Conditional probability program for diagnosis or thyroid function,”
JAMA 183 (1963) 307-313.
• Toronto AF, Veasy LG, Warner HR, “Evaluation of a computer program for diagnosis of
congenital heart disease,” Progress in Cardiovascular Diseases 5 (1963) 362-377.
• Warner HR, Toronto AF, Veasy LG, “Experience with Bayes’ theorem for computer diagnosis of
congenital heart disease,” Annals New York Acad. Sciences 115 (1964) 558-567.
• de Dombal FT, Leaper JR Staniland JR, et al., “Computer-aided diagnosis of acute abdominal
pain,” BMJ 2 (1972) 9—13.
• Gorry GA, Kassirer JP, Essig A, Schwartz WB, “Decision analysis as the basis for computer-
aided management of acute renal failure,” Amer. J Med 55 (1973) 473-484.
• Gorry GA, Silverman H, Pauker SG, “Capturing clinical expertise: A computer program that
considers clinical responses to digitalis,” Amer. J. Med 64 (1978) 452-460.
Some approximations were necessary for the sequential selection of tests
[Gorry and Barnet, 1968].
3
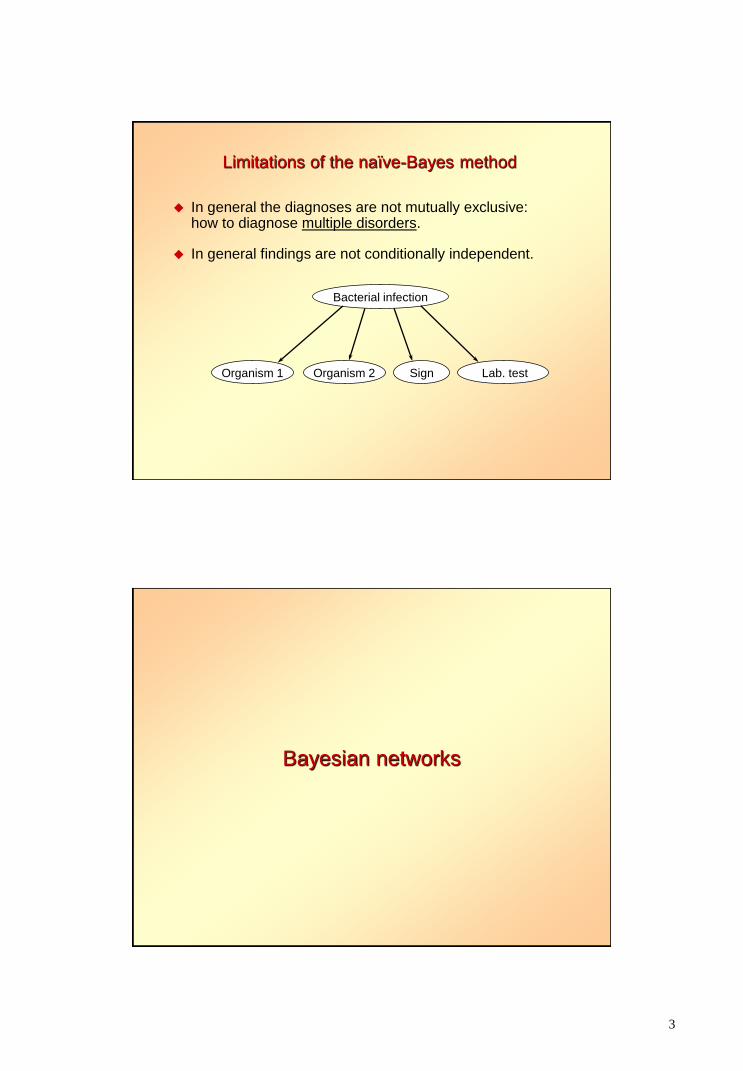
Limitations of the naïve-Bayes method
In general the diagnoses are not mutually exclusive: how to diagnose multiple disorders.
In general findings are not conditionally independent.
Bacterial infection
Sign Organism 2 Lab. test Organism 1
Bayesian networks
4
Advantages of BNs w.r.t. naïve-Bayes
BNs can diagnose several diseases simultaneously
BNs do not assume conditional independence
BNs are usually causal models
closer to doctors’ reasoning: explanation of reasoning
probabilities are in general easier to obtain
Three types of reasoning:
abductive
deductive
inter-causal
Canonical models simplify the construction of the model.
Examples of BNs
Medical Bayesian networks we have built
DIAVAL: echocardiography (valvulopathies)
F. J. Díez’ thesis, 1994
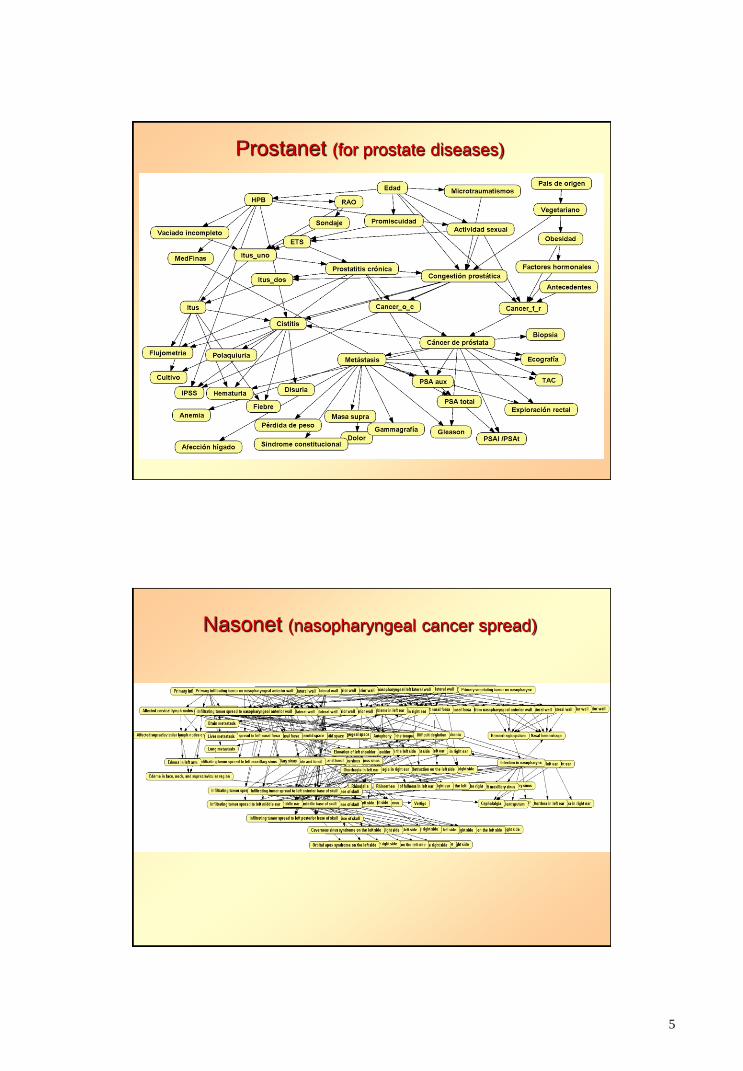
Prostanet: urology (prostate cancer)
Carmen Lacave’s thesis, 2003
Nasonet: nasopharyngeal cancer spread
Severino Galán’s thesis, 2003
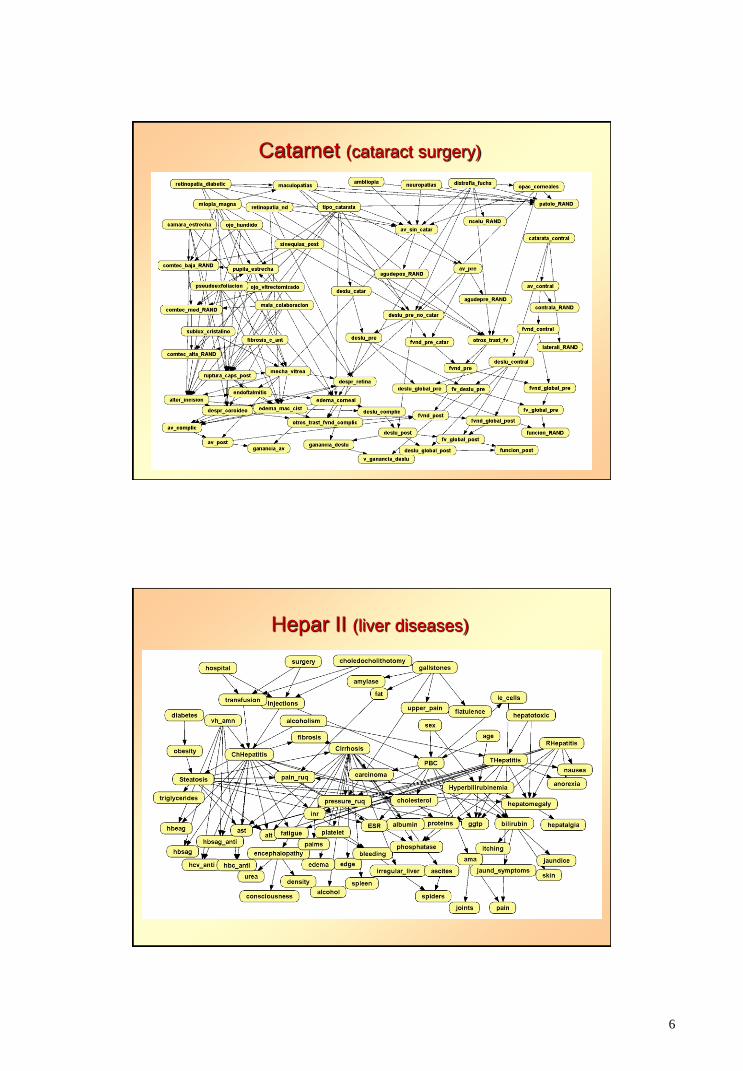
HEPAR II: liver diseases
Agnieszka Onisko’s thesis, 2003
Catarnet: Cataract surgery
Nuria Alonso’s thesis, 2009
5
Prostanet (for prostate diseases)
Nasonet (nasopharyngeal cancer spread)
6
Catarnet (cataract surgery)
Hepar II (liver diseases)
7
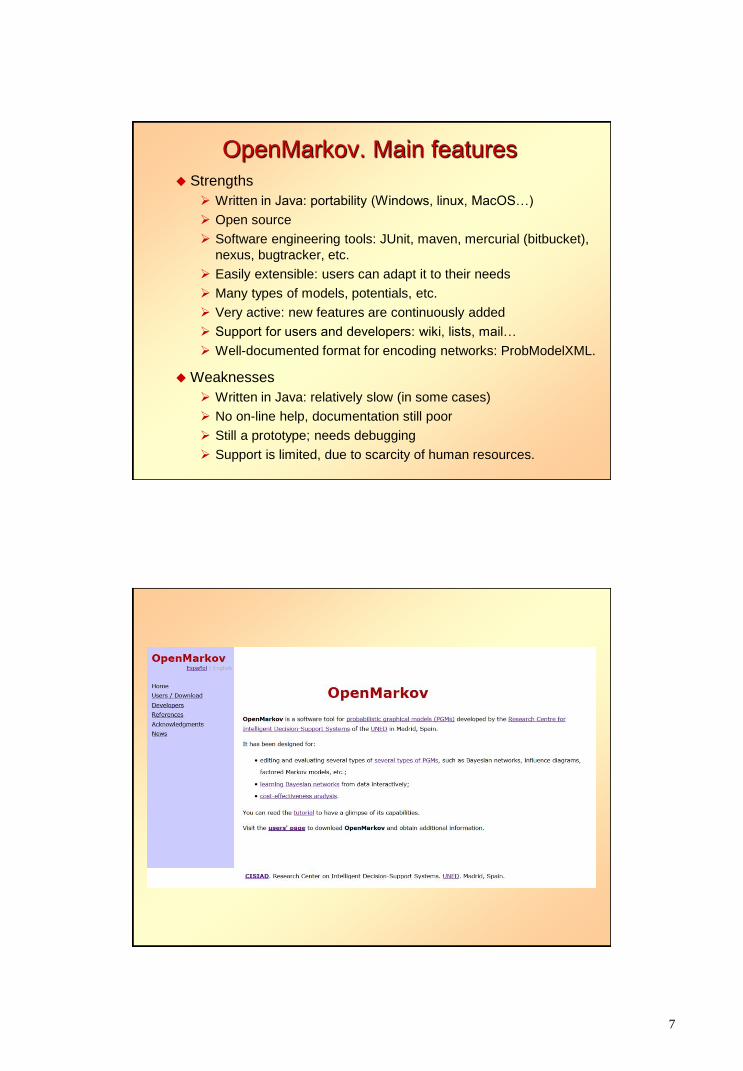
OpenMarkov. Main features
Strengths
Written in Java: portability (Windows, linux, MacOS…)
Open source
Software engineering tools: JUnit, maven, mercurial (bitbucket),
nexus, bugtracker, etc.
Easily extensible: users can adapt it to their needs
Many types of models, potentials, etc.
Very active: new features are continuously added
Support for users and developers: wiki, lists, mail…
Well-documented format for encoding networks: ProbModelXML.
Weaknesses
Written in Java: relatively slow (in some cases)
No on-line help, documentation still poor
Still a prototype; needs debugging
Support is limited, due to scarcity of human resources.
8
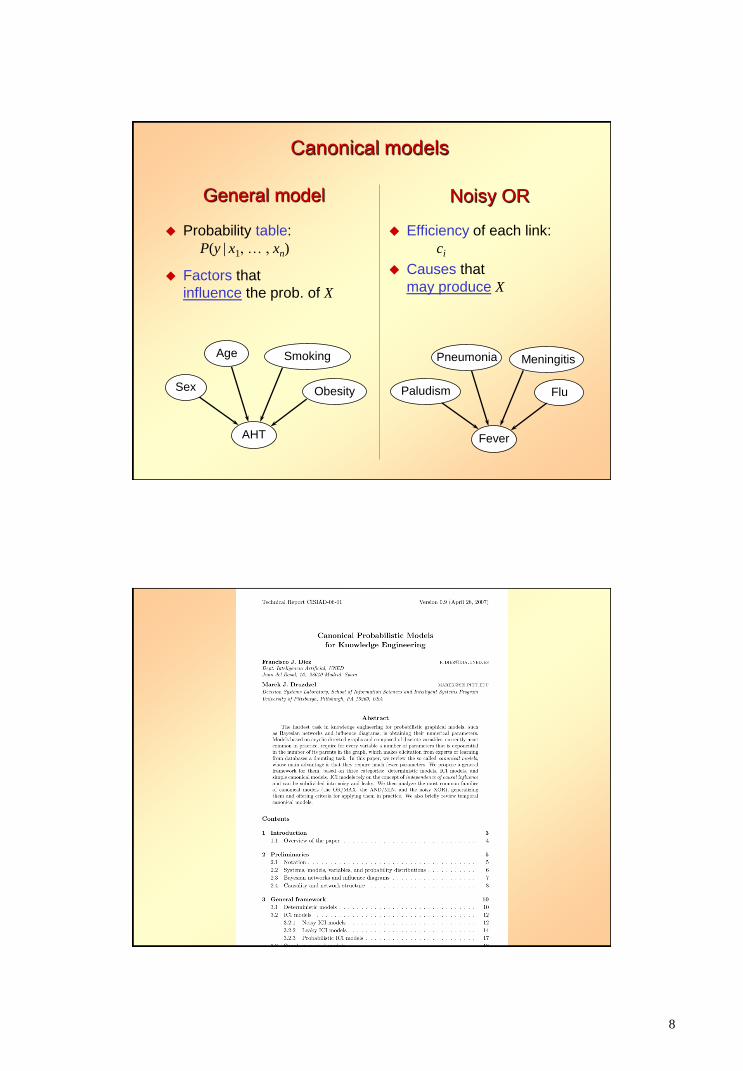
General model
Probability table:
P(y | x1, … , xn)
Factors that
influence the prob. of X
Obesity
Age
Sex
AHT
Smoking Meningitis Pneumonia
Paludism
Fever
Flu
Efficiency of each link:
ci
Causes that
may produce X
Noisy OR
Canonical models
9
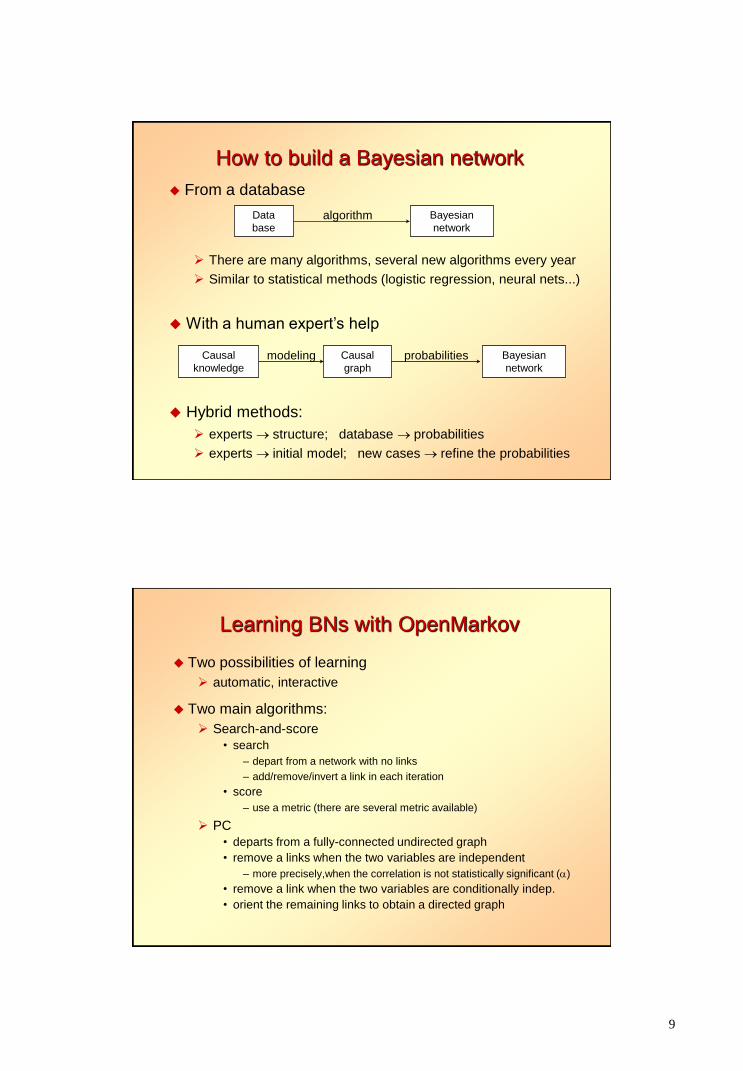
How to build a Bayesian network
From a database
Data
base algorithm Bayesian
network
There are many algorithms, several new algorithms every year
Similar to statistical methods (logistic regression, neural nets...)
With a human expert’s help
Causal
knowledge modeling Causal
graph probabilities Bayesian
network
Hybrid methods:
experts structure; database probabilities
experts initial model; new cases refine the probabilities
Learning BNs with OpenMarkov
Two possibilities of learning
automatic, interactive
Two main algorithms:
Search-and-score
• search
– depart from a network with no links
– add/remove/invert a link in each iteration
• score
– use a metric (there are several metric available)
PC
• departs from a fully-connected undirected graph
• remove a links when the two variables are independent
– more precisely,when the correlation is not statistically significant ()
• remove a link when the two variables are conditionally indep.
• orient the remaining links to obtain a directed graph
10
Advantages of interactive learning
The system proposes, the user decides
Very useful for tuition
Useful for combining data with expert knowledge
Useful for debugging new algorithms (workbench)
See www.openmarkov.org/docs/tutorial.
Influence diagrams
11
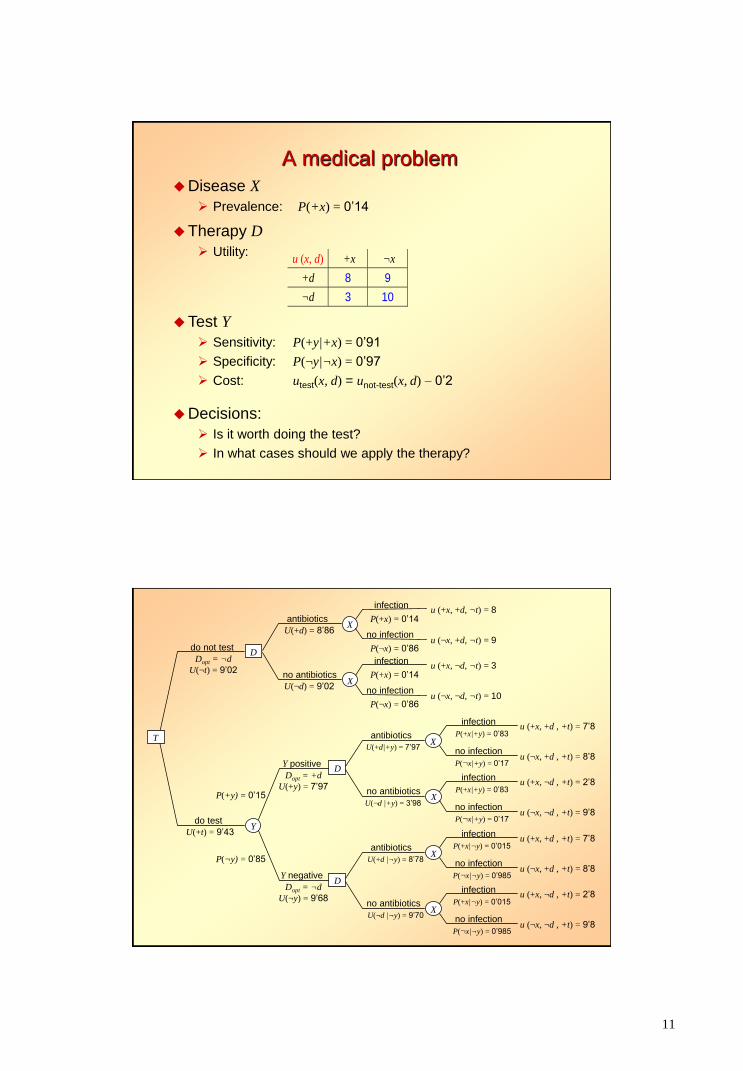
A medical problem
Disease X
Prevalence: P(+x) = 0’14
Therapy D
Utility: u (x, d) +x ¬x
+d 8 9
¬d 3 10
Test Y
Sensitivity: P(+y|+x) = 0’91
Specificity: P(¬y|¬x) = 0’97
Cost: utest(x, d) = unot-test(x, d) – 0’2
Decisions:
Is it worth doing the test?
In what cases should we apply the therapy?
D
u (+x, +d , +t) = 7’8
u (¬x, +d , +t) = 8’8
X
D
u (+x, +d , +t) = 7’8
u (¬x, +d , +t) = 8’8
X
u (+x, ¬d , +t) = 2’8
u (¬x, ¬d , +t) = 9’8
X
antibiotics
U(+d|+y) = 7’97
no antibiotics
U(¬d |+y) = 3’98
antibiotics
U(+d |¬y) = 8’78
no antibiotics
U(¬d |¬y) = 9’70
u (+x, ¬d , +t) = 2’8
u (¬x, ¬d , +t) = 9’8
X
infection
P(+x|+y) = 0’83
no infection
P(¬x|+y) = 0’17
infection
P(+x|+y) = 0’83
no infection
P(¬x|+y) = 0’17
infection
P(+x|¬y) = 0’015
no infection
P(¬x|¬y) = 0’985
infection
P(+x|¬y) = 0’015
no infection
P(¬x|¬y) = 0’985
Y
Y positive
Dopt = +d
U(+y) = 7’97
Y negative
Dopt = ¬d
U(¬y) = 9’68
D
u (+x, +d, ¬t) = 8
u (¬x, +d, ¬t) = 9
X
u (+x, ¬d, ¬t) = 3
u (¬x, ¬d, ¬t) = 10
X
antibiotics
U(+d) = 8’86
no antibiotics
U(¬d) = 9’02
infection
P(+x) = 0’14
no infection
P(¬x) = 0’86
infection
P(+x) = 0’14
no infection
P(¬x) = 0’86
T
do not test
Dopt = ¬d
U(¬t) = 9’02
do test
U(+t) = 9’43
P(+y) = 0’15
P(¬y) = 0’85
12
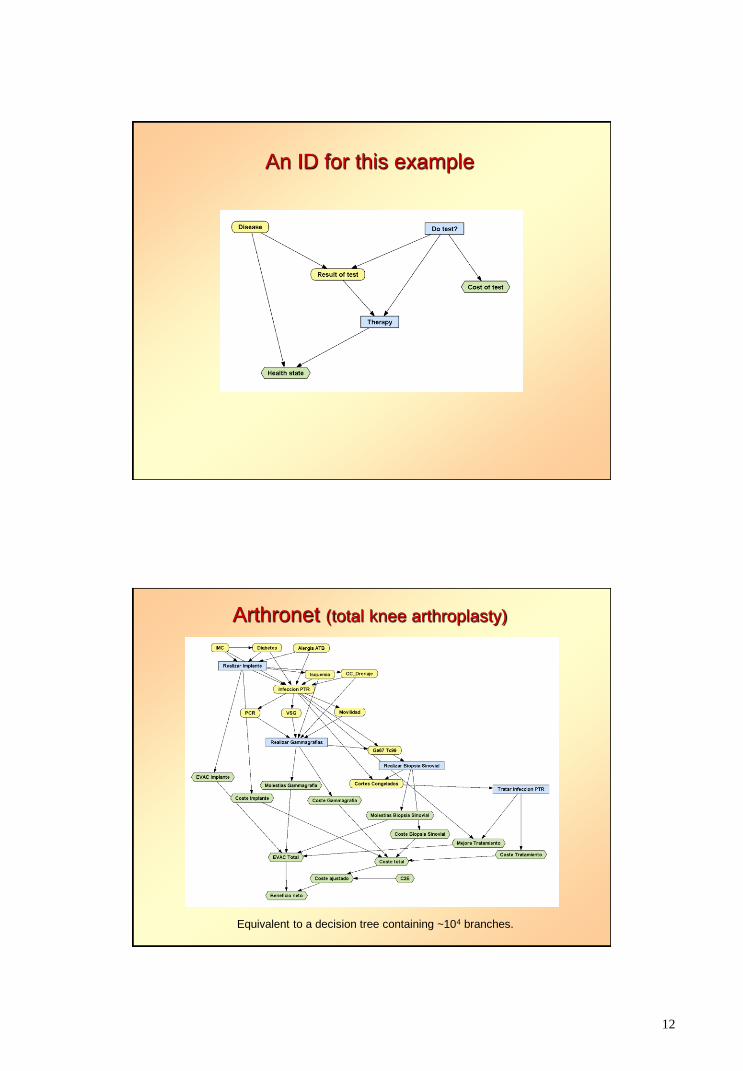
An ID for this example
Arthronet (total knee arthroplasty)
Equivalent to a decision tree containing ~104 branches.
13
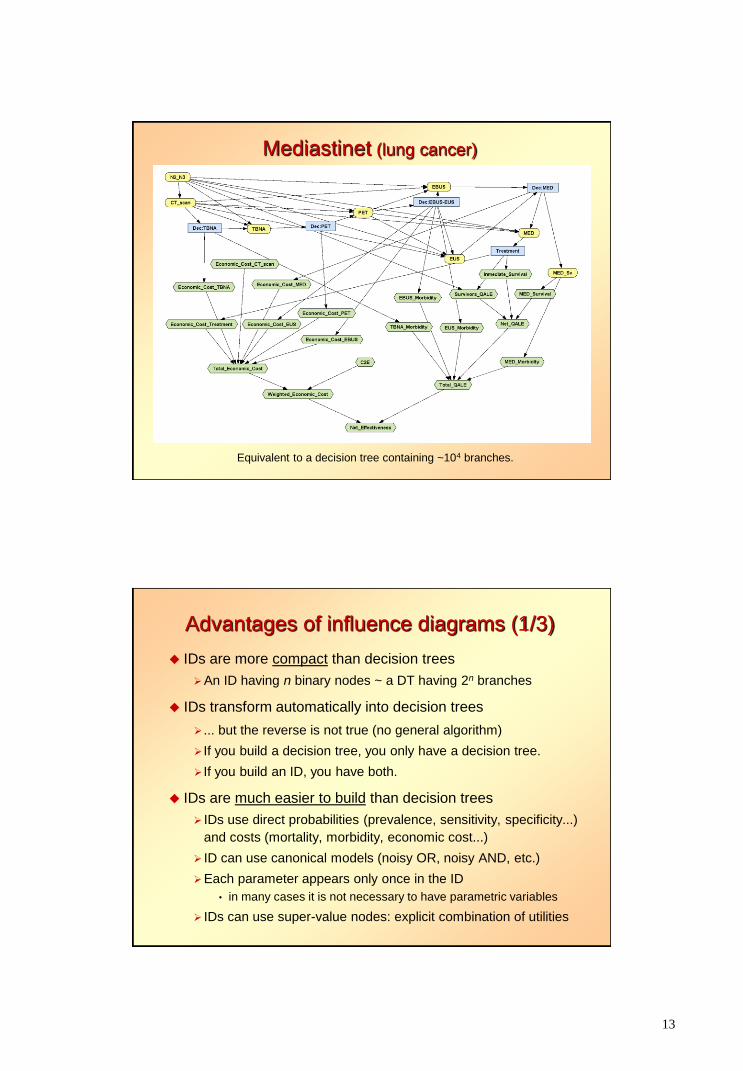
Mediastinet (lung cancer)
Equivalent to a decision tree containing ~104 branches.
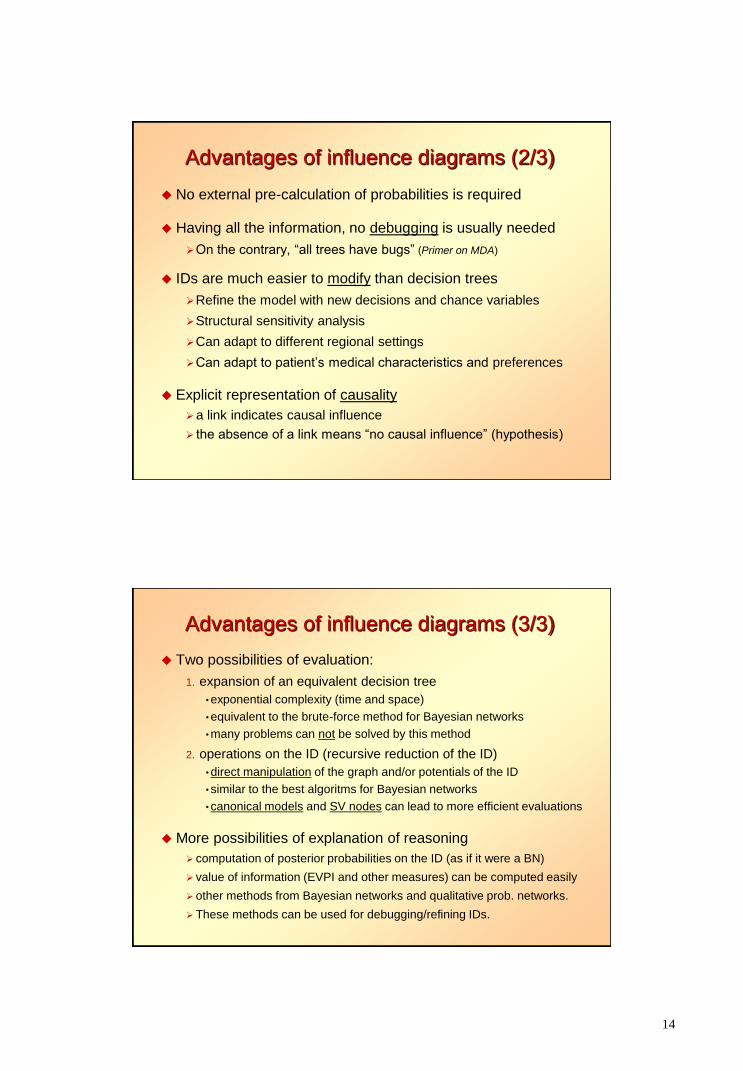
Advantages of influence diagrams (1/3)
IDs are more compact than decision trees
An ID having n binary nodes ~ a DT having 2n branches
IDs transform automatically into decision trees
... but the reverse is not true (no general algorithm)
If you build a decision tree, you only have a decision tree.
If you build an ID, you have both.
IDs are much easier to build than decision trees
IDs use direct probabilities (prevalence, sensitivity, specificity...)
and costs (mortality, morbidity, economic cost...)
ID can use canonical models (noisy OR, noisy AND, etc.)
Each parameter appears only once in the ID
• in many cases it is not necessary to have parametric variables
IDs can use super-value nodes: explicit combination of utilities
14
Advantages of influence diagrams (2/3)
No external pre-calculation of probabilities is required
Having all the information, no debugging is usually needed
On the contrary, “all trees have bugs” (Primer on MDA)
IDs are much easier to modify than decision trees
Refine the model with new decisions and chance variables
Structural sensitivity analysis
Can adapt to different regional settings
Can adapt to patient’s medical characteristics and preferences
Explicit representation of causality
a link indicates causal influence
the absence of a link means “no causal influence” (hypothesis)
Advantages of influence diagrams (3/3)
Two possibilities of evaluation:
1. expansion of an equivalent decision tree
• exponential complexity (time and space)
• equivalent to the brute-force method for Bayesian networks
• many problems can not be solved by this method
2. operations on the ID (recursive reduction of the ID)
• direct manipulation of the graph and/or potentials of the ID
• similar to the best algoritms for Bayesian networks
• canonical models and SV nodes can lead to more efficient evaluations
More possibilities of explanation of reasoning
computation of posterior probabilities on the ID (as if it were a BN)
value of information (EVPI and other measures) can be computed easily
other methods from Bayesian networks and qualitative prob. networks.
These methods can be used for debugging/refining IDs.

15
16
IDs in the literature on MDM (1/3)
Books that mention decision trees but do not mention IDs
• Weinstein, Fineberg. Clinical Decision Making. 1980.
• Sloan (ed.). Valuing Health Care. 1995.
• Gold et al. Cost-Effectiveness in Health and Medicine. 1996.
• Sackett et al. Evidence-Based Medicine. 1997 (and three other books on EBM).
• Petiti. Meta-Analysis, Decision Analysis and CEA. 2nd ed., 2000.
• Drummond, McGuire (eds.). Economic Eval. in Health Care Programs. 2001.
• Levin and McEwan. Cost-Effectiveness Analysis. 2nd ed., 2001.
• Parmigiani. Modelling in Medical Decision Making. 2002.
• Haddix et al. Prevention Effectiveness. 2nd ed., 2003.
• Fox-Rushby and Cairns. Economic Evaluation. 2005.
• Briggs et al. Decision Modelling for Health Economic Evaluation, 2006.
• Arnold. Pharmacoeconomics: From Theory to Practice. 2009.
• Kassirer et al. Learning Clinical Reasoning. 2nd ed., 2010.
• Mushlin and Greene. Decision Making in Medicine. 3rd ed., 2010. (cont’d)
IDs in the literature on MDM (2/3)
Books that mention decision trees but do not mention IDs (cont.)
• Gray et al. Applied Methods of CEA in Health Care, 2011. Alfaro-LeFevre.
Critical Thinking, Clinical Reasoning, and Clinical Judgment.
5th ed., 2013.
• Morris et al. Economic Analysis in Healthcare. 2nd ed., 2012.
• Rascati. Essentials of Pharmacoeconomics. 2nd ed., 2013.
• Sox et al. Medical Decision Making. Latest ed., 2013.
• Hunink et al. Decision Making in Health and Medicine. 2nd ed., 2014.
• Drummond et al. Methods for the Economic Evaluation of Health Care
Programmes. 4th ed. 2015.
• Edlin et al. Cost Effectiveness Modelling for HTA… 2015.
One book that mentioned IDs
• Muenning. Designing and Conducting Cost-Effectiveness Analyses in
Medicine and Health Care. 2002.
“An influence diagram (also known as a tornado diagram) ...” [p. 242]
The mistake is (partially) corrected in the second edition of the book, 2007.

17
IDs in the literature on MDM (3/3)
Three books that describe IDs
• Chapman and Sonnenberg (eds.). Decision Making in Health Care. 2000
(5 pages out of 421, in a chapter authored by Mark Roberts).
• Schwartz and Bergus. Medical Decision Making. A Physician's Guide. 2008.
• Kattan. Encyclopedia of Medical Decision Making. 2009
(4 pages out of 1200+)
Summary of the informal survey of books on MDM and EBM
26 books published after 1984
All of them explain DTs but only 3 describe IDs, very briefly.
Some books on medical informatics mention IDs:
• Shortliffe and Cimino. Biomedical Informatics. 4th ed., 2013 (2.5 pages out of 991).
• Kalet. Principles of Biomedical Informatics. 2nd ed., 2013 (3 pages out of 708).
Why are IDs so little known in health sciences after 30+ years?
Limitations of IDs
1. The “reasoning” of an ID is not easy to understand
2. The evaluation returns large policy tables
3. Algorithms could only evaluate unicriterion IDs
They cannot perform cost-effectiveness analysis
4. Temporal reasoning was not possible with IDs
Dynamic IDs are computationally unfeasible.
5. IDs can only model symmetric problems
IDs require a total ordering of the decisions
IDs cannot represent incompatibilities between values
• Non-standard versions of IDs partially solve this problem,
but none of the alternatives is completely satisfactory.
18
Solutions we have proposed
1. Explanation in influence diagrams
showing the posterior probabilities and expected values
introduction of evidence
hypothetical reasoning (what if) by means of imposed policies
2. Synthesizing the optimal intervention
in the form of a compact tree
3. Cost-effectiveness analysis with IDs
4. Markov influence diagrams
including cost-effectiveness analysis
5. Decision analysis networks
an alternative to IDs for asymmetric decision problems.
Decision analysis networks

19
Influence diagram Decision analysis network
The ID contains two information arcs:
because the symptom is always observed (spontaneously)
because the result of the test is known just after doing the test
The variable “Result of test” does not make sense when the test is not
performed
The n-test problem
Computationally complex: n! possible orderings of the tests.
We have developed an any-space algorithm for this problem
and a fast algorithm (9 minutes for the 7-test problem).
We are developing more efficient algorithms.
20
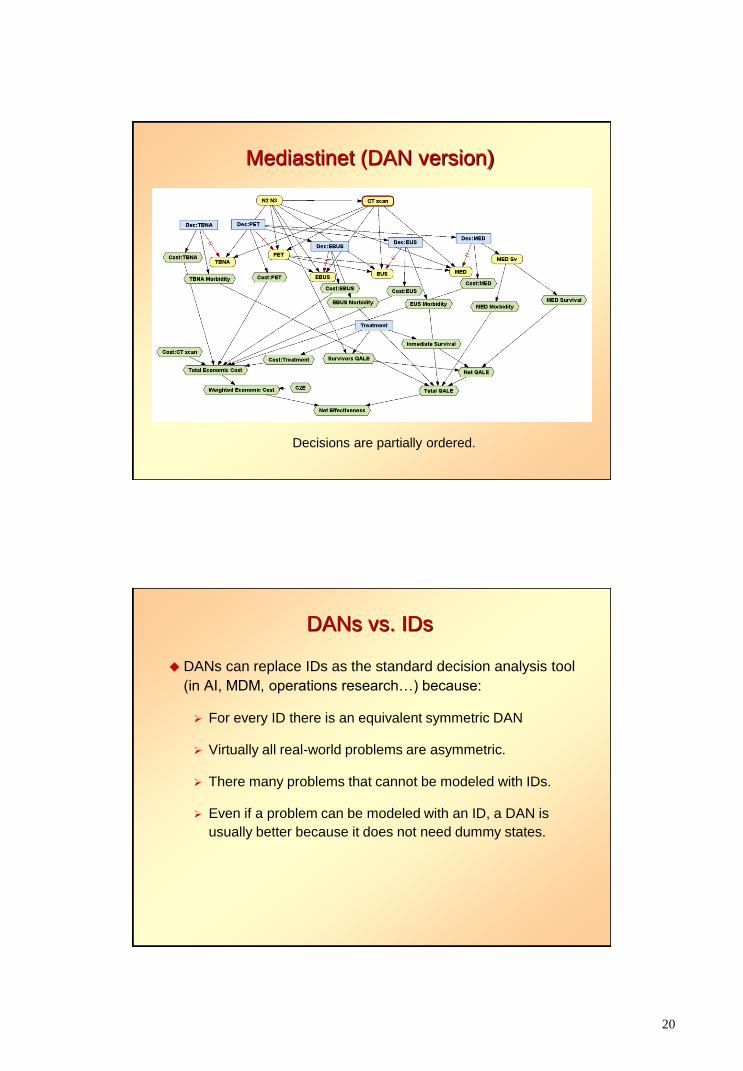
Mediastinet (DAN version)
Decisions are partially ordered.
DANs vs. IDs
DANs can replace IDs as the standard decision analysis tool
(in AI, MDM, operations research…) because:
For every ID there is an equivalent symmetric DAN
Virtually all real-world problems are asymmetric.
There many problems that cannot be modeled with IDs.
Even if a problem can be modeled with an ID, a DAN is
usually better because it does not need dummy states.
21
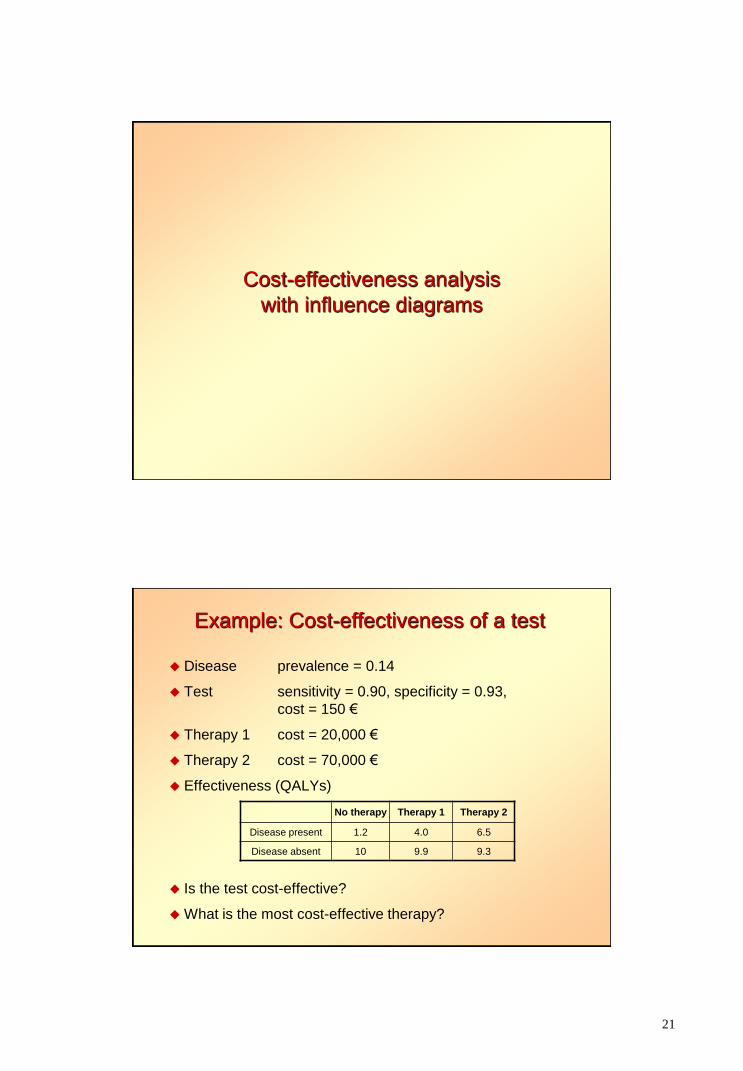
Cost-effectiveness analysis
with influence diagrams
Example: Cost-effectiveness of a test
Disease prevalence = 0.14
Test sensitivity = 0.90, specificity = 0.93,
cost = 150 €
Therapy 1 cost = 20,000 €
Therapy 2 cost = 70,000 €
Effectiveness (QALYs)
No therapy Therapy 1 Therapy 2
Disease present 1.2 4.0 6.5
Disease absent 10 9.9 9.3
Is the test cost-effective?
What is the most cost-effective therapy?
22
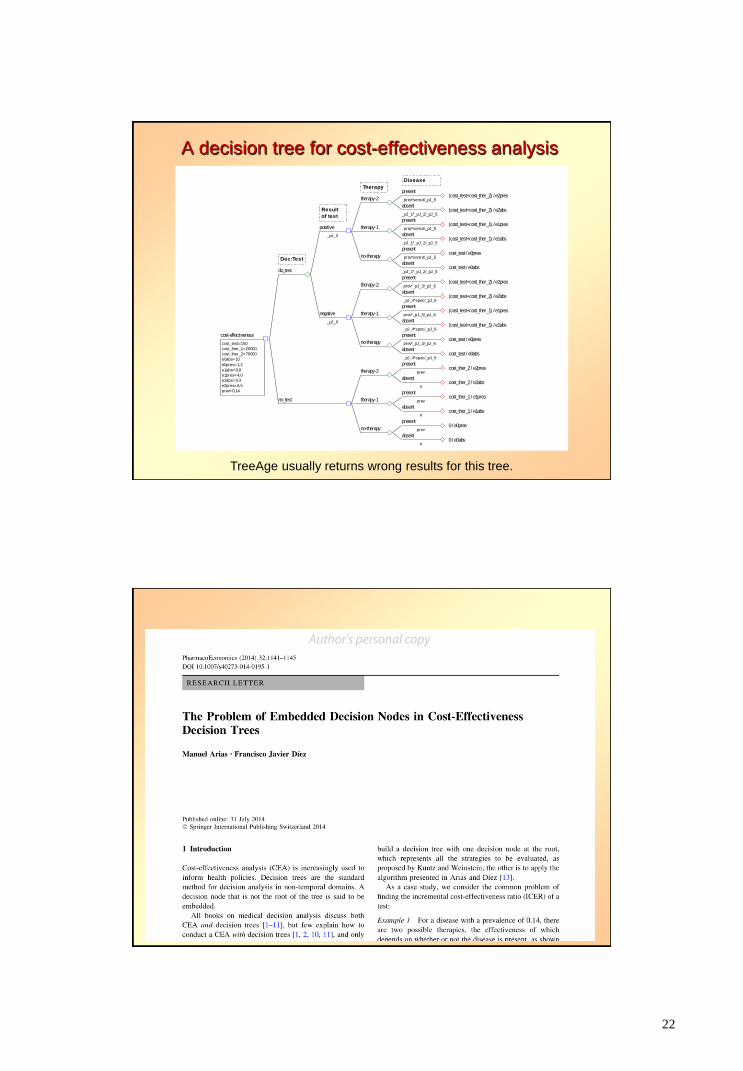
A decision tree for cost-effectiveness analysis
present
Disease
prev*sensit/_pJ_5(cost_test+cost_ther_2) / e2pres
absent
_pJ_1*_pJ_2/_pJ_5(cost_test+cost_ther_2) / e2abs
therapy-2
Therapy
present
prev*sensit/_pJ_5(cost_test+cost_ther_1) / e1pres
absent
_pJ_1*_pJ_2/_pJ_5(cost_test+cost_ther_1) / e1abs
therapy-1
present
prev*sensit/_pJ_5cost_test / e0pres
absent
_pJ_1*_pJ_2/_pJ_5cost_test / e0abs
no-therapy
positive
Result
of test
_pJ_5
present
prev*_pJ_3/_pJ_6(cost_test+cost_ther_2) / e2pres
absent
_pJ_4*spec/_pJ_6(cost_test+cost_ther_2) / e2abs
therapy-2
present
prev*_pJ_3/_pJ_6(cost_test+cost_ther_1) / e1pres
absent
_pJ_4*spec/_pJ_6(cost_test+cost_ther_1) / e1abs
therapy-1
present
prev*_pJ_3/_pJ_6cost_test / e0pres
absent
_pJ_4*spec/_pJ_6cost_test / e0abs
no-therapy
negative
_pJ_6
do_test
Dec:Test
present
prevcost_ther_2 / e2pres
absent
#cost_ther_2 / e2abs
therapy-2
present
prevcost_ther_1 / e1pres
absent
#cost_ther_1 / e1abs
therapy-1
present
prev0 / e0pres
absent
#0 / e0abs
no-therapy
no_test
cost-effectiveness
cost_test=150
cost_ther_1=20000
cost_ther_2=70000
e0abs=10
e0pres=1,2
e1abs=9,9
e1pres=4,0
e2abs=9,3
e2pres=6,5
prev=0,14
TreeAge usually returns wrong results for this tree.
23
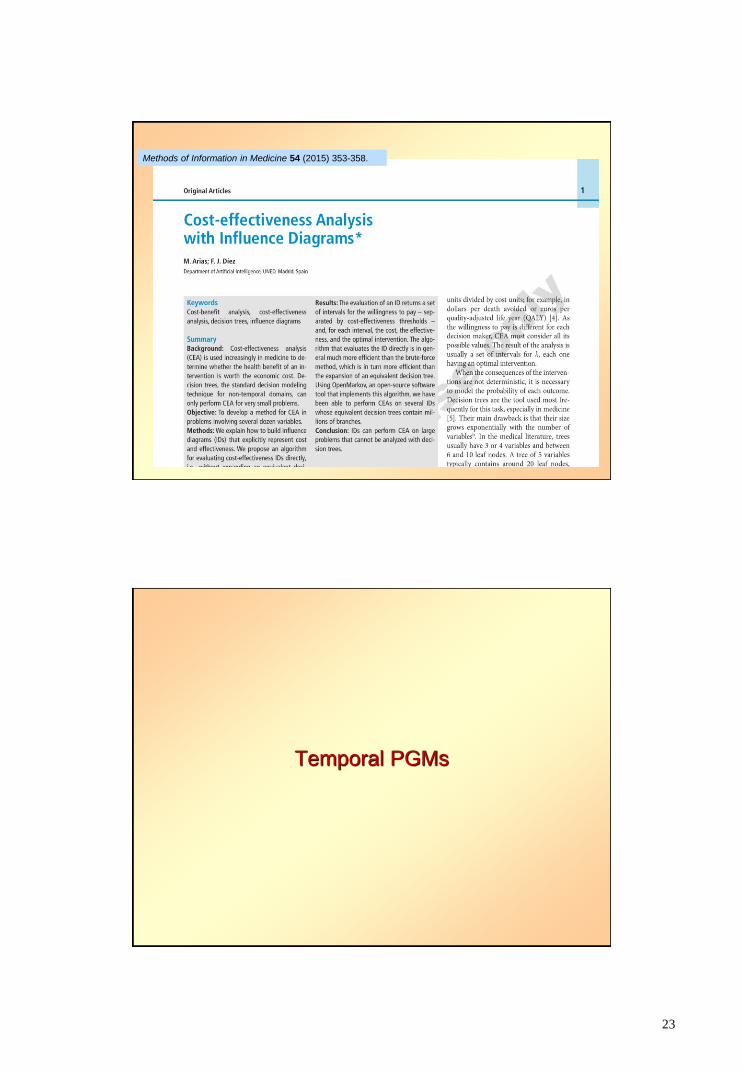
Methods of Information in Medicine 54 (2015) 353-358.
Temporal PGMs
24
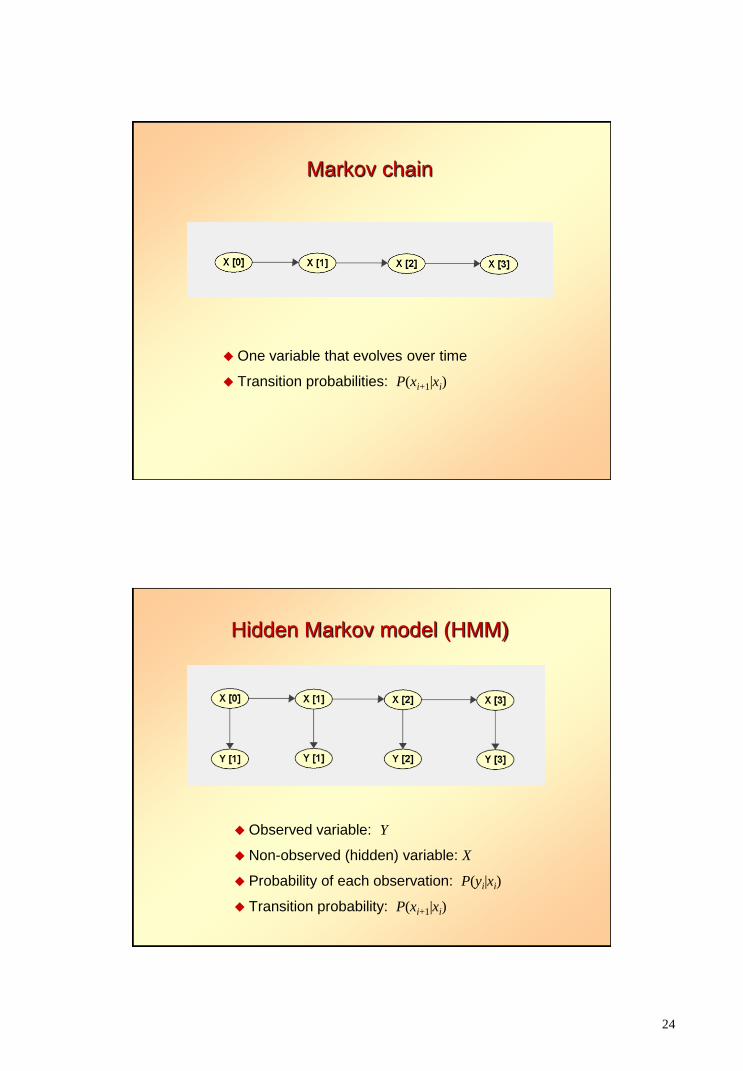
Markov chain
One variable that evolves over time
Transition probabilities: P(xi+1|xi)
Hidden Markov model (HMM)
Observed variable: Y
Non-observed (hidden) variable: X
Probability of each observation: P(yi|xi)
Transition probability: P(xi+1|xi)
25
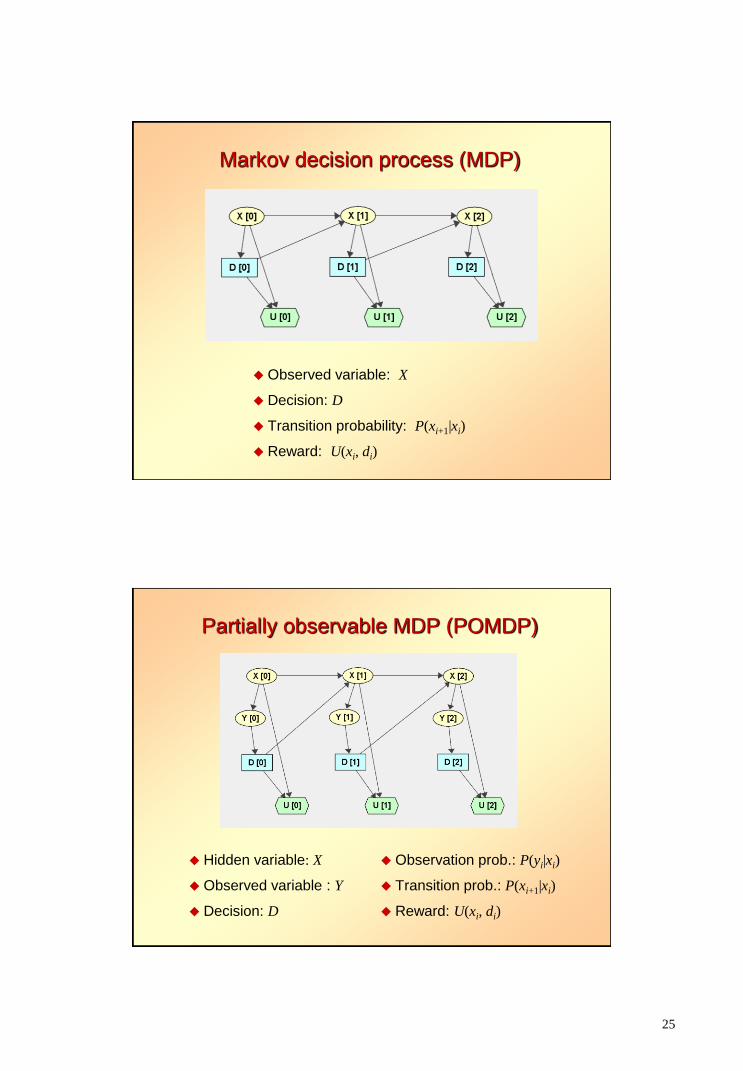
Markov decision process (MDP)
Observed variable: X
Decision: D
Transition probability: P(xi+1|xi)
Reward: U(xi, di)
Partially observable MDP (POMDP)
Hidden variable: X
Observed variable : Y
Decision: D
Observation prob.: P(yi|xi)
Transition prob.: P(xi+1|xi)
Reward: U(xi, di)
26
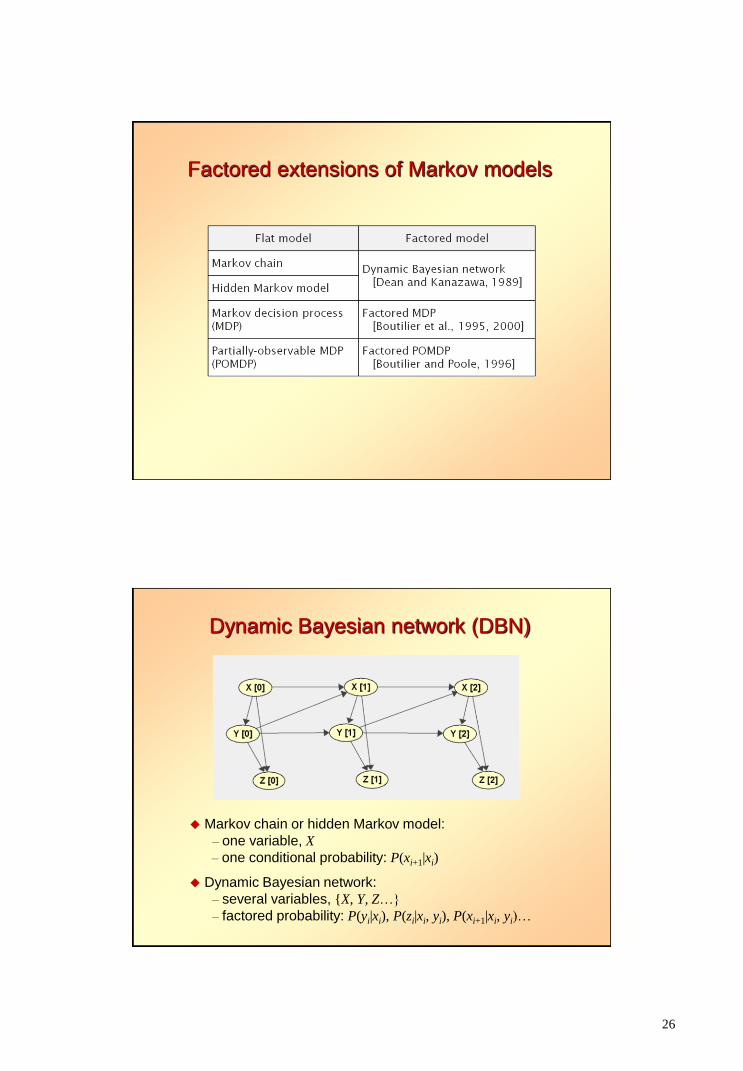
Factored extensions of Markov models
Dynamic Bayesian network (DBN)
Markov chain or hidden Markov model:
– one variable, X
– one conditional probability: P(xi+1|xi)
Dynamic Bayesian network:
– several variables, {X, Y, Z…}
– factored probability: P(yi|xi), P(zi|xi, yi), P(xi+1|xi, yi)…

27
IJCAI Workshop Decision Making in Partially Observable,
Uncertain Worlds: Exploring Insights from Multiple Communities
Barcelona, July 2011
Markov influence diagrams
28
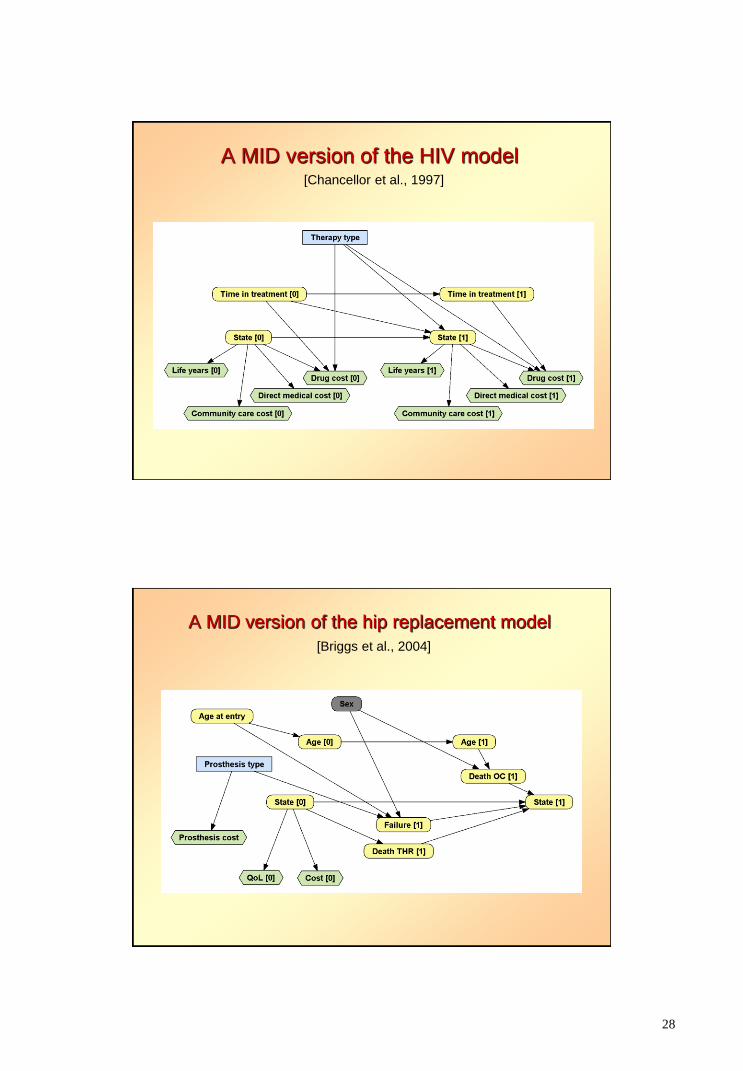
A MID version of the HIV model [Chancellor et al., 1997]
A MID version of the hip replacement model
[Briggs et al., 2004]
29
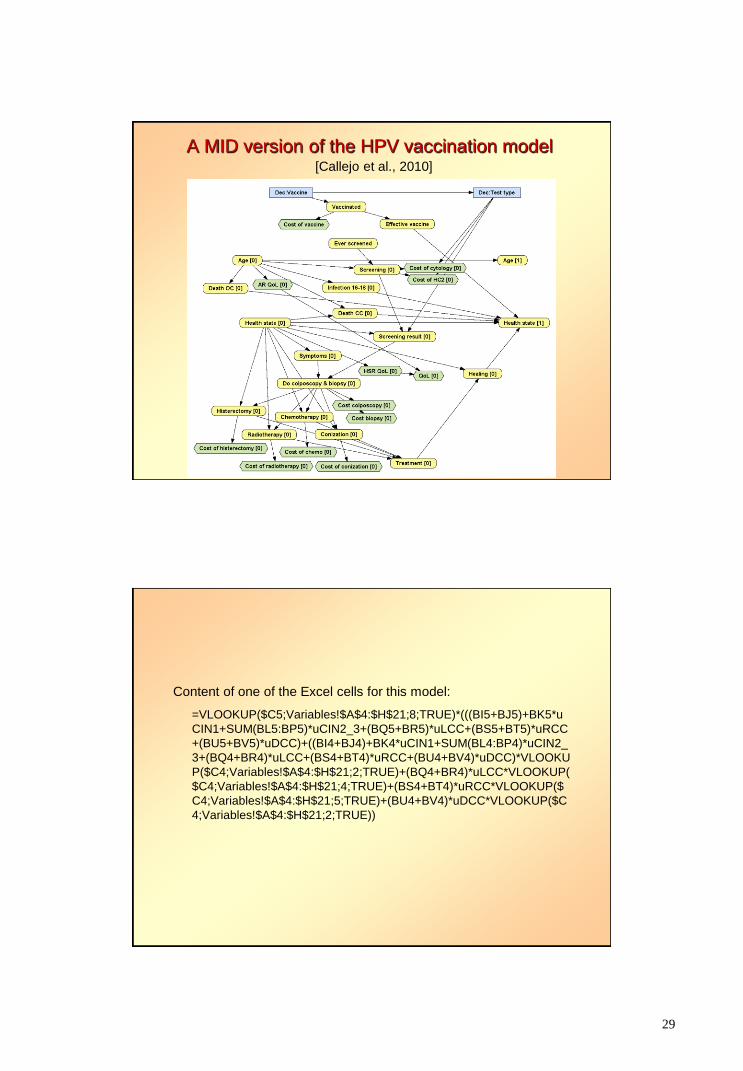
A MID version of the HPV vaccination model [Callejo et al., 2010]
Content of one of the Excel cells for this model:
=VLOOKUP($C5;Variables!$A$4:$H$21;8;TRUE)*(((BI5+BJ5)+BK5*u
CIN1+SUM(BL5:BP5)*uCIN2_3+(BQ5+BR5)*uLCC+(BS5+BT5)*uRCC
+(BU5+BV5)*uDCC)+((BI4+BJ4)+BK4*uCIN1+SUM(BL4:BP4)*uCIN2_
3+(BQ4+BR4)*uLCC+(BS4+BT4)*uRCC+(BU4+BV4)*uDCC)*VLOOKU
P($C4;Variables!$A$4:$H$21;2;TRUE)+(BQ4+BR4)*uLCC*VLOOKUP(
$C4;Variables!$A$4:$H$21;4;TRUE)+(BS4+BT4)*uRCC*VLOOKUP($
C4;Variables!$A$4:$H$21;5;TRUE)+(BU4+BV4)*uDCC*VLOOKUP($C
4;Variables!$A$4:$H$21;2;TRUE))
30
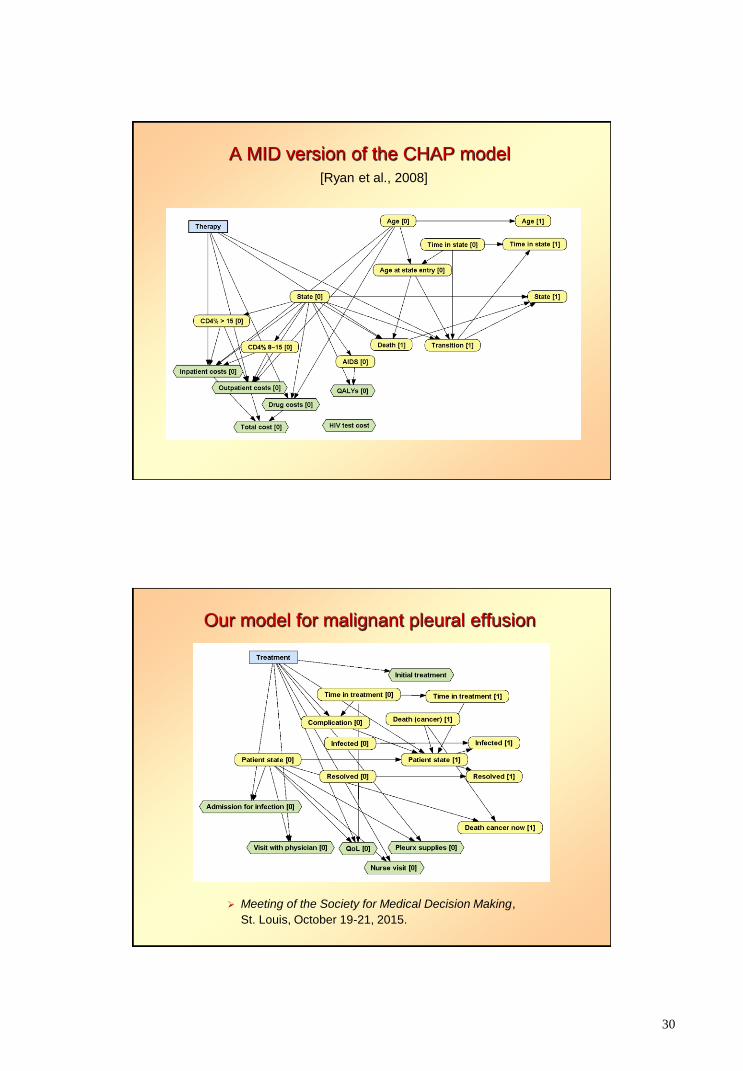
A MID version of the CHAP model
[Ryan et al., 2008]
Our model for malignant pleural effusion
Meeting of the Society for Medical Decision Making,
St. Louis, October 19-21, 2015.
31
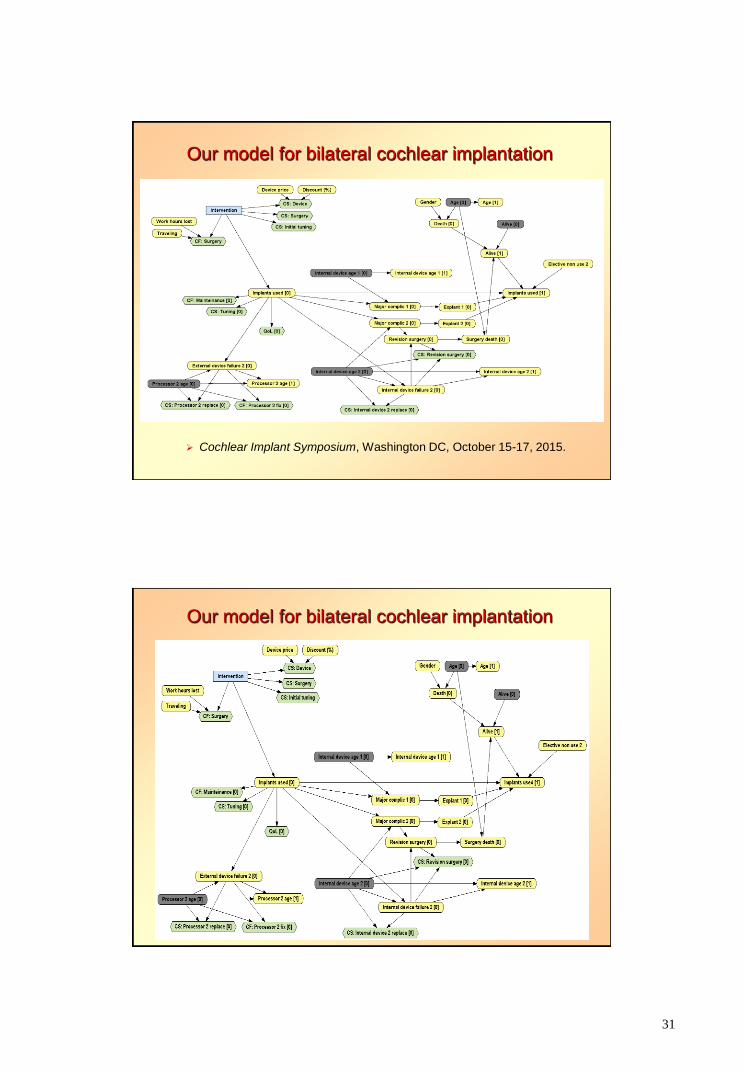
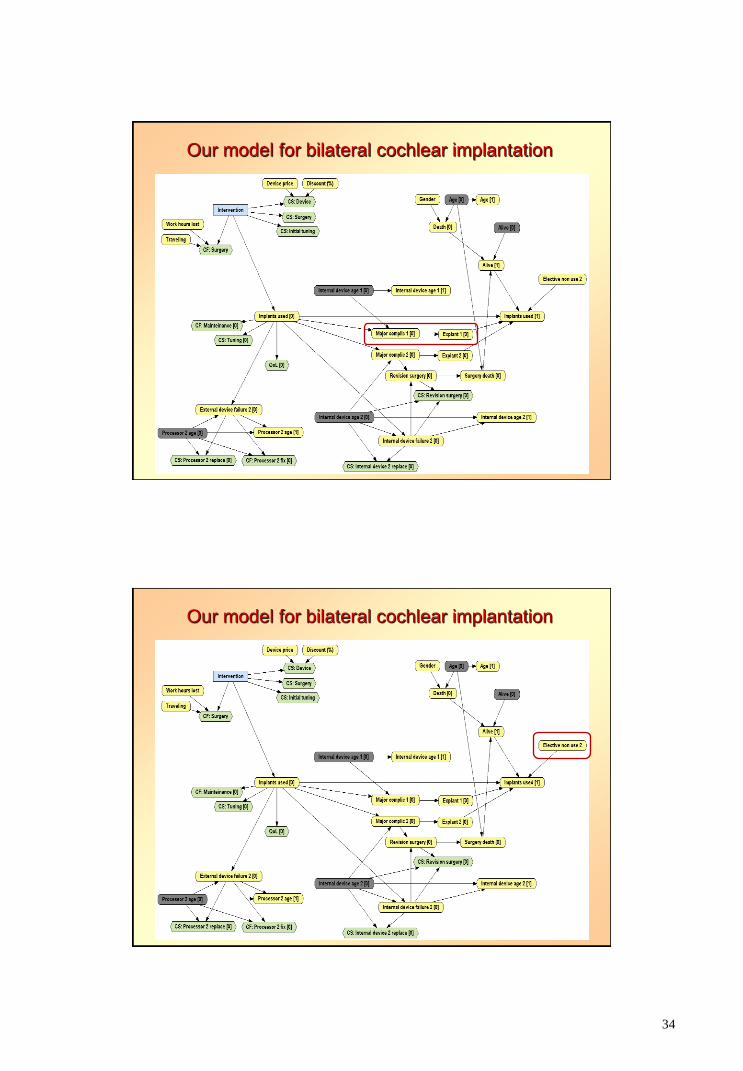
Our model for bilateral cochlear implantation
Cochlear Implant Symposium, Washington DC, October 15-17, 2015.
Our model for bilateral cochlear implantation

32
Our model for bilateral cochlear implantation
Our model for bilateral cochlear implantation
33
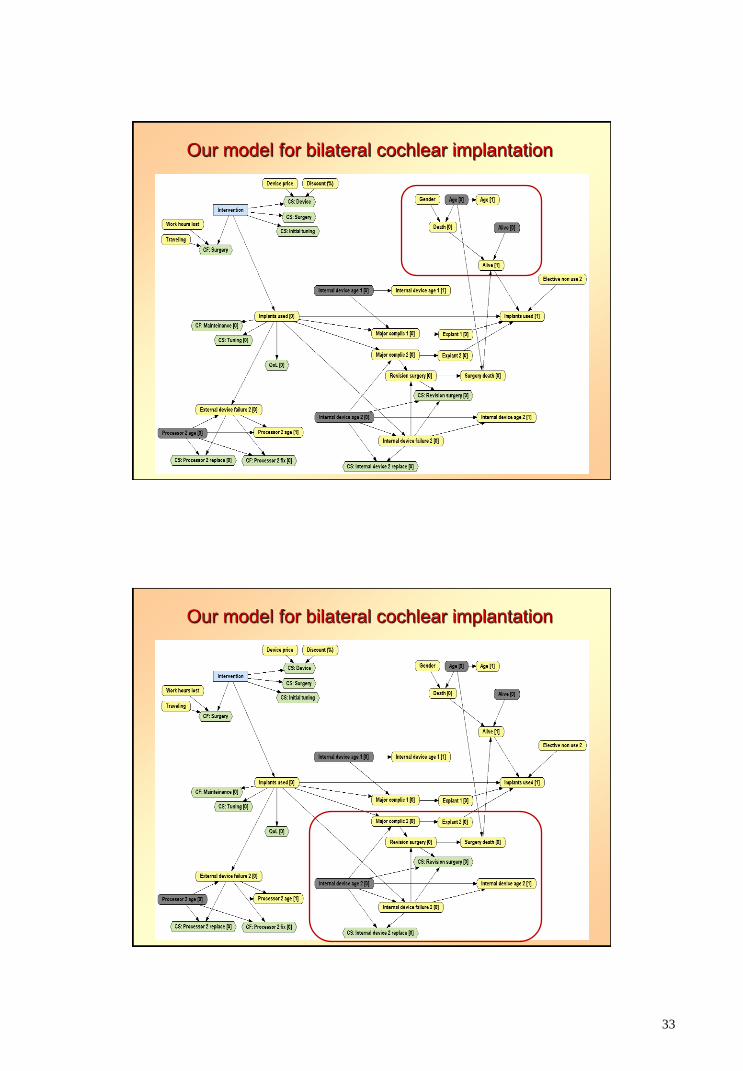
Our model for bilateral cochlear implantation
Our model for bilateral cochlear implantation
34
Our model for bilateral cochlear implantation
Our model for bilateral cochlear implantation
35
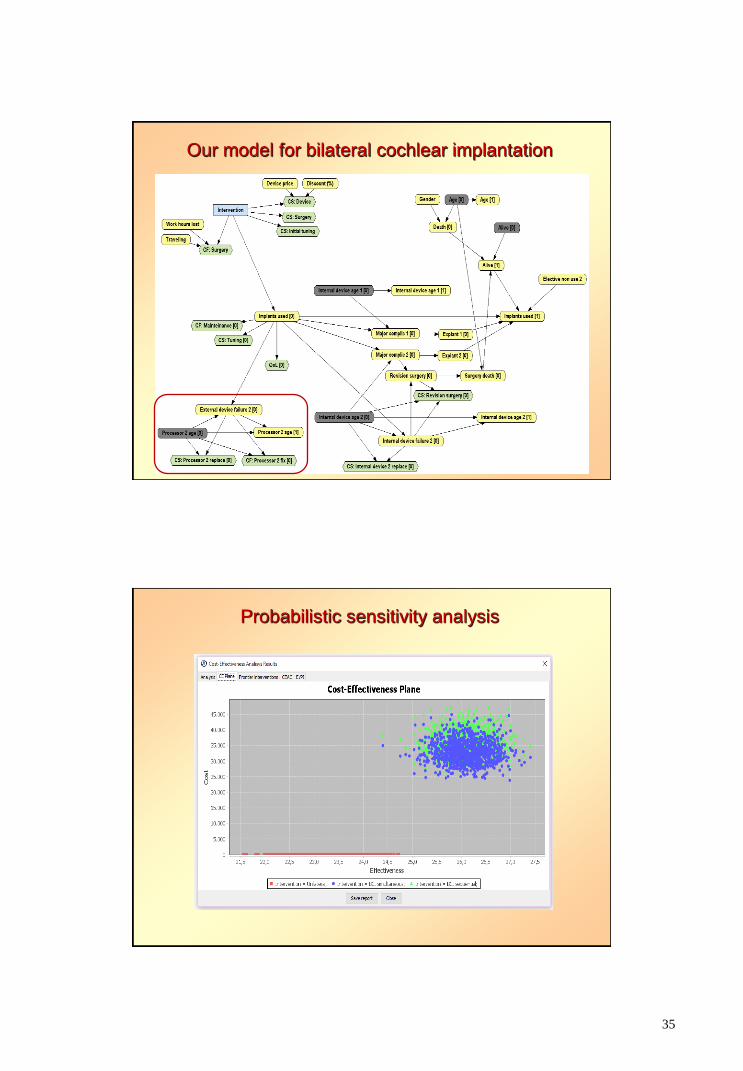
Our model for bilateral cochlear implantation
Probabilistic sensitivity analysis
36
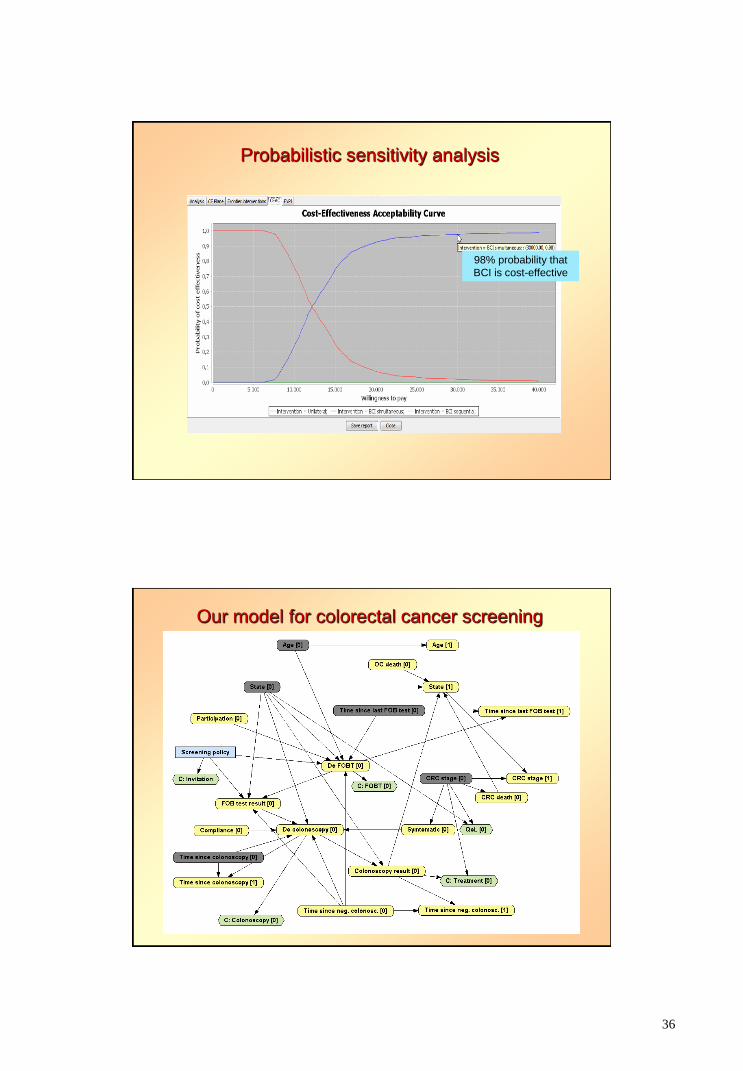
Probabilistic sensitivity analysis
98% probability that
BCI is cost-effective
Our model for colorectal cancer screening
37
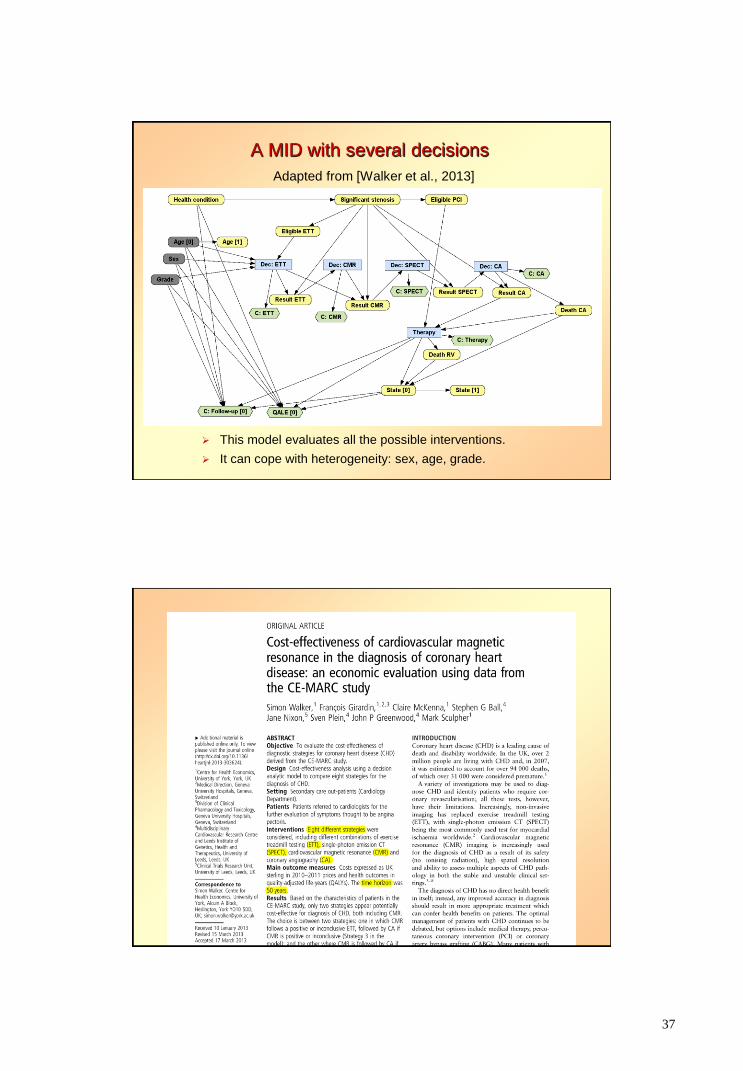
A MID with several decisions
Adapted from [Walker et al., 2013]
This model evaluates all the possible interventions.
It can cope with heterogeneity: sex, age, grade.
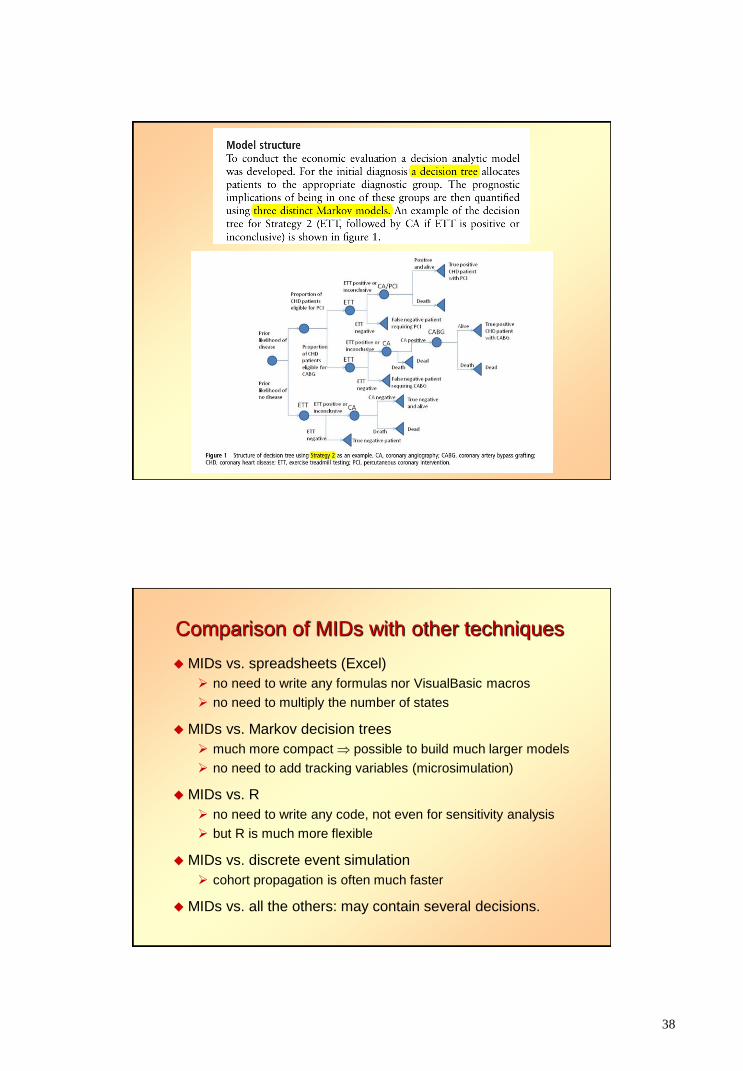
38
Comparison of MIDs with other techniques
MIDs vs. spreadsheets (Excel)
no need to write any formulas nor VisualBasic macros
no need to multiply the number of states
MIDs vs. Markov decision trees
much more compact possible to build much larger models
no need to add tracking variables (microsimulation)
MIDs vs. R
no need to write any code, not even for sensitivity analysis
but R is much more flexible
MIDs vs. discrete event simulation
cohort propagation is often much faster
MIDs vs. all the others: may contain several decisions.
39
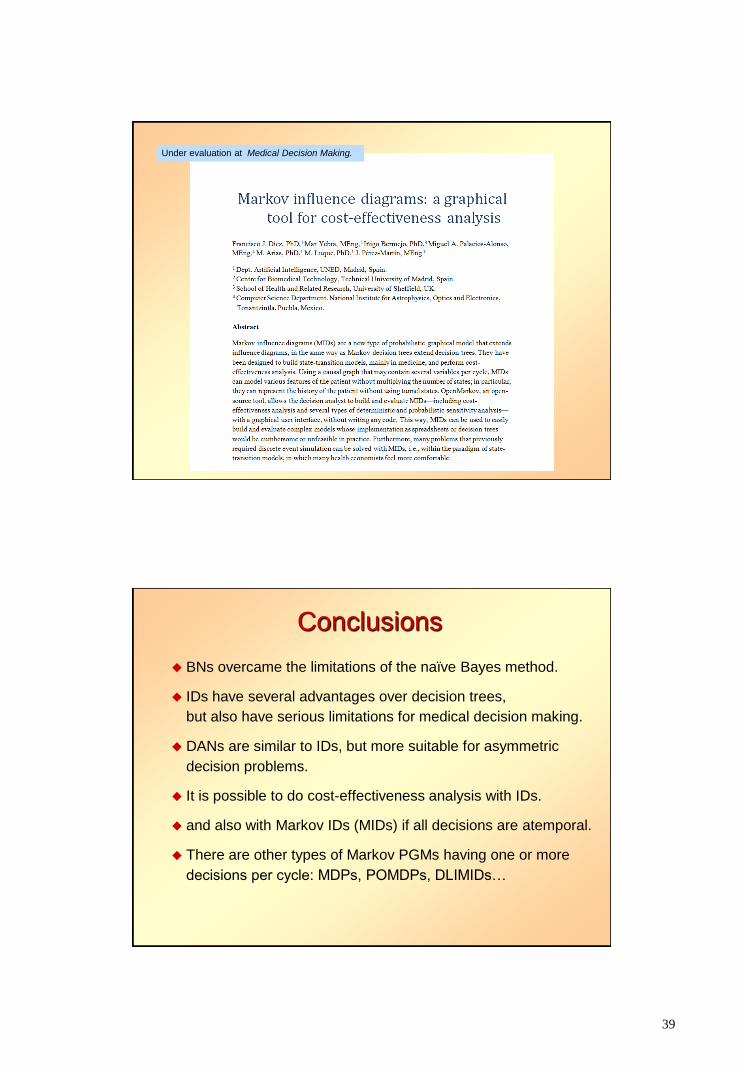
Under evaluation at Medical Decision Making.
Conclusions
BNs overcame the limitations of the naïve Bayes method.
IDs have several advantages over decision trees,
but also have serious limitations for medical decision making.
DANs are similar to IDs, but more suitable for asymmetric
decision problems.
It is possible to do cost-effectiveness analysis with IDs.
and also with Markov IDs (MIDs) if all decisions are atemporal.
There are other types of Markov PGMs having one or more
decisions per cycle: MDPs, POMDPs, DLIMIDs…
40
Future work
New models and algorithms
CEA with DANs and Markov DANs
CEA with models having one or several decisions per cycle
new methods of CEA, sensitivity analysis, explanation of
“reasoning”…
Integration of PGMs, cost-effectiveness analysis,
and Bayesian inference
integration of OpenMarkov with OpenBUGS and/or STAN.
Dissemination in the fields of MDM and health economics
seminars, short courses, MOOC…
tutorials, journal papers, book…
Thank you very much for your attention!