measuring the next stage of success - wells fargo history · pdf filewells fargo & company...
TRANSCRIPT

Wells Fargo & Company Annual Report 2003
Measuring the Next Stage of SuccessThe 15 most important measures of success in today’s financial services industry

1 To Our OwnersChairman and CEO Dick Kovacevichmeasures our success in 2003, explainswhy the financial services industry needsa new set of measures for future success,and reviews our major opportunities forgrowth in 2004 and beyond.
9 The 15 Most ImportantMeasures These are the measures we believe arethe most important indicators of successin today’s financial services industry—our list begins with the most importantof all: revenue growth.
24 Measuring our Success inCommunity InvolvementWe measure success in communityinvolvement not just in quantity—dollarsand other resources—but in quality—thevalue of our volunteer spirit, expertise,and knowledge of our communities.
30 Board of Directors,Senior Management
33 Financial Review
58 Financial Statements
108 Independent Auditors’ Report
112 Stockholder Information
Wells Fargo & Company (NYSE:WFC) is a diversified financial servicescompany providing banking, insurance, investments, mortgage and consumer finance. Our corporate headquarters is in San Francisco, but we’redecentralized so all Wells Fargo “convenience points”—including stores,regional commercial banking centers, ATMs, Phone BankSM centers, internet—are headquarters for satisfying all our customers’ financial needs and helpingthem succeed financially.
Assets: $388 billion
Rank in assets among U.S. peers: 5th
Market value of stock: $100 billion
Rank by market value among U.S. peers: 3rd
Team members: 140,000 (one of U.S.’s 40 largest private employers)
Customers: 23 million
Stores: 5,900
Fortune 500 rank (revenue): 46th
“Aaa” Wells Fargo Bank, N.A. is the only U.S. bank rated “Aaa” by Moody’s
Investor Services, the highest possible rating. Moody’s cited Wells Fargo’s strong
retail and middle-market banking franchise, good earnings diversity by product
and geography, consistently robust core earnings, solid risk management,
conservative credit culture, core deposit growth, highly focused sales culture,
and good corporate governance. Moody’s said these attributes should lead to
continued “stable and predictable earnings and risk profile.”
FORWARD-LOOKING STATEMENTS In this report we make forward-looking statements about our company’s financial condition, results of operations, plans, objectives and future performance and business.When we use “estimate,”“expect,”“intend,”“plan,”“project,”“target,”“can,”“could,”“may,”“should,”“will,”“would” or similar expressions, we are making forward-looking statements. These statements involve risks and uncertainties. A number of factors — many beyond our control — could cause results to differ from those in our forward-looking statements.These factors include: • changes in geopolitical, business and economic conditions, including changes in interest rates • competition from other financial servicescompanies • fiscal and monetary policies • customers choosing not to use banks for transactions • legislation, including the Gramm-Leach-Bliley Act • critical accounting policies • the integration of merged and acquired companies • future mergers and acquisitions.We discuss in more detail on pages 53–56 these and other factors that could cause results to differ from those in our forward-looking statements.There are other factors not described in this report that could cause results to differ.© 2004 Wells Fargo & Company. All rights reserved.

To Our Owners,Our report to you this year is about
how we measure the “Next Stage”of success—but let’sfirst review our most recent success, in 2003. By virtuallyany measure, it was another great year. Once again weachieved record revenue and profit. Double-digit increasesagain in both measures! Our financial performance wasamong the very best not only in financial services but inany industry. Our bank is the only one in America rated“Aaa”by Moody’s Investor Services.The market value ofWells Fargo stock surpassed $100 billion for the first time. Only about 20 other U.S. companies have a highermarket cap.Our credit quality was among the best in ourindustry.We earned even more of our customers’ businessand gained market share. Equally important, we’re wellpositioned for continued growth in market share, revenueand net income.
Dick Kovacevich, Chairman & CEO

2
Among our achievements in 2003:• Earnings per share – a record $3.65,
up 10 percent. • Net income – a record $6.2 billion,
up 9 percent.• Return on equity – 19.4 percent; return
on assets 1.64 percent.• For the second consecutive year – our
revenue growth, 12 percent, was amongthe best of our peers– following our 13 percent growth in 2002. I stronglybelieve the key to consistent bottom line(profit) growth is consistent top line(revenue) growth.
• Nonperforming assets and net charge-offs,as a percent of loans, declined from .88percent in 2002 to .66 percent in 2003 andfrom .96 percent in 2002 to .81 percent in2003, respectively.
• Our allowance for loan losses continued to provide more than two times coverageof both our nonperforming loans and our net charge-offs.
• Core product sales in CommunityBanking – up 11 percent.
• We set another industry record formortgage originations, $470 billion. In the past three years we’ve originated morethan $1 trillion in home mortgages. Wecontinued to be #1 in mortgage lending to people of color and low-to-moderateincome home buyers. In California, thenation’s largest housing market, we’re #1in mortgages for homebuyers who areAsian-American, Hispanic, African-American and Native American.
• Wholesale Banking net income – up 17 percent, the fifth consecutive year of record earnings.
Delivering superior value to our customers—thus earning more of their business andgrowing revenue, profit and stock price—enables us to continue delivering superiorvalue for you, our stockholders. Thanks tothe continued strength and consistency ofour financial performance—and the recentequalizing of dividend and capital gains taxrates—we increased our quarterly commonstock dividend in 2003 by 50 percent to 45 cents a share. We target a dividendpayout ratio at 40 to 50 percent of earnings.The marketplace continues to recognize ourperformance. Our stock price closed at arecord high of $58.94 on December 30,
2003. Our total return to shareholders for 2003, including reinvested dividends,was 29.4 percent.
Our outstanding financial performance isnot just a short-term phenomenon. The pastten years, both our revenue and earnings pershare have grown at an annual compoundrate of 13 percent. Our annualized totalstockholders’ return during that period was 19.93 percent compared with 11.05percent for the S&P 500 and 15.25 percentfor the S&P banking index. We’ve had an extraordinary ride the past 17 years—consider that when I joined the old Norwest in 1986 our market capitalizationwas less than $1 billion. At year-end it was$100 billion.
Our Vision: Unchanged! One reason we’ve been able to consistently deliver thesestrong results for nearly two decades in alleconomic cycles without taking undue risk is because we have one of our industry’smost effective, time-tested business models.It’s not product-centric but customer-centricand it’s diversified, including virtually allfinancial products and services. It’s based onour belief that money never declines. It simplymoves from one segment or investmentvehicle to another, in response to macro-
economic factors and our customers’ ownlife cycles. From CDs and annuities tomutual funds and stocks and back. Ourcustomers go from net borrowers early in life to net investors later in life. From lifeinsurance to investments, from securedcredit to unsecured credit. Keeping ourcustomers’ business as they decide to movetheir money is how we’ve avoided volatileearnings through booms, busts, expansionsand recessions. When the stock marketdeclines, for example, our deposits rise.When interest rates decline, our mortgageoriginations grow. When interest rates rise—because the economy is improving—commercial loans grow and our mortgageservicing business gains value becauseservicing customers tend to keep theirmortgages longer. All of this is why ourvision hasn’t changed in 17 years—Wewant to satisfy all our customers’ financialneeds and help them succeed financially.We want to be the premier provider offinancial services in every one of ourmarkets, and be known as one of America’sgreat companies.
Measuring the “Next Stage”of SuccessOur vision has not changed, but the way we measure our success has. Ten years ago
One reason we’ve beenable to consistentlydeliver these strongresults for nearly twodecades in all economiccycles without takingundue risk is because we have one of ourindustry’s most effective, time-testedbusiness models. It’s not product-centric but customer-centric.

3
I spoke at a meeting of the Federal ReserveBank of Chicago and said publicly for thefirst time that I believed “the bankingindustry is dead, and we should bury it.”I said there would still be a banking business,but it would be just a segment of a muchlarger, faster growing, highly-fragmentedindustry called financial services. At thattime there were 13,000 banks. Now thereare about 7,800. Consolidation across ourindustry continues—caused by deregulation,technology and a growing awareness bycustomers that they can save time andmoney by consolidating their business withfewer (we would say just one!) financialproviders. In most cases, the 1990s was nota good time to be a mono-line, a narrowly-focused financial company. At one time oranother, almost every segment of the financialservices industry took a hit, includinginvestment banking, stock brokerage,mutual funds, commercial lending, savingsand loans, credit card companies, propertyand casualty insurance companies andfinance companies. I believe the long-termwinners—those who achieve consistentlyexcellent results, year after year, regardless of economic conditions—will be thosediversified financial services companies—not those that are narrowly-based—thatcan prove to their customers that they cansave them time and money if they bringmore or all of their financial servicesbusiness to them.
Changing the Measures of Success Now,ten years later, another change is long over-due in the financial services industry—it’s theway we measure success. How should wemeasure success? Even a game that’s beenaround as long as baseball is changing theway it measures success. As Michael Lewispoints out in his best-seller, Moneyball,statistics such as batting average and stolenbases traditionally were considered mostimportant. Today, it’s on-base percentage,runs scored, and slugging percentage. So,too, we must change how we measuresuccess in our industry. Traditionally, asset size and return on assets were mostimportant. Today, it’s revenue growth andproducts per customer.
Simply put, our industry often measuresthe wrong things. It’s using measures from
the stagnant, old banking industry tomeasure success in today’s dynamic financialservices industry. For example, return onassets—after-tax profit as a percent of assets—is an old loan-based measure. Itdoes not meaningfully measure the returnfrom feebased businesses such as mortgages,insurance agencies and money management—which together now are about 40 percentof the revenue of financial services companiessuch as Wells Fargo. Total assets simplyshow how big you are. Many “banks” havelearned the hard way: bigger is not alwaysbetter. You cannot simply acquire your wayto success. You get bigger by being better.You don’t get better by being bigger.
Likewise, the long-used “efficiency ratio”—how many cents it costs to earn a dollarof revenue—differs widely by type ofbusiness. Is a lower efficiency ratio betterthan a higher efficiency ratio? Not necessarily.A well-run wholesale banking business, forexample, may have an efficiency ratio of less than 30 percent. A well-run insuranceagency could be close to 80 percent. Guesswhich business has the higher risk-basedreturn on equity?
Another example: deposits. It’s still a valuable measure of market share but today it’s only about 20 percent of averagehousehold financial assets. Yet regulatorsstill measure market concentration for antitrust purposes based on commercialbank deposits. They don’t even fully includesavings banks, credit unions, money marketfunds, brokers and other bank competitors.Total customers also is a misleading measure.It tells you nothing about how much businessthose customers give you or how long theystay with you.
Financial services companies have beenmeasuring their results differently for manyyears. In this report, we present what webelieve is a more relevant set of measures for financial services companies in the 21stcentury. We believe they show more accuratelyhow value is created for team members,customers, communities and stockholders.We believe this new group of measures islikely to be applied throughout our entireindustry over time. Our industry also needsstandard definitions for these measures sothere can be a real “apples-to-apples”comparison of performance.
Over the past several years at Wells Fargo,we’ve been measuring success in ways thatoften are far different than our competitors.From among all those measures, we’veselected 15 that we believe are the mostimportant indicators of success in today’sfinancial services industry. You can reviewthem—and meet some of our team memberswho are responsible for our success in eachof these measures—beginning on page 9.
Some Major Growth Opportunities Many of the measures we highlightrepresent some of our most importantgrowth opportunities—such as productsper customer, assets under management,internet banking, deposits, mortgage,commercial and home equity market share.We also have many other significantgrowth opportunities for 2004, including:
Business Banking Businesses with annual revenues up to $20 million are thehub of job growth in our banking markets.We have an outstanding team of businessbankers. We’re now giving them morecentral support—information systems,staffing models and performancestandards—so they can spend more timewith customers and earn all their business,not just loans and deposits, but treasurymanagement, 401(k) plans, trust services,merchant card and their personal businessincluding investments. A business bankingcustomer of Wells Fargo can choose fromamong 47 products. Yet our average businessbanking customer has only 2.5 productswith us. Half of them have only one product with us! Our goals in businessbanking are to double revenue in five years,get to five products per customer, be theprimary provider for all their financial needs (business and personal) and be known as the best business bank in everysingle one of our markets.
Improving the Customer Experience Thequality of our customer service begins withour team members. They’re the single biggestinfluence on our customers. If our teammembers are happy and satisfied, ourcustomers will be more loyal to us and give us more opportunities to earn all their business. We regularly measure theengagement of our team members—to findout, for example, if they have the opportunity

Our PerformanceAnother great year: double-digit growth in revenue,earnings per share, net income and loans.
F O R T H E Y E A R
B e fo re e f fe c t o f c h a n g e i n a c co u n t i n g p r i n c i p l e (1)
Net income $ 6,202 $ 5,710 9%Earnings per common share 3.69 3.35 10Diluted earnings per common share 3.65 3.32 10
Profitability ratios
Net income to average total assets (ROA) 1.64% 1.77% (7)Net income applicable to common stock to average
common stockholders’ equity (ROE) 19.36 19.63 (1)
Af te r e f fe c t o f c h a n g e i n a c co u n t i n g p r i n c i p l e
Net income $ 6,202 $ 5,434 14Earnings per common share 3.69 3.19 16Diluted earnings per common share 3.65 3.16 16
Profitability ratios
ROA 1.64% 1.69% (3)ROE 19.36 18.68 4
Efficiency ratio (2) 60.6 58.3 4
Total revenue $ 28,389 $ 25,249 12
Dividends declared per common share 1.50 1.10 36
Average common shares outstanding 1,681.1 1,701.1 (1)Diluted average common shares outstanding 1,697.5 1,718.0 (1)
Average loans $213,132 $174,482 22Average assets 377,613 321,725 17Average core deposits 207,046 184,133 12
Net interest margin 5.08% 5.53% (8)
AT Y E A R E N D
Securities available for sale $ 32,953 $ 27,947 18Loans 253,073 192,478 31Allowance for loan losses 3,891 3,819 2Goodwill 10,371 9,753 6Assets 387,798 349,197 11Core deposits 211,271 198,234 7Common stockholders’ equity 34,484 30,258 14Stockholders’ equity 34,469 30,319 14Tier 1 capital 25,704 21,473 20Total capital 37,267 31,910 17
Capital ratios
Stockholders’ equity to assets 8.89% 8.68% 2Risk-based capital
Tier 1 capital 8.42 7.70 9Total capital 12.21 11.44 7
Tier 1 leverage 6.93 6.57 5
Book value per common share $ 20.31 $ 17.95 13
Team members (active, full-time equivalent) 140,000 127,500 10
($ in millions, except per share amounts) 2003 2002 % Change
(1) Change in accounting principle relates to transitional goodwill impairment charge recorded in first quarter 2002 related to the adoption of FAS 142, Goodwill and Other Intangible Assets.(2) The efficiency ratio is defined as noninterest expense divided by total revenue (net interest income and noninterest income).
4

5
to do what they do best every day, if they’vereceived recognition and praise for doinggood work in the last seven days, if theyhave someone at work who encourages theirdevelopment, if they have opportunities atwork to learn and grow. In Regional Bankingwe interview 30,000 customers a monthabout their experience in our stores—atleast ten customers for every one of our more than 3,000 banking stores everymonth. In Wholesale Banking, more than5,500 commercial and corporate customerstook training programs in 2003 at WellsFargo to help them get maximum benefitfrom our products and services—more thantriple the number who took part in thesessions the previous year. Every one of ourbanking stores, banking markets andbanking regions gets customer satisfaction
scores every month —so we can help ourstores that are below average in customerservice become good, so our good stores canget to great and so our great stores can staygreat. Among other Wells Fargo businesses,our mortgage company ranks among thetop five in the industry in service quality.Our Shareowner Services business hasranked #1 in customer satisfaction amongits peers seven of the last eight years. OurWholesale Banking businesses consistentlyrank high in service quality.
Private Client Services (PCS) There areabout 12 million households in our 23banking states with investable assets of morethan $100,000. Twenty-six percent of them
are Wells Fargo customers but only threepercent of those 12 million are PCScustomers. To pursue this huge opportunity,we’ve more than doubled the number of ourprivate bankers in the past three years to342. Also, 500 of our bankers now arelicensed to sell mutual funds and annuities.We expect to more than double that numberby the end of 2004.
Retail Banking Store Growth For years—especially in the 1990s when it seemedeveryone in the industry thought bankingstores were passé—we said stores wouldcontinue to be a very important channel,part of a fully-integrated delivery systemwith electronic channels. We were rightsimply because we listened to our customers.The vast majority of our customers visit oneof our banking stores several times a month.
We continue to add more stores. InCalifornia, for example, we’ve opened 90 new banking stores in the past five years,including a number in low-to-moderateincome communities. We opened a bankingstore in the largely Hispanic community ofPacoima in California’s San Fernando Valley,the first new bank there in 17 years. In lessthan a year, our Pacoima bank has morethan 1,000 checking account customers andmore than $3 million in deposits. We’ve alsocompleted a major remodeling of a bankingstore in an African-American neighborhoodin South Central Los Angeles and we’reremodeling four banking stores in otherunder-served areas of Los Angeles.
Serving Diverse Growth Segments
Two years ago, we became the first majorbank in the U.S. to partner with the Mexicangovernment to accept the matricula card asa primary form of identification for openinga bank account. The number of accountswe’ve opened using the matricula now hassurpassed 300,000. We’re opening an averageof more than 700 accounts a day for Mexicannationals using the matricula, a seven-foldincrease over a two-year period. By enablingmore Mexican nationals to access financialservices, we’re making it easier and cheaperfor them to send money back to theirfamilies in Mexico via wire transfer. Moneytransfers from Mexican workers in the U.S. to their families in Mexico havesurpassed direct foreign investment inMexico from multi-national corporations.
Among our other efforts:• We’ve opened a national Hispanic
Customer Service Center for our mortgagebusiness, headquartered in Las Cruces,New Mexico. It’s the first of its kind in theindustry, our first of several such centersto provide special service for Spanish-speaking homebuyers.
• We’ve launched a new homeownershipinitiative that offers Korean-Americans inLos Angeles and Orange Counties bilingualinformation about how to buy a home—perhaps the first program in the country tooffer such comprehensive education andcounseling. The initiative pairs participantswith real estate agents who speak Korean
Simply put,our industry often measuresthe wrong things. It’s using measuresfrom the stagnant,old banking industry to measure success in today’s dynamicfinancial services industry.

6
and offers mortgages that address income,cash and credit issues, and accepts non-traditional credit references so buyers canqualify without having to put up anymoney of their own.
• In Oregon and Washington we’ve createda team of bilingual, bicultural bankers toserve the needs of tens of thousands ofKorean-Americans who communicate intheir native language.
• In Greeley, Colorado, we’re presentingLatino homebuyers a one-stop shoppingpartnership service called Centro Financiero—mortgage, title, insurance, homebuilderand realtor, all under one roof.
• In addition to English—Spanish, Chineseand Hmong languages are available at 75 percent of our ATMs.
• To make it easier for visually-impairedcustomers to bank online, we now havespoken content on wellsfargo.com. One of our legally blind customers tells us that on-line banking that used to take her twohours now takes 15 minutes.
Acquisitions We’re always searching foracquisition opportunities that will enable usto satisfy all the financial needs of morecustomers and thus add value for them, theircommunities and our shareholders. In 2003,we acquired: • the $3.2 billion Pacific Northwest Bancorp,
adding 760 team members and 57 bankingstores in Washington and Oregon; and the$74 million Bank of Grand Junction,Colorado;
• 11 mutual funds from San Francisco-basedMontgomery Asset Management—adding$1.4 billion in assets to our $73 billion inmutual fund assets under management;
• Benson Associates, LLC, a Portland,Oregon-based asset-management company with $1.3 billion in equity assets under management;
• Trumbull Associates, LLC, a Connecticut-based manager for companies undergoingbankruptcy through the Chapter 11process; and
• the insurance business of Fireman’s FundAgriBusiness, which became part of Wells Fargo’s Rural Community InsuranceCompany, making us the nation’s largest crop insurance managing general agency.
Since the Norwest-Wells Fargo mergerfive years ago, we’ve acquired 22 banks
($43 billion in assets), 12 consumer financecompanies ($14 billion), 10 specializedlending companies ($5.5 billion), fourbroker-dealers, several mortgage servicingand loan portfolios, three trust companies,three asset management firms and threecommercial real estate firms. In the threeyears we’ve owned Acordia—the nation’slargest bank-owned insurance brokerage—it has acquired 17 insurance brokerages in13 states. Its annual premiums have grownto more than $6 billion.
To provide more operating capacity forfuture growth we continue to expand ourfacilities. In West Des Moines, Iowa, we’llbreak ground for a 900,000 square-footcampus building for Wells Fargo HomeMortgage and our Consumer Credit Group.In downtown Des Moines, we’re building a370,000 square-foot office building for our106-year-old consumer finance business,Wells Fargo Financial. In Minneapolis,we’ve invested $175 million to expand theformer Honeywell headquarters campusand more than double our capacity toemploy up to 4,300 workers there by nextyear. Since the Norwest-Wells Fargo mergerwe’ve added 3,500 jobs in Minnesota andincreased our employment in that state to17,500 team members, up 33 percent. In the Phoenix suburb of Chandler, we’veinvested $88 million to build a 400,000square foot campus building on 62 acres for more than 2,000 of our team memberswho live and work in metro Phoenix. Thecampus building ultimately could be more
than one million square feet and have roomfor 7,000 team members.
Product Packages We don’t believe inone-size-fits-all financial services becauseevery customer’s needs are different. In retailbanking, our new portfolio packages giveour bankers more flexibility to tailor thesepackages of products to our customers’needs. After our bankers determine a newcustomer’s needs, they offer a checkingaccount and other products such as asavings account, online banking, ATM andCheck Card, credit card, personal or homeequity loans, or mortgage, insurance andinvestment products. All our customersshould beWells Fargo Portfolio PackageSM
customers because they already have creditcards, loans and savings accounts elsewhere!We want to remind our customers howmuch they’re saving by buying productsin a package rather than à la carte.
Wholesale Banking Our biggestopportunity in Wholesale Banking is buildingeven broader and deeper relationships withour commercial and corporate customersacross the United States. We want them tothink of Wells Fargo for all their financialneeds including credit, treasury management,international, investment and insurance. Our electronic payment solutions — such as images of payables and remittanceadvices — help them streamline payments to suppliers and employees, reduce costs,increase payment predictability and improvecash control. We now process more thanone billion electronic deposit transactions

7
a year for commercial and corporatecustomers, up 39 percent since 2000.
More customers also are coming to usfor other electronic services such as internetand electronic messaging to help save them time and money. Our CommercialElectronic Office® (CEO®) portal gives themfaster, easier access to information they needto make payment and investment decisions.
Preserving Uniform National StandardsFour years ago, a new Federal law, theGramm-Leach-Bliley Act, broke down theDepression-era walls separating banking,securities and insurance companies. Thegoal: help consumers save more time andmoney through one-stop shopping forfinancial services. This historic lawacknowledged the use of technology toefficiently store, analyze and transferinformation about customers amongbusinesses within a company—so acompany can recognize its customers atevery point of contact and offer themgreater value, advice and convenience.Within the new law, however, was a seriousflaw—state governments could enact aconfusing patchwork of conflicting laws.This would prevent our customers frombeing able to bank easily and convenientlythroughout our banking states. It also wouldhave deprived them of the opportunity toreceive product offers that could save themsignificant time and money. Shopping for financial services, just like shopping for anyother product or service in this age of the
internet, should not have to stop at statelines. Conflicting state laws could lead togreater fraud losses and increased credit riskbecause lenders could make less informedunderwriting decisions.
We’re very pleased, therefore, thatCongress and the President have amendedand extended the Fair Credit Reporting Act(FCRA). This preserves our nationwidecredit system, the ability of a company toshare information among its family ofbusinesses and preempts inconsistent andconflicting state laws in this area. The newFCRA also contains powerful consumerprotection tools. They include allowingconsumers to place “fraud alerts” in theircredit reports to prevent identity theft, andallowing consumers to block informationfrom being given to a credit bureau andfrom being reported by a credit bureau ifsuch information results from identity theft.
Wells Fargo is proud to lead an industry-wide pilot to help victims of identity theftquickly regain control of their financialinformation and restore their credit ratings.In partnership with the Financial ServicesRoundtable, we’re providing coordinationand resources for the Identity TheftAssistance Center, expected to open in 2004.It will provide victims with a single point ofcontact to report identity theft and oneprocess to record victim information. This means victims will have to tell theirstory only once—to their primary financial institution.
Expensing Stock Options: Still a Bad IdeaLast year at this time I told you I thought itwas a bad idea, for many reasons, to requirecompanies to record stock options as anexpense that reduces net income. I said then,and I still believe, that it stands economicreality on its head to record a transaction—which increases or does not change thecapital of a corporation—as an expense.Stock options do, however, have aneconomic effect—if exercised they increasethe number of shares outstanding whichcauses earnings to be allocated over moreshares. Therefore, I believe that reportingdiluted earnings per share—which alreadyshows the dilution from “in-the-money”stock options—fairly states the possibleeconomic effect of stock option programs. I still believe stock options are non-cashcompensation that align the interests of thecompany’s management and team memberswith its owners. I still believe stock optionsactually increase the earnings available to allstockholders through increased productivity.I still believe that stock options are avaluable tool for start-up companies,especially technology companies, allowingthem to attract talent and create innovativeproducts that are the envy of the world.There still is no general agreement on howto properly value options because theirfuture value cannot be predicted accurately.
Proponents of expensing stock optionsargue that they’re an expense just likesalaries, cash bonuses, employee health andpension benefits, and other corporate
How we measure up: Wells Fargo’s compound annual growth rate vs. our peers*
Wells Fargo Total Shareholder Return
Revenue Diluted EPS 1 Wells Fargo S&P Bank Peers 2 Financial Peers 3 Retail Peers 4
15 years 12% 11% 22.93% 12.19% 16.45% 21.60% 23.31%
10 years 13 13 19.93 11.05 15.50 20.35 20.79
5 years 10 24 10.57 -0.57 2.63 9.78 5.30
(1) Excludes goodwill (2) average of Bank of America, J.P. Morgan Chase, Wachovia, US Bancorp, Fifth Third, Suntrust, PNC (3) average of Citigroup, AIG, Fannie Mae, American Express, Morgan Stanley, Merrill Lynch (4) average of Wal-Mart, Home Depot, Starbucks, Staples.
*The compound annual growth rate is based on each year’s previous balance including both the original amount and all appreciation from prior years. For example, if you invest $100 today and earn 5 percent in the first year and reinvest that $105 and then earn 8 percent in the second year, the compound annual growth rate is 6.489 percent.

8
expenses. Are they? All corporate expenseshave one thing in common. They reduce acorporation’s net worth. Stock options donot. They do not reduce a company’s networth when they’re exercised, they increaseit! Proponents of expensing options say theyshould be expensed when they’re granted,reducing net income and thus earnings pershare. But “in-the-money” stock options,and options that have been exercised,already reduce diluted earnings per share.Can you think of any other corporateexpense item that reduces diluted earningsper share twice? If stock options are anexpense, they’re certainly different from allother corporate expenses. So far, theFinancial Accounting Standards Board,which sets the nation’s accounting rules, has not been able to come up with aformula for accurately valuing options.Many believe that existing option valuationmethods are flawed. The San Jose MercuryNews, based in the Silicon Valley, said“Forcing companies to expense options,whose ultimate value will be subject to thewhims of the stock market, won’t makefinancial statements clearer, but rather, more arbitrary.” I agree. I support a bill,currently in Congress, that would impose a three-year moratorium on this question so a full study of the effect of the FASBproposal can be made.
2004: Cause for Economic Optimism As we begin 2004, a solid case can be madefor economic optimism. The U.S. has alleconomic levers operating at maximumcapacity. Consider that the United States has:• record low interest rates,• record low inflation,• record low inventories,• very high productivity, • a falling dollar that probably will go lower,
helping exports,• a recovering stock market (the S&P 500 at
year-end 2003 was up 43 percent from thelows of late 2002, and the NASDAQ wasup 80 percent),
• reasonably good retail sales,• considerable fiscal stimulus from tax cuts
and increased government spending, and • stabilized job losses.
Economies elsewhere in the world alsoare reviving. European economies aregrowing again. Even Japan, after a decade of
negative economic growth, looks healthier.Together, these economic initiatives are perhaps the most dramatic global assault oneconomic recovery since the great depression.There’s still risk and uncertainty out there—especially geopolitical risk—but we haveincredible stimulus in the pipeline for thefirst time in three years. That stimulus canbe denied only by non-economic forces suchas war and terrorism. A recent Wells Fargo/Gallup survey showed a significant increasein the number of small business owners whowere seeing higher revenues, cash flow,available credit, and capital spending. All thepieces are in place for a national recoverythat can create jobs and fuel continuedeconomic growth and prosperity.
The “Next Stage” In our financial servicesindustry, the long-term champions willcontinue to be those that understand andvalue their most important competitiveadvantage. It’s not technology. It’s notproducts. It’s not advertising. It’s not bricksor clicks. All those things are commodities,easily copied. The most importantcompetitive advantage is our people—ourdiverse team of 140,000 of the most talentedpeople who simply care more about theircustomers, communities and each other thanour competitors care about theirs.
That word “caring” is very important to us. At Wells Fargo, we say we don’t carehow much a person knows until we knowhow much they care: • Do we care enough to take the time to
really listen to customers? • Do we care enough to ask them the right
questions? • Do we care enough not to just push
products at them but to recommend the best products and advice for theirindividual needs?
• Do we care enough about all ourstakeholders to make sure that we’recomplying not only with the letter but alsothe spirit of all laws and regulations thatgovern our industry?
• Do we care enough to refer customers toour partners elsewhere in Wells Fargo sothey can benefit from the expertise andknowledge of our whole team?
• Do we care enough about our teammembers to make sure they’re maintaininga healthy balance between their work livesand their home lives?
• Do we care enough to create a workenvironment where it’s okay to have fun? If we don’t enjoy our work—if we don’t look forward to getting up in the morning and coming to work—thenwhat’s the point?
• Do we care enough about our communitiesto be leaders in providing our time, talentand resources to non-profit groups,including service on non-profit boards?
At Wells Fargo, the attitude of our teammembers is the single biggest influence onthe attitude of our customers. If our teammembers have integrity, are challenged, havethe best tools and training and are properlyrewarded and recognized for theirachievements, then they will be happy andsatisfied and chances are our customers willbe, too. We thank all 140,000 of our teammembers for their energy, their caring, theirprofessionalism, their passion for customerservice, and for providing outstandingfinancial advice to our customers. Anothergreat year by a truly great team! We thankour customers for entrusting more of theirbusiness to Wells Fargo. We thank ourcommunities—thousands of them acrossNorth America—for the privilege of helpingmake them better places to live and work.And we thank you, our owners, for yourconfidence in Wells Fargo as we begin our152nd year.
A special thank you this year toBenjamin F. Montoya, CEO of SmartSystems Technologies, Inc., Albuquerque,New Mexico, who will retire from ourBoard this April. Ben joined our Board in 1996. His service on the Audit andExamination and Finance Committees and his wise counsel, especially during theNorwest-Wells Fargo merger, have beeninvaluable. We wish Ben and his family all the best.
For our team members, customers,communities and stockholders—the “Next Stage”of financial success is justdown the road. It’s going to be a great ride!
Richard M. Kovacevich, Chairman and CEO

Revenue Growth
The 15 Most Important Measures
We believe revenue growth is the single-mostimportant measure of long-term success inthe financial services industry. Adjusted forrisk, it’s the most effective way to measurethe strength of a company’s customerrelationships, the value of financial adviceprovided, the quality of its customer service,the competitiveness of its products, itsneeds-based selling skills, and its ability to earn all of a customer’s business.
Revenue growth means customers arevoting with their pocketbooks. Customerswho rave about a company’s service will
give that company more of their business—which increases revenue. They’ll also refertheir family, friends and business associatesto that company. The key to the “bottomline” is actually the “top line.”
Over the past ten years, Wells Fargo hasgrown revenue at a 13 percent compoundannual rate. This year, even in a challengingeconomy, our revenue grew 12 percent.
Anita Behroozi, Regional Banking, Littleton, Colorado;Mary Chong, Regional Banking, San Francisco,California
1.
9
98 99 00 01 02 03
$17.3 18.920.7 21.0
25.228.4
Revenue (dollars in billions)
Compound Annual Growth Rate (CAGR):5 year: 10% 10 year: 13%

Earnings Per Share (diluted)
Earnings per share—or EPS—shows howprofitable a company is. It’s a company’s netincome minus dividends on preferred stock,divided by the average outstanding shares of a company’s stock. “Diluted” EPS includes allcommon stock equivalents (“in the money”stock options, warrants and rights, convertiblebonds and preferred stock). The past ten yearsWells Fargo’s diluted earnings per share grew at a compound annualized rate of 13 percent.
L to R: Phil Devan, Merchant Card, Des Moines, Iowa; Oscar Monteagudo, SBA, Los Angeles, California; Eric Harper, Acordia, Orange County, California
2.
1 0
98 99 00 01 02 03
$1.25
2.28 2.321.97*
3.32**3.65
Earnings Per Share (dollars)
Compound Annual Growth Rate:5 years: 24% 10 years: 13%
* includes venture capital impairment** before effect of change in accounting principle
related to adoption of FAS 142

1 1
This is the best way to measure howeffectively a company puts a stockholder’sinvestment in the company to work on the shareholder’s behalf. It’s the profit acompany generates in cents for every $1invested in the company. The past ten years the average ROE for our industry was 13.99 cents for every dollar ofstockholders’ equity. Wells Fargo’s ROE for that same period was 16.74 cents.
Margaret Schrand, Commercial Real Estate, San Francisco, California; Larry Fernandes, Institutional Investments, San Francisco, California
Return On Equity
3.
98 99 00 01 02 03
10.26
19.36
13.9515.23
*
**
Return on Equity (percent)
Wells Fargo Peers
* Includes venture capital impairment** Before effect of change in accounting principle related
to adoption of FAS 142

1 2
Customers entrust their assets to a financialservices company because they believe itcan help them achieve their long-termfinancial goals. The more effective thecompany is in a wide range of services—brokerage, custodian, record keeper, trustservices, tailored investment management—the more inclined customers are to trustthat company with even more of their assets.
Some investment companies, however,have violated their customers’ trust. Afterallegations of wrong-doing in the mutualfunds industry, for example, customers are even more careful when they selectcustodians and investment advisors.Wells Fargo Funds® works hard to protectthe interests of its customers. It has
longstanding policies and controls designedto discourage, limit and prevent late tradingand market timing. Wells Fargo Funds closelymonitors investor activity. It reviews allcustomer transactions to prevent and deter potential trading abuses. Simply put, Wells Fargo does not tolerate any tradingthat enables some customers to profit at, or be perceived as profiting at, the expenseof other customers.
At year-end 2003, customers entrustedWells Fargo to manage or administer$654 billion of their assets, up 13 percentfrom the previous year.
Helen Hitomi, Private Banking, San Francisco,California; Michelle Trujillo, Institutional Investments,Denver, Colorado
4.
Assets Managed, Administered

A successful financial services companymanages risk effectively by understandingits customers and diversifying its risk acrossgeographies, loan size and industries.Our credit quality is strong because of ourrelationship focus (there’s a lot more to acustomer relationship than just a loan). Wedecentralize credit accountability becauseour bankers know their communities andtheir customers better than anyone else.
Our bankers also are responsible for theprofitability of the entire relationship.Our audit and loan review teams, usingsophisticated analysis tools, review creditdecisions and processes to ensure bankersare adhering to our credit policies andprocedures. We prudently manage everyaspect of risk including asset quality,
capital levels, and our allowance (or reserve) for loan losses. Our allowancecontinued to provide over two timescoverage on nonperforming assets andannual loan losses.
At year-end 2003 about two-thirds of our loans were secured by real estate;another 20 percent by other collateral such as automobiles, or were backed bygovernment guarantees such as studentloans—almost double five years ago.
L to R: Jorge Guerrero, Credit Administration, Phoenix, Arizona; Candice Lau, Credit Administration,San Francisco, California; Tom Traylor, CreditAdministration, San Antonio, Texas
5.
Credit Quality
1 3
98 99 00 01 02 03
.79.71
.86
1.08
.88
98 99 00 01 02 03
362 366
274
206226 234
.66
Nonperforming Assets(NPAs)/Total Loans (percent)
5 year industry average: .92%
Allowance for Loan Losses/NPAs(percent)
5 year industry average: 195%
Nonperforming assets: borrower has defaulted or isseriously delinquent and thus not producing reliableincome for the lender.

6.Credit Agency Ratings
Outside agencies—such as Moody’s, S&P andFitch—rate companies based on their financialstrength and risk that they will not be able tomeet their debt obligations. The higher acompany’s credit rating the lower its interestcosts are when it has to borrow money. Thisyear, Wells Fargo Bank became the only U.S.bank to be rated “Aaa” by Moody’s InvestorServices — the highest rating possible and the first time Moody’s had rated any U.S. bank“Aaa” since 1995.
The “Aaa” reflects our strong financial position,diversified business model, disciplined riskmanagement, strong credit quality, strongservice and sales culture, and consistentfinancial performance regardless of theeconomic cycle. Moody’s cited Wells Fargo’s“good corporate governance” and said it“believes that these attributes should lead to the continuation of a stable and predictableearnings and risk profile.”
Of the top 100 S&P 500 companies the past five years, only eight companies including Wells Fargo have achieved a compound growth rate of at least 13 percent in earnings, ten percent in revenue and ROE of 19 percentand were rated A3 or higher by Moody’s.
Heidi Dzieweczynski, Jody Wagner, Treasury, Minneapolis, Minnesota
Number of S&Pcompanies with
Moody’s higher rating
Wells Fargo Bank, N.A.
Issuer Aaa NoneLong-term Deposits Aaa NoneFinancial Strength A None
Wells Fargo & Company
Subordinated Debt Aa2 OneIssuer Aa1 EightSenior Debt Aa1 Eight
14

This measure doesn’t begin with “sales” northe “banker.” It begins with customers.How can we help them be financiallysuccessful? What are their financial goals?What products or services do they need to achieve their goals?
To uncover those needs, we have to haveenough bankers to serve customers when,where and how they want to be served.And, our bankers need the training, theresources, the experience and the productknowledge to engage in a meaningful,directed conversation that can helpcustomers achieve their financial goals.We call this “needs-based selling.”
So, product sales per banker per day—withother measures such as profit per day andpartner referrals—is a very importantmeasure of how effective and efficient weare in taking advantage of the sales andservice opportunities that our ten millionbanking households bring us every day.
Josephina Shipley, Regional Banking, Perris, California;Ashif Lalani, Wells Fargo Services Company, Tempe, Arizona
99 00 01 02 03
3.5 3.6 4.04.3
4.7
Product Sales Per Banker Per Day
Product Sales Per Banker Per Day
7.
1 5

1 6
8.
We define a core product as one thatcustomers value so much that they’re morelikely to buy more products from that samecompany than from competitors. We believethere are four core products in financialservices: checking, mortgage, investmentsand insurance.
As a financial services company, much morethan a bank, Wells Fargo provides a customerwith all four of these core products plusmany more. The number of products percustomer is an important measure of how
satisfied that customer is and how profitablethat customer’s relationship is to thecompany. The more products customershave with a company, the better deal theyshould get, the more loyal they are, thelonger they stay with that company.
Loyal, more satisfied customers give theirfinancial institution more opportunities tomeet more of their financial needs. Themore the company knows about thoseneeds the more opportunities it has to givebetter financial advice. When the customer
is well-served, the higher the profit for thecompany. Eighty percent of our growthcomes from selling more products toexisting customers.
L to R: Cheryl Houk, Regional Banking, Sioux Falls,South Dakota; Pam Miller, Business Banker, WheatRidge, Colorado; Jason Paulnock, Corporate Banking,Minneapolis, Minnesota; Brent Williams, CommercialBanking, Oakland, California
Core Product Relationships
Products Per Banking CustomerGoal: 8
Commercial/Corporate Retail
98 99 00 01 02 03
3.2
4.6
98 99 00 01 02 03
80.483.683.083.3
79.4
5.04.3
85.0
Community Banking Customers with Checking Accounts (percent)

17
99 00 01 02 03
9.5
00 01 02 03
11.0
16.213.2
10.8
98 99 00 01 02 03
3.64.0 4.1
4.9 4.8
12.614.8
18.9 18.0 4.8
Homeowner-Customers with Home Equity Products (percent)
Community Banking Customers with Investment Products (percent)
Homeowner-Customers withMortgage Products (percent)
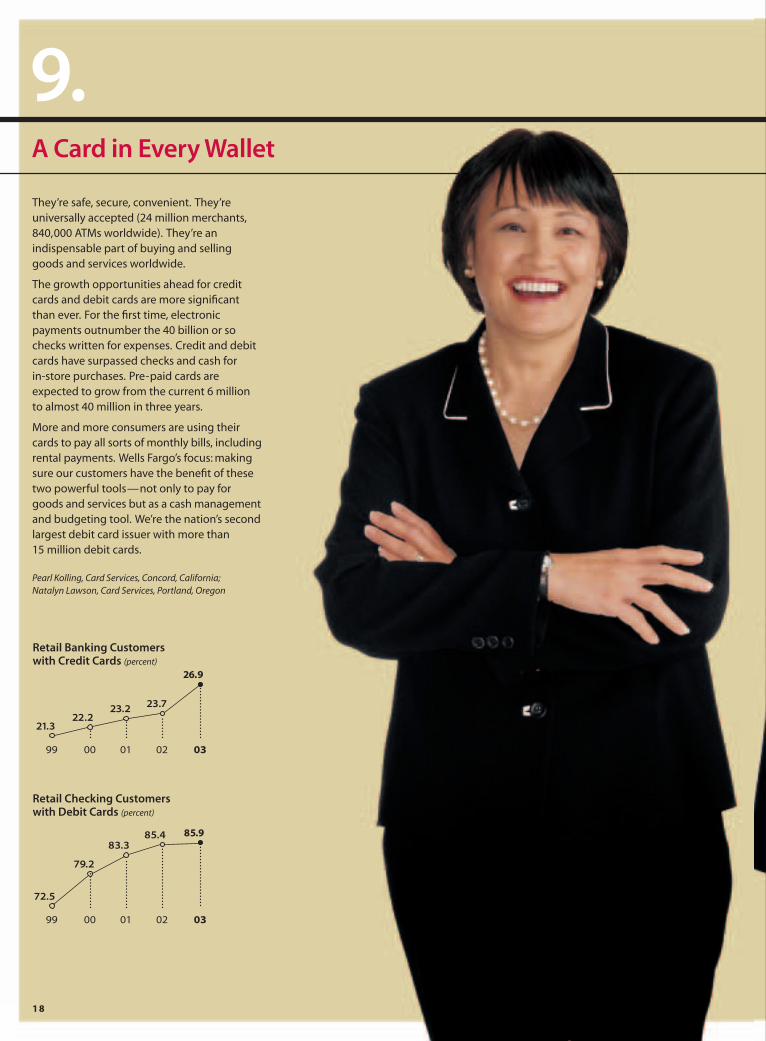
A Card in Every Wallet
They’re safe, secure, convenient. They’reuniversally accepted (24 million merchants,840,000 ATMs worldwide). They’re anindispensable part of buying and sellinggoods and services worldwide.
The growth opportunities ahead for creditcards and debit cards are more significantthan ever. For the first time, electronicpayments outnumber the 40 billion or sochecks written for expenses. Credit and debitcards have surpassed checks and cash for in-store purchases. Pre-paid cards areexpected to grow from the current 6 million to almost 40 million in three years.
More and more consumers are using theircards to pay all sorts of monthly bills, includingrental payments. Wells Fargo’s focus: makingsure our customers have the benefit of thesetwo powerful tools—not only to pay forgoods and services but as a cash managementand budgeting tool. We’re the nation’s secondlargest debit card issuer with more than 15 million debit cards.
Pearl Kolling, Card Services, Concord, California; Natalyn Lawson, Card Services, Portland, Oregon
9.
1 8
Retail Banking Customers with Credit Cards (percent)
Retail Checking Customers with Debit Cards (percent)
99 00 01 02 03
21.3
26.9
23.723.222.2
99 00 01 02 03
72.5
85.985.4 83.3
79.2

Active Online Customers
In just a few years, the internet hastransformed financial services and the waywe serve our customers. Consider this:
• Forty-three percent of our checkingaccounts are now online. (1998: 6.4 percent)
• It took us four years to get our first millionconsumers online but in just the last fouryears we attracted four million more newcustomers; we surpassed five millioncustomers in February 2004.
• At year-end 2003, we had 1.5 million billpay/presentment customers. During 2003we enrolled nearly 700,000 depositaccounts for online statements.
• Our sales of products and services to ourcustomers via the internet rose 100 percentin 2003.
• Revenue related to the internet in 2003from our commercial and corporatecustomers rose 53 percent ($5.9 trillion
worth of transactions processed through
our Commercial Electronic Office,).
• We processed nearly $12 billion in internet
payments for 60,000 online merchants in
2003, double the previous year.
We’ve achieved this phenomenal growth
because we’ve never viewed the internet as
a separate business model but as a part of
our integrated “when, where and how”
customer choice strategy. Our customers
can move from one channel to another—
stores, ATMs, telephone banking, internet,
direct mail— depending on their needs.
It’s efficient, convenient and seamless,
helps us keep customers longer and earn
all their financial services business.
Jeff McDonald, Online Customer Service, Salt Lake City,
Utah; Evelyn Dubon, Internet Services, San Francisco,
California
10.
Online Banking Customers
Consumers (millions)
Compound Annual Growth Rate: 53%
Small Business (thousands)
Compound Annual Growth Rate: 75%
Commercial/Corporate (thousands)
98 99 00 01 02 03
0.6 1.21.9
2.83.6
98 99 00 01 02 03
25 32 62
200297
4.8
415
01 02 03
8.313
17.1

What’s the best way to tell if customers are happy and satisfied with a company’sproducts or services? Just look at the peoplewho serve them.
At Wells Fargo we believe our 140,000 teammembers are the single biggest influenceon our customers. If our team membershave a great attitude, feel as if they owntheir business, are accountable for results,are given the tools and training to get thejob done, are recognized and rewarded fortheir accomplishments, and can have fun atwork, then chances are —surprise — theircustomers will be happy and satisfied too.We like to think that every one of our team
members is a CEO — a chief engagementofficer. If our people are engaged in theirwork they’ll be engaged with the customers.We believe there’s a direct link betweenteam member performance, customersatisfaction and loyalty, and growth inrevenue, market share, net income and stock price. In other words, when peoplegrow, profits grow! We survey all our teammembers every two years to find out howthey think their company is doing and howwe can do even better.
Lane Ceric, Human Resources, San Francisco, California;James Smith, District Manager, Wells Fargo Financial,Clinton, Maryland
Team Member Engagement
11.Percent of Wells Fargo team memberswho say they like their work
2000 ..............84%2002 ..............89%
Percent who say they know how theirwork helps Wells Fargo
2000 ..............84%2002 ..............88%
2 0

Customer Access Options
12.Very few, if any, customers use just stores or ATMs or phone banks or the internet ordirect mail to access their money, maketransactions or get information about theiraccounts. They use all those channelsdepending on where they are and what theyneed. So, we offer our customers choices.We integrate all our channels into what wecall a “distribution community”—all of theinformation about a customer’s accounts is available to that customer in real time, any time, 24x 7.
L to R: Ruby Garcia, Banker Connection, Wells FargoServices Company, Fargo, North Dakota; Bernice Ross-Robertson, Phone Bank Sales, Wells Fargo ServicesCompany, Lubbock, Texas; Sheri Elbert, Store Design,Distribution Strategies, San Francisco, California 21
ATMs Phone Banking (calls per year, millions)
Stores Online Banking (sessions per year, millions)
99 00 01 02 03 99 00 01 02 03
219
250247
237
220
99 00 01 02 03
101170
214284
418
99 00 01 02 03
5,900
6,2106,164 6,202
6,451 6,352
5,3105,400 5,400
5,600
Market Share
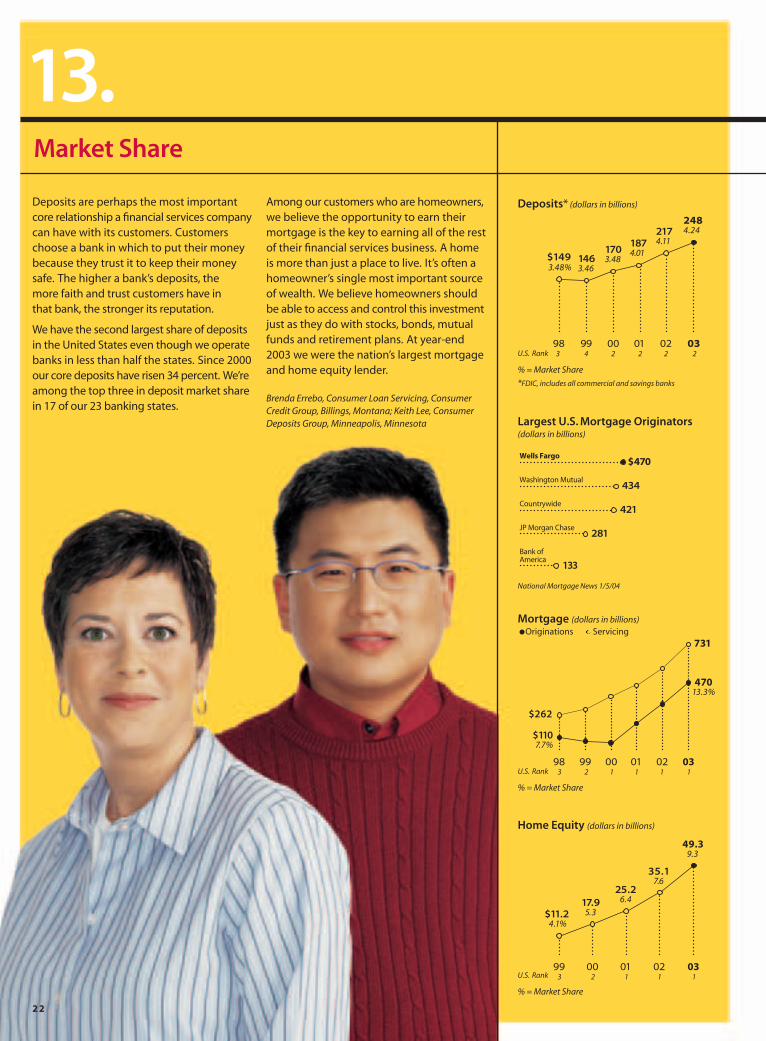
13.Deposits are perhaps the most importantcore relationship a financial services companycan have with its customers. Customerschoose a bank in which to put their moneybecause they trust it to keep their moneysafe. The higher a bank’s deposits, the more faith and trust customers have in that bank, the stronger its reputation.
We have the second largest share of depositsin the United States even though we operatebanks in less than half the states. Since 2000our core deposits have risen 34 percent. We’reamong the top three in deposit market sharein 17 of our 23 banking states.
Among our customers who are homeowners,we believe the opportunity to earn theirmortgage is the key to earning all of the restof their financial services business. A homeis more than just a place to live. It’s often ahomeowner’s single most important sourceof wealth. We believe homeowners shouldbe able to access and control this investmentjust as they do with stocks, bonds, mutualfunds and retirement plans. At year-end2003 we were the nation’s largest mortgageand home equity lender.
Brenda Errebo, Consumer Loan Servicing, ConsumerCredit Group, Billings, Montana; Keith Lee, ConsumerDeposits Group, Minneapolis, Minnesota
2 2
Deposits* (dollars in billions)
U.S. Rank
% = Market Share
*FDIC, includes all commercial and savings banks
Largest U.S. Mortgage Originators(dollars in billions)
National Mortgage News 1/5/04
Mortgage (dollars in billions)Originations Servicing
U.S. Rank
% = Market Share
Home Equity (dollars in billions)
U.S. Rank
% = Market Share
98 99 00 01 02 03 3 2 1 1 1 1
$1107.7%
731
47013.3%
99 00 01 02 03 3 2 1 1 1
$11.2 4.1%
17.95.3
25.26.4
35.17.6
49.39.3
$262
$470
434
281
421
133
Wells Fargo
Washington Mutual
Countrywide
JP Morgan Chase
Bank ofAmerica
98 99 00 01 02 03 3 4 2 2 2 2
$149 3.48%
1463.46
1874.01
2174.11
2484.24
1703.48

2 3
Market Value
14.Fortune 100 Rank by Market Cap(billions as of 12/26/03, Wells Fargo 12/30/03)
Fortune rankCompany Market Value (revenue)
1. General Electric * $308.5 5
2. Microsoft * 294.2 47
3. Pfizer 265.2 37
4. Exxon Mobil * 264.7 3
5. Citigroup * 246.9 6
6. Wal-Mart Stores * 227.3 1
7. Intel * 204.8 58
8. AIG 168.8 9
9. Cisco Systems 164.0 95
10. IBM * 159.8 8
11. Johnson & Johnson * 150.3 34
12. Procter & Gamble * 127.4 31
13. Coca-Cola * 122.5 92
14. Bank of America Corp 118.3 23
15. Altria Group * 109.0 11
16. Berkshire Hathaway 106.7 28
17. Merck * 100.4 17
18.WELLS FARGO 100.0 46
19. Verizon Communications 93.6 10
20. ChevronTexaco 89.6 7
* Dow Jones industrial average component
On the surface, the market value of acompany’s stock is simply the total dollarvalue of its outstanding shares—the numberof shares times the current market price.But it’s more than that—it’s a dollar measureof what investors believe is a company’sfuture value, based on its ability toconsistently generate revenue and profits—not what it’s achieved in the past, but
what investors believe it can do in the future. Only two other “banks” in the U.S.—and only three in the world—have totalmarket value larger than Wells Fargo. Onlyabout 20 other Fortune 100 companies nowrank ahead of Wells Fargo in the marketvalue of their stock including only threecompanies in the diversified financial servicesindustry. The market value of Wells Fargo
stock has increased 46 percent in just thepast four years. It’s higher than more thanhalf the companies that make up the DowJones average of 30 industrials and higherthan more than 30 of the companies thatrank ahead of us in the Fortune 100.
Nancy Evans Zytko, Real Estate Merchant Banking, Los Angeles, California; Justin Chew, Real EstateMerchant Banking, San Francisco, California
Wells Fargo Stock Price (year end in dollars)
Wells Fargo Market Value (dollars in billions)
12/30/03 record closing high: $58.94 2003 total return: 29.5%
99 00 01 02 03
$40.44
58.89 (12/31/03)55.69
43.4746.87
99 00 01 02 03
$69
100
7974
95

Measuring Success in Community Involvement
Financial Literacy How do we measure thesuccess of our community involvement?Certainly in quantity: the dollars wecontribute, the hours our team membersvolunteer, the number of communities wehelp. We also, however, measure it in quality.We deliver maximum benefit to ourcommunities by focusing on the businesswe know best: providing superior diversifiedfinancial services and expert financial advice.So, when we use our resources to promotefinancial literacy and education, especiallyfor low income families and immigrants,everyone wins.
2,113 Student Savers According toJumpStart Coalition, fewer than 30 percentof U.S. students receive as much as oneweek’s worth of course work in moneymanagement or personal finance. Teammembers in Nebraska are trying to changethat through their four-year participation inNational Teach Children to Save Day. Thisyear 140 team members spoke with 2,113elementary students about the importanceof saving money, how to budget and how to know the difference between “wants”and “needs.” Cornelius Star (below) fromOmaha’s Conestoga Magnet Schoolparticipated in workshops to develop hisbasic financial skills. Wells Fargo set up a
“school bank” on campus and acceptsdeposits every Tuesday. Sixth graders serveas tellers as their classmates put their extraallowance into their saving accounts.
90 Immigrants Informed Low-incomeChinese immigrants often arrive in San Francisco with little understanding of the U.S. banking system. Partnering withthe Charity Cultural Service Center (CCSC), Wells Fargo team members such as RonaldCheng (p. 25) are teaching basic financialliteracy skills to Chinese adults and highschool students. The seminars are conductedin Mandarin and Cantonese in San Francisco’sChinatown. “The workshops have been so
15.
2 4

Financial Literacy
successful that we’ve asked Wells Fargo tohold small business and first-time homebuyerseminars,” said CCSC director Doris Mei(below, center). As a result of the workshops,dozens of new accounts have been openedat Wells Fargo’s store in Chinatown.
1,000 Questions Answered Without financialliteracy programs, too many importantquestions go unanswered. Team membersin Reno, Nevada partnered with a Spanish-speaking television station, Azteca America,to host Linea de Ayuda (“Help Line”), a call-inshow. During each of the five shows, ten tofifteen Spanish-speaking Wells Fargo teammembers answered questions about checking
and saving accounts, business banking, homemortgages and more. “We took nearly 200calls each show,” said Maria Arias (below,right), Wells Fargo community developmentofficer and co-host of the shows. “One callereven made a point to thank Wells Fargo foraddressing the financial needs of the localHispanic community.” More than 300,000Mexican nationals have opened accounts atWells Fargo using the Mexican government’sidentification card, the matricula, as a secondform of identification. Linea de Ayuda is oneof hundreds of financial literacy efforts aimedat ensuring new customers and the entireHispanic community obtain all the benefitsfinancial services offer.
70%U.S. students who get less than oneweek of course work in moneymanagement or personal finance
90%U.S. high school students whograduate without knowing basics ofbanking and money management
12 millionU.S. households with no relationshipwith traditional financial servicesprovider
2 5

Affordable Housing Wells Fargo is thenation’s #1 mortgage lender to homebuyerswho are low-income or ethnically diverse.We measure success by the number ofmortgage originations we make ormortgages we service, but real success iswhen first time homebuyers who didn’tthink they could ever own a home finallytake the keys and open the front door oftheir first home. Through partnerships withorganizations such as Habitat for Humanityand the Neighborhood ReinvestmentCorporation, the Wells Fargo Foundationand the Wells Fargo Housing Foundationhave contributed dollars—and volunteer
hours—to help make the dream of home-ownership a reality for first-time homebuyers.
740,000 Opportunities To increase home-ownership and strengthen Native Americancommunities, the Wells Fargo HousingFoundation contributed $740,000 to theNeighborWorks® Training Institute. It offerscourses to help community developmentleaders fully use resources for housing and other development projects in Indiancountry. The Navajo Partnership for Housing(NPH), a member of the NeighborWorksnetwork, uses the information through theTraining Institute to increase homeownership
opportunities for the Navajo Nation. TwoWells Fargo team members, husband andwife Freddie and Jennifer Hatathlie (below)have been involved with NPH since itsfounding, both as board members. Thanksto their involvement, Wells Fargo’s relation-ship with NPH flourished over the yearsleading to a Focus Community Challengegrant in 2000 and a $10,000 grant from theWells Fargo Housing Foundation in 2003.
3.19 Million Volunteer Hours “It’s hard toknow,” says Stephen Seidel of Twin CitiesHabitat for Humanity, “where Wells Fargoends and where Habitat begins.” Throughout
2 6

Wells Fargo’s ten-year partnership withHabitat, 91,000 Wells Fargo volunteers havecontributed 3.19 million volunteer hours tobuild or renovate 1,304 Habitat homes. Thisyear in the Twin Cities, 700 team membersbuilt two homes in East St. Paul, and in early2004 Mohammed Duale and his family(below, center) moved into one of thosenew Habitat homes.
100,000 Home-Saving Repairs In acommunity where winters can be severe, abroken furnace can lead to homelessness orworse for families who can’t pay for criticalrepairs. The Wells Fargo Housing Foundation
awarded Salt Lake City with a $100,000 Focus Community Challenge Grant, dividedbetween LifeCare Bank and the CommunityDevelopment Corporation of Utah, twonon-profits that address these urgent needsfor low-income seniors and people withdisabilities. Thanks to the grant from WellsFargo, LifeCare Bank made plumbing repairsand added ramps and rails to the entranceof Pearl Lindsay’s (below, right) home.
Affordable Housing
1,304Habitat homes built, renovated byWells Fargo volunteers past 10 years
3,194,800 Hours Wells Fargo volunteers spentbuilding, renovating Habitat homes
$32 millionContributed to affordable housinginitiatives by Wells Fargo Foundation,Wells Fargo Housing Foundation past10 years
2 7

2 8
Education
• Great Falls, Montana – 275 students atLongfellow Elementary School (which hashigh child-poverty levels and low readingscores) have improved their reading skillsthanks in part to Wells Fargo volunteersand Wells Fargo Volunteer Service Awardgrants. Wells Fargo team members readtwice a month to fourth and fifth graders.Average reading scores: up substantially.
• Farmington, New Mexico – $359,000 in 14years for student scholarships. Wells Fargosupports San Juan College, serving manyfirst-generation college students, throughthe Wells Fargo Scholarship Scramble GolfTournament. The tournament committeeincludes Wells Fargo team members.
• Dallas,Texas – Two pallets of schoolsupplies to 900 students. Wells Fargo teammembers donated and delivered twopallets of school supplies to ObadiahKnight Elementary School.
• Nevada – $100,000 in grants to theUniversity of Nevada for scholarships tolow-to-moderate income students whoare the first in their family to enter college.In return, scholarship winners mustcontribute at least ten hours ofcommunity service a month.
Human Services
• Alaska – $120,000 to women’s servicesand shelters. Wells Fargo partnered withtwo non-profits, Abused Women’s Aid inCrisis and Standing Together AgainstRape. Wells Fargo also provided a grant tothe State of Alaska Council on DomesticViolence and Sexual Assault.
• Boise, Idaho – 53 outings in the last fiveyears by Wells Fargo team members.Through Boise’s Neighborhood HousingServices, volunteers from across the cityrake yards of the elderly or disabled. Sincethe program began in 1986, 70,000volunteers have raked 9,000 yards.
• Minneapolis, Minnesota – Eight yearsboard participation and $22,000. Teammember Doug Murray of Wells FargoInstitutional Trust is on the board ofPartnership Resources, Inc., providingservices for adults with developmentaldisabilities. With a Wells Fargo grant, theorganization started a for-profit endeavorwhich turns artwork of people withdisabilities into greeting cards.
• Brookeville, Maryland – 63 team membersand eight home improvement projects.Team members from Corporate Trustspent a day with Our House Youth Home,a residential job-training center for at-riskadolescents. Team members built newshelves in the food pantry and a brickwalkway between buildings; reclaimedplots for vegetable gardens.
• Los Angeles, California – $40,000 in threeyears. The Challengers Boys & Girls Clubhas served 32,000 boys and girls in theSouth Los Angeles community providinga safe place to play, grow and learn. WellsFargo supported Challengers Boys & GirlsClub; two team members—Eric Holomanand Robert McFadden—serve on theorganization’s board of directors.
A few of the thousands of ways we measure community success
$83 million Contributed by Wells Fargo to nonprofits
$17millionContributed by team members to UnitedWay and Community Support campaigns
14,000 Nonprofits receiving Wells Fargo grants
$1.6 million Wells Fargo contributions per week
Corporate America’s Top 10 largest givers, 2002(dollars in millions)
1. Wal-Mart Stores $136
2. Altria Group 113
3. Ford Motor 113
4. Exxon Mobil 97
5. Target 96
6. J.P. Morgan Chase 93
7. Johnson & Johnson 84
8. WELLS FARGO 829. Bank of America 81
10. Citigroup 78
Sources: Forbes magazine,The Chronicle of Philanthropy
Wells Fargo Contributions (millions)
Financial Contributions
00 01 02 03
$62 66
82 83

2 9
• Louisville, Kentucky – 10 years of service. Team member Ken Hohman ofWells Fargo’s Bryan, Pendleton, Swats &McAllister (BPS&M) group volunteers at the Wayside Christian Mission, anorganization providing temporary housingand meals to the poor and homeless. Overthe years other team members, includingRob Gutmann, have joined Wayside’sefforts. Both Rob and Ken are pastmembers of the organization’s board.
• Ogden, Utah – A decade of support.Wells Fargo donated $25,000 to Ogden’sYour Community Connection, the 10thconsecutive year of contributing to the organization, which providescomprehensive service to support the quality of life for women, children and families.
• Seattle, Washington – $140,000 to help1,000 families. For the past three years,Wells Fargo has supported the RonaldMcDonald House Charities of WesternWashington, sponsoring an annualauction which raised funds to helpincrease the number of families served a year from 180 to 1,000.
• San Diego, California – $7,000 in five years. Team member Ann McCarthy andWells Fargo’s Volunteer Service Awardgrant and Community Partners programsupport Fresh Start Surgical Gifts whichprovide reconstructive surgery fordisadvantaged children with physicaldisfigurements.
• Phoenix, Arizona – 350 team membersraised $20,000. For twenty years Wells Fargohas supported the American CancerSociety’s annual Climb to Conquer Cancer.In 2003, 350 team members made thetrek, raising $20,000 for the fight againstcancer. Since 1996, Wells Fargo and itsteam of Phoenix climbers have raised$300,000 for this cause.
Community Development
• Southern California – $500,000 over fiveyears to about 500 non-profit organizations.Wells Fargo’s Community Partners programhelps non-profits improve the quality oflife in thousands of communities. Localteam members identify and nominatelocal organizations and present $1,000grants to their Community Partners.
• Oakland, California – $15,000 for affordablehousing programs. The African-AmericanConstruction Workers Association (AACWA)provides homebuyer education, creditrepair, and affordable housing for low-and moderate-income families. WellsFargo Home Mortgage consultantspresented several first-time homebuyereducation workshops to hundreds ofmembers of this organization, helpingmany families buy their first home.
• Salt Lake City, Utah – $1.7 million financingplan. Wells Fargo Business Bankingdeveloped a financing plan so the FourthStreet Clinic could buy the building whereit provides health services to the homelessand to low-income individuals who lackhealth insurance. Without the financing,the Clinic would have lost its lease.
• South Dakota – $500,000 for the SiouxEmpire Housing Partnership and its LaceyPark I, II and III housing developments.Through the most recent development, 16 new homes are now available to low- to moderate-income families, bringing the project’s total number of homes to 56.Wells Fargo team members also will plantthe trees in the development.
• North Dakota – $140,000 to help 100 low- and moderate-income families.Wells Fargo’s contribution to the Lewis and Clark CommunityWorks DREAM Fundis the largest of any financial institution in the state. Combined with othercontributions, the Fund provides morethan $1 million for home financing.
• Victoria, Texas – $150,000 since 1997 to Habitat for Humanity. Wells Fargovolunteers participated in the FourthAnnual All-Women Build, a Habitat housebuilt entirely by women. Wells Fargo hashelped fund 12 of the 43 houses built byHabitat for Humanity, Victoria.
• Midland,Texas – 15 new or expandedbusinesses and six new homeowners.Wells Fargo has supported the MidlandCommunity Development Corporation the last three years through grants to itsmicro-lending program, provides low-interest line of credit for affordable housingfor low- to moderate-income families.
Arts
• Des Moines, Iowa – 5,500 square feet and$100,000. Wells Fargo Financial donated$100,000 and 5,500 square feet of first-floor office space to the Des Moines ArtCenter to house a downtown branch ofthe museum. The Art Center will be openevery business day, free of charge.
• Vail, Colorado – $15,000 to promote thearts to students. The Bravo! Vail ValleyMusic Festival promotes arts educationand cultural literacy, helping teachersenhance music programs and offering freestudent concerts, scholarships to youngmusicians and after-school programs.

3 0
• Community Banking . . . . . . . . . . . . . . .36%
• Investments & Insurance . . . . . . . . . . .14%
• Home Mortgage/Home Equity . . . . .19%
• Specialized Lending . . . . . . . . . . . . . . . .13%
Wells Fargo competes in virtually everysegment of the financial services industry and we’re market leaders in most of them.
• Wholesale Banking . . . . . . . . . . . . . . . . . .8%
• Consumer Finance . . . . . . . . . . . . . . . . . .6%
• Commercial Real Estate . . . . . . . . . . . . .4%
Wells Fargo Financial The store network of Wells Fargo Financial (consumer finance)stretches from Saipan in the Pacific throughCanada, across the USA, and into the Caribbean.
Wells Fargo Banks One of the USA’s mostextensive banking franchises, from Van Wert,Ohio to Bethel, Alaska, includes 12 of thenation’s 20 fastest growing states.
Wells Fargo Home Mortgage Through itsstores and its presence in our banking stores,Wells Fargo Home Mortgage is the USA’slargest originator of home mortgages andhas the most extensive franchise.
Committees 1 Audit and Examination2 Credit 3 Finance 4 Governance and Nominating 5 Human Resources
Board of Directors
J.A. Blanchard III 1,2,4
Chairman of the Board,
ADC Telecommunications, Inc.
Eden Prairie, Minnesota
(Communications equipment, services)
Susan E. Engel 2,3,5
Chairwoman, CEO
Department 56, Inc.
Eden Prairie, Minnesota
(Specialty retailer)
Enrique Hernandez, Jr. 1,3
Chairman, CEO
Inter-Con Security Systems, Inc.
Pasadena, California
(Security services)
Robert L. Joss 2,3
Philip H. Knight Professor and Dean
Stanford U. Graduate School of Business
Palo Alto, California
(Higher education)
Reatha Clark King 1,3
Former President, Board Chair
General Mills Foundation
Minneapolis, Minnesota
(Corporate foundation)
Richard M. Kovacevich
Chairman, President, CEO
Wells Fargo & Company
San Francisco, California
Richard D. McCormick 3,5
Chairman Emeritus
US WEST, Inc.
Denver, Colorado
(Communications)
Cynthia H. Milligan 1,4
Dean, College of Business Administration
University of Nebraska – Lincoln
(Higher education)
Benjamin F. Montoya 1,3
CEO
Smart Systems Technologies, Inc.
Albuquerque, New Mexico
(Home automation systems)
Philip J. Quigley 1,2,4
Retired Chairman, President, CEO
Pacific Telesis Group
San Francisco, California
(Telecommunications)
Donald B. Rice 4,5
Chairman, President, CEO
Agensys, Inc.
Santa Monica, California
(Biotechnology)
Judith M. Runstad 1,3
Of Counsel
Foster Pepper & Shefelman PLLC
Seattle, Washington
(Law firm)
Stephen W. Sanger 3,5
Chairman, CEO
General Mills, Inc.
Minneapolis, Minnesota
(Packaged foods)
Susan G. Swenson 1,2,4
Chief Operating Officer
T-Mobile USA, Inc.
Bellevue, Washington
(Wireless communications)
Michael W. Wright 2,4,5
Retired Chairman, CEO
SUPERVALU INC.
Eden Prairie, Minnesota
(Food distribution, retailing)
Based on historical averages and near future yearearnings expectations

3 1
Measuring the Success of the Norwest-Wells Fargo Merger
Executive Officers and Corporate Staff
1998 2003
Revenue $17.3 billion $28.4 billion +64%
Net income $2.2 billion $6.2 billion +182%
Mortgage originations $109 billion $470 billion +331%
Mortgage servicing $245 billion $731 billion +198%
National mortgage market share 7.7 % 13.3% +73%
Active internet customers 585,000 4.9 million +738%
Wholesale Bankingnet income $780 million $1.4 billion +79%
Team members 102,000 140,000 +37%
Market value $66 billion $100 billion +52%
Howard I. Atkins, EVP, Chief Financial Officer *
Patricia R. Callahan, EVP, Human Resources *
C. Webb Edwards, EVP, Technology and Operations *
Saturnino S. Fanlo, SVP, Treasurer
John E. Ganoe, EVP, Corporate Development
Lawrence P. Haeg, EVP, Corporate Communications
Laurel A. Holschuh, SVP, Corporate Secretary
David A. Hoyt, Group EVP, Wholesale Banking *
Richard M. Kovacevich, Chairman, President, CEO *
Richard D. Levy, SVP, Controller *
Kevin McCabe, EVP, Chief Auditor
David J. Munio, EVP, Chief Credit Officer *
Mark C. Oman, Group EVP, Home and Consumer Finance Group *
Eric D. Shand, Chief Loan Examiner
Robert S. Strickland, SVP, Investor Relations
James M. Strother, EVP, General Counsel, Government Relations *
John G. Stumpf, Group EVP, Community Banking *
Carrie L. Tolstedt, Group EVP, Regional Banking *
* “Executive officers”designated according to Securities and Exchange Commission rules

3 2
COMMUNITY BANKINGGroup Head
John G. Stumpf
Regional Banking
Carrie L. Tolstedt
Regional Presidents
Jon A. Campbell, Minnesota, North Dakota,South Dakota, Illinois, Indiana, Michigan,Wisconsin, Ohio
Marilyn J. Dahl, Metro Minnesota
Kirk E. Dean, North Dakota
Norbert D. Harrington, Greater Minnesota
J. Lanier Little, Illinois, Michigan,Wisconsin
Carl A. Miller, Jr., Indiana, Ohio
Daniel P. Murphy, South Dakota
Chip Carlisle, Texas Metro
William R. Goertz, Greater Texas, New Mexico
Larry D. Willard, New Mexico
Thomas W. Honig, Colorado, Montana, Utah,Wyoming
Joy N. Ott, Montana
Robert A. Hatch, Utah
Donald R. Sall, Greater Colorado
H. Lynn Horak, Iowa
J. Scott Johnson, Iowa
Judith A. Owen, Nebraska
James Prunty, Washington
Alan V. Johnson, Oregon
Pat McMurray, Idaho
Richard Strutz, Alaska
Laura A. Schulte, California, Nevada, Border Banking
Michael Bellici, Greater San Francisco
Robert D. Worth, California BusinessBanking
Kirk V. Clausen, Nevada
Pamela M. Conboy, Northern California
William J. Dewhurst, Central California
Nathan E. Christian, Southern California,Border Banking
Shelley Freeman, Los Angeles County
Lisa Stevens, San Francisco Metro
Kim M. Young, Orange County
Gerrit van Huisstede, Arizona
Business Banking Support Group
Tim Coughlon
Consumer, Business, Investment Internet Services
Avid Modjtabai
Consumer Deposits
Leslie L. Altick
Private Client Services
Clyde W. Ostler
Jay S. Welker, Regional Management
Charles W. Daggs III, National Sales Manager
Gregory Bronstein, Cross BusinessPartnerships
Regional Managing Directors
Joe W. Defur, Washington, Oregon, Idaho, Alaska
Anne D. Copeland, Northern California, Central California, Nevada
Tracey B. Warson, Bay Area
Richard D. Byrd, Los Angeles Metro
James Cimino, Southern California,Orange County, Border Banking
David J. Kasper, Colorado, Utah, Montana,Wyoming
Russell A. Labrasca, Texas, New Mexico
Timothy N. Traudt, Minnesota, NorthDakota, South Dakota, Wisconsin,Michigan, Indiana, Ohio
David J. Pittman, Illinois, Iowa, Nebraska
Timothy King, Wells Fargo Insurance, Inc./Financial Consultant Advisory Group
Adam Antoniades, FAS Holdings
Michael E. Connealy, Rural CommunityInsurance Services
Roger C. Ochs, HD Vest, Inc.
Stephen C. Veno, Wells Fargo Insurance, Direct Response
Diversified Products Group
Michael R. James
Marc L. Bernstein, Business Direct Lending
Lou Cosso, Auto Finance
Jerry E. Gray, SBA Lending
Robert L. Brown, Payroll
Rebecca Macieira-Kaufmann, Small Business
Kevin A. Rhein, Wells Fargo Card Services
Jon A. Veenis, Education Finance Services
Donald W. Weber, Merchant Services
Norwest Equity Partners
John E. Lindahl, Managing Partner
Norwest Venture Partners
Promod Haque, Managing Partner
Wells Fargo Services Company
C. Webb Edwards
Terry L. Allen, Distributed Infrastructure-Network
Kevin B. Dabney, CIO- Retail Banking
Scott A. Dillon, Payment Strategies
Joseph A. Erwin, Wholesale Services
Wayne A. Mekjian, CIO – Home & ConsumerFinance
Ashok Moorthy, CIO – Wholesale Banking
Victor K. Nichols, Technology Infrastructure
Michael D. Noble, Retail and PaymentServices
Dale A. Pearce, Contract Management &Procurement
Diana L. Starcher, Phone Bank
HOME AND CONSUMER FINANCEGroup Head
Mark C. Oman
Wells Fargo Home Mortgage, Inc.
Peter J. Wissinger, President, CEO
Cara K. Heiden, National ConsumerLending
Michael Lepore, Institutional Lending andLoan Servicing
Consumer Credit Group
Doreen Woo Ho, President
John W. Barton, Regional Banking
Scott Gable, Personal Credit Management
Kathleen L. Vaughan, Institutional Lending
Colin D. Walsh, Equity Direct and Partnership Services
Meheriar Hasan, Direct to Consumer
Wells Fargo Financial, Inc.
Thomas P. Shippee, President, COO
Greg Janasko, Commercial Business Group
Gary D. Lorenz, U.S. Auto
Dave Kvamme, U.S. Consumer
Oriol Segarra, Caribbean Consumer
John E. Van Leeuwen, Canadian Operations
Jaime Marti, Caribbean Auto
Corporate Trust Services
Brian Bartlett
WHOLESALE BANKINGGroup Head
David A. Hoyt
Credit Adminsitration
Thomas J. Davis, Real Estate
Michael J. Loughlin, Commercial/Corporate
Commercial Banking
Iris S. Chan
John C. Adams, Northern California
JoAnn N. Bertges, Central California
Robert A. Chereck, Texas
Albert F. (Rick) Ehrke, Southern California
Alicia K. Harrison, Southwest
Mark D. Howell, Intermountain
Perry G. Pelos, Midwest
John V. Rindlaub, Pacific Northwest
Edmond O. Lelo, Greater Los Angeles
Gerald B. Stenson, Minnesota
Specialized Financial Services
Timothy J. Sloan
J. Edward Blakey, Commercial MortgageGroup
Saturnino S. Fanlo, Securities InvestmentGroup
Richard P. Ferris, Corporate Banking,Shareowner Services
John Hullar, Wells Fargo Securities
Jay Kornmayer, Gaming
Mark L. Myers, Real Estate MerchantBanking, Homebuilder Finance
J. Michael Johnson, Structured,Communications & Mezzanine Finance,Distribution
James R. Renner, Wells Fargo EquipmentFinance, Inc.
Real Estate
A. Larry Chapman
Charles H. Fedalen, Jr., SouthernCalifornia/Southwest
Shirley O. Griffin, Loan Administration
Christopher J. Jordan, Mid-Atlantic/New England
Robin W. Michel, Northern California/Northwest
James H. Muir, Eastern U.S./Midwest
Stephen P. Prinz, Central U.S./Texas
International, Correspondent Banking,Insurance and Services
David J. Zuercher
Kevin Conboy, Acordia, Inc.
Peter P. Connolly, Foreign Exchange/International Financial Services
David J. Weber, Wells Fargo HSBC TradeBank, N.A.
J. Thomas Wiklund, Correspondent Banking
Asset-Based Lending
John F. Nickoll
Peter E. Schwab, Wells Fargo Foothill
Henry K. Jordan, Wells Fargo Foothill
Thomas Pizzo, Wells Fargo Century
Martin J. McKinley, Wells Fargo BusinessCredit, Inc.
Jeffrey T. Nikora, Alternative InvestmentManagement
Eastdil Realty Company, LLC
Benjamin V. Lambert, Chairman, CEO
Roy March, President
Institutional Investment Services
Michael J. Niedermeyer
Robert W. Bissell, Wells CapitalManagement, Inc.
P. Jay Kiedrowski, Institutional Trust Group
John S. McCune, Institutional Brokerage
Laurie B. Nordquist, Institutional Trust
James W. Paulsen, Wells CapitalManagement, Inc.
Karla Rabusch, Wells Fargo Funds LLC
Wholesale Services
Stephen M. Ellis
Senior Business Officers

Financial Review
34 Overview
36 Critical Accounting Policies
39 Earnings Performance39 Net Interest Income42 Noninterest Income43 Noninterest Expense43 Income Taxes43 Operating Segment Results
44 Balance Sheet Analysis44 Securities Available for Sale
(table on page 68)44 Loan Portfolio (table on page 70)44 Deposits
45 Off-Balance Sheet Arrangements andAggregate Contractual Obligations
45 Off-Balance Sheet Arrangements,Variable Interest Entities, Guarantees and Other Commitments
46 Contractual Obligations46 Transactions with Related Parties
46 Risk Management46 Credit Risk Management Process47 Nonaccrual Loans and Other Assets48 Loans 90 Days or More Past Due
and Still Accruing48 Allowance for Loan Losses
(table on page 71)
48 Asset/Liability and Market Risk Management
49 Interest Rate Risk49 Mortgage Banking Interest Rate Risk50 Market Risk – Trading Activities50 Market Risk – Equity Markets50 Liquidity and Funding
52 Capital Management
52 Comparison of 2002 with 2001
53 Factors That May Affect Future Results
57 Additional Information
Financial Statements
58 Consolidated Statement of Income
59 Consolidated Balance Sheet
60 Consolidated Statement of Changes in Stockholders’ Equity and Comprehensive Income
61 Consolidated Statement of Cash Flows
62 Notes to Financial Statements
108 Independent Auditors’ Report
109 Quarterly Financial Data
111 Glossary
112 Index
33

34
Wells Fargo & Company is a $388 billion diversified financialservices company providing banking, insurance, investments,mortgage banking and consumer finance through bankingstores, the internet and other distribution channels to con-sumers, businesses and institutions in all 50 states of the U.S.and in other countries. We ranked fifth in assets and third inmarket value of our common stock among U.S. bank holdingcompanies at December 31, 2003. In this Annual Report,Wells Fargo & Company and Subsidiaries (consolidated) arecalled the Company; we refer to Wells Fargo & Companyalone as the Parent.
2003 was a very successful year. We achieved record revenue of over $28 billion and diluted earnings per share of$3.65, double-digit increases from last year. Once again ourgrowth in earnings per share was driven by revenue growth.Our primary sources of earnings are driven by lending anddeposit taking activities, which generate net interest income,and providing financial services that generate fee income.
Our corporate vision is to satisfy all the financial needs ofour customers, help them succeed financially, be recognized asthe premier financial services company in our markets and beone of America’s great companies. Our primary strategy toachieve this vision is to increase the number of products weprovide to our customers and to focus on providing each customer with all of the financial products that fulfill theirneeds. Our cross-sell strategy and diversified business modelfacilitates growth in strong and weak economic cycles, as wecan grow by expanding the number of products our currentcustomers have with us. We estimate that each of our currentcustomers has an average of over four of our products. Ourgoal is eight products per customer, which is currently half of the estimated potential demand.
Our core products grew this year as follows:
• Average loans grew by 22%;• Average core deposits grew by 12%; • Mortgage loan originations increased 41% to
$470 billion, an industry record;• Assets managed and administered were up 13%; and• We processed more than one billion electronic deposit
transactions, up 18%.
We believe it is important to maintain a well controlledenvironment as we continue to grow our businesses. We haveprudent credit policies: nonperforming loans and net charge-offs as a percentage of loans outstanding declined from theprior year. We manage the interest rate and market risks
inherent in our asset and liability balances within prudentranges, while ensuring adequate liquidity and funding. Weare the only bank in the U.S. to be “Aaa” rated by Moody’sInvestors Service, their highest rating. Our stockholder valuehas continued to increase due to customer satisfaction, strongfinancial results and the prudent way we attempt to manageour business risk.
Our financial results included the following:
Net income in 2003 was $6.2 billion, or $3.65 per share,compared with $5.7 billion, or $3.32 per share, before theeffect of the accounting change related to Statement ofFinancial Accounting Standards No. 142 (FAS 142), Goodwilland Other Intangible Assets, for 2002. On the same basis,return on average assets (ROA) was 1.64% and return onaverage common equity (ROE) was 19.36% in 2003, com-pared with 1.77% and 19.63%, respectively, for 2002.
Net income in 2003 was $6.2 billion, compared with $5.4 billion in 2002. Earnings per common share were $3.65in 2003, compared with $3.16 in 2002. ROA was 1.64% and ROE was 19.36% in 2003, compared with 1.69% and18.68%, respectively, in 2002.
Net interest income on a taxable-equivalent basis was$16.1 billion in 2003, compared with $14.6 billion a yearago. The net interest margin was 5.08% for 2003, comparedwith 5.53% in 2002.
Noninterest income was $12.4 billion in 2003, comparedwith $10.8 billion in 2002, an increase of 15%.
Revenue, the sum of net interest income and noninterestincome, increased 12% to $28.4 billion in 2003 from $25.2 billion in 2002.
Noninterest expense totaled $17.2 billion in 2003, comparedwith $14.7 billion in 2002, an increase of 17%.
During 2003, net charge-offs were $1.72 billion, or .81%of average total loans, compared with $1.68 billion, or .96%,during 2002. The provision for loan losses was $1.72 billionin 2003, compared with $1.68 billion in 2002. The allowancefor loan losses was $3.89 billion, or 1.54% of total loans, atDecember 31, 2003, compared with $3.82 billion, or 1.98%,at December 31, 2002.
At December 31, 2003, total nonaccrual loans were$1.46 billion, or .58% of total loans, compared with$1.49 billion, or .78%, at December 31, 2002. Foreclosedassets were $198 million at December 31, 2003 and $195 million at December 31, 2002.
Overview
This Annual Report, including the Financial Review and the Financial Statements and related Notes, has forward-looking statements, which include forecasts of our financial results and condition, expectations for our operations andbusiness, and our assumptions for those forecasts and expectations. Do not rely unduly on forward-looking state-ments. Actual results might differ significantly from our forecasts and expectations. Please refer to “Factors that MayAffect Future Results” for a discussion of some factors that may cause results to differ.

35
The ratio of common stockholders’ equity to total assetswas 8.89% at December 31, 2003, compared with 8.67% atDecember 31, 2002. Our total risk-based capital (RBC) ratioat December 31, 2003 was 12.21% and our Tier 1 RBC ratiowas 8.42%, exceeding the minimum regulatory guidelinesof 8% and 4%, respectively, for bank holding companies.Our RBC ratios at December 31, 2002 were 11.44% and7.70%, respectively. Our Tier 1 leverage ratios were 6.93%and 6.57% at December 31, 2003 and 2002, respectively,exceeding the minimum regulatory guideline of 3% forbank holding companies.
Recent Accounting StandardsIn January 2003, the Financial Accounting Standards Board(FASB) issued Interpretation No. 46 (FIN 46), Consolidationof Variable Interest Entities and, in December 2003, issuedRevised Interpretation No. 46 (FIN 46R), Consolidation ofVariable Interest Entities, which replaced FIN 46. We adoptedthe disclosure provisions of FIN 46 effective December 31,2002. On February 1, 2003, we adopted the recognition andmeasurement provisions of FIN 46 for variable interest entities(VIEs) formed after January 31, 2003, and, on December 31,2003, we adopted FIN 46R for all existing VIEs and consoli-dated five variable interest entities with total assets of $281million. The adoption of FIN 46 and FIN 46R did not havea material effect on our financial statements.
Historically, issuer trusts that issued trust preferred securitieshave been consolidated by their parent companies and trustpreferred securities have been treated as eligible for Tier 1 capital treatment by bank holding companies under FederalReserve Board (FRB) rules and regulations relating to minorityinterests in equity accounts of consolidated subsidiaries.Applying the provisions of FIN 46R, we deconsolidated ourissuer trusts as of December 31, 2003. In a Supervisory Letterdated July 2, 2003, the FRB stated that trust preferred securi-ties continue to qualify as Tier 1 capital until notice is given tothe contrary. The FRB will review the regulatory implicationsof any accounting treatment changes and will provide furtherguidance if necessary or warranted.
In April 2003, the FASB issued FAS 149, Amendment of Statement 133 on Derivative Instruments and HedgingActivities, to provide additional clarification of certain termsand investment characteristics. This statement was effectivefor contracts entered into or modified after June 30, 2003.The adoption of FAS 149 did not have a material effect onour financial statements.
In May 2003, the FASB issued FAS 150, Accounting forCertain Financial Instruments with Characteristics of bothLiabilities and Equity. FAS 150 establishes standards for howan issuer classifies and measures certain financial instrumentswith characteristics of both liabilities and equity. We adoptedFAS 150 effective July 1, 2003 and the adoption of the standarddid not have a material effect on our financial statements.
On December 8, 2003 President Bush signed the MedicarePrescription Drug, Improvement and Modernization Act of2003 (the Act). The Act introduces a prescription drug benefitunder Medicare as well as a federal subsidy to plan sponsorsthat provide a benefit that is at least equivalent to Medicare.Since the measurement date for our postretirement health careplan is November 30 and the Act did not become law untilafter this date, measurement of our accumulated postretirementbenefit obligation and net periodic postretirement benefitcost in our financial statements or accompanying notes do
Table 1: Ratios and Per Common Share Data
Year ended December 31,2003 2002 2001
Before effect of change in accounting principle (1)
and excluding goodwill amortization
PROFITABILITY RATIOSNet income to average total assets (ROA) 1.64% 1.77% 1.40%Net income applicable to common stock to
average common stockholders’ equity (ROE) 19.36 19.63 14.88Net income to average stockholders’ equity 19.34 19.61 14.81
EFFICIENCY RATIO (2) 60.6 58.3 62.8
After effect of change in accounting principle
PROFITABILITY RATIOSROA 1.64 1.69 1.20ROE 19.36 18.68 12.73Net income to average stockholders’ equity 19.34 18.66 12.69
EFFICIENCY RATIO 60.6 58.3 65.7
CAPITAL RATIOSAt year end:
Common stockholders’ equity to assets 8.89 8.67 8.82Stockholders’ equity to assets 8.89 8.68 8.84Risk-based capital (3)
Tier 1 capital 8.42 7.70 7.43Total capital 12.21 11.44 11.01
Tier 1 leverage (3) 6.93 6.57 6.24Average balances:
Common stockholders’ equity to assets 8.48 9.03 9.35Stockholders’ equity to assets 8.49 9.05 9.42
PER COMMON SHARE DATADividend payout (4) 40.68 34.46 50.25Book value $20.31 $17.95 $15.99Market prices (5):
High $59.18 $54.84 $54.81Low 43.27 38.10 38.25Year end 58.89 46.87 43.47
(1) Change in accounting principle is for a transitional goodwill impairmentcharge recorded in first quarter 2002 for the adoption of FAS 142.
(2) The efficiency ratio is noninterest expense divided by total revenue (net interest income and noninterest income).
(3) See Note 26 (Regulatory and Agency Capital Requirements) to FinancialStatements for additional information.
(4) Dividends declared per common share as a percentage of earnings per common share.
(5) Based on daily prices reported on the New York Stock Exchange CompositeTransaction Reporting System.

36
Table 2: Six-Year Summary of Selected Financial Data
(in millions, except % Change Five-yearper share amounts) 2003/ compound
2003 2002 2001 2000 1999 1998 2002 growth rate
INCOME STATEMENTNet interest income $ 16,007 $ 14,482 $ 11,976 $ 10,339 $ 9,608 $ 9,236 11% 12%Provision for loan losses 1,722 1,684 1,727 1,284 1,079 1,576 2 2Noninterest income 12,382 10,767 9,005 10,360 9,277 8,113 15 9Noninterest expense 17,190 14,711 13,794 12,889 11,483 12,130 17 7
Before effect of change in accounting principle
Net income $ 6,202 $ 5,710 $ 3,411 $ 4,012 $ 3,995 $ 2,178 9 23Earnings per common share 3.69 3.35 1.99 2.35 2.31 1.27 10 24Diluted earnings
per common share 3.65 3.32 1.97 2.32 2.28 1.25 10 24
After effect of change in accounting principle
Net income $ 6,202 $ 5,434 $ 3,411 $ 4,012 $ 3,995 $ 2,178 14 23Earnings per common share 3.69 3.19 1.99 2.35 2.31 1.27 16 24Diluted earnings
per common share 3.65 3.16 1.97 2.32 2.28 1.25 16 24Dividends declared
per common share 1.50 1.10 1.00 .90 .785 .70 36 16
BALANCE SHEET(at year end)Securities available for sale $ 32,953 $ 27,947 $ 40,308 $ 38,655 $ 43,911 $ 36,660 18 (2)Loans 253,073 192,478 167,096 155,451 126,700 114,546 31 17Allowance for loan losses 3,891 3,819 3,717 3,681 3,312 3,274 2 4Goodwill 10,371 9,753 9,527 9,303 8,046 7,889 6 6Assets 387,798 349,197 307,506 272,382 241,032 224,141 11 12Core deposits 211,271 198,234 182,295 156,710 138,247 144,179 7 13Long-term debt 63,642 47,320 36,095 32,046 26,866 22,662 34 23Guaranteed preferred beneficial
interests in Company’ssubordinated debentures (1) — 2,885 2,435 935 935 935 (100) (100)
Common stockholders’ equity 34,484 30,258 27,111 26,194 23,587 21,873 14 10Stockholders’ equity 34,469 30,319 27,175 26,461 23,858 22,336 14 9
(1) At December 31, 2003, upon adoption of FIN 46R, these balances were reflected in long-term debt. See Note 12 (Guaranteed Preferred Beneficial Interests in Company’sSubordinated Debentures) to Financial Statements for more information.
Critical Accounting Policies
not reflect the effects of the Act on the plan. On January 12,2004, the FASB issued Staff Position 106-1, Accounting andDisclosure Requirements Related to the Medicare PrescriptionDrug, Improvement and Modernization Act of 2003, whichincludes a provision that allows a plan sponsor a one-timeelection to defer accounting for the Act that must be madebefore net periodic postretirement benefit costs for the periodthat includes the Act’s enactment date are first included in
reported financial information. If deferral is elected, thatelection may not be changed and the deferral continues toapply until authoritative guidance on the accounting for thefederal subsidy is issued. We will make our decision regardingdeferral in the first quarter of 2004. Specific authoritativeguidance on the accounting for the federal subsidy is pendingand that guidance, when issued, could require a plan sponsorto change previously reported information.
Our significant accounting policies (described in Note 1(Summary of Significant Accounting Policies) to FinancialStatements) are fundamental to understanding our results ofoperations and financial condition, because some accountingpolicies require that we use estimates and assumptions thatmay affect the value of our assets or liabilities and financialresults. Three of these policies are critical because they requiremanagement to make difficult, subjective and complex judgments
about matters that are inherently uncertain and because itis likely that materially different amounts would be reportedunder different conditions or using different assumptions.These policies govern the allowance for loan losses, the valuation of mortgage servicing rights and pension accounting.Management has reviewed and approved these criticalaccounting policies and has discussed these policies withthe Audit and Examination Committee.

37
The allowance for loan losses, and the resulting provision,is based on judgments and assumptions, including (1) generaleconomic conditions, (2) loan portfolio composition, (3) loanloss experience, (4) management’s evaluation of the credit riskrelating to pools of loans and individual borrowers, (5) sensi-tivity analysis and expected loss models and (6) observationsfrom our internal auditors, internal loan review staff or ourbanking regulators.
To estimate the possible range of allowance required atDecember 31, 2003, and the related change in provisionexpense, we assumed the following scenarios of a reasonablypossible deterioration or improvement in loan credit quality.
Assumptions for deterioration in loan credit quality were:• For retail loans, a 20 basis point increase in estimated
loss rates from historical loss levels; and• For wholesale loans, which are dissimilar in nature, a
migration of certain loans to lower risk grades, resultingin a 30% increase in the balance of nonperforming loansand related impairment.
Assumptions for improvement in loan credit quality were:• For retail loans, a 10 basis point decrease in estimated
loss rates from historical loss levels; and• For wholesale loans, a negligible change in nonperforming
loans and related impairment.
Under the assumptions for deterioration in loan creditquality, another $425 million in expected losses could occurand under the assumptions for improvement, a $200 millionreduction in expected losses could occur.
Changes in the estimate of the allowance for loan lossescan materially affect net income. The example above is onlyone of a number of reasonably possible scenarios. Determiningthe allowance for loan losses requires us to make forecasts thatare highly uncertain and require a high degree of judgment.
Valuation of Mortgage Servicing RightsWe recognize the rights to service mortgage loans for others,or mortgage servicing rights (MSRs), as assets, whether wepurchase the servicing rights, or keep them after the sale orsecuritization of loans we originated. Generally, purchasedMSRs are capitalized at cost. Originated MSRs are recordedbased on the relative fair value of the servicing right and themortgage loan on the date the mortgage loan is sold. Bothpurchased and originated MSRs are carried at the lower of (1) the capitalized amount, net of accumulated amortizationand hedge accounting adjustments, or (2) fair value. If MSRsare designated as a hedged item in a fair value hedge, theMSRs’ carrying value is adjusted for changes in fair valueresulting from the application of hedge accounting. Theadjustment becomes part of the carrying value. The carryingvalue of these MSRs is still subject to a fair value test underFAS 140, Accounting for Transfers and Servicing of FinancialAssets and Extinguishments of Liabilities.
Allowance for Loan LossesThe allowance for loan losses is management’s estimate ofcredit losses inherent in the loan portfolio, including unfundedcommitments, at the balance sheet date. We have an estab-lished process, using several analytical tools and benchmarks,to calculate a range of possible outcomes and determine theadequacy of the allowance. No single statistic or measurementdetermines the adequacy of the allowance. Loan recoveriesand the provision for loan losses increase the allowance, while loan charge-offs decrease the allowance.
PROCESS TO DETERMINE THE ADEQUACY OF THE ALLOWANCE
FOR LOAN LOSSES
For analytical purposes only, we allocate a portion of theallowance to specific loan categories (the allocated allowance).The entire allowance (both allocated and unallocated), however,is used to absorb credit losses inherent in the total loan portfolio.
Approximately two-thirds of the allocated allowance isdetermined at a pooled level for retail loan portfolios (consumerloans and leases, home mortgage loans and some segments ofsmall business loans). We use forecasting models to measurethe losses inherent in these portfolios. We frequently validateand update these models to capture the recent behavioralcharacteristics of the portfolios, as well as any changes in ourloss mitigation or marketing strategies.
We use a standardized loan grading process for wholesaleloan portfolios (commercial, commercial real estate, realestate construction and leases) and review larger higher-risktransactions individually. Based on this process, we assign aloss factor to each pool of graded loans. For graded loanswith evidence of credit weakness at the balance sheet date, theloss factors are derived from migration models that trackactual portfolio movements between loan grades over a speci-fied period of time. For graded loans without evidence ofcredit weakness at the balance sheet date, we use a combina-tion of our long-term average loss experience and externalloss data. In addition, we individually review nonperformingloans over $1 million for impairment based on cash flows orcollateral. We include the impairment on nonperforming loansin the allocated allowance unless it has already been recog-nized as a loss.
The allocated allowance is supplemented by the unallocatedallowance to adjust for imprecision and to incorporate therange of probable outcomes inherent in estimates used forthe allocated allowance. The unallocated allowance is theresult of our judgment of risks inherent in the portfolio,economic uncertainties, historical loss experience and othersubjective factors, including industry trends.
The ratios of the allocated allowance and the unallocatedallowance to the total allowance may change from period toperiod. The total allowance reflects management’s estimate of credit losses inherent in the loan portfolio at the balancesheet date.

38
We use a dynamic and sophisticated model to estimate thevalue of our MSRs. Mortgage loan prepayment speed—a keyassumption in the model—is the annual rate at which bor-rowers are forecasted to repay their mortgage loan principal.The discount rate—another key assumption in the model—isequal to what we believe the required rate of return would befor an asset with similar risk. To determine the discount rate,we consider the risk premium for uncertainties from servicingoperations (e.g., possible changes in future servicing costs,ancillary income and earnings on escrow accounts). Bothassumptions can and generally will change in quarterly andannual valuations as market conditions and interest rateschange. Senior management reviews all assumptions quarterly.
Our key economic assumptions and the sensitivity of thecurrent fair value of MSRs to an immediate adverse change inthose assumptions are shown in Note 21 (Securitizations andVariable Interest Entities) to Financial Statements.
There have been significant market-driven fluctuations inloan prepayment speeds and the discount rate in recent years.These fluctuations could be rapid and significant in the future.Therefore, estimating prepayment speeds within a range thatmarket participants would use in determining the fair value of MSRs requires significant management judgment.
Pension AccountingWe use four key variables to calculate our annual pensioncost; (1) size of the employee population, (2) actuarialassumptions, (3) expected long-term rate of return on planassets, and (4) discount rate. We describe below the effect ofeach of these variables on our pension expense.
SIZE OF THE EMPLOYEE POPULATION
Pension expense is directly related to the number of employeescovered by the plans. The number of our employees eligible forpension benefits has steadily increased over the last few years,causing a proportional growth in pension expense.
ACTUARIAL ASSUMPTIONS
To estimate the projected benefit obligation, actuarialassumptions are required about factors such as mortalityrate, turnover rate, retirement rate, disability rate and therate of compensation increases. These factors don’t tend tochange over time, so the range of assumptions, and theirimpact on pension expense, is generally narrow.
EXPECTED LONG-TERM RATE OF RETURN ON PLAN ASSETS
We calculate the expected return on plan assets each year basedon the balance in the pension asset portfolio at the beginning ofthe plan year and the expected long-term rate of return on thatportfolio. The expected long-term rate of return is designed toapproximate the actual long-term rate of return on the plan assetsover time. The expected long-term rate of return is generallyheld constant so the pattern of income/expense recognition moreclosely matches the stable pattern of services provided by ouremployees over the life of the pension obligation.
MSRs are amortized in proportion to and over the periodof estimated net servicing income. We analyze the amortiza-tion of MSRs monthly and adjust amortization to reflectchanges in prepayment speeds and discount rates.
We determine the fair value of MSRs using a valuationmodel that calculates the present value of estimated futurenet servicing income. The model incorporates assumptionsthat market participants would use in estimating future netservicing income, including estimates of prepayment speeds,discount rate, cost to service, escrow account earnings, con-tractual servicing fee income, ancillary income and late fees.The valuation of MSRs is discussed further in this sectionand in Notes 1 (Summary of Significant Accounting Policies),21 (Securitizations and Variable Interest Entities) and 22(Mortgage Banking Activities) to Financial Statements.
Each quarter, we evaluate MSRs for possible impairmentbased on the difference between the carrying amount andcurrent estimated fair value under FAS 140. To evaluate andmeasure impairment we stratify the portfolio based on certainrisk characteristics, including loan type and note rate. Iftemporary impairment exists, we establish a valuation allowancethrough a charge to net income for any excess of amortizedcost over the current fair value, by risk stratification. If welater determine that all or part of the temporary impairment nolonger exists for a particular risk stratification, we may reducethe valuation allowance through an increase to net income.
Under our policy, we also evaluate other-than-temporaryimpairment of MSRs by considering both historical and projected trends in interest rates, pay-off activity and whetherthe impairment could be recovered through interest rateincreases. We recognize a direct write-down if we determinethat the recoverability of a recorded valuation allowance isremote. A direct write-down permanently reduces the carryingvalue of the MSRs, while a valuation allowance (temporaryimpairment) can be reversed.
To reduce the sensitivity of earnings to interest rate andmarket value fluctuations, we hedge the change in value ofMSRs primarily with liquid derivative contracts. Reductionsor increases in the value of the MSRs are generally offset bygains or losses in the value of the derivative. If the reductionor increase in the value of the MSRs is not offset, we imme-diately recognize a gain or loss for the portion of the amountthat is not offset (hedge ineffectiveness). We do not fully hedgeMSRs because origination volume is a “natural hedge,” (i.e.,as interest rates decline, servicing values decrease and feesfrom origination volume increase). Conversely, as interestrates increase, the value of the MSRs increases, while feesfrom origination volume tend to decline.
Servicing fees—net of amortization, provision for impair-ment and gain or loss on the ineffective portion and theportion of the derivatives excluded from the assessment ofhedge effectiveness—are recorded in mortgage bankingnoninterest income.

39
To determine if the expected rate of return is reasonable,we consider such factors as (1) the actual return earned onplan assets, (2) historical rates of return on the various assetclasses in the plan portfolio, (3) projections of returns onvarious asset classes, and (4) current/prospective capital market conditions and economic forecasts. We have used an expected rate of return of 9% on plan assets for the pastseven years. Over the last two decades, the plan assets haveactually earned a rate of return higher than 9%. Differencesin each year, if any, between expected and actual returns inexcess of a 5% corridor (as defined in FAS 87, Employers’Accounting for Pensions) are amortized in net periodic pension calculations over the next five years. See Note 15(Employee Benefits and Other Expenses) to FinancialStatements for details on changes in the pension benefitobligation and the fair value of plan assets.
We use November 30 as a measurement date for our pension asset and projected benefit obligation balances. If we were to assume a 1% increase/decrease in the expected long-term rate of return, holding the discount rate and otheractuarial assumptions constant, pension expense woulddecrease/increase by approximately $36 million.
Earnings Performance
Net Interest IncomeNet interest income is the interest earned on debt securities,loans (including yield-related loan fees) and other interest-earning assets minus the interest paid for deposits and long-and short-term debt. The net interest margin is the averageyield on earning assets minus the average interest rate paidfor deposits and debt. Net interest income and the net inter-est margin are presented on a taxable-equivalent basis toconsistently reflect income from taxable and tax-exemptloans and securities based on a 35% marginal tax rate.
Net interest income on a taxable-equivalent basis was$16.1 billion in 2003, compared with $14.6 billion in 2002,an increase of 10%. The increase was primarily due torobust loan growth and significantly lower funding costsresulting from strong core deposit growth and lower whole-sale funding rates. These factors were partially offset byreduced income from a smaller investment portfolio follow-ing the sale, prepayment and maturity of higher yieldingmortgage-backed securities.
The interest margin for 2003 decreased to 5.08% from5.53% in 2002. The decrease was primarily due to decliningloan yields as new volumes were added to the portfolio atyields below existing loans due to a lower interest rate envi-ronment. This was partially offset by significantly reducedfunding costs and growth in noninterest-bearing funds.
Average earning assets increased $53.3 billion in 2003 from2002 due to increases in average loans and mortgages held forsale. Loans averaged $213.1 billion in 2003, compared with$174.5 billion in 2002. The increase was largely due to growthin mortgage and home equity products. Average mortgages heldfor sale increased to $58.7 billion in 2003 from $39.9 billionin 2002, due to increased originations, largely from refinancingactivity. Debt securities available for sale averaged $27.3 billionin 2003, compared with $36.0 billion in 2002.
Average core deposits are an important contributor togrowth in net interest income and the net interest margin. Thislow-cost source of funding rose 12% from 2002. Average coredeposits were $207.0 billion and $184.1 billion and funded54.8% and 57.2% of average total assets in 2003 and 2002,respectively. While savings certificates of deposits declined onaverage from $24.3 billion to $20.9 billion, noninterest-bearingchecking accounts and other core deposit categories increasedon average from $159.9 billion in 2002 to $186.1 billion in2003 reflecting growth in consumer and business primaryaccount relationships. Total average interest-bearing depositsincreased to $161.7 billion in 2003 from $133.8 billion a yearago. For the same periods, total average noninterest-bearingdeposits increased to $76.8 billion from $63.6 billion.
Table 3 presents the individual components of net interestincome and the net interest margin.
DISCOUNT RATE
We use the discount rate to determine the present value of ourfuture benefit obligations. It reflects the rates available onlong-term high-quality fixed-income debt instruments, resetannually on the measurement date. We lowered our discountrate in 2003 to 6.5% from 7% in 2002 and from 7.5% in2000-2001, reflecting the decline in interest rates during theseperiods.
If we were to assume a 1% increase in the discount rate,and keep the expected long-term rate of return and otheractuarial assumptions constant, pension expense woulddecrease by approximately $58 million; if we were to assumea 1% decrease in the discount rate, and keep other assump-tions constant, pension expense would increase by approxi-mately $90 million. The decrease to pension expense basedon a 1% increase in discount rate differs from the increase topension expense based on 1% decrease in discount rate dueto the 5% corridor.

40
Table 3: Average Balances, Yields and Rates Paid (Taxable-Equivalent Basis) (1)(2)
(in millions) 2003 2002Average Yields/ Interest Average Yields/ Interestbalance rates income/ balance rates income/
expense expense
EARNING ASSETSFederal funds sold and securities purchased
under resale agreements $ 3,675 1.11% $ 41 $ 2,652 1.67% $ 44Debt securities available for sale (3):
Securities of U.S. Treasury and federal agencies 1,286 4.74 58 1,770 5.57 95Securities of U.S. states and political subdivisions 2,424 8.62 196 2,106 8.33 167Mortgage-backed securities:
Federal agencies 18,283 7.37 1,276 26,718 7.23 1,856Private collateralized mortgage obligations 2,001 6.24 120 2,341 7.18 163
Total mortgage-backed securities 20,284 7.26 1,396 29,059 7.22 2,019Other debt securities (4) 3,302 7.75 240 3,029 7.74 232
Total debt securities available for sale (4) 27,296 7.32 1,890 35,964 7.25 2,513Mortgages held for sale (3) 58,672 5.34 3,136 39,858 6.13 2,450Loans held for sale (3) 7,142 3.51 251 5,380 4.69 252Loans:
Commercial 47,279 6.08 2,876 46,520 6.80 3,164Real estate 1-4 family first mortgage 56,252 5.54 3,115 32,669 6.69 2,185Other real estate mortgage 25,846 5.44 1,405 25,413 6.17 1,568Real estate construction 7,954 5.11 406 7,925 5.69 451Consumer:
Real estate 1-4 family junior lien mortgage 31,670 5.80 1,836 25,220 7.07 1,783Credit card 7,640 12.06 922 6,810 12.27 836Other revolving credit and installment 29,838 9.09 2,713 24,072 10.28 2,475
Total consumer 69,148 7.91 5,471 56,102 9.08 5,094Lease financing 4,453 6.22 277 4,079 6.32 258Foreign 2,200 18.00 396 1,774 18.90 335
Total loans (5) 213,132 6.54 13,946 174,482 7.48 13,055Other 8,235 2.89 238 6,492 3.80 248
Total earning assets $318,152 6.16 19,502 $264,828 7.04 18,562
FUNDING SOURCESDeposits:
Interest-bearing checking $ 2,571 .27 7 $ 2,494 .55 14Market rate and other savings 106,733 .66 705 93,787 .95 893Savings certificates 20,927 2.53 529 24,278 3.21 780Other time deposits 25,388 1.20 305 8,191 1.86 153Deposits in foreign offices 6,060 1.11 67 5,011 1.58 79
Total interest-bearing deposits 161,679 1.00 1,613 133,761 1.43 1,919Short-term borrowings 29,898 1.08 322 33,278 1.61 536Long-term debt 53,823 2.52 1,355 42,158 3.33 1,404Guaranteed preferred beneficial interests in Company’s
subordinated debentures 3,306 3.66 121 2,780 4.23 118Total interest-bearing liabilities 248,706 1.37 3,411 211,977 1.88 3,977
Portion of noninterest-bearing funding sources 69,446 — — 52,851 — —
Total funding sources $318,152 1.08 3,411 $264,828 1.51 3,977
Net interest margin and net interest income ona taxable-equivalent basis (6) 5.08% $16,091 5.53% $14,585
NONINTEREST-EARNING ASSETSCash and due from banks $ 13,433 $ 13,820Goodwill 9,905 9,737Other 36,123 33,340
Total noninterest-earning assets $ 59,461 $ 56,897
NONINTEREST-BEARING FUNDING SOURCESDeposits $ 76,815 $ 63,574Other liabilities 20,030 17,054Preferred stockholders’ equity 44 55Common stockholders’ equity 32,018 29,065Noninterest-bearing funding sources used to
fund earning assets (69,446) (52,851)Net noninterest-bearing funding sources $ 59,461 $ 56,897
TOTAL ASSETS $377,613 $321,725
(1) Our average prime rate was 4.12%, 4.68%, 6.91%, 9.24% and 8.00% for 2003, 2002, 2001, 2000 and 1999, respectively. The average three-month London InterbankOffered Rate (LIBOR) was 1.22%, 1.80%, 3.78%, 6.52% and 5.42% for the same years, respectively.
(2) Interest rates and amounts include the effects of hedge and risk management activities associated with the respective asset and liability categories.(3) Yields are based on amortized cost balances computed on a settlement date basis.

2001 2000 1999Average Yields/ Interest Average Yields/ Interest Average Yields/ Interestbalance rates income/ balance rates income/ balance rates income/
expense expense expense
$ 2,583 3.69% $ 95 $ 2,370 6.01% $ 143 $ 1,673 5.11% $ 86
2,158 6.55 137 3,322 6.16 210 6,124 5.51 3482,026 7.98 154 2,080 7.74 162 2,119 8.12 168
27,433 7.19 1,917 26,054 7.22 1,903 23,542 6.77 1,599 1,766 8.55 148 2,379 7.61 187 3,945 6.77 27029,199 7.27 2,065 28,433 7.25 2,090 27,487 6.77 1,869 3,343 7.80 254 5,049 7.93 261 3,519 7.49 209
36,726 7.32 2,610 38,884 7.24 2,723 39,249 6.69 2,59423,677 6.72 1,595 10,725 7.85 849 13,559 6.96 951
4,820 6.58 317 4,915 8.50 418 5,154 7.31 377
48,648 8.01 3,896 45,352 9.40 4,263 38,932 8.66 3,37023,359 7.54 1,761 17,190 7.72 1,327 13,396 7.76 1,03924,194 7.99 1,934 22,509 8.99 2,023 18,822 8.74 1,645
8,073 8.10 654 6,934 10.02 695 5,260 9.56 503
17,587 9.20 1,619 14,458 10.85 1,569 11,574 10.00 1,1576,270 13.36 838 5,867 14.58 856 5,686 13.77 783
23,459 11.40 2,674 21,824 12.06 2,631 19,561 11.88 2,32447,316 10.84 5,131 42,149 11.99 5,056 36,821 11.58 4,264
4,024 6.90 278 4,218 5.35 225 3,509 5.23 184 1,603 20.82 333 1,621 21.15 343 1,554 20.65 321
157,217 8.90 13,987 139,973 9.95 13,932 118,294 9.57 11,326 4,000 4.77 191 3,206 6.21 199 3,252 5.01 162
$229,023 8.24 18,795 $200,073 9.18 18,264 $181,181 8.57 15,496
$ 2,178 1.59 35 $ 3,424 1.88 64 $ 3,120 .99 3180,585 2.08 1,675 63,577 2.81 1,786 60,901 2.30 1,39929,850 5.13 1,530 30,101 5.37 1,616 30,088 4.86 1,462
1,332 5.04 67 4,438 5.69 253 3,957 4.94 196 6,209 3.96 246 5,950 6.22 370 1,658 4.76 79
120,154 2.96 3,553 107,490 3.80 4,089 99,724 3.17 3,16733,885 3.76 1,273 28,222 6.23 1,758 22,559 5.00 1,12734,501 5.29 1,826 29,000 6.69 1,939 24,646 5.90 1,453
1,394 6.40 89 935 7.92 74 935 7.73 72189,934 3.55 6,741 165,647 4.75 7,860 147,864 3.94 5,819 39,089 — — 34,426 — — 33,317 — —
$229,023 2.95 6,741 $200,073 3.95 7,860 $181,181 3.22 5,819
5.29% $12,054 5.23% $10,404 5.35% $9,677
$ 14,608 $ 13,103 $ 12,2529,514 8,811 7,983
32,222 28,170 23,673
$ 56,344 $ 50,084 $ 43,908
$ 55,333 $ 48,691 $ 45,20113,214 10,949 8,895
210 266 46126,676 24,604 22,668
(39,089) (34,426) (33,317)$ 56,344 $ 50,084 $ 43,908
$285,367 $250,157 $225,089
(4) Includes certain preferred securities.(5) Nonaccrual loans and related income are included in their respective loan categories.(6) Includes taxable-equivalent adjustments primarily related to tax-exempt income on certain loans and securities. The federal statutory tax rate was 35% for all
years presented.
41

42
Service charges on deposit accounts increased 8% due tocontinued growth in primary checking accounts andincreased activity.
We earn trust, investment and IRA fees from managingand administering assets, which include mutual funds, corpo-rate trust, personal trust, employee benefit trust and agencyassets. At December 31, 2003 and 2002, these assets totaledapproximately $576 billion and $510 billion, respectively.Generally, these fees are based on the market value of theassets that are managed, administered, or both. These feeswere essentially unchanged in 2003 compared with 2002 asmost of the increase in asset balances occurred in the fourthquarter of 2003. Additionally, we receive commission andother fees for providing services for retail and discount brokerage customers. At December 31, 2003 and 2002,brokerage balances were approximately $78 billion and$68 billion, respectively. Generally, these fees are based on the number of transactions executed at the customer’sdirection. The increase in commissions and all other fees of 11% for 2003 compared with 2002 was largely due to a
higher number of brokerage transactions, stronger equitymarkets and increased sales of commission driven products.
Credit card fees increased 9% from 2002 due to anincrease in credit card accounts and credit and debit cardtransaction volume. In second quarter 2003, VISA USA Inc.(VISA) reached an agreement to settle merchant litigation,which included a reduction in some interchange fees to retailers.The impact of the settlement is expected to reduce fee incomeby approximately $120 million per year prior to the effect ofincreased volumes and future repricing of these transactionsby VISA. In October 2003, we renewed our contract withVISA as our primary brand for debit and credit card transac-tions and expanded our commitment to include VISA’sInterlink network for retail transactions with merchants.
Mortgage banking noninterest income was $2,512 millionin 2003, compared with $1,713 million in 2002. Originationand other closing fees increased to $1,218 million from $1,048a year ago. Net gains on mortgage loan origination/salesactivities increased to $1,801 million in 2003 from $1,038million in 2002. These increases were primarily due tohigher mortgage origination volume and gains on loansales. Originations during 2003 grew to $470 billion from $333 billion during 2002. In the fourth quarter of 2003, wechanged the way we recognize income on interest rate lockcommitments on mortgage loans held for sale to record thebusiness margin at the time of sale instead of at the fundingdate. This change resulted in a one-time reduction in net gainson mortgage loan origination/sales activities of $77 million.
Net servicing fees were a loss of $954 million in 2003 and$737 million in 2002. Servicing fees are presented net ofamortization and impairment of mortgage servicing rights(MSRs) and gains and losses from hedge ineffectiveness,which are all influenced by both the level and direction ofmortgage interest rates. The increase in net losses from ser-vicing fees in 2003 compared with 2002 was primarily dueto lower average interest rates, which resulted in higherMSRs amortization. This increase was partially offset by anincrease in gross servicing fees in 2003 compared with theprior year due to an 18% growth in the servicing portfolioresulting from originations and purchases.
During 2003 and 2002, we recognized a direct write-downof MSRs of $1,338 million and $1,071 million, respectively.See “Financial Review – Critical Accounting Policies – MortgageServicing Rights Valuation” in this report for the methodused to evaluate MSRs for impairment and to determine ifsuch impairment is other-than-temporary. Key assumptions,including the sensitivity of those assumptions used to deter-mine the value of MSRs, are disclosed in Notes 1 (Summaryof Significant Accounting Policies) and 21 (Securitizationsand Variable Interest Entities) to Financial Statements.
Net gains on debt securities were $4 million for 2003,compared with $293 million for 2002. Net gains from equityinvestments were $55 million in 2003, compared with lossesof $327 million in 2002.
Noninterest Income
Table 4: Noninterest Income
(in millions) Year ended December 31, ___% Change2003 2002 2001 2003/ 2002/
2002 2001
Service charges on deposit accounts $ 2,361 $ 2,179 $1,876 8% 16%
Trust and investment fees:Trust, investment and IRA fees 1,345 1,343 1,534 — (12)Commissions and all other fees 592 532 257 11 107
Total trust and investment fees 1,937 1,875 1,791 3 5
Credit card fees 1,003 920 796 9 16
Other fees:Cash network fees 179 183 202 (2) (9)Charges and fees on loans 756 616 445 23 38All other 637 585 597 9 (2)
Total other fees 1,572 1,384 1,244 14 11
Mortgage banking:Origination and other
closing fees 1,218 1,048 737 16 42Servicing fees,net of amortization
and provision for impairment (954) (737) (260) 29 183Net gains on securities
available for sale — — 134 — (100)Net gains on mortgage loan
origination/sales activities 1,801 1,038 705 74 47All other 447 364 355 23 3
Total mortgage banking 2,512 1,713 1,671 47 3
Operating leases 937 1,115 1,315 (16) (15)Insurance 1,071 997 745 7 34Net gains on debt
securities available for sale 4 293 316 (99) (7)Net gains (losses) from
equity investments 55 (327) (1,538) — (79)Net gains on sales of loans 28 19 35 47 (46)Net gains on dispositions
of operations 29 10 122 190 (92)All other 873 589 632 48 (7)
Total $12,382 $10,767 $9,005 15% 20%

We routinely review our investment portfolios and recognizeimpairment write-downs based primarily on issuer-specificfactors and results. We also consider general economic andmarket conditions, including industries in which venturecapital investments are made, and adverse changes affectingthe availability of venture capital. We determine impairmentbased on all of the information available at the time of theassessment, but new information or economic developmentsin the future could result in recognition of additional impairment.
“All other” noninterest income for 2003 included $163 millionof losses on the early retirement of $2.6 billion of term debtthat was previously issued at higher costs, predominantlyoffset by gains on trading securities, foreign exchange andother capital markets activities.
43
The increase in noninterest expense, including increases insalaries, employee benefits, incentive compensation, contractservices, advertising and promotion and postage, was largelydue to the growth in the mortgage banking business, whichaccounted for approximately 48% of the increase from 2002.The increase was also due to charitable donations, predomi-nantly donations of appreciated public equity securities tothe Wells Fargo Foundation.
Income TaxesThe effective tax rate for 2003 was 34.6%, compared with35.5% for 2002. This reduction was primarily due to the taxbenefit derived from our donations of appreciated publicequity securities to the Wells Fargo Foundation.
Table 5: Noninterest Expense
(in millions) Year ended December 31, _ _ % Change2003 2002 2001 2003/ 2002/
2002 2001
Salaries $ 4,832 $ 4,383 $ 4,027 10% 9%Incentive compensation 2,054 1,706 1,195 20 43Employee benefits 1,560 1,283 960 22 34Equipment 1,246 1,014 909 23 12Net occupancy 1,177 1,102 975 7 13Operating leases 702 802 903 (12) (11)Contract services 866 546 538 59 1Outside professional services 509 445 441 14 1Outside data processing 404 350 319 15 10Advertising and promotion 392 327 276 20 18Travel and entertainment 389 337 286 15 18Telecommunications 343 347 355 (1) (2)Postage 336 256 242 31 6Stationery and supplies 241 226 242 7 (7)Charitable donations 237 39 54 508 (28)Insurance 197 169 167 17 1Operating losses 193 163 234 18 (30)Security 163 159 156 3 2Core deposit intangibles 142 155 165 (8) (6)Goodwill — — 610 — (100)All other 1,207 902 740 34 22
Total $17,190 $14,711 $13,794 17% 7%
Noninterest Expense
Operating Segment ResultsOur lines of business for management reporting consist ofCommunity Banking, Wholesale Banking and Wells FargoFinancial.
COMMUNITY BANKING’S net income increased 7% to $4.4 billionin 2003 from $4.1 billion in 2002. Revenue increased 12%from 2002. Net interest income increased to $11.5 billion in2003 from $10.4 billion in 2002, or 11%, due primarily togrowth in average consumer loans, mortgages held for saleand deposits. Average loans grew 30% and average coredeposits grew 11% from 2002. The provision for loan lossesincreased $27 million, or 3%, for 2003. Noninterest incomefor 2003 increased by $1.1 billion, or 14%, over 2002 pri-marily due to increased mortgage banking income, consumerloan fees, deposit service charges and gains from equity invest-ments. Noninterest expense increased by $2.0 billion, or 18%,in 2003 over 2002 due primarily to increased mortgage origi-nation activity and certain actions taken in 2003.
WHOLESALE BANKING’S net income increased 17% to $1.4 billionin 2003 from $1.2 billion in 2002, before the effect of changein accounting principle. Net interest income was $2.2 billion in2003 and $2.3 billion in 2002. Noninterest income increased$450 million to $2.8 billion in 2003 compared with 2002.The increase was primarily due to higher income in asset-based lending, insurance brokerage, commercial mortgageoriginations, derivatives and real estate brokerage. Noninterestexpense increased to $2.6 billion in 2003, compared with$2.4 billion for the prior year. The increase was largely dueto higher personnel expense, due to an increase in benefitcosts and team members, and higher minority interestexpense in partnership earnings within asset-based lending.
WELLS FARGO FINANCIAL’S net income increased 25% to $451 million in 2003 from $360 million, before the effect ofchange in accounting principle, in 2002, due to lower fundingcosts combined with growth in real estate secured and autoloans. The provision for loan losses increased by $82 millionin 2003 due to growth in loans. Noninterest income increased$24 million, or 7%, from 2002 to 2003, predominantly dueto increased loan and credit card fee income of $15 millionand a decrease in losses on sales of investment securities of$6 million. Noninterest expense increased $244 million, or22%, in 2003 from 2002, primarily due to increases inemployee compensation and benefits and other costs relatingto business expansion and acquisition.
For a more complete description of our operating seg-ments, including additional financial information and theunderlying management accounting process, see Note 20(Operating Segments) to Financial Statements.

44
Balance Sheet Analysis
Table 6: Mortgage-Backed Securities
(in billions) Fair Net unrealized Remainingvalue gain (loss) maturity
At December 31, 2003 $24.3 $ .9 6.5 yrs.
At December 31, 2003,assuming a 200 basis point:Increase in interest rates 21.7 (1.7) 9.6 yrs.Decrease in interest rates 25.1 1.7 2.4 yrs.
Table 7: Deposits
(in millions) December 31, %2003 2002 Change
Noninterest-bearing $ 74,387 $ 74,094 —%Interest-bearing checking 2,735 2,625 4Market rate and
other savings 114,362 99,183 15Savings certificates 19,787 22,332 (11)
Core deposits 211,271 198,234 7Other time deposits 27,488 9,228 198Deposits in foreign offices 8,768 9,454 (7)
Total deposits $247,527 $216,916 14%
Loan PortfolioA comparative schedule of average loan balances is includedin Table 3; year-end balances are in Note 5 (Loans andAllowance for Loan Losses) to Financial Statements.
Loans averaged $213.1 billion in 2003, compared with$174.5 billion in 2002, an increase of 22%. Total loans atDecember 31, 2003 were $253.1 billion, compared with$192.5 billion at year-end 2002, an increase of 31%.Mortgages held for sale decreased to $29.0 billion from$51.2 billion due to lower loan origination volume at theend of 2003. Most of the increase in loans was due to astrong demand for home mortgages and home equity loansand lines, as well as solid growth in credit card balances andconsumer finance receivables.
DepositsYear-end deposit balances are in Table 7. Comparative detailof average deposit balances is included in Table 3. Averagecore deposits funded 54.8% and 57.2% of average total assetsin 2003 and 2002, respectively. Total average interest-bearingdeposits rose from $133.8 billion in 2002 to $161.7 billionin 2003. Total average noninterest-bearing deposits rosefrom $63.6 billion in 2002 to $76.8 billion in 2003. Savingscertificates declined on average from $24.3 billion in 2002 to$20.9 billion in 2003.
The increase in other time deposits was predominantlydue to an increase in certificates of deposit greater than$100,000 sold to institutional customers.
A comparison between the year-end 2003 and 2002 balancesheets is presented below.
Securities Available for SaleOur securities available for sale portfolio includes both debtand marketable equity securities. We hold debt securitiesavailable for sale primarily for liquidity, interest rate riskmanagement and yield enhancement purposes. Accordingly,this portfolio primarily includes very liquid, high quality fed-eral agency debt securities. At December 31, 2003, we held$32.4 billion of debt securities available for sale, comparedwith $27.4 billion at December 31, 2002.
We had a net unrealized gain on debt securities availablefor sale of $1.3 billion at December 31, 2003 and $1.7 billionat December 31, 2002.
The weighted-average expected maturity of debt securitiesavailable for sale was 6.25 years at December 31, 2003.Since 75% of this portfolio is mortgage-backed securities,the expected remaining maturity may differ from contractualmaturity because borrowers may have the right to prepayobligations before the underlying mortgages mature.
The estimated effect of a 200 basis point increase ordecrease in interest rates on the fair value and the expectedremaining maturity of the mortgage-backed securities availablefor sale portfolio is in Table 6.
See Note 4 (Securities Available for Sale) to FinancialStatements for securities available for sale by security type.

45
Off-Balance Sheet Arrangements and Aggregate Contractual Obligations
Off-Balance Sheet Arrangements, Variable InterestEntities, Guarantees and Other CommitmentsWe consolidate our majority-owned subsidiaries and sub-sidiaries in which we are the primary beneficiary. If we ownat least 20% of an affiliate, we generally use the equity methodof accounting. If we own less than 20% of an affiliate, wegenerally carry the investment at cost. See Note 1 (Summaryof Significant Accounting Policies) to Financial Statementsfor our consolidation policy.
In the ordinary course of business, we engage in financialtransactions that are not recorded on the balance sheet, ormay be recorded on the balance sheet in amounts that aredifferent than the full contract or notional amount of thetransaction. These transactions are designed to (1) meet the financial needs of customers, (2) manage our credit,market or liquidity risks, (3) diversify our funding sourcesor (4) optimize capital, and are accounted for in accordancewith generally accepted accounting principles (GAAP).
Almost all of our off-balance sheet arrangements resultfrom securitizations. We routinely securitize home mortgageloans and, from time to time, other financial assets, includingstudent loans, commercial mortgages and automobile receiv-ables. We normally structure loan securitizations as sales, in accordance with FAS 140. This involves the transfer offinancial assets to certain qualifying special-purpose entitiesthat we are not required to consolidate. In a securitization,we can convert the assets into cash earlier than if we heldthe assets to maturity. Special-purpose entities used in thesetypes of securitizations obtain cash to acquire assets by issuingsecurities to investors. In a securitization, we usually providerepresentations and warranties for receivables transferred.Also, we generally retain the right to service the transferredreceivables and to repurchase those receivables from thespecial-purpose entity if the outstanding balance of thereceivable falls to a level where the cost exceeds the benefitsof servicing such receivables. The adoption of FIN 46 andFIN 46R did not affect our accounting for securitizationsinvolving qualifying special-purpose entities.
At December 31, 2003, our securitization arrangementsconsisted of approximately $46.9 billion in securitized loanreceivables, including $22.4 billion of home mortgage loans.We retained servicing rights and other beneficial interestsrelated to these securitizations of approximately $665 million,consisting of $274 million in securities, $229 million inservicing assets and $162 million in other retained interests.Related to securitizations, we provided $9 million in liquiditycommitments in demand notes and reserve fund balances, andcommitted to provide up to $30 million in credit enhancements.
Also, we hold variable interests greater than 20% butless than 50% in certain special-purpose entities formed toprovide affordable housing and to securitize high-yield corporate debt that had approximately $2 billion in totalassets at December 31, 2003, and a maximum estimatedexposure to loss of approximately $450 million. We are notrequired to consolidate these entities.
For more information on securitizations including salesproceeds and cash flows from securitizations, see Note 21(Securitizations and Variable Interest Entities) to FinancialStatements.
Our mortgage banking business, in the ordinary course ofbusiness, originates a portion of its mortgage loans throughunconsolidated joint ventures in which we own an interest of50% or less. Loans made by these joint ventures are fundedby Wells Fargo Home Mortgage, Inc., or an affiliated entity,through an established line of credit and are subject to speci-fied underwriting criteria. At December 31, 2003, the totalassets of these mortgage origination joint ventures wereapproximately $100 million. We provide liquidity to thesejoint ventures in the form of outstanding lines of credit and,at December 31, 2003, these liquidity commitments totaled$400 million.
We also hold interests in other unconsolidated joint ventures formed with unrelated third parties to provideefficiencies from economies of scale. A third party managesour real estate lending services joint ventures and providescustomers title, escrow, appraisal and other real estaterelated services. Our merchant services joint ventureincludes credit card processing and related activities. AtDecember 31, 2003, total assets of our real estate lendingand merchant services joint ventures were approximately$625 million.
When we acquire brokerage, asset management andinsurance agencies, the terms of the acquisitions may providefor deferred payments or additional consideration, based oncertain performance targets. At December 31, 2003, theamount of contingent consideration we expected to pay was not significant to the financial statements.
As a financial services provider, we routinely commit toextend credit, including loan commitments, standby letters ofcredit and financial guarantees. A significant portion of com-mitments to extend credit may expire without being drawnupon. These commitments are subject to the same creditpolicies and approval process used for our loans. For moreinformation, see Note 5 (Loans and Allowance for LoanLosses) and Note 25 (Guarantees) to Financial Statements.

46
Risk Management
Credit Risk Management ProcessOur credit risk management process provides for decentralizedmanagement and accountability by our lines of business. Ouroverall credit process includes comprehensive credit policies,frequent and detailed risk measurement and modeling, and acontinual loan audit review process. In addition, the externalauditor and regulatory examiners review and perform detailtests of our credit underwriting, loan administration andallowance processes.
Managing credit risk is a company-wide process. Wehave credit policies for all banking and nonbanking operationsincurring credit risk with customers or counterparties thatprovide a consistent, prudent approach to credit risk
management. We use detailed tracking and analysis to measure credit performance and exception rates and weroutinely review and modify credit policies as appropriate.We strive to identify problem loans early and have dedicated,specialized collection and work-out units.
The Chief Credit Officer, who reports directly to the ChiefExecutive Officer, provides company-wide credit oversight.Each business unit with credit risks has a credit officer andhas the primary responsibility for managing its own creditrisk. The Chief Credit Officer delegates authority, limits andother requirements to the business units. These delegationsare reviewed and amended if there are significant changes in personnel or credit performance.
Table 8: Contractual Obligations
(in millions) Note(s) Less than 1-3 3-5 More than Indeterminate Total1 year years years 5 years maturity (1)
Contractual payments by period:
Deposits 9 $49,010 $ 5,032 $ 1,628 $ 419 $191,438 $247,527Long-term debt (2) 6,11 12,294 21,065 12,090 18,193 — 63,642Operating leases 6 505 747 505 867 — 2,624Purchase obligations (3) __146 __192 __19 — — 357
Total contractual obligations $61,955 $27,036 $14,242 $19,479 $191,438 $314,150
(1) Represents interest- and noninterest-bearing checking, market rate and other savings accounts.(2) Includes capital leases of $25 million.(3) Represents agreements to purchase goods or services.
In our venture capital and capital markets businesses, wecommit to fund equity investments directly to investmentfunds and to specific private companies. The timing of futurecash requirements to fund these commitments generallydepends on the venture capital investment cycle, the periodover which privately-held companies are funded by venturecapital investors and ultimately taken public through an initialoffering. This cycle can vary based on market conditions andthe industry in which the companies operate. We expect thatmany of these investments will become public, or otherwisebecome liquid, before the balance of unfunded equity com-mitments is used. At December 31, 2003, these commitmentswere approximately $1.1 billion. Our other investmentcommitments, principally affordable housing, civic and othercommunity development initiatives, were approximately$230 million at December 31, 2003.
In the ordinary course of business, we enter into indem-nification agreements, including underwriting agreementsrelating to offers and sales of our securities, acquisitionagreements, and various other business transactions orarrangements, such as relationships arising from service as adirector or officer of the Company. For more information,see Note 25 (Guarantees) to Financial Statements.
Contractual Obligations We enter into contractual obligations in the ordinary courseof business, including debt issuances for the funding ofoperations and leases for premises and equipment.
Table 8 summarizes our significant contractual obligationsat December 31, 2003, except obligations for short-term bor-rowing arrangements and pension and postretirement benefitsplans. More information on these obligations is in Notes 10(Short-Term Borrowings) and 15 (Employee Benefits andOther Expenses) to Financial Statements.
We enter into derivatives, which create contractualobligations, as part of our interest rate risk managementprocess, for our customers or for other trading activities.See “Asset/Liability and Market Risk Management” in thisreport and Note 27 (Derivatives) to Financial Statementsfor more information.
Transactions with Related PartiesFAS 57, Related Party Disclosures, requires disclosure ofmaterial related party transactions, other than compensationarrangements, expense allowances and other similar items inthe ordinary course of business. The Company had no relatedparty transactions required to be reported under FAS 57 forthe years ended December 31, 2003, 2002 and 2001.

47
Our business units and the office of the Chief Credit Officerperiodically review all credit risk portfolios to ensure that therisk identification processes are functioning properly and thatcredit standards are followed. Our loan examiners and/orinternal auditors also independently review portfolios withcredit risk.
Our primary business focus, middle market commercialand residential real estate, auto and small consumer lending,results in portfolio diversification. We ensure that we useappropriate methods to understand and underwrite risk.
In our wholesale portfolios, loans are individually under-written and judgmentally risk rated. They are periodicallymonitored and prompt corrective actions are taken ondeteriorating loans.
Retail loans are typically underwritten with statisticaldecision-making tools and are managed throughout their lifecycle on a portfolio basis.
Each business unit completes quarterly asset quality fore-casts to quantify its intermediate-term outlook for loan lossesand recoveries, nonperforming loans and market trends. Tomake sure our overall allowance for loan losses is adequatewe conduct periodic stress tests. This includes a portfolioloss simulation model that simulates a range of possible lossesfor various sub-portfolios assuming various trends in loanquality. We assess loan portfolios for geographic, industry, orother concentrations and develop mitigation strategies, whichmay include loan sales, syndications or third party insurance,to minimize these concentrations as we deem necessary.
We routinely review and evaluate risks that are not borrower specific but that may influence the behavior of aparticular credit, group of credits or entire sub-portfolios.We also assess risk for particular industries and specificmacroeconomic trends.
Table 9: Nonaccrual Loans and Other Assets
(in millions) December 31,2003 2002 2001 2000 1999
Nonaccrual loans:Commercial $ 592 $ 796 $ 827 $ 739 $374Real estate 1-4 family first mortgage 274 230 205 128 144Other real estate mortgage 285 192 210 113 118Real estate construction 56 93 145 57 11Consumer:
Real estate 1-4 family junior lien mortgage 87 49 22 22 17Other revolving credit and installment 88 48 59 36 27
Total consumer 175 97 81 58 44Lease financing 73 79 163 92 24Foreign 3 5 9 7 9
Total nonaccrual loans (1) 1,458 1,492 1,640 1,194 724As a percentage of total loans .58% .78% .98% .77% .57%
Foreclosed assets 198 195 160 120 148Real estate investments (2) 6 4 2 27 33
Total nonaccrual loans andother assets $1,662 $1,691 $1,802 $1,341 $905
(1) Includes impaired loans of $629 million, $612 million, $823 million, $504 million and $258 million at December 31, 2003, 2002, 2001, 2000 and 1999, respectively.(See Notes 1 (Significant Accounting Policies) and 5 (Loans and Allowance for Loan Losses) to Financial Statements for further discussion of impaired loans.)
(2) Real estate investments (contingent interest loans accounted for as investments) that would be classified as nonaccrual if these assets were recorded as loans.Real estate investments totaled $9 million, $9 million, $24 million, $56 million and $89 million at December 31, 2003, 2002, 2001, 2000 and 1999, respectively.
NONACCRUAL LOANS AND OTHER ASSETS
Table 9 (above) shows the five-year trend for nonaccrual loansand other assets. We generally place loans on nonaccrualstatus (1) when they are 90 days (120 days with respect toreal estate 1-4 family first and junior lien mortgages) past duefor interest or principal (unless both well-secured and in theprocess of collection), (2) when the full and timely collectionof interest or principal becomes uncertain or (3) when part ofthe principal balance has been charged off. Note 1 (Summaryof Significant Accounting Policies) to Financial Statementsdescribes our accounting policy for nonaccrual loans.
We expect that the amount of nonaccrual loans willchange due to portfolio growth, routine problem loanrecognition and resolution through collections, sales or
charge-offs. The performance of any loan can be affectedby external factors, such as economic conditions, or factorsparticular to a borrower, such as actions of a borrower’smanagement. In addition, from time to time, we purchaseloans from other financial institutions that we classify asnonaccrual based on our policies.
If interest due on the book balances of all nonaccrualloans (including loans that were but are no longer onnonaccrual at year end) had been accrued under the originalterms, $92 million of interest would have been recorded in2003, compared with payments of $31 million recorded asinterest income.
Substantially all foreclosed assets at December 31, 2003,have been in the portfolio two years or less.

48
At December 31, 2003, the allowance for loan losses was $3.89 billion, or 1.54% of total loans, compared with$3.82 billion, or 1.98%, at December 31, 2002 and $3.72 billion, or 2.22%, at December 31, 2001. The primarydriver of the decrease in the allowance for loan losses as apercentage of total loans in 2003 and 2002 was the changein loan mix with residential real estate secured consumerloans representing a higher percentage of the overall loanportfolio. We have historically experienced lower losses onour residential real estate secured consumer loan portfolio.The provision for loan losses totaled $1.72 billion in 2003,$1.68 billion in 2002 and $1.73 billion in 2001. Net charge-offsin 2003 were $1.72 billion, or .81% of average total loans,compared with $1.68 billion, or .96%, in 2002 and$1.73 billion, or 1.10%, in 2001. Loan loss recoveries were$495 million in 2003, compared with $481 million in 2002and $396 million in 2001. Any loan with past due principalor interest that is not both well-secured and in the processof collection generally is charged off (to the extent that itexceeds the fair value of any related collateral) based on loancategory after a predetermined period of time. Also, loansare charged off when classified as a loss by either internalloan examiners or regulatory examiners.
We consider the allowance for loan losses of $3.89 billionadequate to cover credit losses inherent in the loan portfolio,including unfunded commitments, at December 31, 2003.The process for determining the adequacy of the allowancefor loan losses is critical to our financial results. It requiresmanagement to make difficult, subjective and complex judg-ments, as a result of the need to make estimates about theeffect of matters that are uncertain. See “Financial Review –Critical Accounting Policies – Allowance for Loan Losses.”Therefore, we cannot provide assurance that, in any particu-lar period, we will not have sizeable loan losses in relation tothe amount reserved. We may need to significantly increasethe allowance for loan losses, considering current factors at the time, including economic conditions and ongoinginternal and external examination processes. Our process fordetermining the adequacy of the allowance for loan losses isdiscussed in Note 5 (Loans and Allowance for Loan Losses)to Financial Statements.
Asset/Liability and Market Risk ManagementAsset/liability management involves the evaluation, monitoringand management of interest rate risk, market risk, liquidityand funding. The Corporate Asset/Liability ManagementCommittee (Corporate ALCO)—which oversees these risksand reports periodically to the Finance Committee of theBoard of Directors—consists of senior financial and businessexecutives. Each of our principal business groups—CommunityBanking (including Mortgage Banking), Wholesale Bankingand Wells Fargo Financial—have individual asset/liabilitymanagement committees and processes linked to theCorporate ALCO process.
ALLOWANCE FOR LOAN LOSSES
The allowance for loan losses is management’s estimate ofcredit losses inherent in the loan portfolio, including unfundedcommitments, at the balance sheet date. We assume that theallowance for loan losses as a percentage of charge-offs andnonperforming loans will change at different points in timebased on credit performance, loan mix and collateral values.The analysis of the changes in the allowance for loan losses,including charge-offs and recoveries by loan category, ispresented in Note 5 (Loans and Allowance for Loan Losses)to Financial Statements.
Table 10: Loans 90 Days or More Past Due and Still Accruing(Excluding Insured/Guaranteed GNMA Advances)
(in millions) December 31,2003 2002 2001 2000 1999
Commercial $ 87 $ 92 $ 60 $ 90 $ 27Real estate
1-4 family first mortgage 117 104 145 74 45
Other real estate mortgage 9 7 22 24 18
Real estate construction 6 11 47 12 4
Consumer:Real estate
1-4 family junior lien mortgage 31 19 18 19 36
Credit card 135 131 117 96 105Other revolving
credit and installment 311 308 289 263 198
Total consumer 477 458 424 378 339
Total $696 $672 $698 $578 $433
LOANS 90 DAYS OR MORE PAST DUE AND STILL ACCRUING
Loans included in this category are 90 days or more past dueas to interest or principal and still accruing, because they are(1) well-secured and in the process of collection or (2) realestate 1-4 family first mortgage loans or consumer loans exemptunder regulatory rules from being classified as nonaccrual.
The total of loans 90 days past due and still accruing was $2,337 million, $672 million, $698 million, $578 million,and $433 million at December 31, 2003, 2002, 2001, 2000 and1999, respectively. In 2003, the total included $1,641 million inadvances pursuant to our servicing agreements to GovernmentNational Mortgage Association (GNMA) mortgage pools whoserepayments are insured by the Federal Housing Administrationor guaranteed by the Department of Veterans Affairs. Prior toclarifying guidance issued in 2003 as to classification as loans,GNMA advances were included in other assets. Table 10provides detail by loan category excluding GNMA advances.

49
INTEREST RATE RISK
Interest rate risk, which potentially can have a significantearnings impact, is an integral part of being a financial inter-mediary. We are subject to interest rate risk because:
• assets and liabilities may mature or re-price at differenttimes (for example, if assets re-price faster than liabilitiesand interest rates are generally falling, earnings willinitially decline);
• assets and liabilities may re-price at the same time but bydifferent amounts (for example, when the general levelof interest rates is falling, we may reduce rates paid onchecking and savings deposit accounts by an amount thatis less than the general decline in market interest rates);
• short-term and long-term market interest rates may changeby different amounts (i.e., the shape of the yield curve mayaffect new loan yields and funding costs differently); or
• the remaining maturity of various assets or liabilities mayshorten or lengthen as interest rates change (for example,if long-term mortgage interest rates decline sharply,mortgage-backed securities held in the securities availablefor sale portfolio may prepay significantly earlier thananticipated – which could reduce portfolio income). Inaddition, interest rates may have an indirect impact onloan demand, credit losses, mortgage origination volume,the value of mortgage servicing rights, the value of thepension liability and other sources of earnings.
We assess interest rate risk by comparing our most likelyearnings plan over a twelve-month period with various earn-ings models using many interest rate scenarios that differ inthe direction of interest rate changes, the degree of changeover time, the speed of change and the projected shape of theyield curve. For example, if we assume a gradual increase of375 basis points in the federal funds rate, estimated earningswould be less than 1% below our most likely earnings planfor 2004. Simulation estimates depend on, and will changewith, the size and mix of our actual and projected balancesheet at the time of each simulation.
We use exchange-traded and over-the-counter interest ratederivatives to hedge our interest rate exposures. The creditrisk amount and estimated net fair values of these derivativesas of December 31, 2003 and 2002 are presented in Note 27(Derivatives) to Financial Statements. We use derivatives forasset/liability management in three ways:
• to convert most of the long-term fixed-rate debt to floating-rate payments by entering into receive-fixedswaps at issuance,
• to convert the cash flows from selected asset and/or liability instruments/portfolios from fixed to floatingpayments or vice versa, and
• to hedge the mortgage origination pipeline, fundedmortgage loans and mortgage servicing rights usingswaptions, futures, forwards and options.
MORTGAGE BANKING INTEREST RATE RISK
We originate, fund and service mortgage loans, which subjectsus to a number of risks, including credit, liquidity and interestrate risks. We manage credit and liquidity risk by selling orsecuritizing most of the mortgage loans we originate. Changesin interest rates, however, may have a significant effect onmortgage banking income in any quarter and over time.Interest rates impact both the value of the mortgage servicingrights (MSRs), which is adjusted to the lower of cost or fairvalue, and the future earnings of the mortgage business,which are driven by origination volume and the duration ofour servicing. We manage both risks by hedging the impactof interest rates on the value of the MSRs using derivatives,combined with the “natural hedge” provided by the origina-tion and servicing components of the mortgage business;however, we do not hedge 100% of these two risks.
We hedge a significant portion of the value of our MSRsagainst a change in interest rates with derivatives. The prin-cipal source of risk in this hedging process is the risk thatchanges in the value of the hedging contracts may not matchchanges in the value of the hedged portion of our MSRs forany given change in long-term interest rates.
The value of our MSRs is influenced primarily by prepay-ment speed assumptions affecting the duration of the mort-gage loans to which our MSRs relate. Changes in long-terminterest rates affect these prepayment speed assumptions. For example, a decrease in long-term rates would accelerateprepayment speed assumptions as borrowers refinance theirexisting mortgage loans and decrease the value of the MSRs.In contrast, prepayment speed assumptions would tend toslow in a rising interest rate environment and increase thevalue of the MSRs.
For a given decline in interest rates, a portion of thepotential reduction in the value of our MSRs is offset by estimated increases in origination and servicing fees overtime from new mortgage activity or refinancing associatedwith that decline in interest rates. With much lower long-term interest rates, the decline in the value of our MSRs andthe effect on net income would be immediate whereas theadditional origination and servicing fee income accrues overtime. Under GAAP, impairment of our MSRs, due to adecrease in long-term rates or other reasons, is charged toearnings through an increase to the valuation allowance.
In scenarios of sustained increases in long-term interestrates, origination fees may eventually decline as refinancingactivity slows. In such higher interest rate scenarios, theduration of the servicing portfolio may extend. In such circumstances, we may reduce periodic amortization ofMSRs, and may recover some or all of the previouslyestablished valuation allowance.

50
Our MSRs totaled $6.9 billion, net of a valuationallowance of $1.9 billion at December 31, 2003, and $4.5 billion, net of a valuation allowance of $2.2 billion, at December 31, 2002. The increase in MSRs was primarilydue to the growth in the servicing portfolio resulting fromoriginations and purchases. The note rate on the servicingportfolio was 5.90% at December 31, 2003 and 6.67% atDecember 31, 2002. Our MSRs were 1.15% of mortgageloans serviced for others at December 31, 2003, comparedwith .92% at December 31, 2002.
MARKET RISK – TRADING ACTIVITIES
Our net income is exposed to interest rate risk, foreignexchange risk, equity price risk, commodity price risk andcredit risk in several trading businesses managed under limitsset by Corporate ALCO. The primary purpose of these busi-nesses is to accommodate customers in the management oftheir market price risks. Also, we take positions based onmarket expectations or to benefit from price differencesbetween financial instruments and markets, subject to risklimits established and monitored by Corporate ALCO. Allsecurities, loans, foreign exchange transactions, commoditytransactions and derivatives—transacted with customers orused to hedge capital market transactions with customers—are carried at fair value. The Institutional Risk Committeeestablishes and monitors counterparty risk limits. The notionalor contractual amount, credit risk amount and estimated netfair value of all customer accommodation derivatives atDecember 31, 2003 and 2002 are included in Note 27(Derivatives) to Financial Statements. Open, “at risk” posi-tions for all trading business are monitored by CorporateALCO. During 2003 the maximum daily “value at risk,”the worst expected loss over a given time interval within agiven confidence range (99%), for all trading positions cov-ered by value at risk measures did not exceed $25 million.
MARKET RISK – EQUITY MARKETS
We are directly and indirectly affected by changes in the equitymarkets. We make and manage direct equity investments instart-up businesses, emerging growth companies, manage-ment buy-outs, acquisitions and corporate recapitalizations.We also invest in non-affiliated funds that make similar pri-vate equity investments. These private equity investments aremade within capital allocations approved by management andthe Board of Directors. The Board reviews business develop-ments, key risks and historical returns for the private equityinvestments at least annually. Management reviews theseinvestments at least quarterly and assesses them for possibleother-than-temporary impairment. For nonmarketable invest-ments, the analysis is based on facts and circumstances ofeach individual investment and the expectations for thatinvestment’s cash flows and capital needs, the viability of itsbusiness model and our exit strategy. At December 31, 2003,private equity investments totaled $1,714 million, comparedwith $1,657 million at December 31, 2002.
We also have marketable equity securities in the availablefor sale investment portfolio, including shares distributedfrom our venture capital activities. We manage these invest-ments within capital risk limits approved by managementand the Board and monitored by Corporate ALCO. Gainsand losses on these securities are recognized in net incomewhen realized and, in addition, other-than-temporary impair-ment may be periodically recorded. The initial indicator ofimpairment for marketable equity securities is a sustaineddecline in market price below the amount recorded for thatinvestment. We consider a variety of factors, such as thelength of time and the extent to which the market value hasbeen less than cost; the issuer’s financial condition, capitalstrength, and near-term prospects; any recent events specificto that issuer and economic conditions of its industry; and,to a lesser degree, our investment horizon in relationship toan anticipated near-term recovery in the stock price, if any.At December 31, 2003, the fair value of marketable equitysecurities was $582 million and cost was $394 million,compared with $556 million and $598 million, respectively,at December 31, 2002.
Changes in equity market prices may also indirectly affectour net income (1) by affecting the value of third party assetsunder management and, hence, fee income, (2) by affectingparticular borrowers, whose ability to repay principal and/or interest may be affected by the stock market, or (3) byaffecting brokerage activity, related commission income andother business activities. Each business line monitors andmanages these indirect risks.
LIQUIDITY AND FUNDING
The objective of effective liquidity management is to ensurethat we can meet customer loan requests, customer depositmaturities/withdrawals and other cash commitments effi-ciently under both normal operating conditions and underunpredictable circumstances of industry or market stress. To achieve this objective, Corporate ALCO establishes andmonitors liquidity guidelines that require sufficient asset-basedliquidity to cover potential funding requirements and toavoid over-dependence on volatile, less reliable fundingmarkets. We set liquidity management guidelines for boththe consolidated balance sheet as well as for the Parentspecifically to ensure that the Parent is a source of strengthfor its regulated, deposit-taking banking subsidiaries.
Debt securities in the securities available for sale portfolioprovide asset liquidity, in addition to the immediately liquidresources of cash and due from banks and federal fundssold and securities purchased under resale agreements. Theweighted-average expected remaining maturity of the debtsecurities within this portfolio was 6.25 years at December 31,2003. Of the $31.1 billion (cost basis) of debt securities inthis portfolio at December 31, 2003, $6.6 billion, or 21%, isexpected to mature or be prepaid in 2004 and an additional$4.3 billion, or 13%, in 2005. Asset liquidity is furtherenhanced by our ability to sell or securitize loans in secondarymarkets through whole-loan sales and securitizations.

51
In 2003, we sold mortgage loans of approximately $400 billion,including securitized home mortgage loans and commercialmortgage loans of approximately $320 billion. The amountof mortgage loans, as well as home equity loans and otherconsumer loans, available to be sold or securitized totaledapproximately $105 billion at December 31, 2003.
Core customer deposits have historically provided a size-able source of relatively stable and low-cost funds. Averagecore deposits and stockholders’ equity funded 63.3% and66.3% of average total assets in 2003 and 2002, respectively.
The remaining assets were funded by long-term debt,deposits in foreign offices, short-term borrowings (federalfunds purchased and securities sold under repurchase agree-ments, commercial paper and other short-term borrowings)and trust preferred securities. Short-term borrowings averaged$29.9 billion and $33.3 billion in 2003 and 2002, respectively.Long-term debt averaged $53.8 billion and $42.2 billion in2003 and 2002, respectively. Trust preferred securities averaged$3.3 billion and $2.8 billion in 2003 and 2002, respectively.
We anticipate making capital expenditures of approximately$930 million in 2004 for stores, relocation and remodelingof company facilities, routine replacement of furniture,equipment, servers and other networking equipment relatedto expansion of our internet services business. We will fundthese expenditures from various sources, including retainedearnings and borrowings.
Liquidity is also available through our ability to raisefunds in a variety of domestic and international money andcapital markets. We access capital markets for long-termfunding by issuing registered debt, private placements andasset-based secured funding. Approximately $70 billion ofour debt is rated by Moody’s Investors Service and Fitch,Inc. as “AA” or equivalent, which is among the highestratings given to a financial services company. In September2003, Moody’s Investors Service raised Wells Fargo Bank,N.A.’s rating to “Aaa,” its highest investment grade, from“Aa1” and raised the Company’s senior debt rating to“Aa1” from “Aa2.” In October 2003, Standard & Poor’sRatings Service raised the counterparty ratings on theCompany to “AA-minus/A-1-plus” from “A-plus/A-1” andthe revised outlook for the Company to stable from positive.Rating agencies base their ratings on many quantitative andqualitative factors, including capital adequacy, liquidity, asset quality, business mix and level and quality of earnings.Material changes in these factors could result in a differentdebt rating; however, a change in debt rating would notcause us to violate any of our debt covenants.
PARENT. In March 2003, the Parent registered with theSecurities and Exchange Commission (SEC) for issuance anadditional $15.3 billion in senior and subordinated notesand preferred and common securities. During 2003, the
Parent issued a total of $13.4 billion of senior and subordi-nated notes and trust preferred securities. At December 31,2003, the Parent’s remaining issuance capacity under effec-tive registration statements was $9.0 billion. We used theproceeds from securities issued in 2003 for general corporatepurposes and expect that the proceeds in the future will alsobe used for general corporate purposes. The Parent alsoissues commercial paper and has a $1 billion back-up credit facility.
On April 15, 2003, we issued $3 billion of convertiblesenior debentures as a private placement. In October 2003,these debentures were registered with the SEC. If the priceper share of our common stock exceeds $120.00 per shareon or before April 15, 2008, the holders will have the rightto convert the convertible debt securities to common stock at an initial conversion price of $100.00 per share. While weare able to settle the entire amount of the conversion rightsgranted in this convertible debt offering in cash, commonstock or a combination, our policy is to settle the principalamount in cash and to settle the conversion spread (theexcess conversion value over the principal) in either cash orstock. We can also redeem all or some of the convertibledebt securities for cash at any time on or after May 5, 2008,at their principal amount plus accrued interest, if any.
BANK NOTE PROGRAM. In March 2003, Wells Fargo Bank, N.A.established a $50 billion bank note program under which it may issue up to $20 billion in short-term senior notes outstanding at any time and up to a total of $30 billion inlong-term senior and subordinated notes. This programupdates and supercedes the bank note program establishedin February 2001. Securities are issued under this program as private placements in accordance with Office of theComptroller of the Currency (OCC) regulations. During2003, Wells Fargo Bank, N.A. issued $9.4 billion in seniorlong-term notes. At December 31, 2003, the remainingissuance authority under the long-term portion was $14.9 billion.
WELLS FARGO FINANCIAL. In November 2003, Wells FargoFinancial Canada Corporation (WFFCC), a wholly-ownedCanadian subsidiary of Wells Fargo Financial, Inc., qualifiedfor distribution with the provincial securities exchanges inCanada $1.5 billion (Canadian). The remaining issuancecapacity under previous registered securities of $550 million(Canadian) expired on November 1, 2003. During 2003,WFFCC issued $400 million (Canadian) in senior notes. At December 31, 2003, the remaining issuance capacity for WFFCC was $1.5 billion (Canadian). During 2003, Wells Fargo Financial, Inc. issued $500 million (US) and$400 million (Canadian) in senior notes as private placements.

52
Comparison of 2002 with 2001
Net income in 2002 was $5.4 billion, compared with$3.4 billion in 2001. Diluted earnings per common sharewere $3.16, compared with $1.97 in 2001.
Return on average assets (ROA) was 1.69% and returnon average common equity (ROE) was 18.68% in 2002,compared with 1.20% and 12.73%, respectively, in 2001.
Net interest income on a taxable-equivalent basis was$14.6 billion in 2002, compared with $12.1 billion in 2001.The net interest margin was 5.53% for 2002, compared with5.29% in 2001. The increase in net interest income and thenet interest margin in 2002 was due to a 10% increase inaverage core deposits, our low-cost source of funding. Alsocontributing to the increase in the net interest margin in2002 was a faster decline in deposit and borrowing coststhan the decline in loan and debt securities yields.
Noninterest income was $10.8 billion in 2002, com-pared with $9.0 billion in 2001. Noninterest income in2001 included approximately $1.7 billion (before tax) of other-than-temporary impairment in the valuation ofpublicly-traded securities and private equity investmentsrecorded in the second quarter of 2001.
Revenue, the sum of net interest income and noninterestincome, increased from $21.0 billion in 2001 to $25.2 billionin 2002, or 20%.
Noninterest expense totaled $14.7 billion in 2002, compared with $13.8 billion in 2001, an increase of 7%.The increase in 2002 was a result of increases in incentivecompensation, outside professional services, travel andentertainment and advertising, predominantly due to theincrease in mortgage origination volume.
The provision for loan losses was $1.68 billion in 2002,compared with $1.73 billion in 2001. During 2002, netcharge-offs were $1.68 billion, or .96% of average totalloans, compared with $1.73 billion, or 1.10%, during 2001.The allowance for loan losses was $3.82 billion, or 1.98%of total loans, at December 31, 2002, compared with$3.72 billion, or 2.22%, at December 31, 2001.
At December 31, 2002, total nonaccrual loans were$1.49 billion, or .8% of total loans, compared with $1.64billion, or 1.0%, at December 31, 2001. Foreclosed assetswere $195 million at December 31, 2002, compared with$160 million at December 31, 2001.
Capital Management
We have an active program for managing stockholder capital.Our objective is to produce above market long-term returnsby opportunistically using capital when returns are perceivedto be high and issuing/accumulating capital when such costsare perceived to be low.
We use capital to fund organic growth, acquire banks andother financial services companies, pay dividends and repur-chase our shares. During 2003, consolidated assets increasedby $39 billion, or 11%. Capital used for acquisitions in 2003totaled $1.4 billion. During 2002, the Board of Directorsauthorized the repurchase of up to 50 million additionalshares of our outstanding common stock. During 2003, werepurchased approximately 31 million shares of our commonstock. At December 31, 2003, the total remaining commonstock repurchase authority under the 2002 authorization wasapproximately 27 million shares. Total common stock dividendpayments in 2003 were $2.5 billion. In 2003, the Board ofDirectors approved two increases in our quarterly commonstock dividend, which increased it to 45 cents per share from28 cents per share in 2002, representing a 61% increase inthe quarterly dividend.
Our potential sources of capital include retained earnings,and issuances of common and preferred stock and subordi-nated debt. In 2003, retained earnings increased $3.5 billion,predominantly as a result of net income of $6.2 billion lessdividends of $2.5 billion. In 2003, we issued $1.3 billion ofcommon stock under various employee benefit and directorplans and under our dividend reinvestment program. Weissued $1.0 billion in subordinated debt and completed twoplacements of trust preferred securities in the amount of$700 million in 2003. On October 13, 2003, we called allshares of our Adjustable-Rate Cumulative, Series B preferredstock. The shares were redeemed on November 15, 2003 atthe stated liquidation price plus accrued dividends.
The Company and each of our subsidiary banks are subject to various regulatory capital adequacy requirementsadministered by the Federal Reserve Board and the OCC.Risk-based capital guidelines establish a risk-adjusted ratiorelating capital to different categories of assets and off-balancesheet exposures. At December 31, 2003, the Company andeach of our covered subsidiary banks were “well capitalized”under regulatory standards. See Note 26 (Regulatory andAgency Capital Requirements) to Financial Statements foradditional information.

53
We make forward-looking statements in this report and inother reports and proxy statements we file with the SEC. In addition, our senior management might make forward-looking statements orally to analysts, investors, the mediaand others.
Forward-looking statements include:• projections of our revenues, income, earnings per share,
capital expenditures, dividends, capital structure orother financial items;
• descriptions of plans or objectives of our managementfor future operations, products or services, includingpending acquisitions;
• forecasts of our future economic performance; and• descriptions of assumptions underlying or relating to
any of the foregoing.
In this report, for example, we make forward-lookingstatements discussing our expectations about:• future credit losses and nonperforming assets;• the future value of mortgage servicing rights;• the future value of equity securities, including those
in our venture capital portfolios;• the impact of new accounting standards;• future short-term and long-term interest rate levels
and their impact on our net interest margin, net income, liquidity and capital; and
• the impact of the VISA USA Inc. settlement on our earnings.
Forward-looking statements discuss matters that are not historical facts. Because they discuss future events orconditions, forward-looking statements often include wordssuch as “anticipate,” “believe,” “estimate,” “expect,” “intend,”“plan,” “project,” “target,” “can,” “could,” “may,” “should,”“will,” “would” or similar expressions. Do not unduly relyon forward-looking statements. They give our expectationsabout the future and are not guarantees. Forward-lookingstatements speak only as of the date they are made, and wemight not update them to reflect changes that occur after thedate they are made.
There are several factors—many beyond our control—thatcould cause results to differ significantly from our expectations.Some of these factors are described below. Other factors, suchas credit, market, operational, liquidity, interest rate and otherrisks, are described elsewhere in this report (see, for example,“Balance Sheet Analysis”). Factors relating to the regulationand supervision are described in our Annual Report on Form10-K for the year ended December 31, 2003. Any factordescribed in this report or in our 2003 Form 10-K could byitself, or together with one or more other factors, adverselyaffect our business, results of operations or financial condition.There are also other factors that we have not described in thisreport or in our 2003 Form 10-K that could cause results todiffer from our expectations.
Industry FactorsAS A FINANCIAL SERVICES COMPANY, OUR EARNINGS ARE SIGNIFICANTLY
AFFECTED BY GENERAL BUSINESS AND ECONOMIC CONDITIONS.
Our business and earnings are affected by general businessand economic conditions in the United States and abroad.These conditions include short-term and long-term interestrates, inflation, monetary supply, fluctuations in both debtand equity capital markets, and the strength of the U.S.economy and the local economies in which we operate. Forexample, an economic downturn, an increase in unemploy-ment, or other events that effect household and/or corporateincomes could decrease the demand for loan and non-loanproducts and services and increase the number of customerswho fail to pay interest or principal on their loans.
Geopolitical conditions can also effect our earnings. Actsor threats of terrorism, actions taken by the U.S. or othergovernments in response to acts or threats of terrorismand/or military conflicts, could affect business and economicconditions in the U.S. and abroad. The terrorist attacks in2001, for example, caused an immediate decrease in air travel, which affected the airline industry, lodging, gamingand tourism.
We discuss other business and economic conditions inmore detail elsewhere in this report.
Factors That May Affect Future Results

54
OUR EARNINGS ARE SIGNIFICANTLY AFFECTED BY THE FISCAL AND
MONETARY POLICIES OF THE FEDERAL GOVERNMENT AND ITS AGENCIES.
The Board of Governors of the Federal Reserve System regu-lates the supply of money and credit in the United States. Itspolicies determine in large part our cost of funds for lendingand investing and the return we earn on those loans andinvestments, both of which affect our net interest margin.They also can materially affect the value of financial instru-ments we hold, such as debt securities and mortgage servicingrights. Its policies also can affect our borrowers, potentiallyincreasing the risk that they may fail to repay their loans.Changes in Federal Reserve Board policies are beyond ourcontrol and hard to predict.
THE FINANCIAL SERVICES INDUSTRY IS HIGHLY COMPETITIVE.
We operate in a highly competitive industry that could becomeeven more competitive as a result of legislative, regulatory andtechnological changes and continued consolidation. Banks,securities firms and insurance companies now can merge bycreating a “financial holding company,” which can offervirtually any type of financial service, including banking,securities underwriting, insurance (both agency and underwriting)and merchant banking. Recently, a number of foreign bankshave acquired financial services companies in the United States,further increasing competition in the U.S. market. Also, tech-nology has lowered barriers to entry and made it possible fornonbanks to offer products and services traditionally providedby banks, such as automatic transfer and automatic paymentsystems. Many of our competitors have fewer regulatoryconstraints and some have lower cost structures.
WE ARE HEAVILY REGULATED BY FEDERAL AND STATE AGENCIES.
The holding company, its subsidiary banks and many of itsnonbank subsidiaries are heavily regulated at the federal andstate levels. This regulation is to protect depositors, federaldeposit insurance funds and the banking system as a whole,not security holders. Congress and state legislatures and fed-eral and state regulatory agencies continually review bankinglaws, regulations and policies for possible changes. Changesto statutes, regulations or regulatory policies, including inter-pretation or implementation of statutes, regulations or poli-cies, could affect us in substantial and unpredictable waysincluding limiting the types of financial services and productswe may offer and/or increasing the ability of nonbanks tooffer competing financial services and products. Also, if wedo not comply with laws, regulations or policies, we couldreceive regulatory sanctions and damage to our reputation.For more information, refer to the “Regulation and Supervision”
section of our 2003 Form 10-K and to Notes 3 (Cash, Loanand Dividend Restrictions) and 26 (Regulatory and AgencyCapital Requirements) to Financial Statements included inthis report.
FUTURE LEGISLATION COULD CHANGE OUR COMPETITIVE POSITION.
Legislation is from time to time introduced in the Congress,including proposals to substantially change the financialinstitution regulatory system and to expand or contract thepowers of banking institutions and bank holding companies.This legislation may change banking statutes and our operatingenvironment in substantial and unpredictable ways. If enacted,such legislation could increase or decrease the cost of doingbusiness, limit or expand permissible activities or affect thecompetitive balance among banks, savings associations, creditunions, and other financial institutions. We cannot predictwhether any of this potential legislation will be enacted, andif enacted, the effect that it, or any regulations, would haveon our financial condition or results of operations.
WE DEPEND ON THE ACCURACY AND COMPLETENESS OF INFORMATION
ABOUT CUSTOMERS AND COUNTERPARTIES.
In deciding whether to extend credit or enter into othertransactions with customers and counterparties, we may relyon information furnished to us by or on behalf of customersand counterparties, including financial statements and otherfinancial information. We also may rely on representationsof customers and counterparties as to the accuracy and com-pleteness of that information and, with respect to financialstatements, on reports of independent auditors. For example,in deciding whether to extend credit, we may assume that acustomer’s audited financial statements conform with GAAPand present fairly, in all material respects, the financial condi-tion, results of operations and cash flows of the customer. Wealso may rely on the audit report covering those financialstatements. Our financial condition and results of operationscould be negatively affected by relying on financial statementsthat do not comply with GAAP or that are materially misleading.
CONSUMERS MAY DECIDE NOT TO USE BANKS TO COMPLETE THEIR
FINANCIAL TRANSACTIONS.
Technology and other changes now allow parties to completefinancial transactions without banks. For example, consumerscan pay bills and transfer funds directly without banks. Theprocess of eliminating banks as intermediaries, known as“disintermediation,” could result in the loss of fee income, aswell as the loss of customer deposits and income generatedfrom those deposits.

55
Company FactorsMAINTAINING OR INCREASING OUR MARKET SHARE DEPENDS ON
MARKET ACCEPTANCE AND REGULATORY APPROVAL OF NEW
PRODUCTS AND SERVICES.
Our success depends, in part, on our ability to adapt ourproducts and services to evolving industry standards. Thereis increasing pressure to provide products and services atlower prices. This can reduce our net interest margin andrevenues from our fee-based products and services. In addition,the widespread adoption of new technologies, includinginternet services, could require us to make substantialexpenditures to modify or adapt our existing products andservices. We might not be successful in introducing newproducts and services, achieving market acceptance of ourproducts and services, or developing and maintaining loyal customers.
NEGATIVE PUBLIC OPINION COULD DAMAGE OUR REPUTATION AND
ADVERSELY IMPACT OUR EARNINGS.
Reputation risk, or the risk to our earnings and capital fromnegative public opinion, is inherent in our business. Negativepublic opinion can result from our actual or alleged conductin any number of activities, including lending practices, cor-porate governance and acquisitions, and from actions takenby government regulators and community organizations inresponse to those activities. Negative public opinion canadversely affect our ability to keep and attract customers andcan expose us to litigation and regulatory action. Becausevirtually all our businesses operate under the “Wells Fargo”brand, actual or alleged conduct by one business can result innegative public opinion about other Wells Fargo businesses.Although we take steps to minimize reputation risk in dealingwith our customers and communities, as a large diversifiedfinancial services company with a relatively high industryprofile, the risk will always be present in our organization.
THE HOLDING COMPANY RELIES ON DIVIDENDS FROM ITS SUBSIDIARIES
FOR MOST OF ITS REVENUE.
The holding company is a separate and distinct legal entityfrom its subsidiaries. It receives substantially all of its rev-enue from dividends from its subsidiaries. These dividendsare the principal source of funds to pay dividends on theholding company’s common and preferred stock and interestand principal on its debt. Various federal and/or state lawsand regulations limit the amount of dividends that our bankand certain of our nonbank subsidiaries may pay to the
holding company. Also, the holding company’s right toparticipate in a distribution of assets upon a subsidiary’s liquidation or reorganization is subject to the prior claimsof the subsidiary’s creditors. For more information, refer to“Regulation and Supervision—Dividend Restrictions” and“—Holding Company Structure” in our 2003 Form 10-K.
OUR ACCOUNTING POLICIES AND METHODS ARE KEY TO HOW WE
REPORT OUR FINANCIAL CONDITION AND RESULTS OF OPERATIONS.
THEY MAY REQUIRE MANAGEMENT TO MAKE ESTIMATES ABOUT
MATTERS THAT ARE UNCERTAIN.
Our accounting policies and methods are fundamental tohow we record and report our financial condition and resultsof operations. Our management must exercise judgment inselecting and applying many of these accounting policies andmethods so they comply with generally accepted accountingprinciples and reflect management’s judgment of the mostappropriate manner to report our financial condition andresults. In some cases, management must select the account-ing policy or method to apply from two or more alternatives,any of which might be reasonable under the circumstances yetmight result in our reporting materially different amounts thanwould have been reported under a different alternative. Note 1(Summary of Significant Accounting Policies) to FinancialStatements describes our significant accounting policies.
Three accounting policies are critical to presenting ourfinancial condition and results. They require management to make difficult, subjective or complex judgments aboutmatters that are uncertain. Materially different amountscould be reported under different conditions or using differ-ent assumptions. These critical accounting policies relate to:(1) the allowance for loan losses, (2) the valuation of mort-gage servicing rights, and (3) pension accounting. Because ofthe uncertainty of estimates about these matters, we cannotprovide any assurance that we will not:
• significantly increase our allowance for loan lossesand/or sustain loan losses that are significantly higherthan the reserve provided;
• recognize significant provision for impairment of ourmortgage servicing rights; or
• significantly increase our pension liability.
For more information, refer in this report to “CriticalAccounting Policies,” “Balance Sheet Analysis” and “Risk Management.”

56
WE HAVE BUSINESSES OTHER THAN BANKING.
We are a diversified financial services company. In additionto banking, we provide insurance, investments, mortgagesand consumer finance. Although we believe our diversityhelps lessen the effect when downturns affect any one seg-ment of our industry, it also means our earnings could besubject to different risks and uncertainties. We discuss someexamples below.
MERCHANT BANKING. Our merchant banking business, whichincludes venture capital investments, has a much greater riskof capital losses than our traditional banking business. Also,it is difficult to predict the timing of any gains from thisbusiness. Realization of gains from our venture capitalinvestments depends on a number of factors—many beyondour control—including general economic conditions, theprospects of the companies in which we invest, when thesecompanies go public, the size of our position relative to thepublic float, and whether we are subject to any resale restric-tions. Factors, such as a slowdown in consumer demand or a decline in capital spending, could result in declines in thevalues of our publicly-traded and private equity securities. If we determine that the declines are other-than-temporary,additional impairment charges would be recognized. Also,we will realize losses to the extent we sell securities at lessthan book value. For more information, see in this report“Balance Sheet Analysis – Securities Available for Sale.”
MORTGAGE BANKING. The effect of interest rates on our mort-gage business can be large and complex. Changes in interestrates can affect loan origination fees and loan servicing fees,which account for a significant portion of mortgage-relatedrevenues. A decline in mortgage rates generally increases thedemand for mortgage loans as borrowers refinance, but alsogenerally leads to accelerated payoffs in our mortgage servic-ing portfolio. Conversely, in a constant or increasing rateenvironment, we would expect fewer loans to be refinancedand a decline in payoffs in our servicing portfolio. We usedynamic, sophisticated models to assess the effect of interestrates on mortgage fees, amortization of mortgage servicingrights, and the value of mortgage servicing rights. The esti-mates of net income and fair value produced by these models,however, depend on assumptions of future loan demand,prepayment speeds and other factors that may overstate orunderstate actual experience. We use derivatives to hedge thevalue of our servicing portfolio but they do not cover the fullvalue of the portfolio. We cannot assure that the hedges willoffset significant decreases in the value of the portfolio. Formore information, see in this report “Critical AccountingPolicies – Valuation of Mortgage Servicing Rights” and“Asset /Liability and Market Risk Management.”
WE RELY ON OTHER COMPANIES TO PROVIDE KEY COMPONENTS OF
OUR BUSINESS INFRASTRUCTURE.
Third parties provide key components of our business infra-structure such as internet connections and network access.Any disruption in internet, network access or other voice ordata communication services provided by these third partiesor any failure of these third parties to handle current orhigher volumes of use could adversely affect our ability todeliver products and services to our customers and otherwiseto conduct our business. Technological or financial difficul-ties of a third party service provider could adversely affectour business to the extent those difficulties result in the inter-ruption or discontinuation of services provided by that party.
WE HAVE AN ACTIVE ACQUISITION PROGRAM.
We regularly explore opportunities to acquire financialinstitutions and other financial services providers. We cannotpredict the number, size or timing of acquisitions. We typicallydo not comment publicly on a possible acquisition or businesscombination until we have signed a definitive agreement.
Our ability to successfully complete an acquisition generallyis subject to regulatory approval. We cannot be certain whenor if, or on what terms and conditions, any required regulatoryapprovals will be granted. We might be required to sell banksor branches as a condition to receiving regulatory approval.
Difficulty in integrating an acquired company may causeus not to realize expected revenue increases, cost savings,increases in geographic or product presence, and/or otherprojected benefits from the acquisition. The integration couldresult in higher than expected deposit attrition (run-off), lossof key employees, disruption of our business or the businessof the acquired company, or otherwise adversely affect ourability to maintain relationships with customers and employeesor achieve the anticipated benefits of the acquisition. Also,the negative effect of any divestitures required by regulatoryauthorities in acquisitions or business combinations may begreater than expected.
LEGISLATIVE RISK
Our business model depends on sharing information amongthe family of companies owned by Wells Fargo to bettersatisfy our customers’ needs. Laws that restrict the ability ofour companies to share information about customers couldnegatively affect our revenue and profit.
OUR BUSINESS COULD SUFFER IF WE FAIL TO ATTRACT AND RETAIN
SKILLED PEOPLE.
Our success depends, in large part, on our ability to attractand retain key people. Competition for the best people inmost activities we engage in can be intense. We may not beable to hire the best people or to keep them.

57
Additional Information
Our common stock is traded on the New York StockExchange and the Chicago Stock Exchange. The commonstock prices in the graphs below were reported on the NewYork Stock Exchange Composite Transaction ReportingSystem. The number of holders of record of our commonstock was 96,634 at January 31, 2004.
200320022001
$60
50
40
30
PRICE RANGE OF COMMON STOCK–ANNUAL ($)
54.81
38.25
Indicates closing price at end of year
54.84
38.10
59.18
43.27
$60
50
40
30
PRICE RANGE OF COMMON STOCK–QUARTERLY ($)
4Q3Q2Q1Q
2002
4Q3Q2Q1Q
2003
Indicates closing price at end of quarter
42.90
50.75
48.12
53.44
38.10
54.84
51.60
43.30 43.27
49.13
45.01
52.80
48.90
53.71
59.18
51.68
Our annual reports on Form 10-K, quarterly reports onForm 10-Q, current reports on Form 8-K, and amendmentsto those reports, are available free of charge on or throughour website (www.wellsfargo.com), as soon as reasonablypracticable after they are electronically filed with or fur-nished to the SEC. Those reports and amendments are alsoavailable free of charge on the SEC’s website (www.sec.gov).
OUR STOCK PRICE CAN BE VOLATILE.
Our stock price can fluctuate widely in response to a varietyof factors including:
• actual or anticipated variations in our quarterly operating results;
• recommendations by securities analysts;• new technology used, or services offered, by
our competitors;• significant acquisitions or business combinations,
strategic partnerships, joint ventures or capital commitments by or involving us or our competitors;
• failure to integrate our acquisitions or realize anticipated benefits from our acquisitions;
• operating and stock price performance of other companies that investors deem comparable to us;
• news reports relating to trends, concerns and otherissues in the financial services industry;
• changes in government regulations; and• geopolitical conditions such as acts or threats of
terrorism or military conflicts.
General market fluctuations, industry factors and generaleconomic and political conditions and events, such as terror-ist attacks, economic slowdowns or recessions, interest ratechanges, credit loss trends or currency fluctuations, alsocould cause our stock price to decrease regardless of ouroperating results.

58
Wells Fargo & Company and Subsidiaries
Consolidated Statement of Income
(in millions, except per share amounts) Year ended December 31,2003 2002 2001
INTEREST INCOMESecurities available for sale $ 1,816 $ 2,424 $ 2,544Mortgages held for sale 3,136 2,450 1,595Loans held for sale 251 252 317Loans 13,937 13,045 13,977Other interest income 278 288 284
Total interest income 19,418 18,459 18,717
INTEREST EXPENSEDeposits 1,613 1,919 3,553Short-term borrowings 322 536 1,273Long-term debt 1,355 1,404 1,826Guaranteed preferred beneficial interests
in Company’s subordinated debentures 121 118 89Total interest expense 3,411 3,977 6,741
NET INTEREST INCOME 16,007 14,482 11,976Provision for loan losses 1,722 1,684 1,727Net interest income after provision for loan losses 14,285 12,798 10,249
NONINTEREST INCOMEService charges on deposit accounts 2,361 2,179 1,876Trust and investment fees 1,937 1,875 1,791Credit card fees 1,003 920 796Other fees 1,572 1,384 1,244Mortgage banking 2,512 1,713 1,671Operating leases 937 1,115 1,315Insurance 1,071 997 745Net gains on debt securities available for sale 4 293 316Net gains (losses) from equity investments 55 (327) (1,538)Other 930 618 789
Total noninterest income 12,382 10,767 9,005
NONINTEREST EXPENSESalaries 4,832 4,383 4,027Incentive compensation 2,054 1,706 1,195Employee benefits 1,560 1,283 960Equipment 1,246 1,014 909Net occupancy 1,177 1,102 975Operating leases 702 802 903Other 5,619 4,421 4,825
Total noninterest expense 17,190 14,711 13,794
INCOME BEFORE INCOME TAX EXPENSE AND EFFECT OF CHANGE IN ACCOUNTING PRINCIPLE 9,477 8,854 5,460
Income tax expense 3,275 3,144 2,049
NET INCOME BEFORE EFFECT OF CHANGE IN ACCOUNTING PRINCIPLE 6,202 5,710 3,411
Cumulative effect of change in accounting principle — (276) —
NET INCOME $ 6,202 $ 5,434 $ 3,411
NET INCOME APPLICABLE TO COMMON STOCK $ 6,199 $ 5,430 $ 3,397
EARNINGS PER COMMON SHARE BEFORE EFFECT OF CHANGE IN ACCOUNTING PRINCIPLEEarnings per common share $ 3.69 $ 3.35 $ 1.99
Diluted earnings per common share $ 3.65 $ 3.32 $ 1.97
EARNINGS PER COMMON SHAREEarnings per common share $ 3.69 $ 3.19 $ 1.99
Diluted earnings per common share $ 3.65 $ 3.16 $ 1.97
DIVIDENDS DECLARED PER COMMON SHARE $ 1.50 $ 1.10 $ 1.00
Average common shares outstanding 1,681.1 1,701.1 1,709.5
Diluted average common shares outstanding 1,697.5 1,718.0 1,726.9
The accompanying notes are an integral part of these statements.

59
Wells Fargo & Company and Subsidiaries
Consolidated Balance Sheet
(in millions, except shares) December 31,2003 2002
ASSETSCash and due from banks $ 15,547 $ 17,820Federal funds sold and securities
purchased under resale agreements 2,745 3,174Securities available for sale 32,953 27,947Mortgages held for sale 29,027 51,154Loans held for sale 7,497 6,665
Loans 253,073 192,478Allowance for loan losses 3,891 3,819
Net loans 249,182 188,659
Mortgage servicing rights, net 6,906 4,489Premises and equipment, net 3,534 3,688Goodwill 10,371 9,753Other assets 30,036 35,848
Total assets $387,798 $349,197
LIABILITIESNoninterest-bearing deposits $ 74,387 $ 74,094Interest-bearing deposits 173,140 142,822
Total deposits 247,527 216,916Short-term borrowings 24,659 33,446Accrued expenses and other liabilities 17,501 18,311Long-term debt 63,642 47,320Guaranteed preferred beneficial interests
in Company’s subordinated debentures — 2,885
Total liabilities 353,329 318,878
STOCKHOLDERS’ EQUITYPreferred stock 214 251Common stock – $12/3 par value, authorized 6,000,000,000 shares;
issued 1,736,381,025 shares 2,894 2,894Additional paid-in capital 9,643 9,498Retained earnings 22,842 19,355Cumulative other comprehensive income 938 976Treasury stock – 38,271,651 shares and 50,474,518 shares (1,833) (2,465)Unearned ESOP shares (229) (190)
Total stockholders’ equity 34,469 30,319
Total liabilities and stockholders’ equity $387,798 $349,197
The accompanying notes are an integral part of these statements.

60
Wells Fargo & Company and Subsidiaries
Consolidated Statement of Changes in Stockholders’ Equity and Comprehensive Income
(in millions, except shares) Number Preferred Common Additional Retained Cumulative Treasury Unearned Totalof common stock stock paid-in earnings other stock ESOP stock-
shares capital comprehensive shares holders’income equity
BALANCE DECEMBER 31, 2000 1,714,645,843 $385 $ 2,894 $ 9,337 $ 14,514 $524 $ (1,075) $(118) $26,461Comprehensive income
Net income – 2001 3,411 3,411Other comprehensive income, net of tax:
Translation adjustments (3) (3)Minimum pension liability adjustment (42) (42)Net unrealized gains on securities available
for sale and other retained interests 10 10Cumulative effect of the change in accounting
principle for derivatives and hedging activities 71 71Net unrealized gains on derivatives
and hedging activities 192 192Total comprehensive income 3,639Common stock issued 16,472,042 92 (236) 738 594Common stock issued for acquisitions 428,343 1 1 20 22Common stock repurchased (39,474,053) (1,760) (1,760)Preferred stock (192,000) issued to ESOP 192 15 (207) —Preferred stock released to ESOP (12) 171 159Preferred stock (158,517) converted
to common shares 3,422,822 (159) 3 156 —Preferred stock (4,000,000) redeemed (200) (200)Preferred stock dividends (14) (14)Common stock dividends (1,710) (1,710)Change in Rabbi trust assets
(classified as treasury stock) ______________ ______ ______ ______ ________ _____ (16) _____ (16)Net change (19,150,846) (167) — 99 1,452 228 (862) (36) 714
BALANCE DECEMBER 31, 2001 1,695,494,997 218 2,894 9,436 15,966 752 (1,937) (154) 27,175Comprehensive income
Net income – 2002 5,434 5,434Other comprehensive income, net of tax:
Translation adjustments 1 1Minimum pension liability adjustment 42 42Net unrealized gains on securities available
for sale and other retained interests 484 484Net unrealized losses on derivatives and
hedging activities (303) (303)Total comprehensive income 5,658Common stock issued 17,345,078 43 (168) 777 652Common stock issued for acquisitions 12,017,193 4 531 535Common stock repurchased (43,170,943) (2,033) (2,033)Preferred stock (238,000) issued to ESOP 239 17 (256) —Preferred stock released to ESOP (14) 220 206Preferred stock (205,727) converted
to common shares 4,220,182 (206) 12 194 —Preferred stock dividends (4) (4)Common stock dividends (1,873) (1,873)Change in Rabbi trust assets and similar
arrangements (classified as treasury stock) ______________ _____ ______ ________ _________ _____ 3 _____ 3Net change (9,588,490) 33 — 62 3,389 224 (528) (36) 3,144
BALANCE DECEMBER 31, 2002 1,685,906,507 251 2,894 9,498 19,355 976 (2,465) (190) 30,319Comprehensive income
Net income – 2003 6,202 6,202Other comprehensive income, net of tax:
Translation adjustments 26 26Net unrealized losses on securities available
for sale and other retained interests (117) (117)Net unrealized gains on derivatives and
hedging activities 53 53Total comprehensive income 6,164Common stock issued 26,063,731 63 (190) 1,221 1,094Common stock issued for acquisitions 12,399,597 66 585 651Common stock repurchased (30,779,500) (1,482) (1,482)Preferred stock (260,200) issued to ESOP 260 19 (279) —Preferred stock released to ESOP (16) 240 224Preferred stock (223,660) converted to
common shares 4,519,039 (224) 13 211 —Preferred stock (1,460,000) redeemed (73) (73)Preferred stock dividends (3) (3)Common stock dividends (2,527) (2,527)Change in Rabbi trust assets and similar
arrangements (classified as treasury stock) 97 97Other, net ______________ _____ _______ _______ 5 _____ _________ ______ 5Net change 12,202,867 (37) — 145 3,487 (38) 632 (39) 4,150
BALANCE DECEMBER 31, 2003 1,698,109,374 $214 $2,894 $9,643 $22,842 $938 $(1,833) $(229) $34,469
The accompanying notes are an integral part of these statements.

61
Wells Fargo & Company and Subsidiaries
Consolidated Statement of Cash Flows
(in millions) Year ended December 31,
2003 2002 2001
Cash flows from operating activities:Net income $ 6,202 $ 5,434 $ 3,411Adjustments to reconcile net income to net cash provided (used) by operating activities:
Provision for loan losses 1,722 1,684 1,727Provision for mortgage servicing rights in excess of fair value, net 1,092 2,135 1,124Depreciation and amortization 4,305 4,297 3,864Net losses (gains) on securities available for sale (62) (198) 726Net gains on mortgage loan origination/sales activities (1,801) (1,038) (705)Net gains on sales of loans (28) (19) (35)Net losses (gains) on dispositions of premises and equipment 46 52 (21)Net gains on dispositions of operations (29) (10) (122)Release of preferred shares to ESOP 224 206 159Net increase (decrease) in trading assets 1,248 (3,859) (1,219)Net increase (decrease) in deferred income taxes 1,698 305 (596)Net decrease (increase) in accrued interest receivable (148) 145 232Net decrease in accrued interest payable (63) (53) (269)Originations of mortgages held for sale (383,553) (286,100) (179,475)Proceeds from sales of mortgages held for sale 404,207 263,126 156,267Principal collected on mortgages held for sale 3,136 2,063 1,731Net increase in loans held for sale (832) (1,091) (206)Other assets, net (5,099) (4,466) (1,780)Other accrued expenses and liabilities, net (1,070) 1,929 5,075
Net cash provided (used) by operating activities 31,195 (15,458) (10,112)
Cash flows from investing activities:Securities available for sale:
Proceeds from sales 7,357 11,863 19,586Proceeds from prepayments and maturities 13,152 9,684 6,730Purchases (25,131) (7,261) (29,053)
Net cash paid for acquisitions (822) (588) (459)Increase in banking subsidiaries’ loan originations, net of collections (36,235) (18,992) (11,866)Proceeds from sales (including participations) of loans by banking subsidiaries 1,590 948 2,305Purchases (including participations) of loans by banking subsidiaries (15,087) (2,818) (1,104)Principal collected on nonbank entities’ loans 17,638 11,396 9,964Loans originated by nonbank entities (21,792) (14,621) (11,651)Purchases of loans by nonbank entities (3,682) — —Proceeds from dispositions of operations 34 94 1,191Proceeds from sales of foreclosed assets 264 473 279Net decrease (increase) in federal funds sold and securities
purchased under resale agreements 483 (475) (932)Net increase in mortgage servicing rights (3,875) (1,492) (2,912)Other, net 3,127 314 (825)
Net cash used by investing activities (62,979) (11,475) (18,747)
Cash flows from financing activities:Net increase in deposits 28,643 25,050 17,707Net increase (decrease) in short-term borrowings (8,901) (5,224) 8,793Proceeds from issuance of long-term debt 29,490 21,711 14,658Repayment of long-term debt (17,931) (10,902) (10,625)Proceeds from issuance of guaranteed preferred beneficial interests
in Company’s subordinated debentures 700 450 1,500Proceeds from issuance of common stock 944 578 484Redemption of preferred stock (73) — (200)Repurchase of common stock (1,482) (2,033) (1,760)Payment of cash dividends on preferred and common stock (2,530) (1,877) (1,724)Other, net 651 32 16
Net cash provided by financing activities 29,511 27,785 28,849
Net change in cash and due from banks (2,273) 852 (10)
Cash and due from banks at beginning of year 17,820 16,968 16,978
Cash and due from banks at end of year $ 15,547 $ 17,820 $ 16,968
Supplemental disclosures of cash flow information:Cash paid during the year for:
Interest $ 3,348 $ 3,924 $ 6,472Income taxes 2,713 2,789 2,552
Noncash investing and financing activities:Net transfers from mortgages held for sale to loans 368 439 1,230Net transfers between loans held for sale and loans — 829 —Transfers from loans to foreclosed assets 411 491 325
The accompanying notes are an integral part of these statements.

62
Notes to Financial Statements
Wells Fargo & Company is a diversified financial servicescompany. We provide banking, insurance, investments, mortgagebanking and consumer finance through stores, the internetand other distribution channels to consumers, businesses and institutions in all 50 states of the U.S. and in othercountries. In this Annual Report, Wells Fargo & Companyand Subsidiaries (consolidated) are called the Company.Wells Fargo & Company (the Parent) is a financial holdingcompany and a bank holding company.
Our accounting and reporting policies conform with generally accepted accounting principles (GAAP) and practices in the financial services industry. To prepare thefinancial statements in conformity with GAAP, managementmust make estimates and assumptions that affect the reportedamounts of assets and liabilities at the date of the financialstatements and income and expenses during the reportingperiod. Management has made significant estimates in severalareas, including the allowance for loan losses (Note 5),valuing mortgage servicing rights (Notes 21 and 22) andpension accounting (Note 15). Actual results could differfrom those estimates.
The following is a description of our significant accounting policies.
ConsolidationOur consolidated financial statements include the accountsof the Parent and our majority-owned subsidiaries andvariable interest entities (VIEs) (defined below) in which weare the primary beneficiary, which we consolidate line byline. Significant intercompany accounts and transactions areeliminated in consolidation. If we own at least 20% of anaffiliate, we generally account for the investment using theequity method. If we own less than 20% of an affiliate, wegenerally carry the investment at cost, except marketableequity securities, which we carry at fair value with changesin fair value included in other comprehensive income. Assetsaccounted for under the equity or cost method are includedin other assets.
In January 2003, the Financial Accounting Standards Board(FASB) issued Interpretation No. 46 (FIN 46), Consolidationof Variable Interest Entities and, in December 2003, issuedRevised Interpretation No. 46, Consolidation of VariableInterest Entities (FIN 46R), which replaced FIN 46. This setforth the rules of consolidation for certain entities, VIEs, inwhich the equity investors do not have a controlling financialinterest or do not have enough equity at risk for the entity tofinance its activities without additional subordinated financialsupport from other parties. An enterprise’s variable interestarises from contractual, ownership or other monetary interestsin the entity, which change with fluctuations in the entity’s netasset value. Effective for VIEs formed after January 31, 2003,
and effective for all existing VIEs on December 31, 2003, we consolidate a VIE if we are the primary beneficiary becausewe will absorb a majority of the entity’s expected losses, receivea majority of the entity’s expected residual returns, or both.
SecuritiesSECURITIES AVAILABLE FOR SALE Debt securities that we might nothold until maturity and marketable equity securities are classi-fied as securities available for sale and reported at estimatedfair value. Unrealized gains and losses, after applicable taxes,are reported in cumulative other comprehensive income. Weuse current quotations, where available, to estimate the fairvalue of these securities. Where current quotations are notavailable, we estimate fair value based on the present value of future cash flows, adjusted for the quality rating of the securities, prepayment assumptions and other factors.
We reduce the asset value when we consider the declines in the value of debt securities and marketable equity securitiesto be other-than-temporary and record the estimated loss innoninterest income. The initial indicator of impairment for bothdebt and marketable equity securities is a sustained decline inmarket price below the amount recorded for that investment.We consider the length of time and the extent to which marketvalue has been less than cost and any recent events specific tothe issuer and economic conditions of its industry.
For marketable equity securities, we also consider:• the issuer’s financial condition, capital strength, and
near-term prospects; and• to a lesser degree, our investment horizon in relationship
to an anticipated near-term recovery in the stock price, if any.
For debt securities we also consider:• The cause of the price decline—general level of interest
rates and broad industry factors or issuer-specific; • The issuer’s financial condition and current ability to
make future payments in a timely manner;• Our investment horizon;• The issuer’s past ability to service debt; and• Any change in agencies’ ratings at evaluation date from
acquisition date and any likely imminent action.
We manage these investments within capital risk limitsapproved by management and the Board and monitored bythe Corporate Asset/Liability Management Committee. We recognize realized gains and losses on the sale of these securitiesin noninterest income using the specific identification method.For certain debt securities (for example, Government NationalMortgage Association securities), we anticipate prepaymentsof principal in calculating the effective yield used to accretediscounts or amortize premiums to interest income.
Note 1: Summary of Significant Accounting Policies
63
TRADING SECURITIES Securities that we acquire for short-termappreciation or other trading purposes are recorded in atrading portfolio. They are carried at fair value, with unreal-ized gains and losses recorded in noninterest income. Weinclude trading securities in other assets in the balance sheet.
NONMARKETABLE EQUITY SECURITIES Nonmarketable equitysecurities include venture capital equity securities that are notpublicly traded and securities acquired for various purposes,such as to meet regulatory requirements (for example, FederalReserve Bank stock). We review these assets at least quarterlyfor possible other-than-temporary impairment. Our reviewtypically includes an analysis of the facts and circumstancesof each investment, the expectations for the investment’scash flows and capital needs, the viability of its businessmodel and our exit strategy. These securities generally areaccounted for at cost and are included in other assets. Wereduce the asset value when we consider declines in value tobe other-than-temporary. We recognize the estimated loss asa loss from equity investments in noninterest income.
Mortgages Held for SaleMortgages held for sale are stated at the lower of total costor market value. Gains and losses on loan sales (sales proceedsminus carrying value) are recorded in noninterest income.
Loans Held for SaleLoans held for sale are carried at the lower of cost or marketvalue. Gains and losses on loan sales (sales proceeds minuscarrying value) are recorded in noninterest income.
LoansLoans are reported at the principal amount outstanding, net of unearned income, except for purchased loans, whichare recorded at fair value on the purchase date. Unearnedincome includes deferred fees net of deferred direct incre-mental loan origination costs. We amortize unearned incometo interest income, generally over the contractual life of theloan, using the interest method.
NONACCRUAL LOANS We generally place loans on nonaccrualstatus (1) when they are 90 days (120 days with respect toreal estate 1-4 family first and junior lien mortgages) past duefor interest or principal (unless both well-secured and in theprocess of collection), (2) when the full and timely collectionof interest or principal becomes uncertain or (3) when partof the principal balance has been charged off. Generally, consumer loans not secured by real estate are placed onnonaccrual status only when part of the principal has beencharged off. These loans are entirely charged off whendeemed uncollectible or when they reach a predeterminednumber of days past due based on loan product, industrypractice, country, terms and other factors.
When we place a loan on nonaccrual status, we reversethe accrued and unpaid interest receivable and account forthe loan on the cash or cost recovery method, until it qualifiesfor return to accrual status. Generally, we return a loan toaccrual status (a) when all delinquent interest and principalbecomes current under the terms of the loan agreement or(b) when the loan is both well-secured and in the process ofcollection and collectibility is no longer doubtful.
IMPAIRED LOANS We assess, account for and disclose as impairedcertain nonaccrual commercial loans and commercial realestate mortgage and construction loans that are over $1 million.We consider a loan to be impaired when, based on currentinformation and events, we will probably not be able to collect all amounts due according to the loan contract,including scheduled interest payments.
When we identify a loan as impaired, we measure theimpairment using discounted cash flows, except when thesole (remaining) source of repayment for the loan is theoperation or liquidation of the collateral. In these cases weuse the current fair value of the collateral, less selling costs,instead of discounted cash flows.
If we determine that the value of the impaired loan is lessthan the recorded investment in the loan (including accruedinterest, net deferred loan fees or costs and unamortizedpremium or discount), we recognize an impairment througha charge-off to the allowance.
ALLOWANCE FOR LOAN LOSSES The allowance for loan losses ismanagement’s estimate of credit losses inherent in the loanportfolio, including unfunded commitments, at the balancesheet date. Our determination of the allowance, and theresulting provision, is based on judgments and assumptions,including (1) general economic conditions, (2) loan portfoliocomposition, (3) loan loss experience, (4) management’sevaluation of credit risk relating to pools of loans and indi-vidual borrowers, (5) sensitivity analysis and expected lossmodels and (6) observations from our internal auditors,internal loan review staff or our banking regulators.
Transfers and Servicing of Financial AssetsWe account for a transfer of financial assets as a sale whenwe surrender control of the transferred assets. Servicingrights and other retained interests in the sold assets arerecorded by allocating the previously recorded investmentbetween the assets sold and the interest retained based ontheir relative fair values at the date of transfer. We determinethe fair values of servicing rights and other retained interestsat the date of transfer using the present value of estimatedfuture cash flows, using assumptions that market participantswould use in their estimates of values.

64
We recognize the rights to service mortgage loans for others,or mortgage servicing rights (MSRs), as assets whether wepurchase the servicing rights or securitize loans we originateand retain servicing rights. MSRs are amortized in proportionto, and over the period of, estimated net servicing income. Theamortization of MSRs is analyzed monthly and is adjusted toreflect changes in prepayment speeds.
To determine the fair value of MSRs, we use a valuationmodel that calculates the present value of estimated futurenet servicing income. We use assumptions in the valuationmodel that market participants would use in estimating futurenet servicing income, including estimates of prepayment speeds,discount rate, cost to service, escrow account earnings, con-tractual servicing fee income, ancillary income and late fees.
Each quarter, we evaluate MSRs for possible impairmentbased on the difference between the carrying amount andcurrent fair value, in accordance with Statement of FinancialAccounting Standards No. 140 (FAS 140), Accounting forTransfers and Servicing of Financial Assets and Extinguishmentsof Liabilities. To evaluate and measure impairment we stratifythe portfolio based on certain risk characteristics, includingloan type and note rate. If temporary impairment exists, weestablish a valuation allowance through a charge to netincome for any excess of amortized cost over the current fairvalue, by risk stratification. If we later determine that all or aportion of the temporary impairment no longer exists for aparticular risk stratification, we may reduce the valuationallowance through an increase to net income.
Under our policy, we also evaluate other-than-temporaryimpairment of MSRs by considering both historical andprojected trends in interest rates, pay off activity and whetherthe impairment could be recovered through interest rateincreases. We recognize a direct write-down when we determine that the recoverability of a recorded valuationallowance is remote. A direct write-down permanentlyreduces the carrying value of the MSRs, while a valuationallowance (temporary impairment) can be reversed.
Premises and EquipmentPremises and equipment are carried at cost less accumulateddepreciation and amortization. Capital leases are included inpremises and equipment at the capitalized amount less accu-mulated amortization.
Primarily we use the straight-line method of depreciationand amortization. Estimated useful lives range up to 40 yearsfor buildings, up to 10 years for furniture and equipment,and the shorter of the estimated useful life or lease term forleasehold improvements. We amortize capitalized leased assetson either the effective interest rate method or a straight-linebasis over the lives of the respective leases, up to 21 years.
Goodwill and Identifiable Intangible AssetsGoodwill is recorded when the purchase price is higher thanthe fair value of net assets acquired in business combinationsunder the purchase method of accounting. On July 1, 2001,we adopted FAS 142, Goodwill and Other Intangible Assets.FAS 142 eliminates amortization of goodwill from businesscombinations completed after June 30, 2001. During thetransition period from July 1, 2001 through December 31,2001, we continued to amortize goodwill from businesscombinations completed prior to July 1, 2001. EffectiveJanuary 1, 2002, all goodwill amortization was discontinued.
Effective January 1, 2002, we assess goodwill for impair-ment annually, and more frequently in certain circumstances.We assess goodwill for impairment on a reporting unit levelby applying a fair-value-based test using discounted estimatedfuture net cash flows. Impairment exists when the carryingamount of the goodwill exceeds its implied fair value. Werecognize impairment losses as a charge to noninterest expense(unless related to discontinued operations) and an adjustmentto the carrying value of the goodwill asset. Subsequentreversals of goodwill impairment are prohibited.
We amortize core deposit intangibles on an acceleratedbasis based on useful lives of 10 to 15 years. We review coredeposit intangibles for impairment whenever events or changesin circumstances indicate that their carrying amounts maynot be recoverable. Impairment is indicated if the sum ofundiscounted estimated future net cash flows is less thanthe carrying value of the asset. Impairment is permanentlyrecognized by writing down the asset to the extent that thecarrying value exceeds the estimated fair value.
Operating Lease AssetsOperating lease rental income for leased assets, generallyautomobiles, is recognized on a straight-line basis. Relateddepreciation expense is recorded on a straight-line basis overthe life of the lease taking into account the estimated residualvalue of the leased asset. On a periodic basis, leased assetsare reviewed for impairment. Impairment loss is recognizedif the carrying amount of leased assets exceeds fair value andis not recoverable. The carrying amount of leased assets isnot recoverable if it exceeds the sum of the undiscountedcash flows expected to result from the lease payments andthe estimated residual value upon the eventual disposition ofthe equipment. Auto lease receivables are written off when120 days past due.

65
Pension AccountingWe account for our defined benefit pension plans using anactuarial model required by FAS 87, Employers’ Accountingfor Pensions. This model allocates pension costs over the ser-vice period of employees in the plan. The underlying principleis that employees render service ratably over this period and,therefore, the income statement effects of pensions shouldfollow a similar pattern.
One of the principal components of the net periodic pension calculation is the expected long-term rate of returnon plan assets. The use of an expected long-term rate ofreturn on plan assets may cause us to recognize pensionincome returns that are greater or less than the actualreturns of plan assets in any given year.
The expected long-term rate of return is designed toapproximate the actual long-term rate of return over time.We generally hold the expected long-term rate of returnconstant so the pattern of income/expense recognition moreclosely matches the more stable pattern of services providedby our employees over the life of our pension obligation. Todetermine if the expected rate of return is reasonable, weconsider such factors as (1) the actual return earned on planassets, (2) historical rates of return on the various asset classesin the plan portfolio, (3) projections of returns on variousasset classes, and (4) current/prospective capital market conditions and economic forecasts. Any difference betweenactual and expected returns in excess of a 5% corridor (asdefined in FAS 87) is recognized in the net periodic pensioncalculation over the next five years.
We use a discount rate to determine the present value ofour future benefit obligations. The discount rate reflects therates available at the measurement date on high-qualityfixed-income debt instruments and is reset annually on themeasurement date (November 30).
Long-Term DebtBased upon current and anticipated levels of interest rates,we may extinguish long-term debt obligations to reduce ourlong-term funding costs and improve our liquidity. The earlytermination of these borrowings constitutes a normal part of our asset/liability management. Gains and losses on debtextinguishments and prepayment fees that are considered tobe part of our normal business operations are reported innoninterest income.
In connection with convertible debt issuances, while weare able to settle the entire amount of the conversion rightsin cash, common stock or a combination, it is our policy to settle the principal amount in cash, and to settle the conversion spread in either cash or stock.
Income TaxesWe file a consolidated federal income tax return and, in certain states, combined state tax returns.
We determine deferred income tax assets and liabilitiesusing the balance sheet method. Under this method, the netdeferred tax asset or liability is based on the tax effects ofthe differences between the book and tax bases of assets andliabilities, and recognizes enacted changes in tax rates andlaws. Deferred tax assets are recognized subject to manage-ment judgment that realization is more likely than not.Foreign taxes paid are applied as credits to reduce federalincome taxes payable.
Stock-Based CompensationWe have several stock-based employee compensation plans,which are described more fully in Note 14. As permitted byFAS 123, Accounting for Stock-Based Compensation, wehave elected to continue applying the intrinsic value methodof Accounting Principles Board Opinion 25, Accounting forStock Issued to Employees, in accounting for stock-basedemployee compensation plans. Pro forma net income andearnings per common share information is provided below, as if we accounted for employee stock option plans under the fair value method of FAS 123.
(in millions, except per share amounts) Year ended December 31,
2003 2002 2001
Net income, as reported $6,202 $5,434 $3,411
Add: Stock-based employee compensation expense included in reported net income, net of tax 3 3 4
Less: Total stock-based employee compensation expense under the fair value method for all awards,net of tax (198) (190) (150)
Net income, pro forma $6,007 $5,247 $3,265
Earnings per common share As reported $ 3.69 $ 3.19 $ 1.99Pro forma 3.57 3.08 1.91
Diluted earnings per common shareAs reported $ 3.65 $ 3.16 $ 1.97Pro forma 3.53 3.05 1.89
66
Earnings Per Common ShareWe present earnings per common share and diluted earningsper common share. We compute earnings per common shareby dividing net income (after deducting dividends on preferredstock) by the average number of common shares outstandingduring the year. We compute diluted earnings per commonshare by dividing net income (after deducting dividends onpreferred stock) by the average number of common sharesoutstanding during the year, plus the effect of common stockequivalents (for example, stock options, restricted sharerights and convertible debentures) that are dilutive.
Derivatives and Hedging ActivitiesWe recognize all derivatives on the balance sheet at fairvalue. On the date we enter into a derivative contract, wedesignate the derivative as (1) a hedge of the fair value of arecognized asset or liability (“fair value” hedge), (2) a hedgeof a forecasted transaction or of the variability of cashflows to be received or paid related to a recognized assetor liability (“cash flow” hedge) or (3) held for trading,customer accommodation or a contract not qualifying forhedge accounting (“free-standing derivative”). For a fairvalue hedge, we record changes in the fair value of thederivative and, to the extent that it is effective, changes inthe fair value of the hedged asset or liability, attributable tothe hedged risk, in current period net income in the samefinancial statement category as the hedged item. For acash flow hedge, we record changes in the fair value of the derivative to the extent that it is effective in other comprehensive income. We subsequently reclassify thesechanges in fair value to net income in the same period(s)that the hedged transaction affects net income in the samefinancial statement category as the hedged item. For free-standing derivatives, we report changes in the fair values in current period noninterest income.
We formally document the relationship between hedginginstruments and hedged items, as well as our risk manage-ment objective and strategy for various hedge transactions.This includes linking all derivatives designated as fair valueor cash flow hedges to specific assets and liabilities on thebalance sheet or to specific forecasted transactions. We alsoformally assess, both at the inception of the hedge and on anongoing basis, if the derivatives we use are highly effectivein offsetting changes in fair values or cash flows of hedgeditems. If we determine that a derivative is not highly effectiveas a hedge, we discontinue hedge accounting.
We discontinue hedge accounting prospectively when (1) aderivative is no longer highly effective in offsetting changes inthe fair value or cash flows of a hedged item, (2) a derivativeexpires or is sold, terminated, or exercised, (3) a derivative isdedesignated as a hedge, because it is unlikely that a forecastedtransaction will occur, or (4) we determine that designationof a derivative as a hedge is no longer appropriate.
When we discontinue hedge accounting because a deriva-tive no longer qualifies as an effective fair value hedge, wecontinue to carry the derivative on the balance sheet at itsfair value with changes in fair value included in earnings,and no longer adjust the previously hedged asset or liabilityfor changes in fair value. Previous adjustments to the hedgeditem are accounted for in the same manner as other compo-nents of the carrying amount of the asset or liability.
When we discontinue hedge accounting because it isprobable that a forecasted transaction will not occur, wecontinue to carry the derivative on the balance sheet at itsfair value with changes in fair value included in earnings,and immediately recognize gains and losses that were accu-mulated in other comprehensive income in earnings.
When we discontinue hedge accounting because thehedging instrument is sold, terminated, or no longer designated(dedesignated), the amount reported in other comprehensiveincome up to the date of sale, termination or dedesignationcontinues to be reported in other comprehensive income untilthe forecasted transaction affects earnings.
In all other situations in which we discontinue hedgeaccounting, the derivative will be carried at its fair value onthe balance sheet, with changes in its fair value recognized incurrent period earnings.
We occasionally purchase or originate financial instru-ments that contain an embedded derivative. At inception ofthe financial instrument, we assess (1) if the economic char-acteristics of the embedded derivative are clearly and closelyrelated to the economic characteristics of the financial instru-ment (host contract), (2) if the financial instrument thatembodies both the embedded derivative and the host con-tract is measured at fair value with changes in fair valuereported in earnings, and (3) if a separate instrument withthe same terms as the embedded instrument would meet thedefinition of a derivative. If the embedded derivative doesnot meet these three conditions, we separate it from the hostcontract and carry it at fair value with changes recorded incurrent period earnings.

67
We regularly explore opportunities to acquire financial ser-vices companies and businesses. Generally, we do not make apublic announcement about an acquisition opportunity untila definitive agreement has been signed.
Note 2: Business Combinations
For information on contingent consideration related toacquisitions, which are considered guarantees, see Note 25.
(in millions) Date Assets
2003Certain assets of Telmark, LLC, Syracuse, New York February 28 $ 660
Pacific Northwest Bancorp, Seattle, Washington October 31 3,245
Two Rivers Corporation, Grand Junction, Colorado October 31 74
Other (1) Various 136
$ 4,115
2002Texas Financial Bancorporation, Inc., Minneapolis, Minnesota February 1 $2,957
Five affiliated banks and related entities of Marquette Bancshares, Inc.located in Minnesota, Wisconsin, Illinois, Iowa and South Dakota February 1 3,086
Rediscount business of Washington Mutual Bank, FA, Philadelphia, Pennsylvania March 28 281
Tejas Bancshares, Inc., Amarillo, Texas April 26 374
Other (2) Various 94
$ 6,792
2001Conseco Finance Vendor Services Corporation, Paramus, New Jersey January 31 $ 860
ACO Brokerage Holdings Corporation (Acordia Group of Insurance Agencies), Chicago, Illinois May 1 866
H.D. Vest, Inc., Irving, Texas July 2 182
Other (3) Various 42
$ 1,950
(1) Consists of 14 acquisitions of asset management, commercial real estate brokerage, bankruptcy and insurance brokerage businesses.(2) Consists of 6 acquisitions of asset management, securities brokerage and insurance brokerage businesses.(3) Consists of 5 acquisitions of trust, consumer finance, securities brokerage and insurance brokerage businesses.
Federal Reserve Board regulations require that each of oursubsidiary banks maintain reserve balances on deposits withthe Federal Reserve Banks. The average required reserve bal-ance was $1.0 billion and $1.8 billion in 2003 and 2002,respectively.
Federal law restricts the amount and the terms of bothcredit and non-credit transactions between a bank and itsnonbank affiliates. They may not exceed 10% of the bank’scapital and surplus (which for this purpose represents Tier 1and Tier 2 capital, as calculated under the risk-based capitalguidelines, plus the balance of the allowance for loan lossesexcluded from Tier 2 capital) with any single nonbank affili-ate and 20% of the bank’s capital and surplus with all itsnonbank affiliates. Transactions that are extensions of creditmay require collateral to be held to provide added security tothe bank. (For further discussion of risk-based capital, seeNote 26).
Note 3: Cash, Loan and Dividend Restrictions
Dividends paid by our subsidiary banks are subject tovarious federal and state regulatory limitations. Dividendsthat may be paid by a national bank without the expressapproval of the Office of the Comptroller of the Currency(OCC) are limited to that bank’s retained net profits for thepreceding two calendar years plus retained net profits up tothe date of any dividend declaration in the current calendaryear. Retained net profits, as defined by the OCC, consistof net income less dividends declared during the period. Wealso have state-chartered subsidiary banks that are subject tostate regulations that limit dividends. Under those provisions,our national and state-chartered subsidiary banks couldhave declared additional dividends of $844 million and$1,585 million at December 31, 2003 and 2002, respectively,without obtaining prior regulatory approval. In addition,our nonbank subsidiaries could have declared additionaldividends of $1,682 million and $1,252 million atDecember 31, 2003 and 2002, respectively.

68
The following table shows the unrealized gross losses and fairvalue of securities in the securities available for sale portfolio atDecember 31, 2003, by length of time that individual securitiesin each category have been in a continuous loss position.
We had a limited number of securities in a continuousloss position for 12 months or more at December 31, 2003,
The following table provides the cost and fair value for themajor categories of securities available for sale carried at fair
Note 4: Securities Available for Sale
value. There were no securities classified as held to maturityat the end of 2003 or 2002.
which consisted of asset-backed securities, bonds and notes.Because the declines in fair value were due to changes inmarket interest rates, not in estimated cash flows, noother-than-temporary impairment was recorded atDecember 31, 2003.
(in millions) December 31, 2003 2002
Cost Unrealized Unrealized Fair Cost Unrealized Unrealized Fairgross gross value gross gross valuegains losses gains losses
Securities of U.S. Treasury and federal agencies $ 1,252 $ 35 $ (1) $ 1,286 $ 1,315 $ 66 $ — $ 1,381Securities of U.S. states and political subdivisions 3,175 176 (5) 3,346 2,232 155 (5) 2,382Mortgage-backed securities:
Federal agencies 20,353 799 (22) 21,130 17,766 1,325 (1) 19,090Private collateralized
mortgage obligations (1) 3,056 106 (8) 3,154 1,775 108 (3) 1,880Total mortgage-backed securities 23,409 905 (30) 24,284 19,541 1,433 (4) 20,970
Other 3,285 198 (28) 3,455 2,608 125 (75) 2,658Total debt securities 31,121 1,314 (64) 32,371 25,696 1,779 (84) 27,391
Marketable equity securities 394 188 — 582 598 72 (114) 556
Total (2) $31,515 $1,502 $(64) $32,953 $26,294 $1,851 $(198) $27,947
(1) Substantially all private collateralized mortgage obligations are AAA-rated bonds collateralized by 1-4 family residential first mortgages.(2) At December 31, 2003, we held no securities of any single issuer (excluding the U.S.Treasury and federal agencies) with a book value that exceeded 10% of stockholders’ equity.
(in millions) December 31, 2003 Less than 12 months 12 months or more Total
Unrealized Fair Unrealized Fair Unrealized Fairgross value gross value gross value
losses losses losses
Securities of U.S. Treasury and federal agencies $ (1) $ 188 $ — $ — $ (1) $ 188Securities of U.S. states and political subdivisions (4) 127 (1) 25 (5) 152Mortgage-backed securities:
Federal agencies (22) 1,907 — — (22) 1,907Private collateralized
mortgage obligations (8) 520 — — (8) 520Total mortgage-backed securities (30) 2,427 — — (30) 2,427
Other (16) 544 (12) 82 (28) 626Total debt securities $(51) $3,286 $(13) $107 $(64) $3,393
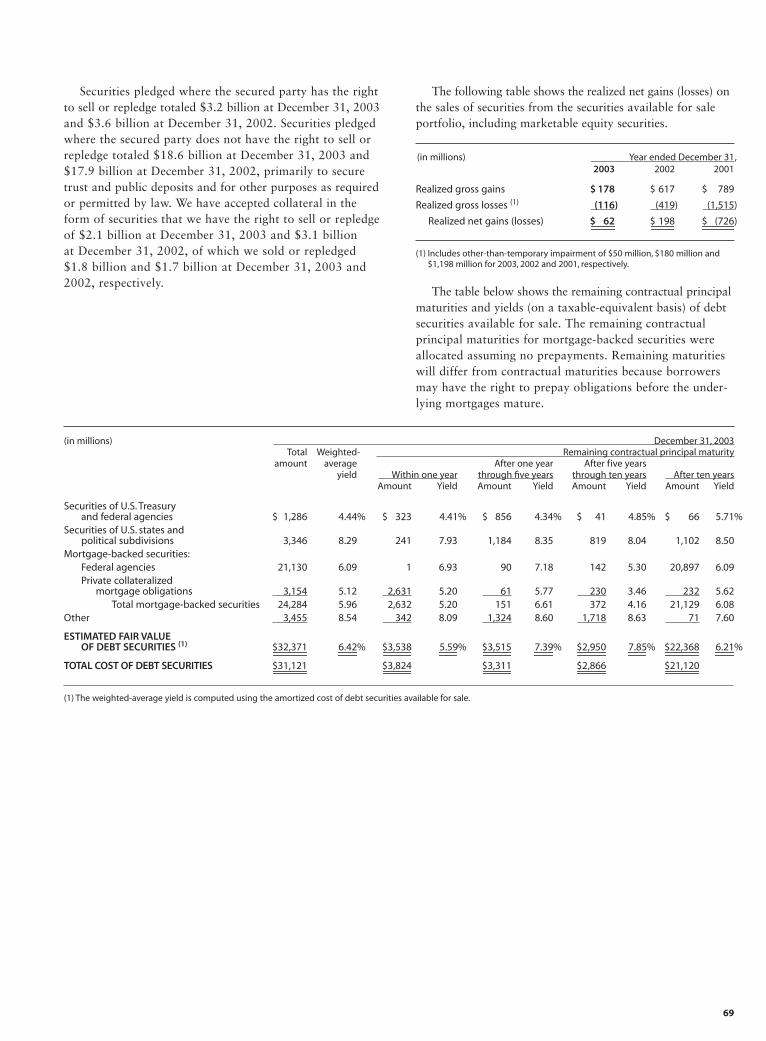
69
(in millions) Year ended December 31,2003 2002 2001
Realized gross gains $ 178 $ 617 $ 789
Realized gross losses (1) (116) (419) (1,515)
Realized net gains (losses) $ 62 $ 198 $ (726)
(1) Includes other-than-temporary impairment of $50 million, $180 million and$1,198 million for 2003, 2002 and 2001, respectively.
Securities pledged where the secured party has the rightto sell or repledge totaled $3.2 billion at December 31, 2003and $3.6 billion at December 31, 2002. Securities pledgedwhere the secured party does not have the right to sell orrepledge totaled $18.6 billion at December 31, 2003 and$17.9 billion at December 31, 2002, primarily to securetrust and public deposits and for other purposes as requiredor permitted by law. We have accepted collateral in theform of securities that we have the right to sell or repledgeof $2.1 billion at December 31, 2003 and $3.1 billion at December 31, 2002, of which we sold or repledged$1.8 billion and $1.7 billion at December 31, 2003 and2002, respectively.
The following table shows the realized net gains (losses) onthe sales of securities from the securities available for saleportfolio, including marketable equity securities.
(in millions) December 31, 2003Total Weighted- Remaining contractual principal maturity
amount average After one year After five yearsyield Within one year through five years through ten years After ten years
Amount Yield Amount Yield Amount Yield Amount Yield
Securities of U.S. Treasury and federal agencies $ 1,286 4.44% $ 323 4.41% $ 856 4.34% $ 41 4.85% $ 66 5.71%
Securities of U.S. states andpolitical subdivisions 3,346 8.29 241 7.93 1,184 8.35 819 8.04 1,102 8.50
Mortgage-backed securities:Federal agencies 21,130 6.09 1 6.93 90 7.18 142 5.30 20,897 6.09Private collateralized
mortgage obligations 3,154 5.12 2,631 5.20 61 5.77 230 3.46 232 5.62Total mortgage-backed securities 24,284 5.96 2,632 5.20 151 6.61 372 4.16 21,129 6.08
Other 3,455 8.54 342 8.09 1,324 8.60 1,718 8.63 71 7.60
ESTIMATED FAIR VALUEOF DEBT SECURITIES (1) $32,371 6.42% $3,538 5.59% $3,515 7.39% $2,950 7.85% $22,368 6.21%
TOTAL COST OF DEBT SECURITIES $31,121 $3,824 $3,311 $2,866 $21,120
(1) The weighted-average yield is computed using the amortized cost of debt securities available for sale.
The table below shows the remaining contractual principalmaturities and yields (on a taxable-equivalent basis) of debtsecurities available for sale. The remaining contractualprincipal maturities for mortgage-backed securities wereallocated assuming no prepayments. Remaining maturitieswill differ from contractual maturities because borrowersmay have the right to prepay obligations before the under-lying mortgages mature.

70
(in millions) December 31,2003 2002
Commercial $ 52,211 $ 47,700Real estate 1-4 family first mortgage 6,428 6,849Other real estate mortgage 1,961 2,111Real estate construction 5,644 3,581Consumer:
Real estate 1-4 family junior lien mortgage 23,436 19,907Credit card 24,831 21,380Other revolving credit and installment 11,219 11,451
Total consumer 59,486 52,738Foreign 238 175
Total loan commitments $125,968 $113,154
concentrations greater than 10% of total loans included inany of the following loan categories: commercial loans byindustry; real estate 1-4 family first and junior lien mort-gages by state, except for California, which represented 19%of total loans; or other revolving credit and installment loansby product type.
A summary of the major categories of loans outstanding is shown in the table below. Outstanding loan balances atDecember 31, 2003 and 2002 are net of unearned income,including net deferred loan fees, of $3,430 million and$3,699 million, respectively.
At December 31, 2003 and 2002, we did not have any
Note 5: Loans and Allowance for Loan Losses
(in millions) December 31,2003 2002 2001 2000 1999
Commercial $ 48,729 $ 47,292 $ 47,547 $ 50,518 $ 41,671Real estate 1-4 family first mortgage 83,535 44,119 29,317 19,321 13,586Other real estate mortgage 27,592 25,312 24,808 23,972 20,899Real estate construction 8,209 7,804 7,806 7,715 6,067Consumer:
Real estate 1-4 family junior lien mortgage 36,629 28,147 21,801 17,361 12,869Credit card 8,351 7,455 6,700 6,616 5,805Other revolving credit and installment 33,100 26,353 23,502 23,974 20,617
Total consumer 78,080 61,955 52,003 47,951 39,291Lease financing 4,477 4,085 4,017 4,350 3,586Foreign 2,451 1,911 1,598 1,624 1,600
Total loans $253,073 $192,478 $167,096 $155,451 $126,700
To ensure that the pricing of a loan will adequately compensate us for assuming the credit risk presented by acustomer, we may require a certain amount of collateral.We hold various types of collateral, including accountsreceivable, inventory, land, buildings, equipment, income-producing commercial properties and residential real estate.We have the same collateral requirements for loans whetherwe fund immediately or later (commitment).
A commitment to extend credit is a legally bindingagreement to lend funds to a customer, usually at a statedinterest rate and for a specified purpose. These commitmentshave fixed expiration dates and generally require a fee. Whenwe make such a commitment, we have credit risk. The liquidity requirements or credit risk will be lower than thecontractual amount of commitments to extend credit becausea significant portion of these commitments are expected toexpire without being used. Certain commitments are subjectto loan agreements with covenants regarding the financialperformance of the customer that must be met before we arerequired to fund the commitment. We use the same creditpolicies for commitments to extend credit that we use inmaking loans. For information on standby letters of credit,see Note 25 (Guarantees).
In addition, we manage the potential risk in credit com-mitments by limiting the total amount of arrangements, both
by individual customer and in total, by monitoring the sizeand maturity structure of these portfolios and by applyingthe same credit standards for all of our credit activities. Weinclude a portion of unfunded commitments in determiningthe allowance for loan losses.
The total of our unfunded commitments, net of all fundslent and all standby and commercial letters of credit issuedunder the terms of these commitments, is summarized byloan categories in the table below.

71
Changes in the allowance for loan losses were:
(in millions) Year ended December 31,2003 2002 2001 2000 1999
Balance, beginning of year $ 3,819 $ 3,717 $ 3,681 $ 3,312 $ 3,274
Allowances related to business combinations/other 69 93 41 265 48
Provision for loan losses 1,722 1,684 1,727 1,284 1,079
Loan charge-offs:Commercial (597) (716) (692) (429) (395)Real estate 1-4 family first mortgage (47) (39) (40) (16) (14)Other real estate mortgage (33) (24) (32) (32) (28)Real estate construction (11) (40) (37) (8) (2)Consumer:
Real estate 1-4 family junior lien mortgage (77) (55) (36) (34) (33)Credit card (476) (407) (421) (367) (403)Other revolving credit and installment (827) (770) (770) (623) (585)
Total consumer (1,380) (1,232) (1,227) (1,024) (1,021)Lease financing (41) (21) (22) — —Foreign (105) (84) (78) (86) (90)
Total loan charge-offs (2,214) (2,156) (2,128) (1,595) (1,550)Loan recoveries:
Commercial 177 162 96 98 90Real estate 1-4 family first mortgage 10 8 6 4 6Other real estate mortgage 11 16 22 13 38Real estate construction 11 19 3 4 5Consumer:
Real estate 1-4 family junior lien mortgage 13 10 8 14 15Credit card 50 47 40 39 49Other revolving credit and installment 196 205 203 213 243
Total consumer 259 262 251 266 307Lease financing 8 — — — —Foreign 19 14 18 30 15
Total loan recoveries 495 481 396 415 461Net loan charge-offs _(1,719) (1,675) (1,732) (1,180) (1,089)
Balance, end of year $ 3,891 $ 3,819 $ 3,717 $ 3,681 $ 3,312
Net loan charge-offs as a percentage of average total loans .81% .96% 1.10% .84% .92%
Allowance as a percentage of total loans 1.54% 1.98% 2.22% 2.37% 2.61%
We have an established process to determine the adequacyof the allowance for loan losses which assesses the risksand losses inherent in our portfolio. This process supportsan allowance consisting of two components, allocated andunallocated. For the allocated component, we combine estimates of the allowances needed for loans analyzed on a pooled basis and loans analyzed individually (includingimpaired loans).
Approximately two-thirds of the allocated allowance is determined at a pooled level for retail loan portfolios (consumer loans and leases, home mortgage loans, and somesegments of small business loans). We use forecasting modelsto measure inherent loss in these portfolios. We frequentlyvalidate and update these models to capture recent behavioralcharacteristics of the portfolios, as well as any changes inour loss mitigation or marketing strategies.

72
(in millions) December 31,2003 2002
Impairment measurement based on:Collateral value method $386 $309Discounted cash flow method 243 303
Total (1) $629 $612
(1) Includes $59 million and $201 million of impaired loans with a relatedallowance of $8 million and $52 million at December 31, 2003 and 2002,respectively.
We consider the allowance for loan losses of $3.89 billionadequate to cover credit losses inherent in the loan portfolio,including unfunded commitments, at December 31, 2003.
Nonaccrual loans were $1,458 million and $1,492 millionat December 31, 2003 and 2002, respectively. Loans pastdue 90 days or more as to interest or principal and stillaccruing interest were $2,337 million at December 31, 2003and $672 million at December 31, 2002. The 2003 balanceincluded $1,641 million in advances pursuant to our ser-vicing agreements to the Government National MortgageAssociation (GNMA) mortgage pools whose repayments are insured by the Federal Housing Administration or guaranteed by the Department of Veteran Affairs. Prior toclarifying guidance issued in 2003 as to classification asloans, GNMA advances were included in other assets.
The recorded investment in impaired loans and themethodology used to measure impairment was:
We use a standardized loan grading process for wholesaleloan portfolios (commercial, commercial real estate, realestate construction and leases) and review larger higher-risktransactions individually. Based on this process, we assign aloss factor to each pool of graded loans. For graded loanswith evidence of credit weakness at the balance sheet date,the loss factors are derived from migration models that trackactual portfolio movements between loan grades over aspecified period of time. For graded loans without evidenceof credit weakness at the balance sheet date, we use a combi-nation of our long-term average loss experience and externalloss data. In addition, we individually review nonperformingloans over $1 million for impairment based on cash flows orcollateral. We include the impairment on nonperformingloans in the allocated allowance unless it has already beenrecognized as a loss.
The potential risk from unfunded loan commitments andletters of credit is part of the loss analysis of loans outstanding.This risk assessment is converted to a loan equivalent factorand is a minor component of the allocated allowance. AtDecember 31, 2003, 4% of allocated reserves and 3% ofthe total allowance was related to this potential risk. Anyprovision necessary to cover this exposure is part of the provision for loan losses.
The allocated allowance is supplemented by the unallocatedallowance to adjust for imprecision and to incorporate therange of probable outcomes inherent in estimates used for theallocated allowance. The unallocated allowance is the resultof our judgment of risks inherent in the portfolio, economicuncertainties, historical loss experience and other subjectivefactors, including industry trends.
The ratios of the allocated allowance and the unallocatedallowance to the total allowance may change from period toperiod. The total allowance reflects management’s estimateof credit losses inherent in the loan portfolio, includingunfunded commitments, at the balance sheet date.
Like all national banks, our subsidiary national bankscontinue to be subject to examination by their primary regu-lator, the Office of the Comptroller of the Currency (OCC),and some have OCC examiners in residence. The OCCexaminations occur throughout the year and target variousactivities of our subsidiary national banks, including boththe loan grading system and specific segments of the loanportfolio (for example, commercial real estate and sharednational credits). The Parent and its nonbank subsidiariesare examined by the Federal Reserve Board.
The average recorded investment in impaired loans during2003, 2002 and 2001 was $668 million, $705 million and$707 million, respectively. Predominantly all paymentsreceived on impaired loans were recorded using the costrecovery method. Under the cost recovery method, allpayments received are applied to principal. This method isused when the ultimate collectibility of the total principal isin doubt. For payments received on impaired loans recordedusing the cash basis method, total interest income recognizedfor 2003, 2002 and 2001 was $12 million, $17 million and$13 million, respectively. Under the cash method, contractualinterest is credited to interest income when received. Thismethod is used when the ultimate collectibility of the totalprincipal is not in doubt.
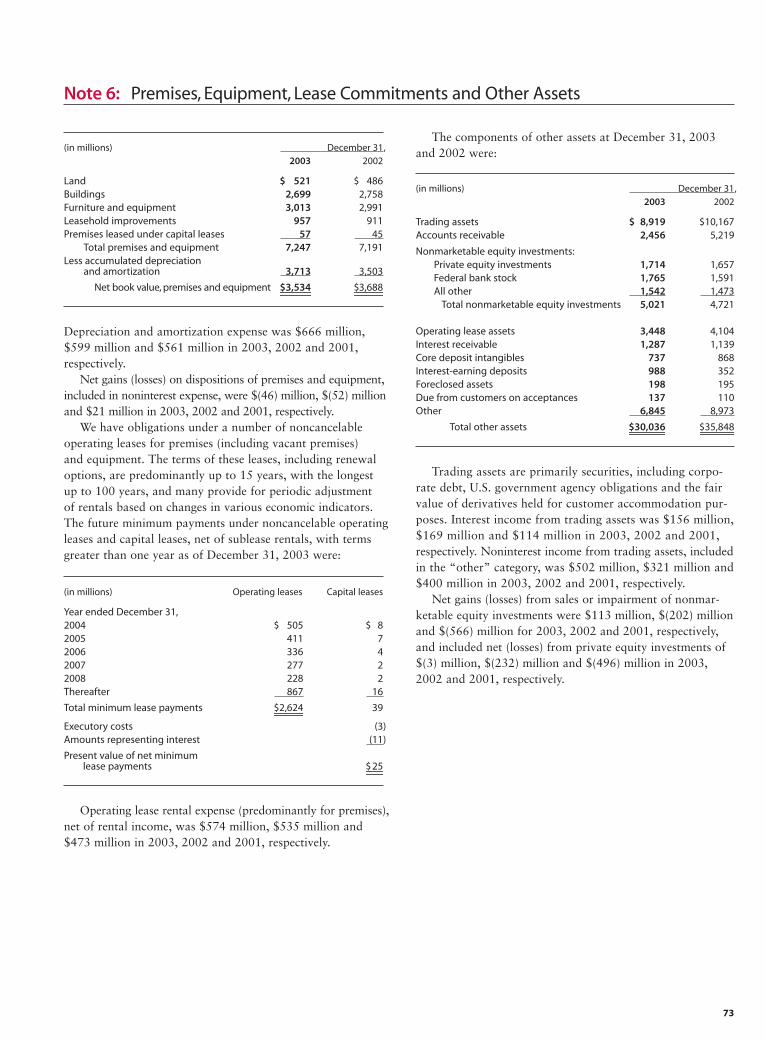
73
Note 6: Premises, Equipment, Lease Commitments and Other Assets
The components of other assets at December 31, 2003and 2002 were:
Depreciation and amortization expense was $666 million,$599 million and $561 million in 2003, 2002 and 2001,respectively.
Net gains (losses) on dispositions of premises and equipment,included in noninterest expense, were $(46) million, $(52) millionand $21 million in 2003, 2002 and 2001, respectively.
We have obligations under a number of noncancelableoperating leases for premises (including vacant premises) and equipment. The terms of these leases, including renewaloptions, are predominantly up to 15 years, with the longestup to 100 years, and many provide for periodic adjustment of rentals based on changes in various economic indicators.The future minimum payments under noncancelable operatingleases and capital leases, net of sublease rentals, with termsgreater than one year as of December 31, 2003 were:
Trading assets are primarily securities, including corpo-rate debt, U.S. government agency obligations and the fairvalue of derivatives held for customer accommodation pur-poses. Interest income from trading assets was $156 million,$169 million and $114 million in 2003, 2002 and 2001,respectively. Noninterest income from trading assets, includedin the “other” category, was $502 million, $321 million and$400 million in 2003, 2002 and 2001, respectively.
Net gains (losses) from sales or impairment of nonmar-ketable equity investments were $113 million, $(202) millionand $(566) million for 2003, 2002 and 2001, respectively,and included net (losses) from private equity investments of$(3) million, $(232) million and $(496) million in 2003,2002 and 2001, respectively.
Operating lease rental expense (predominantly for premises),net of rental income, was $574 million, $535 million and$473 million in 2003, 2002 and 2001, respectively.
(in millions) December 31,2003 2002
Land $ 521 $ 486Buildings 2,699 2,758Furniture and equipment 3,013 2,991Leasehold improvements 957 911Premises leased under capital leases 57 45
Total premises and equipment 7,247 7,191Less accumulated depreciation
and amortization 3,713 3,503
Net book value, premises and equipment $3,534 $3,688
(in millions) Operating leases Capital leases
Year ended December 31,2004 $ 505 $ 82005 411 72006 336 42007 277 22008 228 2Thereafter 867 16
Total minimum lease payments $2,624 39
Executory costs (3)Amounts representing interest (11)
Present value of net minimum lease payments $25
(in millions) December 31,2003 2002
Trading assets $ 8,919 $10,167Accounts receivable 2,456 5,219
Nonmarketable equity investments:Private equity investments 1,714 1,657Federal bank stock 1,765 1,591All other 1,542 1,473
Total nonmarketable equity investments 5,021 4,721
Operating lease assets 3,448 4,104Interest receivable 1,287 1,139Core deposit intangibles 737 868Interest-earning deposits 988 352Foreclosed assets 198 195Due from customers on acceptances 137 110Other 6,845 8,973
Total other assets $30,036 $35,848

74
The gross carrying amount of intangible assets and accumu-lated amortization at December 31, 2003 and 2002 was:
Note 7: Intangible Assets
We based the projections of amortization expense formortgage servicing rights shown above on existing asset balances and the existing interest rate environment as ofDecember 31, 2003. Future amortization expense may besignificantly different depending upon changes in the mort-gage servicing portfolio, mortgage interest rates and marketconditions. We based the projections of amortization expensefor core deposit intangibles shown above on existing assetbalances at December 31, 2003. Future amortization expensemay vary based on additional core deposit intangiblesacquired through business combinations.
(in millions) December 31,2003 2002
Gross Accumulated Gross Accumulatedcarrying amortization carrying amortizationamount amount
Amortized intangible assets:Mortgage servicing
rights, beforevaluation allowance (1) $16,459 $7,611 $11,528 $4,851
Core deposit intangibles 2,426 1,689 2,415 1,547
Other 392 273 374 254Total amortized intangible assets $19,277 $9,573 $14,317 $6,652
Unamortizedintangible asset (trademark) $ 14 $ 14
(1) The valuation allowance was $1,942 million at December 31, 2003 and$2,188 million at December 31, 2002. The carrying value of mortgage servicing rights was $6,906 million at December 31, 2003 and $4,489 million at December 31, 2002.
(in millions) Mortgage Core Other Totalservicing deposit
rights intangibles
Year ended December 31, 2003 $2,760 $142 $29 $2,931
Estimate for year ended December 31,
2004 $ 1,471 $134 $24 $1,6292005 1,158 123 18 1,2992006 989 110 15 1,1142007 843 100 14 9572008 707 92 13 812
As of December 31, 2003, the current year and estimatedfuture amortization expense for amortized intangible assetswas:

75
The following table summarizes the changes in the carryingamount of goodwill as allocated to our operating segmentsfor goodwill impairment analysis.
For goodwill impairment testing, enterprise-level goodwillacquired in business combinations is allocated to reportingunits based on the relative fair value of assets acquired andrecorded in the respective reporting units. Through this allo-cation, we assigned enterprise-level goodwill to the reportingunits that are expected to benefit from the synergies of the
Note 8: Goodwill
For our goodwill impairment analysis, we allocate all of the goodwill to the individual operating segments. Formanagement reporting we do not allocate all of the goodwillto the individual operating segments: some is allocated at the
enterprise level. See Note 20 for further information on management reporting. The balances of goodwill for management reporting are:
(in millions) Community Wholesale Wells Fargo ConsolidatedBanking Banking Financial Enterprise Company
December 31, 2002 $ 2,896 $717 $343 $ 5,797 $ 9,753
December 31, 2003 $3,439 $785 $350 $5,797 $10,371
(in millions) Community Wholesale Wells Fargo ConsolidatedBanking Banking Financial Company
Balance December 31, 2001 $ 6,139 $2,781 $607 $ 9,527Goodwill from business combinations 637 19 7 663Transitional goodwill impairment charge — (133) (271) (404)Goodwill written off related to divested businesses (33) — — (33)
Balance December 31, 2002 6,743 2,667 343 9,753Goodwill from business combinations 545 68 — 613Foreign currency translation adjustments — — 7 7Goodwill written off related to divested businesses (2) — — (2)
Balance December 31, 2003 $7,286 $2,735 $350 $10,371
combination. We used the discounted estimated future netcash flows to evaluate goodwill reported at all reporting units.
In 2003, we completed our annual goodwill impairmentassessment under FAS 142 and determined that no addition-al impairment was required. In 2002, our initial goodwillimpairment testing resulted in a $276 million (after tax),$404 million (before tax), transitional impairment charge,which we reported as a cumulative effect of a change inaccounting principle.

76
(in millions) December 31, 2003
Three months or less $28,671After three months through six months 1,201After six months through twelve months 1,102After twelve months 2,284
Total $33,258
The total of time certificates of deposit and other timedeposits issued by domestic offices was $47,322 million and$31,637 million at December 31, 2003 and 2002, respectively.Substantially all of those deposits were interest bearing. Thecontractual maturities of those deposits were:
Note 9: Deposits
of deposit sold to institutional customers. The contractualmaturities of these deposits were:
(in millions) December 31, 2003
2004 $40,2602005 3,3702006 1,6622007 9812008 647Thereafter 402
Total $47,322
Time certificates of deposit and other time deposits issuedby foreign offices with a denomination of $100,000 or morerepresent substantially all of our foreign deposit liabilities of$8,768 million and $9,454 million at December 31, 2003and 2002, respectively.
Demand deposit overdrafts of $655 million and $564 millionwere reclassified as loan balances at December 31, 2003 and2002, respectively.
Of the total above, the amount of time deposits with adenomination of $100,000 or more was $33,258 million and$15,403 million at December 31, 2003 and 2002, respectively.The increase from 2002 was predominantly due to certificates
The table below shows selected information for short-termborrowings, which generally mature in less than 30 days.
At December 31, 2003, we had $1.04 billion available in
Note 10: Short-Term Borrowings
(in millions) 2003 2002 2001Amount Rate Amount Rate Amount Rate
As of December 31,Commercial paper and other short-term borrowings $ 6,709 1.26% $11,109 1.57% $13,965 2.01%
Federal funds purchased and securities sold underagreements to repurchase 17,950 .84 22,337 1.08 23,817 1.53
Total $24,659 .95 $33,446 1.24 $37,782 1.71
Year ended December 31,Average daily balanceCommercial paper and other short-term borrowings $11,506 1.22% $13,048 1.84% $13,561 4.12%
Federal funds purchased and securities sold underagreements to repurchase 18,392 .99 20,230 1.47 20,324 3.51
Total $29,898 1.08 $33,278 1.61 $33,885 3.76
Maximum month-end balanceCommercial paper and other short-term borrowings (1) $14,462 N/A $17,323 N/A $19,818 N/A
Federal funds purchased and securities sold underagreements to repurchase (2) 24,132 N/A 33,647 N/A 26,346 N/A
N/A – Not applicable.(1) Highest month-end balance in each of the last three years was in January 2003, January 2002 and October 2001.(2) Highest month-end balance in each of the last three years was in April 2003, January 2002 and September 2001.
lines of credit. These financing arrangements require themaintenance of compensating balances or payment of fees,which were not material.

The following is a summary of long-term debt, based on original maturity, (reflecting unamortized debt discounts and premiums, where applicable) owed by the Parentand its subsidiaries.
Note 11: Long-Term Debt
(in millions) December 31,Maturity Interestdate(s) rate(s) 2003 2002
Wells Fargo & Company (Parent only)
SeniorGlobal Notes (1) 2004-2027 2.45-7.65% $ 9,497 $ 9,939Floating-Rate Global Notes 2004-2007 Varies 12,905 4,150Extendable Notes (2) 2005-2008 Varies 2,999 2,998Equity Linked Notes (3) 2008-2010 Zero Coupon 297 79Convertible Debenture (4) 2033 Varies 3,000 —
Total senior debt – Parent 28,698 17,166
SubordinatedFixed-Rate Notes (1) 2003-2023 4.95-6.65% 3,280 2,482FixFloat Notes 2012 4.00% through 2006, varies 299 299
Total subordinated debt – Parent 3,579 2,781
Junior SubordinatedFixed-Rate Notes (1)(5) 2031-2033 5.625-7.00% 2,732 —
Total junior subordinated debt – Parent 2,732 —
Total long-term debt – Parent 35,009 19,947
Wells Fargo Bank, N.A. and its subsidiaries (WFB, N.A.)
SeniorFixed-Rate Bank Notes (1) 2004-2011 1.50-7.49% 210 —Floating-Rate Notes 2004-2011 Varies 7,087 5,304Notes payable by subsidiaries 2004-2008 3.13-13.5% 79 —Other notes and debentures (6) 2006-2011 Varies 11 —Obligations of subsidiaries under capital leases (Note 6) 7 7
Total senior debt – WFB, N.A. 7,394 5,311
SubordinatedFixed-Rate Bank Notes (1) 2011-2013 7.73-9.39% 16 —FixFloat Notes (1) 2010 7.8% through 2004, varies 998 997Notes (1) 2010-2011 6.45-7.55% 2,867 2,497Floating-Rate Notes 2011-2013 Varies 43 —
Total subordinated debt – WFB, N.A. 3,924 3,494
Total long-term debt – WFB, N.A. 11,318 8,805
Wells Fargo Financial, Inc. and its subsidiaries (WFFI)
SeniorFixed-Rate Notes 2004-2012 4.35-9.05% 6,969 7,634Floating-Rate Notes 2004-2033 Varies 1,292 1,100
Total long-term debt – WFFI $ 8,261 $ 8,734
77
(1) We entered into interest rate swap agreements for substantially all of these notes, whereby we receive fixed-rate interest payments approximately equal to interest on the notes and make interest payments based on an average three-month or six-month London Interbank Offered Rate (LIBOR).
(2) The extendable notes are floating-rate securities with an initial maturity of 13 months, which can be extended on a rolling monthly basis, at the investor's option,to a final maturity of 5 years.
(3) These notes are linked to baskets of equities or equity indices.(4) On April 15, 2003, we issued $3 billion of convertible senior debentures as a private placement. If the price per share of our common stock exceeds $120.00 per share
on or before April 15, 2008, the holders will have the right to convert the convertible debt securities to common stock at an initial conversion price of $100.00 per share.While we are able to settle the entire amount of the conversion rights granted in this convertible debt offering in cash, common stock or a combination, we intend to settle the principal amount in cash and to settle the conversion spread (the excess conversion value over the principal) in either cash or stock. We can also redeem all or some of the convertible debt securities for cash at any time on or after May 5, 2008, at their principal amount plus accrued interest, if any.
(5) See Note 12 (Guaranteed Preferred Beneficial Interests in Company’s Subordinated Debentures).(6) These notes are tied to affordable housing.
(continued on following page)

Prior to December 31, 2003, the Trusts were consolidated subsidiaries and were included in liabilities in the consolidated balance sheet, as “Guaranteed preferred beneficial interests in Company’s subordinateddebentures.” The common securities and debentures, along with the related income effects were eliminated in the consolidated financial statements.
The debentures issued to the Trusts, less the commonsecurities of the Trusts, or $3.6 billion at December 31,2003, continue to qualify as Tier 1 capital under guidanceissued by the Federal Reserve Board.
At December 31, 2003, we had 13 wholly-owned trusts (the Trusts) that were formed to issue trust preferred securities and related common securities of the Trusts. AtDecember 31, 2003, as a result of the adoption of FIN 46R,we deconsolidated the Trusts. The $3.8 billion of junior subordinated debentures issued by the Company to theTrusts were reflected as long-term debt in the consolidatedbalance sheet at December 31, 2003. (See Note 11.) The common stock issued by the Trusts was recorded in other assets in the consolidated balance sheet at December 31, 2003.
Note 12: Guaranteed Preferred Beneficial Interests In Company’s Subordinated Debentures
(7) These notes were called in February 2003.
At December 31, 2003, the principal payments, includingsinking fund payments, on long-term debt are due as noted:
(in millions) Parent Company
2004 $ 4,000 $12,2942005 8,147 10,6132006 7,382 10,4522007 2,717 5,0762008 2,935 7,014Thereafter 9,828 18,193
Total $35,009 $63,642
(in millions) December 31,Maturity Interestdate(s) rate(s) 2003 2002
Other consolidated subsidiaries
SeniorFloating-Rate Euro Medium-Term Notes 2003 Varies $ — $ 285Fixed-Rate Notes 2003-2006 5.875-6.875% 150 474Federal Home Loan Bank (FHLB) Notes and Advances 2003-2012 .97-6.47% 3,310 2,931Floating-Rate FHLB Advances 2002-2011 Varies 1,075 4,165Medium-Term Notes (7) 2013 6.40% — 15Other notes and debentures – Floating-Rate 2008-2011 Varies 1,958 10Other notes and debentures 2003-2015 1.74-12.00% 41 140Other notes and debentures (6) 2004-2009 Varies 5 —Obligations of subsidiaries under capital leases (Note 6) 18 14
Total senior debt – Other consolidated subsidiaries 6,557 8,034
SubordinatedMedium-Term Notes (7) 2013 6.50% — 25Notes 2003-2008 6.125-6.875% 228 598Notes (1) 2004-2006 6.875-9.125% 1,091 1,092Other notes and debentures 2007 1.99-11.14% 57 —Other notes and debentures – Floating-Rate 2005 7.55% 85 85
Total subordinated debt – Other consolidated subsidiaries 1,461 1,800
Junior SubordinatedFloating-Rate Notes (5) 2027-2032 Varies 168 —Fixed-Rate Notes (5) 2026-2029 7.73-9.875% 868 —
Total junior subordinated debt – Other consolidated subsidiaries 1,036 —
Total long-term debt – Other consolidated subsidiaries 9,054 9,834
Total long-term debt $63,642 $47,320
(continued from previous page)
78
The interest rates on floating-rate notes are determined periodically by formulas based on certain money marketrates, subject, on certain notes, to minimum or maximuminterest rates.
As part of our long-term and short-term borrowingarrangements, we were subject to various financial and operational covenants. Some of the agreements under whichdebt has been issued have provisions that may limit themerger or sale of certain subsidiary banks and the issuanceof capital stock or convertible securities by certain subsidiarybanks. At December 31, 2003, we were in compliance with all the covenants.

79
ESOP CUMULATIVE CONVERTIBLE PREFERRED STOCK
All shares of our ESOP Cumulative Convertible PreferredStock (ESOP Preferred Stock) were issued to a trustee acting on behalf of the Wells Fargo & Company 401(k)Plan. Dividends on the ESOP Preferred Stock are cumulativefrom the date of initial issuance and are payable quarterly at annual rates ranging from 8.50% to 12.50% dependingupon the year of issuance. Each share of ESOP PreferredStock released from the unallocated reserve of the 401(k)Plan is converted into shares of our common stock based on
We are authorized to issue 20 million shares of preferredstock and 4 million shares of preference stock, both withoutpar value. Preferred shares outstanding rank senior to
Note 13: Preferred Stock
common shares both as to dividends and liquidation preference but have no general voting rights. We have notissued any preference shares under this authorization.
(1) On November 15, 2003, all shares were redeemed at the stated liquidation price of $50 plus accrued dividends.(2) On October 1, 2001, all shares were redeemed at the stated liquidation price of $50 plus accrued dividends.(3) Liquidation preference $1,000.(4) In accordance with the American Institute of Certified Public Accountants (AICPA) Statement of Position 93-6, Employers’ Accounting for Employee Stock Ownership
Plans, we recorded a corresponding charge to unearned ESOP shares in connection with the issuance of the ESOP Preferred Stock. The unearned ESOP shares arereduced as shares of the ESOP Preferred Stock are committed to be released. For information on dividends paid, see Note 14.
the stated value of the ESOP Preferred Stock and the then current market price of our common stock. The ESOPPreferred Stock is also convertible at the option of the holder at any time, unless previously redeemed. We have the option to redeem the ESOP Preferred Stock at any time, in whole or in part, at a redemption price per shareequal to the higher of (a) $1,000 per share plus accrued and unpaid dividends or (b) the fair market value, as defined in the Certificates of Designation of the ESOPPreferred Stock.
Shares issued Carrying amount Dividends declared and outstanding (in millions) Adjustable (in millions)
December 31, December 31, dividend rate Year ended December 31,2003 2002 2003 2002 Minimum Maximum 2003 2002 2001
Adjustable-Rate Cumulative, Series B (1) — 1,460,000 $ — $ 73 5.50% 10.50% $ 3 $ 4 $ 4
Adjustable-Rate NoncumulativePreferred Stock, Series H (2) — — — — 7.00 13.00 — — 10
ESOP Cumulative Convertible (3)
2003 68,238 — 68 — 8.50 9.50 — — —
2002 53,641 64,049 54 64 10.50 11.50 — — —
2001 40,206 46,126 40 46 10.50 11.50 — — —
2000 29,492 34,742 30 35 11.50 12.50 — — —
1999 11,032 13,222 11 13 10.30 11.30 — — —
1998 4,075 5,095 4 5 10.75 11.75 — — —
1997 4,081 5,876 4 6 9.50 10.50 — — —
1996 2,927 5,407 3 6 8.50 9.50 — — —
1995 408 3,043 — 3 10.00 10.00 — — —
Total preferred stock 214,100 1,637,560 $ 214 $ 251 $ 3 $ 4 $14
Unearned ESOP shares (4) $(229) $(190)

80
Note 14: Common Stock and Stock Plans
Common StockThis table summarizes our reserved, issued and authorizedcommon stock at December 31, 2003.
Options also may include the right to acquire a “reload”stock option. If an option contains the reload feature and if a participant pays all or part of the exercise price of theoption with shares of stock purchased in the market or heldby the participant for at least six months, upon exercise of the option, the participant is granted a new option to purchase, at the fair market value of the stock as of the date of the reload, the number of shares of stock equal to the sum of the number of shares used in payment of theexercise price and a number of shares with respect to related statutory minimum withholding taxes.
We did not record any compensation expense for theoptions granted under the plans during 2003, 2002 and2001, as the exercise price was equal to the quoted marketprice of the stock at the date of grant. The total number of shares of common stock available for grant under theplans at December 31, 2003 was 59,214,303.
Holders of restricted shares and restricted share rights areentitled to the related shares of common stock at no costgenerally over three to five years after the restricted shares or restricted share rights were granted. Holders of restrictedshares generally are entitled to receive cash dividends paidon the shares. Holders of restricted share rights generally areentitled to receive cash payments equal to the cash dividendsthat would have been paid had the restricted share rightsbeen issued and outstanding shares of common stock. Exceptin limited circumstances, restricted shares and restrictedshare rights are canceled when employment ends.
In 2003, 2002 and 2001, 61,740, 81,380 and 107,000restricted shares and restricted share rights were granted,respectively, with a weighted-average grant-date per sharefair value of $56.05, $45.47 and $46.73, respectively. AtDecember 31, 2003, 2002 and 2001, there were 577,722,656,124 and 888,234 restricted shares and restricted sharerights outstanding, respectively. The compensation expensefor the restricted shares and restricted share rights equals thequoted market price of the related stock at the date of grantand is accrued over the vesting period. We recognized totalcompensation expense for the restricted shares and restrictedshare rights of $4 million in 2003, $5 million in 2002 and$6 million in 2001.
For various acquisitions and mergers since 1992, we converted employee and director stock options of acquiredor merged companies into stock options to purchase ourcommon stock based on the terms of the original stockoption plan and the agreed-upon exchange ratio.
Dividend Reinvestment and Common Stock Purchase PlansParticipants in our dividend reinvestment and common stockdirect purchase plans may purchase shares of our commonstock at fair market value by reinvesting dividends and/ormaking optional cash payments, under the plan’s terms.
Director PlansWe provide a stock award to non-employee directors as part of their annual retainer under our director plans. Wealso provide annual grants of options to purchase commonstock to each non-employee director elected or re-elected at the annual meeting of stockholders. The options can beexercised after six months and through the tenth anniversaryof the grant date.
Employee Stock PlansLONG-TERM INCENTIVE PLANS Our stock incentive plans providefor awards of incentive and nonqualified stock options, stockappreciation rights, restricted shares, restricted share rights,performance awards and stock awards without restrictions.We can grant employee stock options with exercise prices ator above the fair market value (as defined in the plan) of thestock at the date of grant and with terms of up to ten years.The options generally become fully exercisable over threeyears from the date of grant. Except as otherwise permittedunder the plan, if employment is ended for reasons otherthan retirement, permanent disability or death, the optionperiod is reduced or the options are canceled.
Number of shares
Dividend reinvestment and common stock purchase plans 1,010,756
Director plans 914,656Stock plans (1) 246,593,327
Total shares reserved 248,518,739Shares issued 1,736,381,025Shares not reserved 4,015,100,236
Total shares authorized 6,000,000,000
(1) Includes employee option, restricted shares and restricted share rights, 401(k),profit sharing and compensation deferral plans.

(1) five years after the date of grant or (2) when the quotedmarket price of the stock reaches a predetermined price.Those options generally expire ten years after the date ofgrant. Because the exercise price of each PartnerShares granthas been equal to or higher than the quoted market price ofour common stock at the date of grant, we do not recognizeany compensation expense.
This table summarizes stock option activity and relatedinformation for the three years ended December 31, 2003.
81
Director Plans Long-Term Incentive Plans Broad-Based PlansNumber Weighted-average Number Weighted-average Number Weighted-average
exercise price exercise price exercise price
Options outstanding as of December 31, 2000 432,678 $ 27.23 74,784,628 $ 32.39 50,460,305 $ 39.41
2001:Granted 49,635 47.55 19,930,772(1) 49.52 353,600 41.84Canceled — — (1,797,865) 43.21 (5,212,550) 41.81Exercised (169,397) 19.42 (10,988,267) 25.61 (191,440) 21.43
Options outstanding as of December 31, 2001 312,916 34.69 81,929,268 37.23 45,409,915 39.23
2002:Granted 44,786 50.22 23,790,286(1) 46.99 18,015,150 50.46Canceled — — (1,539,244) 45.36 (10,092,056) 42.15Exercised (8,594) 30.56 (10,873,465) 30.62 (3,249,213) 30.54Acquisitions — — 72,892 31.33 — —
Options outstanding as of December 31, 2002 349,108 36.78 93,379,737 40.35 50,083,796 43.25
2003:Granted 62,346 47.22 23,052,384(1) 46.04 — —Canceled — — (1,529,868) 46.76 (4,293,930) 46.85Exercised (59,707) 26.90 (13,884,561) 31.96 (6,408,797) 34.09Acquisitions 4,769 31.42 889,842 25.89 — —
Options outstanding as of December 31, 2003 356,516 $40.19 101,907,534 $42.56 39,381,069 $44.35
Outstanding options exercisable as of:December 31, 2001 312,916 $ 34.69 46,937,295 $33.44 1,264,015 $ 20.29December 31, 2002 349,108 36.78 54,429,329 36.94 9,174,196 31.35December 31, 2003 353,131 40.08 63,257,541 40.33 12,063,244 35.21
(1) Includes 2,311,824, 2,860,926 and 1,791,852 reload grants at December 31, 2003, 2002 and 2001, respectively.
The following table presents the weighted-average pershare fair value of options granted estimated using a Black-Scholes option-pricing model and the weighted-averageassumptions used.
2003 2002 2001
Per share fair value of options granted:Director Plans $9.59 $13.45 $13.87Long-Term Incentive Plans 9.48 12.34 14.16Broad-Based Plans — 15.62 12.42
Expected life (years) 4.3 5.0 4.8Expected volatility 29.2% 31.6% 32.9%Risk-free interest rate 2.5 4.6 4.8Expected annual dividend yield 2.9 2.4 2.4
BROAD-BASED PLANS In 1996, we adopted the PartnerShares®
Stock Option Plan, a broad-based employee stock optionplan. It covers full- and part-time employees who were not included in the long-term incentive plans describedabove. The total number of shares of common stock autho-rized for issuance under the plan since inception throughDecember 31, 2003 was 74,000,000, including 18,303,486shares available for grant. The exercise date of optionsgranted under the PartnerShares Plan is the earlier of

82
current market price of the common shares. Dividends on the common shares allocated as a result of the release and conversion of the ESOP Preferred Stock reduce retainedearnings and the shares are considered outstanding for computing earnings per share. Dividends on the unallocatedESOP Preferred Stock do not reduce retained earnings, andthe shares are not considered to be common stock equivalentsfor computing earnings per share. Loan principal and interestpayments are made from our contributions to the 401(k)Plan, along with dividends paid on the ESOP Preferred Stock.With each principal and interest payment, a portion of theESOP Preferred Stock is released and, after conversion of the ESOP Preferred Stock into common shares, allocated to the 401(k) Plan participants.
Total dividends paid to the 401(k) Plan on ESOP shares were:
December 31, 2003Weighted- Number Weighted-
average averageremaining exercise
contractual pricelife (in yrs.)
RANGE OF EXERCISE PRICESDirector Plans
$.10Options outstanding/exercisable 1.01 2,390 $ .10
$7.84-$13.48Options outstanding/exercisable 2.01 3,210 10.80
$13.49-$16.00Options outstanding/exercisable 1.29 18,410 15.21
$16.01-$25.04Options outstanding/exercisable 1.83 49,967 21.68
$25.05-$38.29Options outstanding/exercisable 3.81 48,606 32.99
$38.30-$51.00Options outstanding/exercisable 7.62 211,733 46.53
$51.01-$69.01Options outstanding 5.13 22,200 66.41Options exercisable 4.34 18,815 69.01
Long-Term Incentive Plans$3.37-$5.06
Options outstanding/exercisable 6.11 51,412 4.22$5.07-$7.60
Options outstanding/exercisable 22.02 4,366 5.84$7.61-$11.41
Options outstanding/exercisable 2.03 103,988 10.39$11.42-$17.13
Options outstanding 1.21 1,364,797 14.04Options exercisable 1.10 1,264,797 13.84
$17.14-$25.71Options outstanding 2.19 764,541 20.87Options exercisable 2.19 761,053 20.87
$25.72-$38.58Options outstanding 4.86 30,541,526 33.99Options exercisable 4.86 30,313,343 33.99
$38.59-$71.30Options outstanding 7.56 69,076,904 47.22Options exercisable 6.32 30,758,582 48.32
Broad-Based Plans$16.56
Options outstanding/exercisable 2.56 580,251 16.56$24.85-$37.81
Options outstanding/exercisable 4.41 10,651,863 35.25$37.82-$46.50
Options outstanding 6.86 14,917,350 46.46Options exercisable 6.85 586,700 46.49
$46.51-$51.15Options outstanding 8.22 13,231,605 50.50Options exercisable 8.22 244,430 50.50
This table is a summary of our stock option plansdescribed on the preceding page.
__________December 31,2003 2002 2001
ESOP Preferred Stock:Allocated shares (common) 25,966,488 21,447,490 17,233,798Unreleased shares (preferred) 214,100 177,560 145,287
ESOP shares:Allocated shares (common) 5,961,494 7,974,031 9,809,875Unreleased shares (common) — — 3,042
Fair value of unearnedESOP shares (in millions) $214 $178 $145
Deferred Compensation Plan for Independent Sales AgentsWF Deferred Compensation Holdings, Inc. is a wholly-owned subsidiary of the Parent formed solely to sponsor a deferred compensation plan for independent sales agentswho provide investment, financial and other qualifying services for or with respect to participating affiliates. The plan, which became effective January 1, 2002, allows participants to defer all or part of their eligible compensationpayable to them by a participating affiliate. The Parent has fully and unconditionally guaranteed WF DeferredCompensation Holdings, Inc.’s deferred compensation obligations under the plan.
(in millions) Year ended December 31,2003 2002 2001
ESOP Preferred Stock:Common dividends $36 $21 $15Preferred dividends 26 24 19
ESOP shares (acquired in acquisitions):Common dividends 10 10 11
Total $72 $55 $45
The ESOP shares as of December 31, 2003, 2002 and 2001 were:
EMPLOYEE STOCK OWNERSHIP PLAN Under the Wells Fargo &Company 401(k) Plan (the 401(k) Plan), a defined contribu-tion employee stock ownership plan (ESOP), the 401(k) Planmay borrow money to purchase our common or preferredstock. Beginning in 1994, we have loaned money to the401(k) Plan to purchase shares of our ESOP Preferred Stock.As we release and convert ESOP Preferred Stock into com-mon shares, we record compensation expense equal to the

(in millions) December 31, 2003 2002 Pension benefits Pension benefits
Non- Other Non- OtherQualified qualified benefits Qualified qualified benefits
Projected benefit obligation at beginning of year $3,055 $215 $619 $2,781 $181 $546Service cost 164 22 15 154 20 14Interest cost 209 14 42 202 14 40Plan participants’ contributions — — 20 — — 13Amendments 17 — — — — —Plan mergers — — — 4 — —Actuarial gain (loss) 150 (31) 66 109 18 66Benefits paid (213) (18) (65) (195) (18) (60)Foreign exchange impact 5 — 1 — — —Projected benefit obligation at end of year $3,387 $202 $698 $3,055 $215 $619
Note 15: Employee Benefits and Other Expenses
Employee BenefitsWe sponsor noncontributory qualified defined benefit retirement plans including the Cash Balance Plan. The Cash Balance Plan is an active plan, which covers eligible employees (except employees of certain subsidiaries).
Under the Cash Balance Plan, eligible employees’ CashBalance Plan accounts are allocated a compensation creditbased on a percentage of their certified compensation. Thecompensation credit percentage is based on age and years of credited service. In addition, investment credits are allo-cated to participants quarterly based on their accumulatedbalances. Employees become vested in their Cash BalancePlan accounts after completing five years of vesting service or reaching age 65, if earlier. Pension benefits accrued beforethe conversion to the Cash Balance Plan are guaranteed. In addition, certain employees are eligible for a special transition benefit.
In 2003, we contributed $383 million in total to the pension plans, which included $350 million related to theCash Balance Plan. We funded the maximum amountdeductible under the Internal Revenue Code. The minimumrequired contribution in 2004 for the Cash Balance Plan isestimated to be zero. The maximum contribution amount forthe Cash Balance Plan is the maximum deductible contribu-tion under the Internal Revenue Code, which is dependenton several factors including proposed legislation that willaffect the interest rate used to determine the current liability.In addition, the decision to contribute the maximum amountis dependent on other factors including the actual investmentperformance of plan assets. Given these uncertainties, we arenot able to reliably estimate the maximum deductible contri-bution or the amount that will be contributed in 2004 to the
Cash Balance Plan. For the unfunded nonqualified pensionplans and postretirement benefit plans, we will contribute theminimum required amount in 2004, which is equal to thebenefits paid under the plans. In 2003 we paid $65 millionin benefits for the postretirement plans and $18 million forthe unfunded pension plans.
We sponsor defined contribution retirement plans includ-ing the 401(k) Plan. Under the 401(k) Plan, after one monthof service, eligible employees may contribute up to 25% oftheir pretax certified compensation, although there may be a lower limit for certain highly compensated employees inorder to maintain the qualified status of the 401(k) Plan.Eligible employees who complete one year of service are eligible for matching company contributions, which are generally a 100% match up to 6% of an employee’s certifiedcompensation. The matching contributions generally vestover four years.
Expenses for defined contribution retirement plans were$257 million, $248 million and $206 million in 2003, 2002and 2001, respectively.
We provide health care and life insurance benefits for certain retired employees and reserve the right to terminateor amend any of the benefits described above at any time.
The information set forth in the following tables is basedon current actuarial reports using the measurement date of November 30 for our pension and postretirement benefit plans.
This table shows the changes in the projected benefitobligation during 2003 and 2002 and the amounts includedin the Consolidated Balance Sheet at December 31, 2003 and 2002.
83
The weighted-average assumptions used to determine the projected benefit obligation were:
Year ended December 31, 2003 2002
Pension Other Pension Otherbenefits(1) benefits benefits(1) benefits
Discount rate 6.5% 6.5% 7.0% 7.0%Rate of compensation increase 4.0 — 4.0 —
(1) Includes both qualified and nonqualified pension benefits.
The accumulated benefit obligation for the defined benefit pension plans was $3,366 million and $3,021 million at December 31, 2003 and 2002, respectively.

(in millions) Year ended December 31, 2003 2002 Pension benefits Pension benefits
Non- Other Non- OtherQualified qualified benefits Qualified qualified benefits
Fair value of plan assets at beginning of year $3,090 $ — $213 $2,761 $ — $226Actual return on plan assets 445 — 26 (117) — (10)Employer contribution 365 18 79 641 18 44Plan participants’ contributions — — 19 — — 13Benefits paid (213) (18) (65) (195) (18) (60)Foreign exchange impact 3 — — — — —Fair value of plan assets at end of year $3,690 $ — $272 $3,090 $ — $213
This table shows the changes in the fair value of plan assets during 2003 and 2002.
We seek to achieve the expected long-term rate of returnwith a prudent level of risk given the benefit obligations ofthe pension plans and their funded status. We target theCash Balance Plan’s asset allocation for a target mix range of 43–67% equities, 27–51% fixed income, and approxi-mately 6% in real estate and venture capital. The targetranges employ a Tactical Asset Allocation overlay, which isdesigned to overweight stocks or bonds when a compellingopportunity exists. The Cash Balance Plan does not currently
invest in any hedge fund strategies or other alternativeinvestments. The Employee Benefit Review Committee(EBRC), which includes several members of senior manage-ment, formally reviews the investment risk and performanceof the Cash Balance Plan on a quarterly basis. Annual Planliability analysis and periodic asset/liability evaluations arealso conducted.
The weighted-average allocation of plan assets atDecember 31, 2003 and 2002 was:
Percentage of plan assets at December 31, 2003 2002
Pension Other Pension Otherplan benefit plan benefit
assets plan assets assets plan assets
Equity securities 66% 49% 63% 45%Debt securities 31 46 33 50Real estate 2 1 3 1Other 1 4 1 4
Total 100% 100% 100% 100%
This table reconciles the funded status of the plans to the amounts included in the Consolidated Balance Sheet atDecember 31, 2003 and 2002.
(in millions) Year ended December 31, 2003 2002 Pension benefits Pension benefits
Non- Other Non- OtherQualified qualified benefits Qualified qualified benefits
Funded status (1) $303 $(202) $(426) $ 35 $(215) $(406)Employer contributions in December — 2 7 — — 7Unrecognized net actuarial loss 523 1 128 660 40 66Unrecognized net transition asset (1) — 4 (1) — 4Unrecognized prior service cost (13) (8) (9) (15) (8) (11)Accrued benefit income (cost) $812 $(207) $ (296) $679 $(183) $(340)
Amounts recognized in the balance sheetconsist of:
Prepaid benefit cost $812 $ — $ — $679 $ — $ —Accrued benefit liability (2) (209) (296) (2) (183) (340)Intangible asset 1 — — 2 — —Accumulated other
comprehensive income 1 2 — — — —Accrued benefit income (cost) $812 $(207) $ (296) $679 $(183) $(340)
(1) Fair value of plan assets at year end less benefit obligation at year end.
84

The net periodic benefit cost (income) for 2003, 2002 and 2001 was:
Year ended December 31, 2003 2002 2001
Pension Other Pension Other Pension Otherbenefits(1) benefits benefits(1) benefits benefits(1) benefits
Discount rate 7.0% 7.0% 7.5% 7.5% 7.5% 7.5%Expected
return on plan assets 9.0 9.0 9.0 9.0 9.0 9.0
Rate ofcompensationincrease 4.0 — 4.0 — 5.0 —
(1) Includes both qualified and nonqualified pension benefits.
The weighted-average assumptions used to determine thenet periodic benefit cost (income) were:
85
The table to the right provides information for pension plans with benefit obligations in excess of plan assets, which are substantially due to our nonqualified pension plans:
(in millions) December 31,2003 2002
Projected benefit obligation $240 $245Accumulated benefit obligation 207 204Fair value of plan assets 28 22
The plans have a long-term rate of return assumption of9%. The rate was derived based on a combination of factorsincluding (1) long-term historical return experience for majorasset class categories (i.e., large cap and small cap domesticequities, international equities and domestic fixed income),and (2) forward-looking return expectations for these majorasset classes.
To account for postretirement health care plans we use ahealth care cost trend rate to recognize the effect of expectedchanges in future health care costs due to medical inflation,
utilization changes, new technology, regulatory requirementsand Medicare cost shifting. We assumed average annualincreases of 9.5% for HMOs and for all other types of cov-erage in the per capita cost of covered health care benefitsfor 2004. By 2008 and thereafter, we assumed rates of 5.5%for HMOs and for all other types of coverage. Increasing the assumed health care trend by one percentage point in each year would increase the benefit obligation as ofDecember 31, 2003 by $57 million and the total of the interest cost and service cost components of the net periodicbenefit cost for 2003 by $5 million. Decreasing the assumedhealth care trend by one percentage point in each year woulddecrease the benefit obligation as of December 31, 2003 by $51 million and the total of the interest cost and servicecost components of the net periodic benefit cost for 2003 by $4 million.
The investment strategy for the postretirement plans is maintained separate from the strategy for the pensionplans. The general target asset mix is 55–65% equities and 35–41% fixed income. In addition, the Retiree MedicalPlan VEBA considers the effect of income taxes by utilizing a combination of variable annuity and low turnover invest-ment strategies. Members of the EBRC formally review the investment risk and performance of the postretirementplans on a quarterly basis.
(in millions) Year ended December 31, 2003 2002 2001
Pension benefits Pension benefits Pension benefitsNon- Other Non- Other Non- Other
Qualified qualified benefits Qualified qualified benefits Qualified qualified benefits
Service cost $ 164 $22 $ 15 $ 154 $20 $ 14 $ 146 $15 $ 16Interest cost 209 14 42 202 14 40 181 10 42Expected return
on plan assets (275) — (18) (244) — (19) (287) — (20)Recognized
net actuarial loss (gain) (1) 85 7 (3) 2 7 (7) (120) 8 (2)
Amortization ofprior service cost 16 — (1) (1) (1) (1) — — (1)
Amortization ofunrecognized transition asset — — 1 (1) — — (1) — —
Settlement — — — — — — (1) — —Net periodic benefit
cost (income) $ 199 $43 $ 36 $ 112 $40 $ 27 $ (82) $33 $ 35
(1) Net actuarial loss (gain) is generally amortized over five years.

(in millions) December 31,2003 2002
Deferred Tax AssetsAllowance for loan losses $1,479 $1,451Net tax-deferred expenses 567 677Other 102 242
Total deferred tax assets 2,148 2,370
Deferred Tax LiabilitiesCore deposit intangibles 251 298Leasing 2,225 2,145Mark to market 1,026 296Mortgage servicing 2,206 1,612FAS 115 adjustment 559 611FAS 133 adjustment 8 (17)Other 390 308
Total deferred tax liabilities 6,665 5,253
Net Deferred Tax Liability $4,517 $2,883
The components of income tax expense were:
The tax benefit related to the exercise of employee stockoptions recorded in stockholders’ equity was $148 million,$73 million and $88 million for 2003, 2002 and 2001, respectively.
We had a net deferred tax liability of $4,517 million and$2,883 million at December 31, 2003 and 2002, respectively.The tax effects of temporary differences that gave rise to significant portions of deferred tax assets and liabilities atDecember 31, 2003 and 2002 are presented in the table tothe right.
We have determined that a valuation reserve is notrequired for any of the deferred tax assets since it is morelikely than not that these assets will be realized principallythrough carry back to taxable income in prior years, futurereversals of existing taxable temporary differences, and, to a lesser extent, future taxable income and tax planningstrategies. Our conclusion that it is “more likely than not”that the deferred tax assets will be realized is based on federal taxable income in excess of $13 billion in the carry-back period, substantial state taxable income in thecarry-back period, as well as a history of growth in earningsand the prospects for continued earnings growth.
Note 16: Income Taxes
(in millions) Year ended December 31,2003 2002 2001
Current:Federal $1,298 $2,529 $2,329State and local 165 273 282Foreign 114 37 34
1,577 2,839 2,645Deferred:
Federal 1,492 268 (524)State and local 206 37 (72)
1,698 305 (596)
Total $3,275 $3,144 $2,049
The deferred tax liability related to 2003, 2002 or 2001unrealized gains and losses on securities available for saleand 2003 derivatives and hedging activities had no effect onincome tax expense as these gains and losses, net of taxes,were recorded in cumulative other comprehensive income.
We have unrecognized deferred income tax liabilitiesassociated with undistributed earnings of foreign subsidiariestotaling $99 million. The earnings are indefinitely reinvestedin the foreign subsidiaries and are therefore not taxableunder current law. To the extent that we change our intent to indefinitely reinvest the undistributed earnings, we willrecognize a deferred tax liability. A current tax liability will be recognized to the extent that we receive the undistrib-uted earnings through a taxable event, such as a dividend, a sale of the company or as a result of a change in law.
86
(in millions) Year ended December 31,2003 2002 2001
Contract services $866 $546 $538Outside professional services 509 445 441Outside data processing 404 350 319Advertising and promotion 392 327 276Travel and entertainment 389 337 286Telecommunications 343 347 355Postage 336 256 242Goodwill — — 610
Other ExpensesExpenses which exceeded 1% of total interest income andnoninterest income and which are not otherwise shown separately in the financial statements or Notes to FinancialStatements were:

(in millions) Year ended December 31, 2003 2002 2001Amount Rate Amount Rate Amount Rate
Statutory federal income tax expense and rate $3,317 35.0% $3,100 35.0% $1,911 35.0%Change in tax rate resulting from:
State and local taxes on income, net offederal income tax benefit 241 2.5 201 2.3 137 2.5
Goodwill amortization notdeductible for tax return purposes — — — — 196 3.6
Tax-exempt income and tax credits (161) (1.7) (122) (1.4) (131) (2.4)Donations of appreciated securities (90) (.9) — — (28) (.5)Other (32) (.3) (35) (.4) (36) (.7)
Effective income tax expense and rate $3,275 34.6% $3,144 35.5% $2,049 37.5%
The table below reconciles the statutory federal income tax expense and rate to the effective income tax expense and rate.
87

(in millions, except per share amounts) Year ended December 31,
2003 2002 2001
Net income before effect of change in accounting principle $ 6,202 $ 5,710 $ 3,411
Less: Preferred stock dividends 3 4 14
Net income applicable to common stock before effect ofchange in accounting principle (numerator) 6,199 5,706 3,397
Cumulative effect of change in accounting principle (numerator) — (276) —
Net income applicable to common stock (numerator) $ 6,199 $ 5,430 $ 3,397
EARNINGS PER COMMON SHARE
Average common shares outstanding (denominator) 1,681.1 1,701.1 1,709.5
Per share before effect of change in accounting principle $ 3.69 $ 3.35 $ 1.99
Per share effect of change in accounting principle — (.16) —
Per share $ 3.69 $ 3.19 $ 1.99
DILUTED EARNINGS PER COMMON SHARE
Average common shares outstanding 1,681.1 1,701.1 1,709.5
Add: Stock options 16.0 16.6 16.8
Restricted share rights .4 .3 .6
Diluted average common shares outstanding (denominator) 1,697.5 1,718.0 1,726.9
Per share before effect of change in accounting principle $ 3.65 $ 3.32 $ 1.97
Per share effect of change in accounting principle — (.16) —
Per share $ 3.65 $ 3.16 $ 1.97
The table below shows earnings per common share anddiluted earnings per common share and reconciles the
Note 17: Earnings Per Common Share
numerator and denominator of both earnings per commonshare calculations.
Under FAS 142, Goodwill and Other Intangible Assets,effective January 1, 2002 amortization of goodwill was discontinued. For comparability, the table below reconciles
Note 18: “Adjusted” Earnings – FAS 142 Transitional Disclosure
the Company’s 2001 reported earnings to “adjusted” earnings, which exclude goodwill amortization.
(in millions, except per Year ended December 31, 2001share amounts)
NET INCOMEReported net income $3,411Goodwill amortization, net of tax 571
Adjusted net income $3,982
EARNINGS PER COMMON SHAREReported earnings per common share $ 1.99Goodwill amortization, net of tax .34
Adjusted earnings per common share $ 2.33
DILUTED EARNINGS PER COMMON SHAREReported diluted earnings per common share $ 1.97Goodwill amortization, net of tax .33
Adjusted diluted earnings per common share $ 2.30
88
In 2003, 2002 and 2001, options to purchase 4.4 million,35.9 million and 39.9 million shares, respectively, were outstanding but not included in the calculation of earnings
per share because the exercise price was higher than themarket price, and therefore they were antidilutive.

(in millions) Before Tax Net oftax effect tax
2001:Translation adjustments $ (5) $ (2) $ (3)Minimum pension liability adjustment (68) (26) (42)Securities available for sale and other
retained interest:Net unrealized losses arising during the year (574) (211) (363)Reclassification of net lossesincluded in net income 601 228 373
Net unrealized gains arising during the year 27 17 10
Cumulative effect of the changein accounting principle forderivatives and hedging activities 109 38 71
Derivatives and hedging activities:Net unrealized gains arisingduring the year 196 80 116Reclassification of net losses oncash flow hedges included innet income 120 44 76
Net unrealized gains arisingduring the year 316 124 192
Other comprehensive income $ 379 $ 151 $ 228
2002:Translation adjustments $ 1 $ — $ 1Minimum pension liability adjustment 68 26 42Securities available for sale and
other retained interests:Net unrealized gains arising during the year 414 159 255Reclassification of net lossesincluded in net income 369 140 229
Net unrealized gains arising during the year 783 299 484
Derivatives and hedging activities:Net unrealized losses arisingduring the year (800) (297) (503)Reclassification of net losseson cash flow hedges includedin net income 318 118 200
Net unrealized losses arising during the year (482) (179) (303)
Other comprehensive income $ 370 $ 146 $ 224
2003:Translation adjustments $ 42 $ 16 $ 26Securities available for sale and
other retained interests:Net unrealized losses arising during the year (117) (42) (75)Reclassification of net gainsincluded in net income (68) (26) (42)
Net unrealized losses arising during the year (185) (68) (117)
Derivatives and hedging activities:Net unrealized losses arisingduring the year (1,629) (603) (1,026)Reclassification of net losseson cash flow hedges includedin net income 1,707 628 1,079
Net unrealized gains arising during the year 78 25 53
Other comprehensive income $ (65) $ (27) $ (38)
Note 19: Other Comprehensive Income
The components of other comprehensive income and therelated tax effects were:
89
Cumulative other comprehensive income balances were:
(in millions) Translation Minimum Net Net Cumulative adjustments pension unrealized unrealized other
liability gains gains comprehensive adjustment (losses) on (losses) on income
securities derivatives and other and other
retained hedging interests activities
Balance,December 31, 2000 $(12) $ — $ 536 $ — $524
Net change (3) (42) 10 263 228Balance,December 31, 2001 (15) (42) 546 263 752
Net change 1 42 484 (303) 224Balance,December 31, 2002 (14) — 1,030 (40) 976
Net change 26 — (117) 53 (38)Balance,December 31, 2003 $ 12 $ — $ 913 $ 13 $938

Note 20: Operating Segments
We have three lines of business for management reporting:Community Banking, Wholesale Banking and Wells FargoFinancial. The results for these lines of business are based on our management accounting process, which assigns bal-ance sheet and income statement items to each responsibleoperating segment. This process is dynamic and, unlikefinancial accounting, there is no comprehensive, authoritativeguidance for management accounting equivalent to generallyaccepted accounting principles. The management accountingprocess measures the performance of the operating segmentsbased on our management structure and is not necessarilycomparable with similar information for other financial services companies. We define our operating segments byproduct type and customer segments. If the managementstructure and/or the allocation process changes, allocations,transfers and assignments may change. In that case, resultsfor prior periods would be (and have been) restated for comparability. Results for 2001 have been restated to eliminate goodwill amortization from the operating segments and to reflect changes in transfer pricing methodology applied in first quarter 2002.
The Community Banking Group offers a complete line of diversified financial products and services to consumersand small businesses with annual sales generally up to $10 million in which the owner generally is the financialdecision maker. Community Banking also offers investmentmanagement and other services to retail customers and highnet worth individuals, insurance, securities brokerage andinsurance through affiliates and venture capital financing.These products and services include Wells Fargo Funds®, afamily of mutual funds, as well as personal trust, employeebenefit trust and agency assets. Loan products include linesof credit, equity lines and loans, equipment and transporta-tion (auto, recreational vehicle and marine) loans, educationloans, origination and purchase of residential mortgage loansand servicing of mortgage loans and credit cards. Othercredit products and financial services available to small busi-nesses and their owners include receivables and inventoryfinancing, equipment leases, real estate financing, SmallBusiness Administration financing, venture capital financing,cash management, payroll services, retirement plans, medicalsavings accounts and credit and debit card processing.Consumer and business deposit products include checkingaccounts, savings deposits, market rate accounts, IndividualRetirement Accounts (IRAs), time deposits and debit cards.
Community Banking serves customers through a widerange of channels, which include traditional banking stores,in-store banking centers, business centers and ATMs. Also,
PhoneBankSM centers and the National Business BankingCenter provide 24-hour telephone service. Online bankingservices include single sign-on to online banking, bill pay and brokerage, as well as online banking for small business.
The Wholesale Banking Group serves businesses acrossthe United States with annual sales generally in excess of$10 million. Wholesale Banking provides a complete line of commercial, corporate and real estate banking productsand services. These include traditional commercial loans and lines of credit, letters of credit, asset-based lending,equipment leasing, mezzanine financing, high-yield debt,international trade facilities, foreign exchange services, treasury management, investment management, institutionalfixed income and equity sales, online/electronic products,insurance brokerage services and investment banking ser-vices. Wholesale Banking includes the majority ownershipinterest in the Wells Fargo HSBC Trade Bank, which provides trade financing, letters of credit and collection services and is sometimes supported by the Export-ImportBank of the United States (a public agency of the UnitedStates offering export finance support for American-madeproducts). Wholesale Banking also supports the commercialreal estate market with products and services such as con-struction loans for commercial and residential development,land acquisition and development loans, secured and unsecured lines of credit, interim financing arrangements for completed structures, rehabilitation loans, affordablehousing loans and letters of credit, permanent loans forsecuritization, commercial real estate loan servicing and real estate and mortgage brokerage services.
Wells Fargo Financial includes consumer finance andauto finance operations. Consumer finance operations make direct consumer and real estate loans to individualsand purchase sales finance contracts from retail merchantsfrom offices throughout the United States, Canada and inthe Caribbean. Automobile finance operations specialize inpurchasing sales finance contracts directly from automobiledealers and making loans secured by automobiles in theUnited States and Puerto Rico. Wells Fargo Financial also provides credit cards and lease and other commercial financing.
The Other Column consists of Corporate level investment activities and balances and unallocated goodwill balances held at the enterprise level. This column also includes separately identified transactionsrecorded at the enterprise level for management reporting.
90

(income/expense in millions,average balances in billions) Community Wholesale Wells Fargo Other (3) Consolidated
Banking Banking Financial Company
2003Net interest income (1) $11,495 $2,228 $2,311 $ (27) $16,007Provision for loan losses (2) 892 177 623 30 1,722Noninterest income 9,218 2,766 378 20 12,382Noninterest expense 13,214 2,579 1,343 54 17,190Income (loss) before income tax
expense (benefit) 6,607 2,238 723 (91) 9,477Income tax expense (benefit) 2,243 792 272 (32) 3,275
Net income (loss) $ 4,364 $1,446 $ 451 $ (59) $ 6,202
2002Net interest income (1) $ 10,372 $ 2,257 $ 1,866 $ (13) $ 14,482Provision for loan losses (2) 865 278 541 — 1,684Noninterest income 8,085 2,316 354 12 10,767Noninterest expense 11,241 2,367 1,099 4 14,711Income (loss) before income tax expense
(benefit) and effect of change in accounting principle 6,351 1,928 580 (5) 8,854
Income tax expense (benefit) 2,235 692 220 (3) 3,144Net income (loss) before effect of change
in accounting principle 4,116 1,236 360 (2) 5,710Cumulative effect of change in
accounting principle — (98) (178) — (276)
Net income (loss) $ 4,116 $ 1,138 $ 182 $ (2) $ 5,434
2001Net interest income (1) $ 8,212 $ 2,164 $ 1,679 $ (79) $ 11,976Provision for loan losses (2) 962 278 487 — 1,727Noninterest income 6,503 2,117 371 14 9,005Noninterest expense 9,840 2,300 1,028 626 13,794Income (loss) before income tax
expense (benefit) 3,913 1,703 535 (691) 5,460Income tax expense (benefit) 1,325 610 201 (87) 2,049
Net income (loss) $ 2,588 $ 1,093 $ 334 $(604) $ 3,411
2003Average loans $ 143.2 $ 49.5 $ 20.4 $ — $ 213.1Average assets 273.5 75.8 22.2 6.1 377.6Average core deposits 184.6 22.3 .1 — 207.0
2002Average loans $ 109.9 $ 49.4 $ 15.2 $ — $ 174.5Average assets 227.7 70.8 17.0 6.2 321.7Average core deposits 165.6 18.4 .1 — 184.1
(1) Net interest income is the difference between interest earned on assets and the cost of liabilities to fund those assets. Interest earned includes actual interest earned on segment assets and, if the segment has excess liabilities, interest credits for providing funding to other segments. The cost of liabilities includes interest expense on segment liabilities and, if the segment does not have enough liabilities to fund its assets, a funding charge based on the cost of excess liabilities from another segment.In general, Community Banking has excess liabilities and receives interest credits for the funding it provides the other segments.
(2) Generally, the provision for loan losses represents actual net charge-offs for each operating segment.(3) For 2003, the reconciling items for revenue (net interest income plus noninterest income) and net income principally relate to Corporate level equity investment activities
and other separately identified transactions recorded at the enterprise level for management reporting, including a $30 million non-recurring loss on sale of a sub-primecredit card portfolio and $51 million of other charges related to employee benefits and software. For 2002, the reconciling items for revenue and net income are Corporatelevel equity investment activities. For 2001, revenue includes Corporate level equity investment activities of $28 million and unallocated items of $(93) million and net income includes Corporate level equity investment activities of $15 million and unallocated items of $(619) million. The primary reconciling item in 2001 for noninterestexpense is amortization of goodwill. Results for 2001 have been restated to reclassify goodwill amortization from the three operating segments to the other column for comparability. The primary reconciling item for average assets for all periods presented is unallocated goodwill.
91

In the normal course of creating securities to sell toinvestors, we may sponsor special-purpose entities whichhold, for the benefit of the investors, financial instrumentsthat are the source of payment to the investors. Special-purpose entities are consolidated unless they meet the criteriafor a qualifying special-purpose entity in accordance withFAS 140 or are not required to be consolidated under existingaccounting guidance.
For securitizations completed in 2003 and 2002, we usedthe following assumptions to determine the fair value ofmortgage servicing rights and other retained interests at thedate of securitization.
(in millions) Year ended December 31, 2003 2002
Mortgage Other Mortgage Otherloans financial loans financial
assets assets
Sales proceeds from securitizations $23,870 $132 $15,718 $102
Servicing fees 60 8 78 16Cash flows on other
retained interests 137 9 146 26
Note 21: Securitizations and Variable Interest Entities
We routinely originate, securitize and sell into the secondarymarket home mortgage loans and, from time to time, other financial assets, including student loans, commercialmortgage loans, home equity loans, auto receivables andsecurities. We typically retain the servicing rights and mayretain other beneficial interests from these sales. These securitizations are usually structured without recourse to usand with no restrictions on the retained interests. We do nothave significant credit risks from the retained interests.
We recognized gains of $393 million from sales of financial assets in securitizations in 2003 and $100 million in 2002. Additionally, we had the following cash flows with our securitization trusts.
At December 31, 2003, key economic assumptions andthe sensitivity of the current fair value of mortgage servicingrights, both purchased and retained, and other retainedinterests related to residential mortgage loan securitizationsto immediate adverse changes in those assumptions are presented in the table below.
These sensitivities are hypothetical and should be used with caution. Changes in fair value based on a 10%variation in assumptions generally cannot be extrapolatedbecause the relationship of the change in the assumption to the change in fair value may not be linear. Also, in the table below, the effect of a variation in a particular assumption on the fair value of the retained interest is calculated independently without changing any otherassumption. In reality, changes in one factor may result inchanges in another (for example, changes in prepaymentspeed estimates could result in changes in the discountrates), which might magnify or counteract the sensitivities.
($ in millions) Mortgage Other retainedservicing rights interests
Fair value of retained interests $6,916 $ 212 Expected weighted-average life (in years) 4.3 2.4
Prepayment speed assumption (annual CPR) 17.5% 20.7%Decrease in fair value from
10% adverse change $ 339 $ 9Decrease in fair value from
25% adverse change 773 20
Discount rate assumption 9.6% 11.1%Decrease in fair value from
100 basis point adverse change $ 236 $ 5Decrease in fair value from
200 basis point adverse change 455 11
Mortgage Other retainedservicing rights interests
2003 2002 2003 2002
Prepayment speed (annual CPR (1))(2) 15.1% 12.7% 18.0% 16.0%Life (in years) (2) 5.6 6.8 4.3 6.0Discount rate (2) 8.1% 8.9% 11.6% 14.6%
(1) Constant prepayment rate(2) Represents weighted averages for all retained interests resulting from
securitizations completed in 2003 and 2002.
92
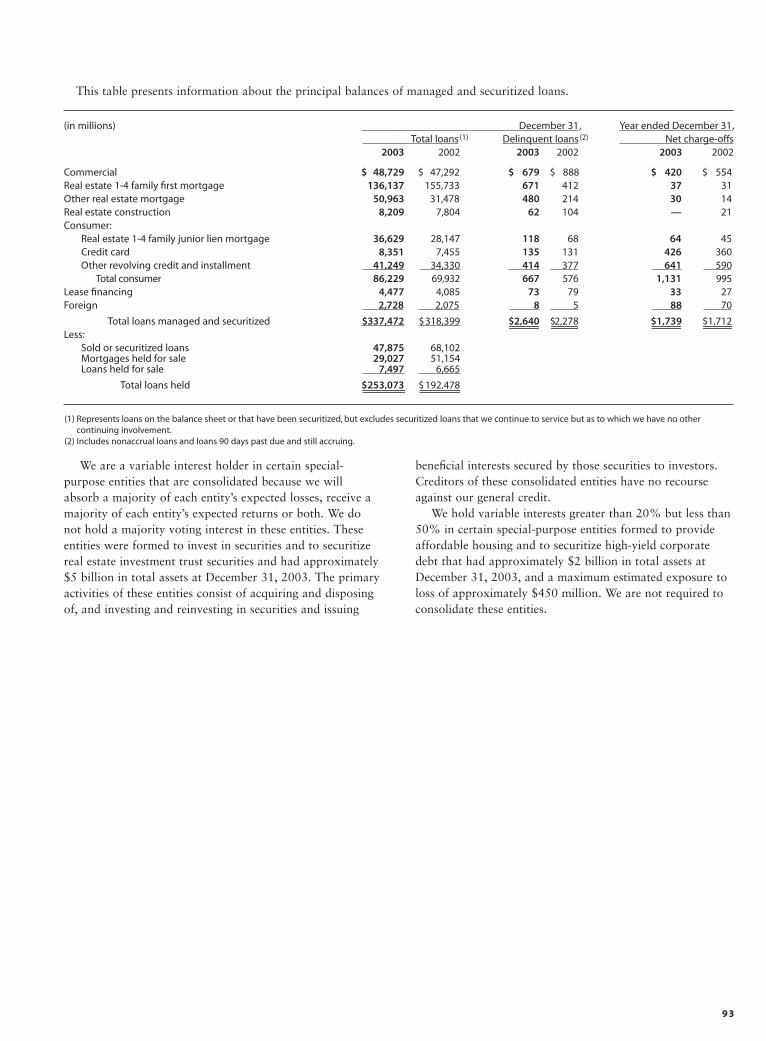
93
(in millions) December 31, Year ended December 31,Total loans (1) Delinquent loans (2) Net charge-offs
2003 2002 2003 2002 2003 2002
Commercial $ 48,729 $ 47,292 $ 679 $ 888 $ 420 $ 554Real estate 1-4 family first mortgage 136,137 155,733 671 412 37 31Other real estate mortgage 50,963 31,478 480 214 30 14Real estate construction 8,209 7,804 62 104 — 21Consumer:
Real estate 1-4 family junior lien mortgage 36,629 28,147 118 68 64 45Credit card 8,351 7,455 135 131 426 360Other revolving credit and installment 41,249 34,330 414 377 641 590
Total consumer 86,229 69,932 667 576 1,131 995Lease financing 4,477 4,085 73 79 33 27Foreign 2,728 2,075 8 5 88 70
Total loans managed and securitized $337,472 $318,399 $2,640 $2,278 $1,739 $1,712Less:
Sold or securitized loans 47,875 68,102Mortgages held for sale 29,027 51,154Loans held for sale 7,497 6,665
Total loans held $253,073 $ 192,478
(1) Represents loans on the balance sheet or that have been securitized, but excludes securitized loans that we continue to service but as to which we have no other continuing involvement.
(2) Includes nonaccrual loans and loans 90 days past due and still accruing.
This table presents information about the principal balances of managed and securitized loans.
We are a variable interest holder in certain special-purpose entities that are consolidated because we will absorb a majority of each entity’s expected losses, receive amajority of each entity’s expected returns or both. We do not hold a majority voting interest in these entities. Theseentities were formed to invest in securities and to securitizereal estate investment trust securities and had approximately$5 billion in total assets at December 31, 2003. The primaryactivities of these entities consist of acquiring and disposingof, and investing and reinvesting in securities and issuing
beneficial interests secured by those securities to investors.Creditors of these consolidated entities have no recourseagainst our general credit.
We hold variable interests greater than 20% but less than50% in certain special-purpose entities formed to provideaffordable housing and to securitize high-yield corporatedebt that had approximately $2 billion in total assets atDecember 31, 2003, and a maximum estimated exposure toloss of approximately $450 million. We are not required toconsolidate these entities.

94
Net of valuation allowance, mortgage servicing rights(MSRs) totaled $6.9 billion (1.15% of the total mortgageservicing portfolio) at December 31, 2003, compared with$4.5 billion (.92%) at December 31, 2002.
This table summarizes the changes in mortgage servicing rights.
Mortgage banking activities, included in the CommunityBanking and Wholesale Banking operating segments, consist of residential and commercial mortgage originationsand servicing.
The components of mortgage banking noninterest income were:
Note 22: Mortgage Banking Activities
(in millions) Year ended December 31,2003 2002 2001
Origination and other closing fees $1,218 $1,048 $ 737
Servicing fees, net of amortization and provision for impairment(1) (954) (737) (260)
Net gains on securities available for sale — — 134
Net gains on mortgage loan originations/sales activities 1,801 1,038 705
All other 447 364 355Total mortgage banking
noninterest income $2,512 $1,713 $1,671
Each quarter, we evaluate MSRs for possible impairmentbased on the difference between the carrying amount andcurrent fair value of the MSRs, in accordance with FAS 140.If a temporary impairment exists, we establish a valuationallowance for any excess of amortized cost, as adjusted forhedge accounting, over the current fair value through acharge to income. We have a policy of reviewing MSRs forother-than-temporary impairment each quarter and recognizea direct write-down when the recoverability of a recordedvaluation allowance is determined to be remote. Unlike avaluation allowance, a direct write-down permanentlyreduces the carrying value of the MSRs and the valuationallowance, precluding subsequent reversals. (See Note 1 –Transfer and Servicing of Financial Assets for additional discussion of our policy for valuation of MSRs.) In 2003 and 2002, we determined that a portion of the asset was notrecoverable and reduced both the asset and the previouslydesignated valuation allowance by a $1,338 million and$1,071 million write-down, respectively.
The components of the managed servicing portfolio were:
(in millions) Year ended December 31,2003 2002 2001
Mortgage servicing rights:Balance, beginning of year $ 6,677 $ 7,365 $5,609
Originations(1) 3,546 2,408 1,883Purchases(1) 2,140 1,474 962Amortization (2,760) (1,942) (914)Write-down (1,338) (1,071) —Other (includes changes in
mortgage servicing rights due to hedging) 583 (1,557) (175)
Balance, end of year $ 8,848 $ 6,677 $7,365
Valuation Allowance:Balance, beginning of year $ 2,188 $ 1,124 $ —
Provision for mortgage servicing rights in excess of fair value 1,092 2,135 1,124
Write-down of mortgageservicing rights (1,338) (1,071) —
Balance, end of year $ 1,942 $ 2,188 $1,124
Mortgage servicing rights, net $ 6,906 $ 4,489 $6,241
(in billions) December 31,2003 2002
Loans serviced for others $598 $487
Owned loans serviced (portfolio and held for sale) 112 94
Total owned servicing 710 581Sub-servicing 21 36
Total managed servicing portfolio $731 $617
(1) Based on December 31, 2003 assumptions, the weighted-average amortizationperiod for mortgage servicing rights added during the year was 5.6 years.
(1) Includes impairment write-downs on other retained interests of $79 million,$567 million and $27 million for 2003, 2002 and 2001, respectively.

95
Note 23: Condensed Consolidating Financial Statements
Condensed Consolidating Statement of Income
(in millions) Parent WFFI Other Eliminations Consolidatedconsolidating Company
subsidiaries
Year ended December 31, 2003
Dividends from subsidiaries:Bank $5,194 $ — $ — $(5,194) $ — Nonbank 841 — — (841) —
Interest income from loans 2 2,799 11,136 — 13,937Interest income from subsidiaries 567 — — (567) —Other interest income 75 77 5,329 — 5,481
Total interest income 6,679 2,876 16,465 (6,602) 19,418
Short-term borrowings 81 73 413 (245) 322Long-term debt 560 730 321 (256) 1,355Other interest expense — — 1,734 — 1,734
Total interest expense 641 803 2,468 (501) 3,411
NET INTEREST INCOME 6,038 2,073 13,997 (6,101) 16,007Provision for loan losses — 814 908 — 1,722Net interest income after provision for loan losses 6,038 1,259 13,089 (6,101) 14,285
NONINTEREST INCOMEFee income – nonaffiliates — 209 6,664 — 6,873Other 167 239 5,195 (92) 5,509
Total noninterest income 167 448 11,859 (92) 12,382
NONINTEREST EXPENSESalaries and benefits 134 745 7,567 — 8,446Other 18 583 8,301 (158) 8,744
Total noninterest expense 152 1,328 15,868 (158) 17,190
INCOME BEFORE INCOME TAX EXPENSE(BENEFIT) AND EQUITY IN UNDISTRIBUTEDINCOME OF SUBSIDIARIES 6,053 379 9,080 (6,035) 9,477
Income tax expense (benefit) (48) 143 3,180 — 3,275Equity in undistributed income of subsidiaries 101 — — (101) —
NET INCOME $6,202 $ 236 $ 5,900 $(6,136) $ 6,202
Following are the condensed consolidating financial state-ments of the Parent and Wells Fargo Financial Inc. and its wholly-owned subsidiaries (WFFI). The Wells FargoFinancial business segment for management reporting
(see Note 20) consists of WFFI and other affiliated consumer finance entities managed by WFFI but not included in WFFI reported below.

96
Condensed Consolidating Statements of Income
(in millions) Parent WFFI Other Eliminations Consolidatedconsolidating Company
subsidiariesYear ended December 31, 2002
Dividends from subsidiaries:Bank $3,561 $ — $ — $(3,561) $ —Nonbank 234 — — (234) —
Interest income from loans — 2,295 10,750 — 13,045Interest income from subsidiaries 365 — — (365) —Other interest income 78 78 5,270 (12) 5,414
Total interest income 4,238 2,373 16,020 (4,172) 18,459
Short-term borrowings 127 96 347 (34) 536Long-term debt 457 549 571 (173) 1,404Other interest expense — — 2,037 — 2,037
Total interest expense 584 645 2,955 (207) 3,977
NET INTEREST INCOME 3,654 1,728 13,065 (3,965) 14,482Provision for loan losses — 556 1,128 — 1,684Net interest income after provision for loan losses 3,654 1,172 11,937 (3,965) 12,798
NONINTEREST INCOMEFee income – nonaffiliates — 202 6,156 — 6,358Other 164 222 4,088 (65) 4,409
Total noninterest income 164 424 10,244 (65) 10,767
NONINTEREST EXPENSESalaries and benefits 162 560 6,650 — 7,372Other 27 466 6,911 (65) 7,339
Total noninterest expense 189 1,026 13,561 (65) 14,711
INCOME BEFORE INCOME TAX EXPENSE(BENEFIT), EQUITY IN UNDISTRIBUTEDINCOME OF SUBSIDIARIES AND EFFECT OF CHANGE IN ACCOUNTING PRINCIPLE 3,629 570 8,620 (3,965) 8,854
Income tax expense (benefit) (222) 210 3,156 — 3,144Equity in undistributed income of subsidiaries 1,602 — — (1,602) —
NET INCOME BEFORE EFFECT OF CHANGEIN ACCOUNTING PRINCIPLE 5,453 360 5,464 (5,567) 5,710
Cumulative effect of change in accounting principle (19) — (257) — (276)
NET INCOME $5,434 $ 360 $ 5,207 $(5,567) $ 5,434
Year ended December 31, 2001
Dividends from subsidiaries:Bank $2,360 $ — $ — $(2,360) $ —Nonbank 218 — — (218) —
Interest income from loans — 2,136 12,438 (597) 13,977Interest income from subsidiaries 566 — — (566) —Other interest income 128 79 5,034 (501) 4,740
Total interest income 3,272 2,215 17,472 (4,242) 18,717
Short-term borrowings 305 187 2,063 (1,282) 1,273Long-term debt 691 498 777 (140) 1,826Other interest expense — — 3,910 (268) 3,642
Total interest expense 996 685 6,750 (1,690) 6,741
NET INTEREST INCOME 2,276 1,530 10,722 (2,552) 11,976Provision for loan losses — 526 1,201 — 1,727Net interest income after provision for loan losses 2,276 1,004 9,521 (2,552) 10,249
NONINTEREST INCOMEFee income – nonaffiliates 2 199 5,506 — 5,707Other 99 208 5,897 (2,906) 3,298
Total noninterest income 101 407 11,403 (2,906) 9,005
NONINTEREST EXPENSESalaries and benefits (11) 523 5,670 — 6,182Other 159 465 9,869 (2,881) 7,612
Total noninterest expense 148 988 15,539 (2,881) 13,794
INCOME BEFORE INCOME TAX EXPENSE (BENEFIT) ANDEQUITY IN UNDISTRIBUTED INCOME OF SUBSIDIARIES 2,229 423 5,385 (2,577) 5,460
Income tax expense (benefit) (230) 159 2,120 — 2,049Equity in undistributed income of subsidiaries 952 — — (952) —
NET INCOME $3,411 $ 264 $ 3,265 $(3,529) $ 3,411
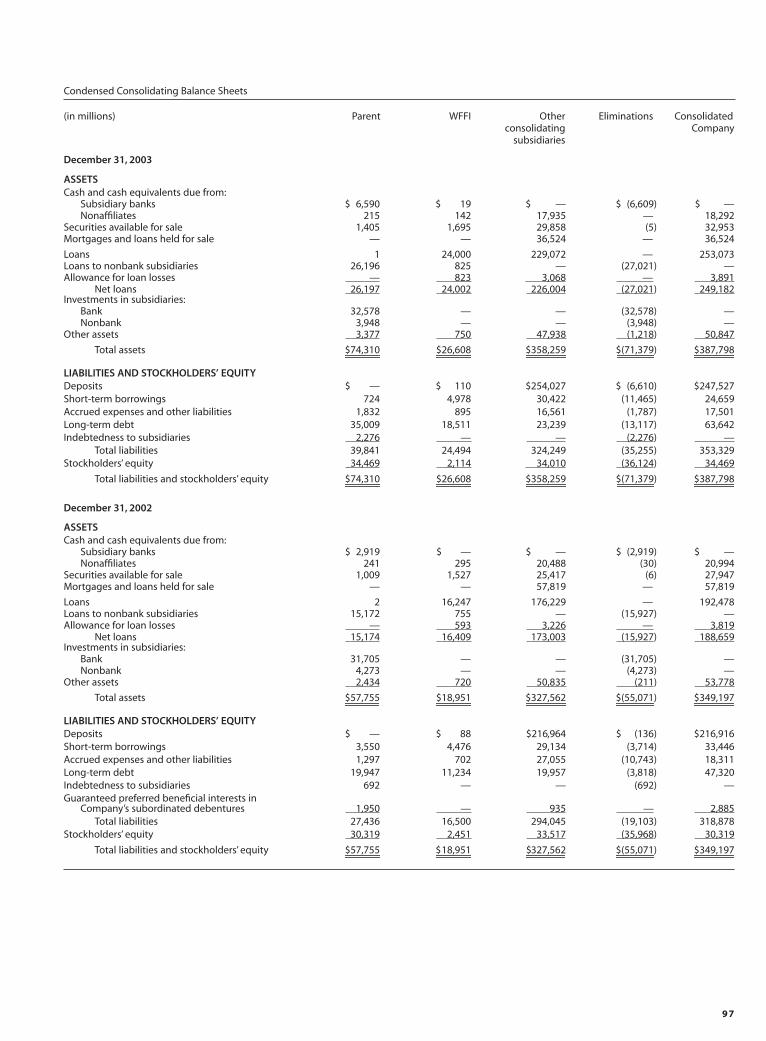
97
Condensed Consolidating Balance Sheets
(in millions) Parent WFFI Other Eliminations Consolidatedconsolidating Company
subsidiaries
December 31, 2003
ASSETSCash and cash equivalents due from:
Subsidiary banks $ 6,590 $ 19 $ — $ (6,609) $ —Nonaffiliates 215 142 17,935 — 18,292
Securities available for sale 1,405 1,695 29,858 (5) 32,953Mortgages and loans held for sale — — 36,524 — 36,524
Loans 1 24,000 229,072 — 253,073Loans to nonbank subsidiaries 26,196 825 — (27,021) —Allowance for loan losses — 823 3,068 — 3,891
Net loans 26,197 24,002 226,004 (27,021) 249,182Investments in subsidiaries:
Bank 32,578 — — (32,578) —Nonbank 3,948 — — (3,948) —
Other assets 3,377 750 47,938 (1,218) 50,847
Total assets $74,310 $26,608 $358,259 $(71,379) $387,798
LIABILITIES AND STOCKHOLDERS’ EQUITYDeposits $ — $ 110 $254,027 $ (6,610) $247,527Short-term borrowings 724 4,978 30,422 (11,465) 24,659Accrued expenses and other liabilities 1,832 895 16,561 (1,787) 17,501Long-term debt 35,009 18,511 23,239 (13,117) 63,642Indebtedness to subsidiaries 2,276 — — (2,276) —
Total liabilities 39,841 24,494 324,249 (35,255) 353,329Stockholders’ equity 34,469 2,114 34,010 (36,124) 34,469
Total liabilities and stockholders’ equity $74,310 $26,608 $358,259 $(71,379) $387,798
December 31, 2002
ASSETSCash and cash equivalents due from:
Subsidiary banks $ 2,919 $ — $ — $ (2,919) $ —Nonaffiliates 241 295 20,488 (30) 20,994
Securities available for sale 1,009 1,527 25,417 (6) 27,947Mortgages and loans held for sale — — 57,819 — 57,819
Loans 2 16,247 176,229 — 192,478Loans to nonbank subsidiaries 15,172 755 — (15,927) —Allowance for loan losses — 593 3,226 — 3,819
Net loans 15,174 16,409 173,003 (15,927) 188,659Investments in subsidiaries:
Bank 31,705 — — (31,705) —Nonbank 4,273 — — (4,273) —
Other assets 2,434 720 50,835 (211) 53,778
Total assets $57,755 $18,951 $327,562 $(55,071) $349,197
LIABILITIES AND STOCKHOLDERS’ EQUITYDeposits $ — $ 88 $216,964 $ (136) $216,916Short-term borrowings 3,550 4,476 29,134 (3,714) 33,446Accrued expenses and other liabilities 1,297 702 27,055 (10,743) 18,311Long-term debt 19,947 11,234 19,957 (3,818) 47,320Indebtedness to subsidiaries 692 — — (692) —Guaranteed preferred beneficial interests in
Company’s subordinated debentures 1,950 — 935 — 2,885Total liabilities 27,436 16,500 294,045 (19,103) 318,878
Stockholders’ equity 30,319 2,451 33,517 (35,968) 30,319
Total liabilities and stockholders’ equity $57,755 $18,951 $327,562 $(55,071) $349,197

Condensed Consolidating Statement of Cash Flows
(in millions) Parent WFFI Other Consolidatedconsolidating Company
subsidiaries/eliminations
Year ended December 31, 2003
Cash flows from operating activities:Net cash provided by operating activities $ 6,352 $ 1,271 $ 23,572 $ 31,195
Cash flows from investing activities:Securities available for sale:
Proceeds from sales 146 347 6,864 7,357Proceeds from prepayments and maturities 150 223 12,779 13,152Purchases (655) (732) (23,744) (25,131)
Net cash paid for acquisitions (55) (600) (167) (822)Increase in banking subsidiaries’ loan
originations, net of collections — — (36,235) (36,235)Proceeds from sales (including participations) of loans by
banking subsidiaries — — 1,590 1,590Purchases (including participations) of loans by
banking subsidiaries — — (15,087) (15,087)Principal collected on nonbank entities’ loans 3,683 13,335 620 17,638Loans originated by nonbank entities — (21,035) (757) (21,792)Purchases of loans by nonbank entities (3,682) — — (3,682)Net advances to nonbank entities (2,570) — 2,570 —Capital notes and term loans made to subsidiaries (14,614) — 14,614 —Principal collected on notes/loans made to subsidiaries 6,160 — (6,160) —Net decrease (increase) in investment in subsidiaries 122 — (122) —Other, net — 107 (74) 33
Net cash used by investing activities (11,315) (8,355) (43,309) (62,979)
Cash flows from financing activities:Net increase in deposits — 22 28,621 28,643Net decrease in short-term borrowings (1,182) (676) (7,043) (8,901)Proceeds from issuance of long-term debt 15,656 10,355 3,479 29,490Repayment of long-term debt (3,425) (2,151) (12,355) (17,931)Proceeds from issuance of guaranteed preferred beneficial
interests in Company’s subordinated debentures 700 — — 700Proceeds from issuance of common stock 944 — — 944Redemption of preferred stock (73) — — (73)Repurchase of common stock (1,482) — — (1,482)Payment of cash dividends on preferred and common stock (2,530) (600) 600 (2,530)Other, net — — 651 651
Net cash provided by financing activities 8,608 6,950 13,953 29,511
Net change in cash and due from banks 3,645 (134) (5,784) (2,273)
Cash and due from banks at beginning of year 3,160 295 14,365 17,820
Cash and due from banks at end of year $ 6,805 $ 161 $ 8,581 $ 15,547
98

Condensed Consolidating Statement of Cash Flows
(in millions) Parent WFFI Other Consolidatedconsolidating Company
subsidiaries/eliminations
Year ended December 31, 2002
Cash flows from operating activities:Net cash provided (used) by operating activities $ 4,366 $ 956 $(20,780) $(15,458)
Cash flows from investing activities:Securities available for sale:
Proceeds from sales 531 769 10,563 11,863Proceeds from prepayments and maturities 150 143 9,391 9,684Purchases (201) (1,030) (6,030) (7,261)
Net cash acquired from (paid for) acquisitions (589) (281) 282 (588)Increase in banking subsidiaries’ loan originations,
net of collections — — (18,992) (18,992)Proceeds from sales (including participations) of loans by
banking subsidiaries — — 948 948Purchases (including participations) of loans by
banking subsidiaries — — (2,818) (2,818)Principal collected on nonbank entities’ loans — 10,984 412 11,396Loans originated by nonbank entities — (13,996) (625) (14,621)Net advances to nonbank entities (2,728) — 2,728 —Capital notes and term loans made to subsidiaries (2,262) — 2,262 —Principal collected on notes/loans made to subsidiaries 457 — (457) —Net decrease (increase) in investment in subsidiaries 507 — (507) —Other, net — (179) (907) (1,086)
Net cash used by investing activities (4,135) (3,590) (3,750) (11,475)
Cash flows from financing activities:Net increase in deposits — 9 25,041 25,050Net increase (decrease) in short-term borrowings (2,444) 329 (3,109) (5,224)Proceeds from issuance of long-term debt 8,495 4,126 9,090 21,711Repayment of long-term debt (3,150) (1,745) (6,007) (10,902)Proceeds from issuance of guaranteed preferred beneficial
interests in Company’s subordinated debentures 450 — — 450Proceeds from issuance of common stock 578 — — 578Repurchase of common stock (2,033) — — (2,033)Payment of cash dividends on preferred and common stock (1,877) (45) 45 (1,877)Other, net — — 32 32
Net cash provided by financing activities 19 2,674 25,092 27,785
Net change in cash and due from banks 250 40 562 852
Cash and due from banks at beginning of year 2,910 255 13,803 16,968
Cash and due from banks at end of year $ 3,160 $ 295 $ 14,365 $ 17,820
99

100
Condensed Consolidating Statement of Cash Flows
(in millions) Parent WFFI Other Consolidatedconsolidating Company
subsidiaries/eliminations
Year ended December 31, 2001
Cash flows from operating activities:
Net cash provided (used) by operating activities $ 1,932 $ 903 $(12,947) $(10,112)
Cash flows from investing activities:Securities available for sale:
Proceeds from sales 626 445 18,515 19,586Proceeds from prepayments and maturities 85 150 6,495 6,730Purchases (462) (732) (27,859) (29,053)
Net cash acquired from (paid for) acquisitions (370) (325) 236 (459)Increase in banking subsidiaries’ loan originations,
net of collections — — (11,866) (11,866)Proceeds from sales (including participations) of loans by
banking subsidiaries — — 2,305 2,305Purchases (including participations) of loans by
banking subsidiaries — — (1,104) (1,104)Principal collected on nonbank entities’ loans — 9,677 287 9,964Loans originated by nonbank entities — (11,395) (256) (11,651)Net advances to nonbank entities (722) — 722 —Capital notes and term loans made to subsidiaries (159) — 159 —Principal collected on notes/loans made to subsidiaries 1,304 — (1,304) —Net decrease (increase) in investment in subsidiaries (609) — 609 —Other, net — (267) (2,932) (3,199)
Net cash used by investing activities (307) (2,447) (15,993) (18,747)
Cash flows from financing activities:Net increase in deposits — 6 17,701 17,707Net increase (decrease) in short-term borrowings (331) 445 8,679 8,793Proceeds from issuance of long-term debt 4,573 2,904 7,181 14,658Repayment of long-term debt (3,066) (1,736) (5,823) (10,625)Proceeds from issuance of guaranteed preferred beneficial
interests in Company’s subordinated debentures 1,500 — — 1,500Proceeds from issuance of common stock 484 — — 484Redemption of preferred stock (200) — — (200)Repurchase of common stock (1,760) — — (1,760)Payment of cash dividends on preferred and common stock (1,724) (125) 125 (1,724)Other, net — 130 (114) 16
Net cash provided (used) by financing activities (524) 1,624 27,749 28,849
Net change in cash and due from banks 1,101 80 (1,191) (10)
Cash and due from banks at beginning of year 1,809 175 14,994 16,978
Cash and due from banks at end of year $ 2,910 $ 255 $ 13,803 $ 16,968
Note 25: Guarantees
Note 24: Legal Actions
In the normal course of business, we are subject to pendingand threatened legal actions, some for which the relief ordamages sought are substantial. After reviewing pending andthreatened actions with counsel, and any specific reservesestablished for such matters, management believes that theoutcome of such actions will not have a material adverse
effect on the results of operations or stockholders’ equity. We are not able to predict whether the outcome of suchactions may or may not have a material adverse effect onresults of operations in a particular future period as the timing and amount of any resolution of such actions and itsrelationship to the future results of operations are not known.
Significant guarantees that we provide to third partiesinclude standby letters of credit, various indemnificationagreements, guarantees accounted for as derivatives, contingent consideration related to business combinationsand contingent performance guarantees.
We issue standby letters of credit, which include perfor-mance and financial guarantees, for customers in connectionwith contracts between the customers and third parties.Standby letters of credit assure that the third parties willreceive specified funds if customers fail to meet their contractual obligations. We are obliged to make payment if a customer defaults. Standby letters of credit were $8.3 billion and $6.3 billion at December 31, 2003 and2002, respectively, including financial guarantees of $4.7 billion and $3.0 billion, respectively, that we had issued or purchased participations in. Standby letters of credit are reported net of participations sold to other institu-tions of $1.5 billion and $1.1 billion at December 31, 2003and 2002, respectively. We consider the credit risk in standby letters of credit in determining the allowance for loan losses.Deferred fees for these standby letters of credit were not significant to our financial statements. We also had commitments for commercial and similar letters of credit of $810 million and $719 million at December 31, 2003 and 2002, respectively.
We enter into indemnification agreements in the ordinarycourse of business under which we agree to indemnify thirdparties against any damages, losses and expenses incurred inconnection with legal and other proceedings arising fromrelationships or transactions with us. These relationships ortransactions include those arising from service as a directoror officer of the Company, underwriting agreements relatingto our securities, securities lending, acquisition agreements,and various other business transactions or arrangements.Because the extent of our obligations under these agreementsdepends entirely upon the occurrence of future events, our potential future liability under these agreements is not determinable.
We write options, floors and caps. Options are exercisablebased on favorable market conditions. Periodic settlementsoccur on floors and caps based on market conditions. AtDecember 31, 2003, the fair value of the written options liability in our balance sheet was $382 million and the written floors and caps liability was $213 million. Our ultimate obligation under written options, floors and caps is based on future market conditions and is only quantifiableat settlement. We offset substantially all options written to customers with purchased options; we enter into other written options to mitigate balance sheet risk.
We also enter into credit default swaps under which we buy protection from or sell protection to a counterparty in the event of default of a reference obligation. At December 31, 2003, the gross carrying amount of the contracts sold was a $5.0 million liability. The maximumamount we would be required to pay under the swaps inwhich we sold protection, assuming all reference obligationsdefault at a total loss, without recoveries, was $2.7 billion. We have bought protection of $2.8 billion of notional expo-sure. Almost all of the protection purchases offset (i.e., use the same reference obligation and maturity) the contracts in which we are providing protection to a counterparty.
In connection with certain brokerage, asset managementand insurance agency acquisitions we have made, the terms of the acquisition agreements provide for deferred paymentsor additional consideration based on certain performance targets. At December 31, 2003, the amount of contingent consideration we expected to pay was not significant to ourfinancial statements.
We have entered into various contingent performance guarantees through credit risk participation arrangements with terms ranging from 1 to 30 years. We will be required to make payments under these guarantees if a customerdefaults on its obligation to perform under certain creditagreements with third parties. Because the extent of our obligations under these guarantees depends entirely on future events, our potential future liability under these agreements is not fully determinable, although most of these agreements are contractually limited to a total liability of approximately $330 million.
101
102
Note 26: Regulatory and Agency Capital Requirements
The Company and each of its subsidiary banks are subject to various regulatory capital adequacy requirements adminis-tered by the Federal Reserve Board and the OCC, respectively.The Federal Deposit Insurance Corporation ImprovementAct of 1991 (FDICIA) required that the federal regulatoryagencies adopt regulations defining five capital tiers forbanks: well capitalized, adequately capitalized, undercapital-ized, significantly undercapitalized and critically undercapi-talized. Failure to meet minimum capital requirements caninitiate certain mandatory and possibly additional discre-tionary actions by regulators that, if undertaken, could have a direct material effect on our financial statements.
Quantitative measures, established by the regulators toensure capital adequacy, require that the Company and eachof the subsidiary banks maintain minimum ratios (set forthin the table on the following page) of capital to risk-weight-ed assets. There are three categories of capital under theguidelines. Tier 1 capital includes common stockholders’equity, qualifying preferred stock and trust preferred securi-ties, less goodwill and certain other deductions (including the unrealized net gains and losses, after applicable taxes, on securities available for sale carried at fair value). Tier 2capital includes preferred stock not qualifying as Tier 1 capi-tal, subordinated debt, the allowance for loan losses and netunrealized gains on marketable equity securities, subject tolimitations by the guidelines. Tier 2 capital is limited to theamount of Tier 1 capital (i.e., at least half of the total capitalmust be in the form of Tier 1 capital). Tier 3 capital includescertain qualifying unsecured subordinated debt.
On December 31, 2003, we deconsolidated our wholly-owned trusts (the Trusts) that were formed to issue trust preferred securities and related common securities of theTrusts. The $3.8 billion of junior subordinated debentureswere reflected as long-term debt on the consolidated balancesheet at December 31, 2003. (See Note 12.) The debenturesissued to the Trusts, less the common securities of the Trusts,continue to qualify as Tier 1 capital under guidance issuedby the Federal Reserve Board.
Under the guidelines, capital is compared with the rela-tive risk related to the balance sheet. To derive the riskincluded in the balance sheet, a risk weighting is applied to each balance sheet and off-balance sheet asset, primarilybased on the relative credit risk of the counterparty. Forexample, claims guaranteed by the U.S. government or one of its agencies are risk-weighted at 0% and certain realestate related loans risk-weighted at 50%. Off-balance sheetitems, such as loan commitments and derivatives, are alsoapplied a risk weight after calculating balance sheet equiva-lent amounts. A credit conversion factor is assigned to loancommitments based on the likelihood of the off-balancesheet item becoming an asset. For example, certain loancommitments are converted at 50% and then risk-weightedat 100%. Derivatives are converted to balance sheet equiva-lents based on notional values, replacement costs andremaining contractual terms. (See Notes 5 and 27 for furtherdiscussion of off-balance sheet items.) Effective January 1,2002, federal banking agencies amended the regulatory capital guidelines regarding the treatment of certain recourseobligations, direct credit substitutes, residual interests inasset securitization, and other securitized transactions thatexpose institutions primarily to credit risk. The amendmentcreates greater differentiation in the capital treatment ofresidual interests. The capital amounts and classificationunder the guidelines are also subject to qualitative judg-ments by the regulators about components, risk weightingsand other factors.
Management believes that, as of December 31, 2003, theCompany and each of the covered subsidiary banks met allcapital adequacy requirements to which they are subject.
The most recent notification from the OCC categorizedeach of the covered subsidiary banks as well capitalized,under the FDICIA prompt corrective action provisionsapplicable to banks. To be categorized as well capitalized,the institution must maintain a total risk-based capital ratioas set forth in the following table and not be subject to acapital directive order. There are no conditions or eventssince that notification that management believes havechanged the risk-based capital category of any of the covered subsidiary banks.

Our approach to managing interest rate risk includes the use of derivatives. This helps minimize significant unplannedfluctuations in earnings, fair values of assets and liabilities,and cash flows caused by interest rate volatility. Thisapproach involves modifying the repricing characteristics of certain assets and liabilities so that changes in interestrates do not have a significant adverse effect on the net interest margin and cash flows. As a result of interest ratefluctuations, hedged assets and liabilities will gain or losemarket value. In a fair value hedging strategy, the effect of this unrealized gain or loss will generally be offset byincome or loss on the derivatives linked to the hedged assetsand liabilities. In a cash flow hedging strategy, we managethe variability of cash payments due to interest rate fluctua-tions by the effective use of derivatives linked to hedgedassets and liabilities.
We use derivatives as part of our interest rate risk management, including interest rate swaps and floors, interest rate futures and forward contracts, and options. We also offer various derivatives, including interest rate,commodity, equity, credit and foreign exchange contracts, to our customers but usually offset our exposure from such contracts by purchasing other financial contracts. The customer accommodations and any offsetting financial
contracts are treated as free-standing derivatives. Free-stand-ing derivatives also include derivatives we enter into for risk management that do not otherwise qualify for hedgeaccounting. To a lesser extent, we take positions based onmarket expectations or to benefit from price differentialsbetween financial instruments and markets.
By using derivatives, we are exposed to credit risk if counterparties to financial instruments do not perform asexpected. If a counterparty fails to perform, our credit risk is equal to the fair value gain in a derivative contract. Weminimize credit risk through credit approvals, limits andmonitoring procedures. Credit risk related to derivatives is considered and, if material, provided for separately. As we generally enter into transactions only with counterpar-ties that carry high quality credit ratings, losses fromcounterparty nonperformance on derivatives have not been significant. Further, we obtain collateral where appropriate to reduce risk. To the extent the master netting arrange-ments meet the requirements of FASB Interpretation No. 39,Offsetting of Amounts Related to Certain Contracts, asamended by FASB Interpretation No. 41, Offsetting ofAmounts Related to Certain Repurchase and ReverseRepurchase Agreements, amounts are shown net in the balance sheet.
As an approved seller/servicer, one of our mortgage banking subsidiaries is required to maintain minimum levelsof shareholders’ equity, as specified by various agencies,including the United States Department of Housing andUrban Development, Government National Mortgage
Association, Federal Home Loan Mortgage Corporation andFederal National Mortgage Association. At December 31,2003, this mortgage banking subsidiary’s equity was abovethe required levels.
103
Note 27: Derivatives
(in billions) To be wellcapitalized under
the FDICIAFor capital prompt corrective
Actual adequacy purposes action provisionsAmount Ratio Amount Ratio Amount Ratio
As of December 31, 2003:Total capital (to risk-weighted assets)
Wells Fargo & Company $37.3 12.21% >$24.4 >8.00%Wells Fargo Bank, N.A. 22.6 11.17 > 16.2 >8.00 > $20.2 >10.00%Wells Fargo Bank Minnesota, N.A. 3.8 14.22 > 2.1 >8.00 > 2.6 >10.00
Tier 1 capital (to risk-weighted assets)Wells Fargo & Company $25.7 8.42% >$12.2 >4.00%Wells Fargo Bank, N.A. 15.2 7.53 > 8.1 >4.00 >$12.1 > 6.00%Wells Fargo Bank Minnesota, N.A. 3.5 13.14 > 1.1 >4.00 > 1.6 > 6.00
Tier 1 capital (to average assets)(Leverage ratio)
Wells Fargo & Company $25.7 6.93% >$14.8 >4.00%(1)
Wells Fargo Bank, N.A. 15.2 6.22 > 9.8 >4.00 (1) >$12.2 > 5.00%Wells Fargo Bank Minnesota, N.A. 3.5 7.00 > 2.0 >4.00 (1) > 2.5 > 5.00
(1) The leverage ratio consists of Tier 1 capital divided by quarterly average total assets, excluding goodwill and certain other items. The minimum leverage ratio guideline is3% for banking organizations that do not anticipate significant growth and that have well-diversified risk, excellent asset quality, high liquidity, good earnings, effectivemanagement and monitoring of market risk and, in general, are considered top-rated, strong banking organizations.

104
Our derivative activities are monitored by the CorporateAsset/Liability Management Committee. Our Treasury function, which includes asset/liability management, isresponsible for various hedging strategies developed throughanalysis of data from financial models and other internaland industry sources. We incorporate the resulting hedgingstrategies into our overall interest rate risk management and trading strategies.
Fair Value HedgesWe use derivatives to manage the risk of changes in the fairvalue of mortgage servicing rights and other retained inter-ests. Derivative gains or losses caused by market conditions(volatility) and the spread between spot and forward ratespriced into the derivative contracts (the passage of time) areexcluded from the evaluation of hedge effectiveness, but are reflected in earnings. The change in value of derivativesexcluded from the assessment of hedge effectiveness was anet gain of $908 million and $1,201 million in 2003 and2002, respectively, and a net loss of $181 million in 2001.The ineffective portion of the change in value of these deriv-atives was a net gain of $203 million, $1,125 million, and$702 million in 2003, 2002, and 2001, respectively. The netderivative gain of $1,111 million, $2,326 million and $521million in 2003, 2002 and 2001, respectively, was primarilyoffset by the valuation provision on mortgage servicingrights of $1,092 million, $2,135 million, and $1,124 millionin 2003, 2002 and 2001, respectively. The total gains on themortgage-related derivatives and the valuation provision forimpairment are included in “Servicing fees, net of provisionfor impairment and amortization” in Note 22.
In 2002, we began using derivatives to hedge changes in fair value of our commercial real estate mortgages due tochanges in LIBOR interest rates. We originate a portion ofthese loans with the intent to sell them. The ineffective por-tion of these fair value hedges was a net loss of $22 millionand $3 million in 2003 and 2002, respectively, recorded aspart of mortgage banking noninterest income in the state-ment of income. For the commercial real estate hedges, allparts of each derivative’s gain or loss are included in the assessment of hedge effectiveness.
We also enter into interest rate swaps, designated as fairvalue hedges, to convert certain of our fixed-rate long-termdebt to floating-rate debt. The ineffective part of these fairvalue hedges was not significant in 2003 or 2002 and was a net gain of $11 million in 2001. For long-term debt, allparts of each derivative’s gain or loss are included in theassessment of hedge effectiveness.
At December 31, 2003, all designated fair value hedgescontinued to qualify as fair value hedges.
Cash Flow HedgesWe use derivatives to convert floating-rate loans and certainof our floating-rate senior debt to fixed rates and to hedgeforecasted sales of mortgage loans. We recognized a net gain of $72 million in 2003, which represents the total ineffectiveness of cash flow hedges, compared with a net loss of $311 million and $120 million in 2002 and 2001,respectively. Gains and losses on derivatives that are reclassi-fied from cumulative other comprehensive income to currentperiod earnings, are included in the line item in which thehedged item’s effect in earnings is recorded. All parts of gainor loss on these derivatives are included in the assessment ofhedge effectiveness. As of December 31, 2003, all designatedcash flow hedges continued to qualify as cash flow hedges.
At December 31, 2003, we expected that $9 million ofdeferred net losses on derivatives in other comprehensiveincome will be reclassified as earnings during the next twelve months, compared with $125 million of deferred net losses and $110 million of deferred net gains atDecember 31, 2002 and 2001, respectively. We are hedgingour exposure to the variability of future cash flows for allforecasted transactions for a maximum of two years forhedges converting floating-rate loans to fixed, four years for hedges converting floating-rate senior debt to fixed andone year for hedges of forecasted sales of mortgage loans.
Free-Standing Derivatives We enter into various derivatives primarily to provide derivative products to customers. To a lesser extent, we takepositions based on market expectations or to benefit fromprice differentials between financial instruments and mar-kets. These derivatives are not linked to specific assets andliabilities on the balance sheet or to forecasted transactionsin an accounting hedge relationship and, therefore, do notqualify for hedge accounting. They are carried at fair valuewith changes in fair value recorded as part of other nonin-terest income in the statement of income.
Interest rate lock commitments for residential mortgageloans that we intend to resell are considered free-standingderivatives. Our interest rate exposure on these commit-ments is economically hedged with options, futures and forwards. The commitments and free-standing derivativesare carried at fair value with changes in fair value recordedas a part of mortgage banking noninterest income in thestatement of income.
We also use derivatives that are classified as free-standinginstruments, which include swaps, futures, forwards, floorsand caps purchased and written, and options purchased and written.

(1) Credit risk amounts reflect the replacement cost for those contracts in a gain position in the event of nonperformance by all counterparties.
(in millions) December 31, 2003 2002
Notional or Credit Estimated Notional or Credit Estimatedcontractual risk net fair contractual risk net fair
amount amount(1) value amount amount (1) value
ASSET/LIABILITY MANAGEMENTHEDGES
Interest rate contracts:Swaps $ 22,570 $1,116 $1,035 $ 24,533 $2,238 $2,180Futures 5,027 — — 16,867 — —Floors purchased — — — 500 11 11Options purchased 115,810 440 440 90,959 520 520Options written 42,106 — (47) 74,589 — (236)Forwards 93,977 291 118 116,164 669 156
CUSTOMER ACCOMMODATIONSAND TRADING
Interest rate contracts:Swaps 65,181 2,005 102 68,164 2,606 1Futures 49,397 — — 83,351 — —Floors and caps purchased 28,591 153 153 29,381 299 299Floors and caps written 26,411 — (173) 30,400 — (274)Options purchased 5,523 66 66 5,484 108 108Options written 24,894 40 (55) 58,846 328 280Forwards 54,725 12 (90) 51,088 2 (383)
Commodity contracts:Swaps 897 61 (1) 206 11 1Futures 4 — — — — —Floors and caps purchased 319 39 40 168 17 17Floors and caps written 322 — (40) 166 — (14)Options purchased 1 14 14 — — —Options written 1 — (14) — — —
Equity contracts:Options purchased 1,109 136 136 382 29 29Options written 1,121 — (143) 389 — (49)
Foreign exchange contracts:Swaps 292 17 17 — — —Futures 148 — — — — —Options purchased 1,930 84 84 749 20 20Options written 1,904 — (84) 735 — (20)Forwards and spots 22,444 479 42 14,596 251 30
Credit contracts:Swaps 5,416 37 (16) 4,735 52 (11)
105
The total notional or contractual amounts, credit risk amount and estimated net fair value for derivatives at December 31, 2003 and 2002 were:

Note 28: Fair Value of Financial Instruments
LOANS HELD FOR SALE
The fair value of loans held for sale is based on what secondary markets are currently offering for portfolios with similar characteristics.
LOANS
The fair valuation calculation differentiates loans based ontheir financial characteristics, such as product classification,loan category, pricing features and remaining maturity.Prepayment estimates are evaluated by product and loan rate.
The fair value of commercial loans, other real estate mortgage loans and real estate construction loans is calculated by discounting contractual cash flows using discount rates that reflect our current pricing for loans with similar characteristics and remaining maturity.
For real estate 1-4 family first and junior lien mortgages,fair value is calculated by discounting contractual cash flows,adjusted for prepayment estimates, using discount ratesbased on current industry pricing for loans of similar size,type, remaining maturity and repricing characteristics.
For consumer finance and credit card loans, the portfolio’syield is equal to our current pricing and, therefore, the fairvalue is equal to book value.
For other consumer loans, the fair value is calculated bydiscounting the contractual cash flows, adjusted for prepay-ment estimates, based on the current rates we offer for loanswith similar characteristics.
Loan commitments, standby letters of credit and commercial and similar letters of credit not included in the table on page 107 had contractual values of $126.0 billion, $8.3 billion and $810 million, respectively, at December 31, 2003, and $113.2 billion, $6.3 billion and $719 million, respectively, at December 31, 2002. These instruments generate ongoing fees at our current pricing levels. Of the commitments at December 31, 2003,38% mature within one year. Deferred fees on commitmentsand standby letters of credit totaled $38 million and $30 million at December 31, 2003 and 2002, respectively.Carrying cost estimates fair value for these fees.
TRADING ASSETS
Trading assets, which are carried at fair value, are reportedin Note 6.
NONMARKETABLE EQUITY INVESTMENTS
There are generally restrictions on the sale and/or liquidationof our nonmarketable equity investments, including federalbank stock. Federal bank stock carrying value approximates
FAS 107, Disclosures about Fair Value of FinancialInstruments, requires that we disclose estimated fair valuesfor our financial instruments. This disclosure should be read with the financial statements and Notes to FinancialStatements in this Annual Report. The carrying amounts in the table on page 107 are recorded in the ConsolidatedBalance Sheet under the indicated captions.
We base fair values on estimates or calculations using present value techniques when quoted market prices are not available. Because broadly-traded markets do not existfor most of our financial instruments, we try to incorporate the effect of current market conditions in the fair value cal-culations. These valuations are our estimates, and are oftencalculated based on current pricing policy, the economic andcompetitive environment, the characteristics of the financialinstruments and other such factors. These calculations aresubjective, involve uncertainties and significant judgment and do not include tax ramifications. Therefore, the resultscannot be determined with precision, substantiated by comparison to independent markets and may not be realizedin an actual sale or immediate settlement of the instruments.There may be inherent weaknesses in any calculation tech-nique, and changes in the underlying assumptions used,including discount rates and estimates of future cash flows,that could significantly affect the results.
We have not included certain material items in our disclosure, such as the value of the long-term relationshipswith our deposit, credit card and trust customers, since these intangibles are not financial instruments. For all of these reasons, the total of the fair value calculations presented do not represent, and should not be construed to represent, the underlying value of the Company.
Financial AssetsSHORT-TERM FINANCIAL ASSETS
Short-term financial assets include cash and due from banks,federal funds sold and securities purchased under resaleagreements and due from customers on acceptances. The carrying amount is a reasonable estimate of fair valuebecause of the relatively short time between the originationof the instrument and its expected realization.
SECURITIES AVAILABLE FOR SALE
The fair value of securities available for sale at December 31,2003 and 2002 is reported in Note 4.
MORTGAGES HELD FOR SALE
The fair value of mortgages held for sale is based on quotedmarket prices.
106

107
(in millions) December 31, 2003 2002
Carrying Estimated Carrying Estimatedamount fair value amount fair value
FINANCIAL ASSETSMortgages held for sale $ 29,027 $ 29,277 $ 51,154 $ 51,319Loans held for sale 7,497 7,649 6,665 6,851Loans, net 249,182 249,134 188,659 190,615Nonmarketable equity investments 5,021 5,312 4,721 4,872
FINANCIAL LIABILITIESDeposits 247,527 247,628 216,916 217,122Long-term debt (1) 63,617 64,672 47,299 49,771Guaranteed preferred beneficial interests in
Company’s subordinated debentures — — 2,885 3,657
(1) The carrying amount and fair value exclude obligations under capital leases of $25 million and $21 million at December 31, 2003 and 2002, respectively.
fair value. We use all facts and circumstances available to estimate the fair value of our cost method investments. We typically consider our access to and need for capital(including recent or projected financing activity), qualitativeassessments of the viability of the investee, and prospects for its future.
Financial LiabilitiesDEPOSIT LIABILITIES
FAS 107 states that the fair value of deposits with no statedmaturity, such as noninterest-bearing demand deposits, inter-est-bearing checking and market rate and other savings, isequal to the amount payable on demand at the measurementdate. The amount included for these deposits in the followingtable is their carrying value at December 31, 2003 and 2002.The fair value of other time deposits is calculated based onthe discounted value of contractual cash flows. The discountrate is estimated using the rates currently offered for like wholesale deposits with similar remaining maturities.
SHORT-TERM FINANCIAL LIABILITIES
Short-term financial liabilities include federal funds pur-chased and securities sold under repurchase agreements,commercial paper and other short-term borrowings. The carrying amount is a reasonable estimate of fair value because of the relatively short time between the origination of the instrument and its expected realization.
LONG-TERM DEBT AND GUARANTEED PREFERRED BENEFICIAL
INTERESTS IN COMPANY’S SUBORDINATED DEBENTURES
The discounted cash flow method is used to estimate the fair value of our fixed rate long-term debt and trust
preferred securities. Contractual cash flows are discountedusing rates currently offered for new notes with similarremaining maturities.
Derivatives The fair values of derivatives at December 31, 2003 and2002 are reported in Note 27.
LimitationsWe make these fair value disclosures to comply with therequirements of FAS 107. The calculations represent management’s best estimates; however, due to the lack ofbroad markets and the significant items excluded from thisdisclosure, the calculations do not represent the underlyingvalue of the Company. The information presented is based on fair value calculations and market quotes as ofDecember 31, 2003 and 2002. These amounts have not been updated since year end; therefore, the valuations may have changed significantly since that point in time.
As discussed above, some of our asset and liability finan-cial instruments are short-term, and therefore, the carryingamounts in the Consolidated Balance Sheet approximate fairvalue. Other significant assets and liabilities, which are notconsidered financial assets or liabilities and for which fairvalues have not been estimated, include premises and equip-ment, goodwill and other intangibles, deferred taxes andother liabilities.
This table is a summary of financial instruments, asdefined by FAS 107, excluding short-term financial assets and liabilities, for which carrying amounts approximate fair value, trading assets (Note 6), which are carried at fairvalue, securities available for sale (Note 4) and derivatives(Note 27).

The Board of Directors and Stockholders of Wells Fargo & Company:
We have audited the accompanying consolidated balance sheet of Wells Fargo & Company and Subsidiaries as ofDecember 31, 2003 and 2002, and the related consolidated statements of income, changes in stockholders’ equityand comprehensive income, and cash flows for each of the years in the three-year period ended December 31, 2003.These consolidated financial statements are the responsibility of the Company’s management. Our responsibility isto express an opinion on these consolidated financial statements based on our audits.
We conducted our audits in accordance with auditing standards generally accepted in the United States ofAmerica. Those standards require that we plan and perform the audit to obtain reasonable assurance about whetherthe financial statements are free of material misstatement. An audit includes examining, on a test basis, evidencesupporting the amounts and disclosures in the financial statements. An audit also includes assessing the accountingprinciples used and significant estimates made by management, as well as evaluating the overall financial statementpresentation. We believe that our audits provide a reasonable basis for our opinion.
In our opinion, the consolidated financial statements referred to above present fairly, in all material respects, thefinancial position of Wells Fargo & Company and Subsidiaries as of December 31, 2003 and 2002, and the resultsof their operations and their cash flows for each of the years in the three-year period ended December 31, 2003, inconformity with accounting principles generally accepted in the United States of America.
As discussed in Notes 1, 8 and 18 to the consolidated financial statements, the Company changed its method ofaccounting for goodwill in 2002.
San Francisco, CaliforniaFebruary 25, 2004
Independent Auditors’ Report
108

109
Quarterly Financial DataCondensed Consolidated Statement of Income — Quarterly (Unaudited)
(in millions, except per share amounts) 2003 2002 Quarter ended Quarter ended
Dec. 31 Sept. 30 June 30 Mar. 31 Dec. 31 Sept. 30 June 30 Mar. 31
INTEREST INCOME $ 4,856 $ 4,979 $ 4,855 $ 4,728 $ 4,744 $ 4,610 $ 4,530 $ 4,577INTEREST EXPENSE 812 837 882 879 959 1,004 988 1,026
NET INTEREST INCOME 4,044 4,142 3,973 3,849 3,785 3,606 3,542 3,551
Provision for loan losses 465 426 421 411 426 389 400 469Net interest income after provision for loan losses 3,579 3,716 3,552 3,438 3,359 3,217 3,142 3,082
NONINTEREST INCOMEService charges on deposit accounts 613 607 587 553 567 560 547 505Trust and investment fees 504 504 470 460 480 462 472 461Credit card fees 252 251 257 243 255 242 223 201Other fees 412 422 373 366 375 372 326 311Mortgage banking 636 773 543 561 515 426 412 359Operating leases 211 229 245 251 252 268 289 306Insurance 264 252 289 266 231 234 269 263Net gains (losses) on debt securities available for sale (12) (23) 20 18 91 121 45 37Net gains (losses) from equity investments 143 58 (47) (98) (96) (152) (58) (19)Other 378 118 220 213 210 80 142 183
Total noninterest income 3,401 3,191 2,957 2,833 2,880 2,613 2,667 2,607
NONINTEREST EXPENSESalaries 1,351 1,185 1,155 1,141 1,091 1,110 1,106 1,076Incentive compensation 483 621 503 447 541 446 362 357Employee benefits 417 374 350 419 287 304 364 329Equipment 375 298 305 269 317 232 228 236Net occupancy 310 283 288 296 281 278 274 269Operating leases 162 175 178 187 184 187 205 226Other 1,402 1,639 1,379 1,198 1,253 1,037 1,071 1,061
Total noninterest expense 4,500 4,575 4,158 3,957 3,954 3,594 3,610 3,554
INCOME BEFORE INCOME TAX EXPENSEAND EFFECT OF CHANGE INACCOUNTING PRINCIPLE 2,480 2,332 2,351 2,314 2,285 2,236 2,199 2,135
Income tax expense 856 771 826 822 813 793 781 758
NET INCOME BEFORE EFFECT OFCHANGE IN ACCOUNTING PRINCIPLE 1,624 1,561 1,525 1,492 1,472 1,443 1,418 1,377
Cumulative effect of change in accounting principle — — — — — — — (276)
NET INCOME $ 1,624 $ 1,561 $ 1,525 $ 1,492 $ 1,472 $ 1,443 $ 1,418 $ 1,101
NET INCOME APPLICABLE TOCOMMON STOCK $ 1,624 $ 1,560 $ 1,524 $ 1,491 $ 1,471 $ 1,442 $ 1,417 $ 1,100
EARNINGS PER COMMON SHARE BEFORE EFFECT OF CHANGE INACCOUNTING PRINCIPLEEarnings per common share $ .96 $ .93 $ .91 $ .89 $ .87 $ .85 $ .83 $ .81
Diluted earnings per common share $ .95 $ .92 $ .90 $ .88 $ .86 $ .84 $ .82 $ .80
EARNINGS PER COMMON SHAREEarnings per common share $ .96 $ .93 $ .91 $ .89 $ .87 $ .85 $ .83 $ .65
Diluted earnings per common share $ .95 $ .92 $ .90 $ .88 $ .86 $ .84 $ .82 $ .64
DIVIDENDS DECLARED PER COMMON SHARE $ .45 $ .45 $ .30 $ .30 $ .28 $ .28 $ .28 $ .26
Average common shares outstanding 1,690.2 1,677.2 1,675.7 1,681.5 1,690.4 1,700.7 1,710.4 1,703.0
Diluted average common shares outstanding 1,712.6 1,693.9 1,690.6 1,694.1 1,704.0 1,717.8 1,730.8 1,718.9

Average Balances, Yields and Rates Paid (Taxable-Equivalent Basis) — Quarterly (1)(2) (Unaudited)
(in millions) Quarter ended December 31, 2003 2002
Average Yields/ Interest Average Yields/ Interestbalance rates income/ balance rates income/
expense expense
EARNING ASSETSFederal funds sold and securities purchased
under resale agreements $ 2,699 .87% $ 6 $ 2,762 1.53% $ 11Debt securities available for sale (3):
Securities of U.S. Treasury and federal agencies 1,278 4.39 14 1,525 5.20 19Securities of U.S. states and political subdivisions 3,141 8.02 60 2,075 8.53 42Mortgage-backed securities:
Federal agencies 21,149 6.25 318 21,909 7.73 397Private collateralized mortgage obligations 2,014 5.53 27 2,002 7.35 35
Total mortgage-backed securities 23,163 6.19 345 23,911 7.69 432 Other debt securities (4) 3,478 7.69 60 3,056 7.76 60
Total debt securities available for sale (4) 31,060 6.46 479 30,567 7.63 553Mortgages held for sale (3) 41,055 5.36 551 57,134 5.79 828Loans held for sale (3) 7,373 3.22 60 5,808 3.96 58Loans:
Commercial 47,674 5.93 712 46,467 6.47 758Real estate 1-4 family first mortgage 71,402 5.32 952 34,252 6.44 553Other real estate mortgage 26,691 5.25 353 25,268 5.93 377Real estate construction 8,151 4.96 102 7,894 5.50 109Consumer:
Real estate 1-4 family junior lien mortgage 35,152 5.28 467 27,644 6.81 475Credit card 8,013 11.85 237 7,150 12.12 217Other revolving credit and installment 31,975 8.91 716 24,825 10.04 627
Total consumer 75,140 7.52 1,420 59,619 8.79 1,319Lease financing 4,508 6.13 69 4,098 6.11 63Foreign 2,420 17.74 107 1,917 18.14 87
Total loans (5) 235,986 6.27 3,715 179,515 7.24 3,266Other 9,169 2.96 68 6,379 3.36 53
Total earning assets $327,342 5.96 4,879 $282,165 6.77 4,769
FUNDING SOURCESDeposits:
Interest-bearing checking $ 2,744 .21 1 $ 2,418 .39 2Market rate and other savings 112,392 .61 172 97,473 .90 221Savings certificates 19,949 2.31 116 22,774 2.89 166Other time deposits 26,382 1.10 73 12,694 1.73 56Deposits in foreign offices 5,992 .99 15 4,438 1.34 15
Total interest-bearing deposits 167,459 .89 377 139,797 1.30 460Short-term borrowings 28,367 .95 68 30,175 1.41 107Long-term debt 58,814 2.27 335 46,060 3.14 363Guaranteed preferred beneficial interests in Company’s
subordinated debentures 3,591 3.60 32 2,885 4.08 29Total interest-bearing liabilities 258,231 1.25 812 218,917 1.74 959
Portion of noninterest-bearing funding sources 69,111 — — 63,248 — —
Total funding sources $327,342 .99 812 $282,165 1.36 959Net interest margin and net interest income on
a taxable-equivalent basis (6) 4.97% $4,067 5.41% $3,810
NONINTEREST-EARNING ASSETSCash and due from banks $ 13,083 $ 14,189Goodwill 10,209 9,756Other 34,110 34,083
Total noninterest-earning assets $ 57,402 $ 58,028
NONINTEREST-BEARING FUNDING SOURCESDeposits $ 74,941 $ 72,185Other liabilities 18,000 19,019Preferred stockholders’ equity 20 57Common stockholders’ equity 33,552 30,015Noninterest-bearing funding sources used to
fund earning assets (69,111) (63,248)
Net noninterest-bearing funding sources $ 57,402 $ 58,028
TOTAL ASSETS $384,744 $340,193
(1) Our average prime rate was 4.00% and 4.46% for the quarters ended December 31, 2003 and 2002, respectively. The average three-month London Interbank Offered Rate(LIBOR) was 1.17% and 1.55% for the same quarters, respectively.
(2) Interest rates and amounts include the effects of hedge and risk management activities associated with the respective asset and liability categories.(3) Yields are based on amortized cost balances computed on a settlement date basis.(4) Includes certain preferred securities.(5) Nonaccrual loans and related income are included in their respective loan categories.(6) Includes taxable-equivalent adjustments primarily related to tax-exempt income on certain loans and securities. The federal statutory tax rate was 35% for both
quarters presented.
110
111
Glossary
Collateralized debt obligations: Securitized corporate debt.
Core deposits: Deposits acquired in a bank’s natural market area, counted as a stable source of funds for lending. These deposits generally are characterized by having a predictable cost and a level of customer loyalty.
Core deposit intangibles: The present value of the difference in cost of funding provided by core deposit balances compared with alternative funding with similar terms assigned to acquired core deposit balances by a buyer.
Cost method of accounting: Method of accounting whereby the investment in the subsidiary is carried at cost, and the parent company accounts forthe operations of the subsidiary only to the extent that the subsidiary declares dividends. Generally used if investment ownership is less than 20%.
Derivatives: Financial contracts whose value is derived from publicly traded securities, interest rates, currency exchange rates or market indices.Derivatives cover a wide assortment of financial contracts, including forward contracts, futures, options and swaps.
Effectiveness/ineffectiveness (of derivatives): Effectiveness is the amount of gain or loss on a hedging instrument that exactly offsets the loss or gain on the hedged item. Any difference that does arise would be the effect of hedge ineffectiveness, which consequently is recognized currently in earnings.
Equity method of accounting: Method of accounting whereby the investment in the subsidiary is originally recorded at cost, and the value of the investment is increased or decreased based on the investor’s proportional share of the change in the subsidiary’s net worth. Generally used if investment ownership is 20% or more but less than 50%.
Federal Reserve Board (FRB): The Board of Governors of the Federal Reserve System, charged with supervising and regulating bank holding companies, including financial holding companies.
GAAP (Generally accepted accounting principles): Accounting rules and conventions defining acceptable practices in recording transactions and preparing financial statements. U.S. GAAP is primarily determined by the Financial Accounting Standards Board (FASB).
Hedge: Financial technique to offset the risk of loss from price fluctuations in the market by offsetting the risk in another transaction. The risk in one position is hedged by counterbalancing it with the risk in another transaction.
Interest rate floors and caps: Interest rate protection instruments that involve payment from the seller to the buyer of an interest differential,which represents the difference between a short-term rate (e. g., three-month LIBOR) and an agreed-upon rate (the strike rate) applied to a notional principal amount.
Futures and forward contracts: Contracts in which the buyer agrees to purchase and the seller agrees to deliver a specific financial instrument at a predetermined price or yield. May be settled either in cash or by delivery of the underlying financial instrument.
Interest rate swap contracts: Contracts that are entered into primarily as an asset/liability management strategy to reduce interest rate risk.Interest rate swap contracts are exchanges of interest rate payments, such as fixed-rate payments for floating-rate payments, based on notional principal amounts.
Mortgage servicing rights: The rights to service mortgage loans for others, which are acquired through purchases or kept after sales or securitizationsof originated loans.
Net interest margin: The average yield on earning assets minus the average interest rate paid for deposits and debt.
Notional amount: A number of currency units, shares, or other units specified in a derivative contract.
Office of the Comptroller of the Currency (OCC): Part of the U.S. Treasury department and the primary regulator for banks with national charters.
Options: Contracts that grant the purchaser, for a premium payment, the right, but not the obligation, to either purchase or sell the associated financial instrument at a set price during a period or at a specified date in the future.
Other-than-temporary impairment: A write-down of certain assets recorded when a decline in the fair market value below the carrying value of theasset is considered not to be temporary. Certain assets to which other-than-temporary impairment applies are goodwill, mortgage servicing rights,other intangible assets, securities available for sale and nonmarketable equity securities. (See Note 1 – Significant Accounting Policies for policy fordetermination of impairment for specific categories of assets.)
Qualifying special-purpose entities (QSPE): A trust or other legal vehicle that meets certain conditions, including (1) that it is distinct from the transferor, (2) activities are limited, and (3) the types of assets it may hold and conditions under which it may dispose of noncash assets are limited.A QSPE is not consolidated on the balance sheet.
Securitize/securitization: The process and the result of pooling financial assets together and issuing liability and equity obligations backed by theresulting pool of assets to convert those assets into marketable securities.
Special-purpose entities (SPE): A legal entity, sometimes a trust or a limited partnership, created solely for the purpose of holding assets.
Taxable equivalent basis: Basis of presentation of net interest income and the net interest margin adjusted to consistently reflect income from taxableand tax-exempt loans and securities based on a 35% marginal tax rate. The yield that a tax-free investment would provide to an investor if the tax-freeyield was “grossed up” by the amount of taxes not paid.
Underlying: A specified interest rate, security price, commodity price, foreign exchange rate, index of prices or rates or other variable. An underlyingmay be the price or rate of an asset or liability, but is not the asset or liability itself.
Value at risk: The amount or percentage of value that is at risk of being lost from a change in prevailing interest rates.
Variable interest entity (VIE): An entity in which the equity investors (1) do not have a controlling financial interest or (2) do not have sufficient equityat risk for the entity to finance its activities without subordinated financial support from other parties.
Yield curve (shape of the yield curve, flat yield curve): A graph showing the relationship between the yields on bonds of the same credit quality with different maturities. For example, a “normal”, or “positive”, yield curve exists when long-term bonds have higher yields than short-term bonds.A “flat” yield curve exists when yields are the same for short-term and long-term bonds. A “steep” yield curve exists when yields on long-term bondsare significantly higher than on short-term bonds.

112
Index
Wells Fargo Direct Purchase and Dividend Reinvestment PlanYou can buy Wells Fargo stock directly from Wells Fargo, even if you’re not a
Wells Fargo stockholder, through optional cash payments or automatic monthly
deductions from a bank account. You can also have your dividends reinvested
automatically. It’s a convenient and economical way to increase your Wells Fargo
investment. Call 1-800-813-3324 for an enrollment kit including a plan prospectus.
Investor InformationFor more copies of this report, other Wells Fargo investor materials or the latest
Wells Fargo stock price, call 1-888-662-7865.
Annual Stockholders’ Meeting1:00 p.m. Tuesday, April 27, 2004, 420 Montgomery St. , San Francisco, California
Proxy statement and form of proxy will be mailed to stockholders beginning on
or about March 19, 2004.
Copies of Form 10-KThe Company will send the Wells Fargo annual report on Form 10-K for 2003
(including the financial statements filed with the Securities and Exchange
Commission) without charge to any stockholder who asks for a copy in writing.
Stockholders also can ask for copies of any exhibit to the Form 10-K. The Company
will charge a fee to cover expenses to prepare and send any exhibits. Please send
requests to: Corporate Secretary, Wells Fargo & Company, Wells Fargo Center, MAC
N9305-173, Sixth and Marquette, Minneapolis, Minnesota 55479.
Wells Fargo & Company
Common Shares Outstanding (12/31/03) . . . . . . . . . . . . . . . . . . . . . . . . . . .1,698,109,374
Symbol . . . . . . . . . . . . . . . . . . . . . . . . . . . . . . . . . . . . . . . . . . . . . . . . . . . . . . . . . . . . . . . . . . . WFC
Listings . . . . . . . . . . . . . . . . . . . . . . . . . . . . . . . . . . . . . . . . . . . . . .New York Stock ExchangeChicago Stock Exchange
Shareowner Services . . . . . . . . . . . . . . . . . . . . . . . . . . . . . . . . . . . . .Wells Fargo Bank, N.A.1-877-840-0492
Stockholder Information
40, 110 Average balances, yields and rates—annual and quarterly 59 Balance sheet52 Capital management71 Charge-offs
35, 57 Common stock—book value and market price36 Critical accounting policies:37 Allowance for loan losses37 Valuation of mortgage servicing rights 38 Pension accounting
66, 103 Derivatives 66, 88 Earnings per share
53 Factors that may affect future results
Financial Accounting Standards Board statements,interpretations and statements of position:
35 FAS 149 — Amendment of Statement 133 on Derivatives and Hedging Activities
35 FAS 150 — Accounting for Certain Financial Instruments withCharacteristics of both Liabilities and Equity
35 FIN 46 — Consolidation of Variable Interest Entities 35, 78 FIN 46R — Consolidation of Variable Interest Entities (Revised)
36 FSP 106 -1— Accounting and Disclosure Requirements Related to Medicare Prescription Drug, Improvement andModernization Act of 2003
36 Five-year compound growth rate45, 101 Guarantees58, 109 Income statement—annual and quarterly
Loans:40, 110 Average balances—annual and quarterly70, 106 Commitments
70 Portfolio
40, 110 Net interest margin—annual and quarterly
62 Notes to financial statements:62 Summary of significant accounting policies67 Business combinations67 Cash, loan and dividend restrictions68 Securities available for sale70 Loans and allowance for loan losses73 Premises, equipment, lease commitments and other assets74 Intangible assets75 Goodwill76 Deposits76 Short-term borrowings
77 Long-term debt78 Guaranteed preferred beneficial interests
in Company’s subordinated debentures79 Preferred stock80 Common stock and stock plans83 Employee benefits and other expenses86 Income taxes88 Earnings per common share88 “Adjusted” earnings—FAS 142 transitional disclosure89 Other comprehensive income90 Operating segments92 Securitizations and variable interest entities94 Mortgage banking activities95 Condensed consolidating financial statements
101 Legal actions 101 Guarantees102 Regulatory and agency capital requirements103 Derivatives 106 Fair value of financial instruments
45 Off-balance sheet arrangements and aggregate contractual obligations
45 Off-balance sheet arrangements, variable interest entities, guarantees and other commitments
46 Contractual obligations 46 Transactions with related parties
43, 90 Operating segments
Ratios:35 Profitability (ROA and ROE)35 Efficiency35 Common stockholders’ equity to assets
35, 103 Risk-based capital and leverage
Risk management46 Credit risk management process48 Asset/liability and market risk management49 Interest rate risk49 Mortgage banking interest rate risk50 Market risk — trading activities50 Market risk — equity markets50 Liquidity and funding
36 Six-year summary of selected financial data
35, 45, Variable interest entities62, 93

Reputation
12th largest U.S. corporation in composite ranking
of revenue, profit, assets and market value
Among 10 largest givers in corporate America
#1 “Cross-Channel”Customer Experience
(Financial Services)
Among 100 Best Companies for Working Mothers
Rated the only “Aaa”bank in the U.S.
North America’s #1 Corporate Institutional
Internet Bank
Among top 50 in revenue among all companies
in all industries
Among top 25 companies in all industries
for diversity
Among top 25 U.S. companies in all industriesbased on sales, profit, and stockholder return
Among Web Smart 50, for “information-basedmarketing”that offers the right product to the right customer at the right time at every point of customer contact
BusinessWeek
Diversity Inc.
Forbes
Forrester
Fortune
Global Finance
Moody’s
Working Mother

Wells Fargo & Company420 Montgomery StreetSan Francisco, California 94163
800-333-0343www.wellsfargo.com
A 152-year reputation built on measuring value and financial success
Measuring value for our stakeholders is nothing new at Wells Fargo.We’ve been doing it for 152 years.“Gold fever” raged coast to coast when our companywas founded in 1852. Native gold, nuggets, and gold “dust” became the mostaccurately measured medium of value in history. Precision scales measuredvalue for miners and merchants with unfailing accuracy.These scales werecalled Gold Standard Balances.
As one Boston maker of clocks and watches said in 1858, these Balances were“made of the very best materials and the highest grade of workmanship; allbearings jeweled, and nothing omitted to secure perfect accuracy.”
They came by sea to California and to a company called Wells Fargo, which built its reputation, according to one newspaper in 1866, on the ”scrupuloushonor with which all engagements are met.” Gold Standard Balances and Gold Scales—another enduring symbol of our company’s 152-year reputationfor accuracy, dependability, integrity and honesty in everything we do.
Our VisionWe want to satisfy all the financial needs of our customers, help themsucceed financially, be recognized as the premier financial servicescompany in our markets and be one of America’s great companies.
Nuestra VisionDeseamos satisfacer todas las necesidades financieras de nuestrosclientes, ayudarlos a tener éxito en el área financiera, ser reconocidoscomo la compañía de servicios financieros más importante de nuestrosmercados y ser reconocidos como una de las grandes compañías denorteamerica.