measuring sustainable development application of … · measuring sustainable development...
TRANSCRIPT

MEASURING SUSTAINABLE DEVELOPMENT
APPLICATION OF THE GENUINE PROGRESS INDEX TO NOVA SCOTIA
THE GPI TRANSPORTATION ACCOUNTS:
SUSTAINABLE TRANSPORTATION IN NOVA SCOTIA
Prepared by: Aviva Savelson, MA, Ronald Colman, PhD, Todd Litman, MES, Sally Walker, PhD,
and Ryan Parmenter, MEDes
with assistance from William Martin, Clare Levin, Gillian Austin, Ben Gallagher, Jenny Gimian, Jaspal Marwah, and Antoni Wysocki
NOVEMBER 2006

Library and Archives Canada Cataloguing in Publication The GPI transportation accounts : sustainable transportation in Nova Scotia / prepared by Aviva Savelson ... [et al.] ; with assistance from William Martin ... [et al.]. "November 2006". Includes bibliographical references. ISBN 0-9780611-4-4 1. Sustainable transportation--Nova Scotia. 2. Transportation--Nova Scotia--Evaluation. I. Savelson, Aviva, 1974- II. GPI Atlantic
HE215.Z7N75 2006 388.09716 C2006-906349-4

EXECUTIVE SUMMARY GPIAtlantic is constructing an index of sustainable development for Nova Scotia: the Genuine Progress Index or GPI. This report on sustainable transportation constitutes one of the 20 core social, economic, and environmental components of this index. This document is intended to provide indicators for assessing the long-term sustainability of transportation systems and the resources on which they rely, with particular application to Nova Scotia but with wider applicability beyond this jurisdiction. These indicators, like all those in the Genuine Progress Index, are based on the clear objectives of preventing harm and providing benefit both to current and future generations of humanity and to the natural world. In conjunction with these indicators, this report includes estimates of the true or full economic, social, and environmental impacts of current transportation activities. Together, they can help evaluate the efficiency and equitable functioning of existing transportation systems, and identify possible policy and planning reforms that can help create a more sustainable transportation system and economy. GPIAtlantic’s evaluation methods typically begin with assessments of trends (i.e. quantifiable information on physical impacts over time, such as changes in vehicle-kilometres travelled, accident rates, or the volume of greenhouse gases emitted). Where possible and appropriate, the analysis then monetizes (measures in monetary values) these physical impacts to help quantify the full value of social, economic, and environmental impacts in a format that allows convenient comparison, evaluation, and assessment of economic efficiency. This report comprises six main sections. Part I provides an introduction to and background on the Genuine Progress Index, as well as a discussion of GPIAtlantic’s working definition of sustainable transportation. Part II sets out the goals, objectives, and indicators used to evaluate Nova Scotia’s transport sector. Part III—the main section of the report—presents findings for 17 key indicator categories assessing the sustainability of the province’s transportation system. Part IV is a quantitative assessment of the economic costs of road transportation in Nova Scotia (insufficient data were available for a similar evaluation of other transport modes). This section provides estimates for 15 cost categories, many of which go unexamined in standard transportation accounting. Finally, in Part V, a set of recommendations to improve transportation system sustainability is presented, based on this comprehensive analysis of impacts and on the evidence presented in this study. Although this report focuses on Nova Scotia, it provides a potential template for the country as a whole and for other jurisdictions that are interested in adopting indicators of sustainable transportation and in assessing trends and transportation costs. This analysis takes into account as many key economic, social, and environmental impacts of transportation as possible, including some that tend to be overlooked because they are indirect transport-induced effects or because they are not measured in the market economy. In doing this, the analysis provides more comprehensive guidance for transportation planners than traditional methods of evaluating transportation options, and can help identify policies and programs that better meet the needs of users and contribute to genuinely sustainable development. This comprehensive analysis can help identify “Win-Win transportation solutions,” that is, strategies that provide multiple benefits for a number of public and private sectors. For example, a
GENUINE PROGRESS INDEX i Measuring Sustainable Development

comprehensive analysis like that undertaken here can help identify those congestion reduction strategies that also help reduce parking costs, reduce accidents, and improve mobility options for non-drivers. Most importantly, such comprehensive analysis can help identify the most sustainable solutions to common transportation problems, and thus contribute significantly to long-term prosperity. The Genuine Progress Index of Sustainability As defined by the Brundtland Commission: “Sustainable development is development that meets the needs of the present without compromising the ability of future generations to meet their own needs.”1 Sustainable development planning requires a comprehensive evaluation system that takes into account economic, social, and environmental impacts, including those that occur in distant times and places. Figure 1 illustrates the range of issues considered in sustainability planning. Sustainability planning balances these planning objectives, resulting in policies that are, overall, optimal for society.
Figure 1. Sustainability Issues
Note: This figure illustrates various sustainability issues. True sustainability occurs in the centre, where economic, social, and environmental objectives are effectively balanced. The Genuine Progress Index (GPI) is such an evaluation system. It is more comprehensive than commonly-used indicators of economic progress, such as Gross Domestic Product, which only account for market activity (goods and services traded in conventional market exchanges). The GPI recognizes that the market economy depends on the social economy (families, friends, and 1 World Commission on Environment and Development (WCED). Our common future. Oxford: Oxford University Press, 1987, p. 43.
GENUINE PROGRESS INDEX ii Measuring Sustainable Development

communities), which depends on the natural environment for essential life support services, as illustrated in Figure 2. For example, few people could be productive without support from family members, friends, and neighbours, who provide services such as shared meals, child care, emotional support, recreation, and security. Even more basically, people rely both for their survival and quality of life on natural resources such as clean air and water, a stable climate, healthy forests and soils, waste assimilation, and natural beauty. However, these valuable services, friendly assistance, neighbourhood security, drinkable water, breathable air, a stable climate, waste absorption capacity, and so on—frequently receive insufficient attention in the policy arena exactly because they are unpriced. Described differently, we are far wealthier than indicated just by conventional market activity alone, because we enjoy uncompensated services provided by family, friends, and the natural environment. For example, people would be much poorer if they needed to pay for each breath of fresh air or each litre of water extracted from rivers and wells (of course, we often do pay for water treatment and distribution, but the natural resource itself is often unpriced.) Figure 2 indicates two ways of illustrating the natural hierarchy between the environmental, social, and economic spheres of life, and the dependence of all human activity on resource and energy flows from the encompassing natural world.
Figure 2. Market, Social, and Natural Economies
Note: The market economy is based on the social economy (such as families, friends, and community members who provide unpaid services to each other), which is based on a natural economy (which provides “free” natural resources and services such as clean air, water, forests, and wild fish). Human society also dumps wastes back into the encompassing natural world, which in turn, affects the functioning of the social and market economies. As the concentric circle model below implies, the encompassing natural world can function without human society, while irreversible changes in natural ecosystems, like climate change and species extinctions, can seriously imperil the functioning of dependent human economies.
GENUINE PROGRESS INDEX iii Measuring Sustainable Development

A Sustainable View of the Relationship between Economy, Society, & Environment
By assigning zero value to non-market goods and services, conventional economic indicators such as the GDP unintentionally encourage practices that degrade social and environmental resources by recording as gain—“economic growth”—any activity that leads to financial exchange, even when it undermines long-term wellbeing and prosperity. For example, the GDP implicitly treats car crashes, crime, pollution, and disasters as economically beneficial because it measures the additional economic activity that results (e.g. ambulance services, prison building, clean-up costs), but does not properly account for the harms and losses to individuals and society. As a result, GDP undervalues preventive solutions, such as public health , poverty reduction, and energy conservation, which avoid problems, although such solutions often save money in the long term and are generally beneficial to society overall. By contrast, the Genuine Progress Index does assign explicit worth to non-market values like environmental quality, population health, unpaid work, free time, security, equity, educational attainment, and natural resource health. Unlike conventional economic accounting systems that value only produced or manufactured capital, the GPI also values human capital, social capital, and natural capital, and recognizes that these forms of capital are equally subject to depreciation if managed unsustainably. Where possible, the GPI monetizes (measures in monetary units) many non-market benefits and costs so that they can be incorporated into more comprehensive accounting systems and compared with market impacts. Some people are uncomfortable with this, fearing monetization will lead to the commodification and exploitation of goods such as environmental resources and human health. However, such misuses of monetization can easily be avoided provided that dollar estimates do not replace the use of physical indicators to assess actual trends, and provided that the limitations of money to value non-market and un-priced goods and services are always transparent. At the same time, it must be acknowledged that the failure to monetize non-market benefits and costs frequently results in their being seriously undervalued and even ignored in the policy arena. For this reason, transportation costs are often monetized in transportation studies. For example,
GENUINE PROGRESS INDEX iv Measuring Sustainable Development

monetized estimates of motorists’ travel time and crash risk are frequently used to justify highway expansion. Failing to monetize other impacts, such as pedestrian and congestion delay and environmental damages caused by vehicle traffic, tends to skew decisions to favour automobile-oriented improvements, leading to less sustainable planning decisions. More comprehensive analysis, which includes monetized estimates of currently-overlooked impacts, can lead to more balanced decision-making. In other words, commonly-used economic indicators are biased in favour of impacts that are easy to measure (such as common market goods and services) at the expense of more difficult to measure impacts (such as those involving social values and environmental services). Sustainability planning requires correcting this bias by providing a functional framework that allows all significant impacts (economic, social, and environmental) to be evaluated, including those not currently traded in a conventional market. The GPI is intended to provide such a comprehensive evaluation and accounting framework. The GPI Sustainable Transportation Evaluation Framework This project’s goal is to create a practical framework for evaluating transportation system sustainability, taking into account all significant economic, social, and environmental impacts, including those that are indirect, non-market, and long-term. This is by no means the first exercise of this type, but builds on prior research on sustainable transportation indicators2,3 and on the quantification of transportation impacts.4, , ,5 6 7 Table 1 lists the types of impacts considered in sustainable transportation analysis.
Table 1. Sustainable Transportation Impacts Economic Social Environmental
Traffic congestion Infrastructure costs
Consumer costs Mobility barriers
Accident damages Depletion of Non-Renewable
Resources
Equity / Fairness Impacts on mobility disadvantaged
Human health impacts Community cohesion Community liveability
Aesthetics
Air pollution Climate change
Noise and water pollution Habitat loss
Hydrologic impacts Depletion of Non-Renewable
Resources
2 Centre for Sustainable Transportation, Sustainable Transportation Performance Indicators. cst.uwinnipeg.ca/completed.html. 3 Litman, Todd. Well Measured: Developing Indicators for Comprehensive and Sustainable Transport Planning. (Victoria Transport Policy Institute, 2006f). www.vtpi.org 4 Delucchi, Mark. The Social-Cost Calculator (SCC): Documentation of Methods and Data, and Case Study of Sacramento. (Sacramento Area Council of Governments (SACOG) and the Northeast States for Coordinated Air-Use Management, 2005). www.its.ucdavis.edu/publications/2005/UCD-ITS-RR-05-37.pdf 5 European Transport Pricing Initiatives. www.transport-pricing.ne 6 Litman, Todd. Transportation Cost and Benefit Analysis. Victoria Transport Policy Institute, 2004e) www.vtpi.org 7 Transport Canada, Investigation of the Full Costs of Transportation: A Discussion Paper, Economic Analysis Policy Group, Transport Canada, 2003. This paper outlines a three-year research program called The Full Cost Investigation of Transportation in Canada (www.tc.gc.ca/pol/en/aca/fci/menu.htm), which is currently investigating the full financial and social costs (e.g. accidents, noise, congestion delays, and environmental damages) resulting from transport infrastructure, services, and vehicles in Canada.
GENUINE PROGRESS INDEX v Measuring Sustainable Development

Of course, this type of project has limitations. Not every impact can be quantified and monetized, and there is significant uncertainty in some economic values, due to insufficient data and variability. For example, there are only a few good monetized estimates of motor vehicle noise costs, and this impact can vary significantly depending on the type of vehicle, and when and where it is driven; so care is needed to estimate the traffic noise costs in a particular situation. However, the evidence to date indicates that, despite such limitations, sufficient information is available for a reasonably comprehensive analysis of transportation impacts, and that attempting to assess such impacts based on the best available evidence is better than ignoring these impacts in formal evaluation. Where uncertainties do exist, this report attempts to make them transparent and to provide a range of estimates, so that readers and users can apply their own discernment and judgement in evaluating the evidence. Many impacts are also difficult to measure directly, so we evaluate them not just with single measures but rather with sets of indicators that were carefully selected both to be technically feasible, and also to effectively balance sustainability objectives. We group these indicators into four categories – travel patterns, economic, social, and environmental – although some indicators could be assigned to multiple categories. For example, crashes impose both economic costs (losses involving market goods and financial compensation) and social costs (uncompensated non-market losses, such as reduced quality of life and companionship.) Table 2 summarizes indicators used in this analysis, grouping them according to the sustainability objectives defined and examined in this study.
Table 2. GPI Sustainable Transportation Objectives and Indicators
Objective Indicator Transport Activity 1. Decrease economically excessive motor vehicle transport, and increase use of more sustainable modes
1. Motorized movement of people: - Vehicle-km - Passenger-km - Passenger-km per capita - Comparison of trends: passenger-km and GDP 2. Motorized movement of freight - Tonne-km - Tonne-km per capita - Comparison of trends: tonne-km and GDP 3. Passenger automobiles per capita
GENUINE PROGRESS INDEX vi Measuring Sustainable Development

Environment 2. Decrease energy consumption 4. Transport-related energy consumption
- Total and per capita energy consumption devoted to transportation - Percentage of primary energy consumption dedicated to transportation - Share of energy consumption by mode and fuel
3. Increased fossil fuel energy efficiency
5. Energy intensity of cars and trucks - Energy consumption per vehicle-km
4 Decrease greenhouse gas (GHG) emissions
6. Transport-related GHG emissions by mode and per capita
5. Decrease emissions of air pollutants 7. Total transport emissions of air pollutants by mode and per capita 6. Decrease pollution emissions per unit of travel
8. Emissions intensity of cars and trucks - Emissions per vehicle-km
7. Decrease water pollution 9. Polluting discharges by mode - Oil spills - Road salt usage - Well contamination
8. Increase recycling and re-use of transportation components
10. Number of tires recycled 11. Number of derelict cars recycled
9. Decrease space taken by transport facilities
12. Land Use - Space taken by transport facilities by mode - Total length of paved roads - Urban density
Social 10. Increase access to basic services 13. Access to basic services
- Average commuting distance - Percentage of children who walk to school - Percentage of commuters who walk, bicycle, or use public transit
11. Increase access to public transportation
14. Access to public transit - Percentage of population who live within 500m of transit station
12. Increase access to the Internet 15. Percentage of population with home internet - Percentage of population who work at home
13. Decrease transport injuries and fatalities
16. Transport injuries and fatalities by mode
14. Increase non-motorized transportation
17. Non-motorized travel: quality and quantity of walking and cycling conditions - Kilometres of bike paths and sidewalks
Economic 15. Increase percentage of net government spending on public transportation
18. Investments in public transport - Percentage of net government ground transportation expenditures spent on public transportation
16. Increase proportion of household transportation spending devoted to public transit
19. Percentage of household transportation spending devoted to public transit
17. Decrease cost of household transportation expenditure in lowest income quintile
20. Expenditure on personal mobility - Percentage of household expenditures dedicated to transportation for those in lowest income quintile
GENUINE PROGRESS INDEX vii Measuring Sustainable Development
Trend Analysis This section of the report discusses the sustainable transportation indicators and their trends. The degree to which these trends support sustainability objectives overall is indicated by these symbols: negative ( ), positive ( ). Needless to say, trends can only explain whether something is getting better or worse, but can potentially be deceptive, since everything depends on the base year used. Also, something that is at a very poor level of performance (i.e. highly unsustainable) is more likely to move up, whereas (conversely) something that is already performing well is more likely to stabilize or even to show a downward trend. In other words, the trends do not tell us anything about whether the current state of a particular factor is at or near sustainable levels, only whether things are marginally more or less sustainable than they were. For example, the small decrease in transport-related greenhouse gas emission intensity in Nova Scotia would seem to signify a positive trend in the system, even though overall emission intensities and levels are completely unsustainable from the perspective of stabilizing greenhouse gas concentrations in the atmosphere. Similarly, there have been significant improvements in energy intensity levels in Nova Scotia, leading to a positive trend marker signal. What these improvements hide is that these emission and energy intensity levels were already very much higher than those in European countries, so the only real direction for Nova Scotia and Canada to go was better. Conversely, European levels of energy intensity had already stabilized at much lower levels and are therefore no longer showing improvements (even though European countries have energy intensity levels and GHG emissions well below those of Canada). Again, this demonstrates how trend markers showing directionality alone can mask reality. As well, recent improvements or downturns may mask overall problems or longer-term trends. For example, a recent decline in well contaminations attributable to road salt veils the continued high application of road salt in Nova Scotia, while a recent increase in crash deaths and injuries conceals a longer-term reduction. In each of these cases, a decision was made to favour the longer-term trends at the expense of the most recent one. However, only the full report can provide the detailed discussion necessary to describe the status of each of these indicators in comparative context and to analyze the internal nuances of the trends more closely. Given these caveats, the trend markers used in this Executive Summary are inserted here primarily for illustrative purposes and for their ability to summarize overall trends, but they must be used for caution. The full chapters provide additional information on the current state of each indicator, and the degree to which it is close to sustainable levels. That can be assessed more closely in the international comparisons that are provided for OECD nations. These international comparisons in many of the chapters allow us to set clearer benchmarks of what is possible, and to assess whether or not Canada and Nova Scotia are close to sustainable levels compared to other industrial countries. The key point here is that in addition to whether or not we are moving in the right direction, it is equally important to know how close or far we are from what might be considered a more sustainable level (at least in relation to best practices). For example, countries like Germany have gone much further than Canada has on many indicators of sustainability. Part 3 of this report provides this kind of detail for each indicator.
GENUINE PROGRESS INDEX viii Measuring Sustainable Development

Transport Activity Transport patterns in Canada and Nova Scotia, like those in most developed countries, have become increasingly automobile-dependent, with high levels of per capita vehicle ownership and use, and declining transport options. During the last half-century transit service has declined; homes and businesses have become more dispersed; more neighbourhoods have been built that lack sidewalks; roads and paths have become less connected (with larger blocks and more dead-end streets); and the barrier effect (delay and risk that motor vehicle traffic causes non-motorized modes) has increased, making non-motorized travel more difficult. In addition, alternative modes of transportation have become increasingly stigmatized. The overall effect of these trends is that people drive more kilometres each year and spend more money on transportation, while non-drivers are relatively worse off with fewer alternative options. These trends are, in part, a result of various market distortions that encourage motor vehicle travel, including under-pricing of road and parking facilities, fixed insurance premiums, and registration fees that are unrelated to kilometres driven, uncompensated crash risks and damages, un-priced environmental and social impacts, planning and investment practices that favour motor vehicle improvements, and various land use policies that favour more dispersed development practices.8, , 9 10 Although individually some of these distortions may seem modest and justified, their impacts are cumulative and synergistic (total impacts are greater than the sum of individual impacts). As a result, a significant portion of current motor vehicle travel is economically inefficient: – i.e. in a more efficient and equitable market that accounted accurately for the full benefits and costs of different transportation modes, Canadians and Nova Scotians would choose to drive significantly less, rely more on alternative modes of transportation, and be better off overall as a result. The present economically excessive motor vehicle travel (defined here as motor vehicle travel that results from market distortions) contradicts sustainability objectives. As a result, at the margin, compared with current transport patterns, reductions in motor vehicle travel are considered to increase sustainability. During the last decade, some of these trends towards increased motorized transport activity in the last half century have started to stabilize or even reverse in many developed countries (but not in Canada), due to changes in demographics, economics, and public policies. For example, per capita annual vehicle-kilometres driven has stopped growing in most developed countries due to population aging, rising fuel prices, and changing consumer preferences.11 New urban planning practices and programs (like that currently under way in Halifax Regional Municipality) have increased walking, cycling, and public transit ridership in several jurisdictions, and even reduced automobile travel (or at least the growth in automobile travel which would otherwise occur) in 8 Litman, Todd. Socially Optimal Transport Prices and Markets. (Victoria Transport Policy Institute, 2006). www.vtpi.org. 9 Beimborn, Edward and Robert Puentes. Highways and Transit: Leveling the Playing Field in Federal Transportation Policy. (Brookings Institute, 2003). www.brookings.edu 10 Murphy, James and Mark Delucchi. “A Review of the Literature on the Social Cost of Motor Vehicle Use in the United States,” Journal of Transportation And Statistics. (Bureau of Transportation Statistics. January 1998. 1[1]: 15-42. www.bts.gov. 11 Litman, Todd. The Future Isn’t What It Used To Be: Changing Trends And Their Implications For Transport Planning. (Victoria Transport Policy Institute, 2005b). www.vtpi.org
GENUINE PROGRESS INDEX ix Measuring Sustainable Development

some communities.12 Canada has lagged many European countries in instituting such reforms. In
2003, the Organisation for Economic Co-operation and Development (OECD) found that Canada had the fourth highest total for vehicle-km of road transportation per capita amongst selected OECD countries (See Figure 3).
Figure 3. Transport Activity (Vehicle-Km per Capita) for Selected OECD Countries (2003).
23,0
95
16,2
17
15,4
53
13,0
58
12,9
77
12,8
65
12,4
09
12,3
01
11,8
85
11,6
19
11,6
14
10,1
86
9,96
1
9,27
0
9,18
0
7,51
6
6,60
2
6,42
8
5,25
6
3,81
2
2,30
5
6,12
8
15,1
69
10,6
65
0
5,000
10,000
15,000
20,000
25,000
Turk
ey
Gre
ece
Pola
nd
Slov
ak R
epub
lic
Hun
gary
Japa
n
Cze
ch R
epub
lic
Portu
gal
Spai
n
Net
herla
nds
Ger
man
y
Uni
ted
Kin
gdom
Swed
en
Bel
gium
Nor
way
Switz
erla
nd
Finl
and
Fran
ce
Den
mar
k
Can
ada
Italy
Icel
and
Uni
ted
Stat
es
Ave
rage
Ann
ual K
ilom
eter
s Per
Cap
ita
Source: Organisation for Economic Co-operation and Development. OECD In Figures - 2005 Edition. (www.oecd.org/infigures), 2005. Canadian passenger vehicle travel grew 15.7% and freight traffic grew 28% between 1990 and 2002, though Canada still registers one-third fewer vehicle-kilometres travelled per person than the United States. Similarly, Nova Scotian per capita automobile vehicle-kilometres and tonne-kilometres of road freight have increased during this period. Broken down by vehicle class the indicators show that car and bus travel changed little in Nova Scotia, but travel by light trucks, SUVs and mini-vans increased, making transport more resource intensive. Provincial-level rail, air, or marine travel data are unavailable, so it is not possible to evaluate trends for these modes in Nova Scotia.
Trend Rating:
12 Moving the Economy Online - Best Practices Database. www.movingtheeconomy.ca; SMILE - Sustainable Urban Transport Policies and Initiatives. www.smile-europe.org/frame22.html; VTPI, “Success Stories,” Online TDM Encyclopedia, (Victoria Transport Policy Institute, 2006e). www.vtpi.org
GENUINE PROGRESS INDEX x Measuring Sustainable Development

Environmental Indicators Per capita transportation energy consumption is higher in Canada than in most other countries. Canada had the second highest energy use per capita out of 30 OECD (Organisation for Economic Co-operation and Development) countries — with about 70% higher transport energy use per capita than the OECD average, and second only to the United States (see Figure 4).
Figure 4. Transportation Energy Use (Gigajoules) per Capita for Selected OECD Countries, 2000.
7.8 10
.3
10.9 13
.8 16.0 20
.0 22.4 26
.7 28.0 29.2 30.7
31.0 34
.2
35.2 36.4
36.9
37.2
37.3
37.5
38.4
39.2 40.4
41.4 42.9 44.2
54.6 59
.6 61.4
72.8
41.0
92.8
0.0
10.0
20.0
30.0
40.0
50.0
60.0
70.0
80.0
90.0
100.0
Turk
ey
Pola
nd
Slov
ak R
ep.
Hun
gary
Mex
ico
Cze
ch R
.
Rus
sian
Fed
.
Kor
ea
Portu
gal
Gre
ece
Italy
Japa
n
Ger
man
y
Spai
n
Finl
and
UK
Aus
tria
Net
herla
nds
Fran
ce
Den
mar
k
Swed
en
Bel
gium
Switz
erla
nd
Nor
way
Irel
and
N.Z
eala
nd
Icel
and
Aus
tralia
Can
ada
USA
OEC
D
Tra
nspo
rtat
ion
Ene
rgy
Use
(Gig
ajou
les)
per
Cap
ita
Source: Organization for Economic Co-operation and Development. OECD Environmental Data—Compendium 2002, Tables 8.5 and 12.1A. Total transportation energy use has increased steadily in Nova Scotia. Indeed, compared to other provinces, an unusually large proportion of total energy use in Nova Scotia is devoted to transportation—38% —a portion that is only surpassed in Prince Edward Island, which probably reflects the relatively low energy consumption by the industrial sector in both provinces. Passenger travel accounts for about two-thirds of the energy used by road vehicles in Nova Scotia. However, freight transport was responsible for 81% of the increase in total road vehicle energy use between 1990 and 2002. Passenger light truck energy use grew by about 28% and heavy freight truck energy use rose 36%. Still more dramatic was the large increase in energy use by off-road vehicles: up 149% from 1990 to 2002, reflecting the increased popularity of ATVs in particular.
Trend Rating:
GENUINE PROGRESS INDEX xi Measuring Sustainable Development

This increase in transportation energy consumption resulted from increased vehicle travel. Transportation energy intensity (energy consumption per unit of travel) actually declined since 1990 for all vehicle types, including freight vehicles, except small cars and motorcycles, which already had lower energy intensity than other vehicle types.
Trend Rating:
However, in terms of the provincial road passenger fleet as a whole, increased numbers of SUVs, minivans, and light trucks on provincial roads in the last ten years have cancelled out the efficiency gains within the light truck category. As a result, the energy intensity of road passenger transportation in Nova Scotia as a whole is now higher than it was in the mid-1990s, although this is not reflected in the positive trend rating above. The high rates of transportation energy consumption result in high rates of transportation-related greenhouse gas (GHG) emissions. Under the Kyoto Protocol, Canada is obliged to reduce these emissions to 6% below 1990 levels by 2008-2012; but by 2004, Canada’s total GHG emissions had increased to 27% over 1990 levels. Nova Scotia’s GHG emissions grew by 18% between 1990 and 2004, slower than the overall national growth rate in emissions but still well above the target. This is likely due largely to slower population growth in this region. Within the Nova Scotia transportation sector, road transport contributed the most GHG emissions (69%) in 2004. The air and marine sectors contributed about 8% and 12% of transportation-related GHG emissions, respectively. Rail was responsible for just 2% of total transportation-related emissions. Greenhouse gas emissions from cars actually decreased 11% over the period 1990-2004, reflecting a trend away from cars to SUVs, minivans, and light trucks. However, heavy-duty diesel trucks produced about 54% more emissions than in 1990. The increase in GHG emissions from light-duty gasoline trucks (including SUVs and minivans) was 60%. The largest expansion was in the category of off-road vehicles—emissions from this vehicle class grew by over 68% between 1990 and 2004 (see Figure 5).
GENUINE PROGRESS INDEX xii Measuring Sustainable Development

Figure 5. Nova Scotia: GHG Emissions from Passenger and Freight Vehicles, 1990-2004 (kt of CO2 equivalent emissions).
0
200
400
600
800
1,000
1,200
1,400
1,600
1,800
kt C
O2 e
quiv
alen
ts
Gasoline Automobile 1,680 1,560 1,570 1,610 1,540 1,650 1,580 1,550 1,370 1,600 1,460 1,480 1,500 1,510 1,490
Light-Duty Gasoline Trucks 939 908 956 1,020 1,010 1,120 1,150 1,160 1,230 1,380 1,440 1,340 1,400 1,470 1,500
Heavy-Duty Diesel Vehicles 790 757 797 800 826 854 896 894 951 1,010 1,040 1,060 1,080 1,170 1,220
Off-Road 370 360 350 450 600 450 340 470 500 540 550 590 650 620 620
1990 1991 1992 1993 1994 1995 1996 1997 1998 1999 2000 2001 2002 2003 2004
Source: Jaques, A. National Inventory Report 1990-2004, Annex 12. The growth in road transport-related GHG emissions particularly reflects increased vehicle travel by more fuel-intensive vehicles (particularly SUVs, minivans, and light trucks) during the 1990s, as well as a substantial increase in truck freight activity.
Trend Rating:
Emissions of Criteria Air Contaminants (nitrogen oxides [NOx], sulphur oxides [SOx] particulate matter [PM], volatile organic compounds [VOCs], and carbon monoxide [CO]) refer to emissions of those air pollutants for which ambient air quality standards and maximum acceptable exposure levels have been set. In general, Nova Scotia compares relatively favourably to other Canadian jurisdictions for transportation-related emissions of criteria air contaminants. Nova Scotia has the lowest per capita mobile emission rates for NOx of all Canada’s provinces and territories; the second lowest per capita emissions of total particulate matter and VOCs; and the third lowest per capita CO emissions. Criteria air contaminant emission trends are therefore basically positive, reflecting the effects of technological improvements and vehicle emission reduction strategies. There was a 28% decline in the composite index of air pollutant emissions from mobile sources for Nova Scotia between 1990 and 2000. However, the rate of decrease slowed in the latter half of the decade, likely due
GENUINE PROGRESS INDEX xiii Measuring Sustainable Development

to the increase in overall transport activity as well as the growth in trucking and increased prevalence of SUVs, minivans and light trucks.13
Trend Rating:
The amount of land used for transportation facilities is an environmental indicator because such facilities tend to have adverse ecological impacts, including disruption of water flows; damage to unique physical features; road kills and wildlife injuries; and, perhaps most importantly, the disturbance, isolation, and loss of wildlife habitat. Available evidence indicates that Nova Scotia’s overall road density exceeds the threshold beyond which natural populations of some large vertebrates (like the endangered mainland moose) have been shown to decline, and may therefore compromise animal habitat in much of the province.14
Trend Rating:
Urban density (people per hectare) is used to assess land use efficiency and accessibility. In general, declining urban density implies movement away from sustainability because residents of dispersed communities tend to use more land and travel more by motor vehicle than residents of more compact settlements. Available evidence indicates that Nova Scotia’s urban density diminished by 36% between 1971 and 1996—one of the sharpest provincial declines in the country. Unfortunately, Statistics Canada has ceased tracking this information, so current trends cannot be stated with certainty. This data gap is particularly regrettable since this is a fundamental indicator of transportation sustainability, directly affecting total transport activity (the first and most basic indicator). These data are also essential to support new policies that attempt to integrate land use and transportation planning. On the positive side, Halifax Regional Municipality is now developing strategies to implement “smart growth” policies and practices which will help integrate transportation and land use planning, and which may help reduce sprawl and create more accessible and multi-modal communities.
Trend Rating:
The evaluation framework in this study tracks two additional transportation pollution sources: the salting of roads, and accidents involving the transport of hazardous materials. In Canada, only Ontario and Quebec apply more total road salt than Nova Scotia. Road salts can taint water supplies, and can cause harm to fish, birds, vegetation, and soil organisms. While new 13 Unfortunately, the air pollution data are not reported by conventional vehicle types (i.e. they are reported by heavy duty, light duty etc categories… not by SUVs, minivans, or passenger trucks). Therefore we rely on the transport activity data to point to the likely role of SUVs, minivans, and light trucks in slowing the decrease in air pollutant emissions. 14 Beazley, Karen, Tamaini Snaith, Frances Mackinnon and David Colville. “Road Density and Potential Impacts on Wildlife Species such as American Moose in Mainland Nova Scotia.” (Proceedings of the Nova Scotia Institute of Science. 2003. 42 [2]: 339-357).
GENUINE PROGRESS INDEX xiv Measuring Sustainable Development

regulations introduced in 1998 were aimed at reducing well contaminations resulting from road salt, 2004 was the first year that saw a marked decline in contaminated well claims. It is not yet clear whether this constitutes the beginning of a new trend, and it is also not clear whether the new policies have also mitigated other impacts like damage to wildlife habitat. For the moment, however, we acknowledge the recent 2004 trend shift here as a potentially positive step, though it must be acknowledged that the quantity of total road salt still used in Nova Scotia leaves this indicator far from sustainable levels.
Trend Rating: Re-use and recycling provides environmental benefits by reducing resource and energy consumption, and waste disposal impacts. In Nova Scotia, two transportation materials recovery efforts are officially monitored: tire recycling and derelict vehicle programs supported by the province’s Resource Recovery Fund Board. The number of tires recycled has increased steadily from the program’s inception in 1997 and, by 2001, there was a 90-95% recovery rate. The number of derelict vehicles salvaged nearly tripled from 712 in 2001 to over 2,100 in 2004. Both trends indicate movement towards sustainability.
Trend Rating:
GPIAtlantic made efforts to track other diversion programs for transportation waste, but without success. Batteries, used motor oil, and anti-freeze have been banned from Nova Scotia’s landfill sites since the mid-1990s, but their disposal is not monitored, so it is not presently possible to assess the treatment of such post-consumer toxic substances as battery acid. Social Indicators The social indicators evaluate impacts on people and communities, including human health and fitness, social equity, community liveability (including environmental quality from residents’ and visitors’ perspectives as opposed to objective physical data), community cohesion (the quality of interactions among people in a community), historic and cultural preservation, and aesthetics. These indicators also reflect the quality of travel options available to people who are economically, physically and socially disadvantaged. Inadequate travel options reduce non-drivers’ economic and social opportunities, increase their costs (for example, requiring more taxi rides), and increase the burden on drivers forced to chauffeur non-driving and dependent family members and friends. Automobile dependency increases consumer transportation costs, adding thousands of dollars in annual vehicle expenses to household budgets, which can be a major financial burden to lower-income households. In addition, public health officials are increasingly concerned about the health problems that result from reduced walking and cycling. The 1996 and 2001 censuses provide statistics on commute modal split (the portion of commuters using various travel modes). Over this time period automobile commuting increased
GENUINE PROGRESS INDEX xv Measuring Sustainable Development

slightly, pedestrian commuting did not change significantly, while transit use, ridesharing, and bicycle commuting all declined. Walking accounted for 8.3% of commute trips in Nova Scotia, and 10% in Halifax. Public transit commuting in Nova Scotia declined from about 5.1% in 1996 to 4.8% in 2001 (see Figure 6).
Figure 6. Nova Scotia: Commute Mode Split (Over 15 years of Age), 1996 and 2001. 1996 2001
Passenger, 10.2%
Walked, 8.3%Public
Transit , 5.1%
Bicycle, 0.7%
Other, 1%
Driver, 74.3%
Walked8.3%
Bicycle0.6%
Public Transit4.8%
Passenger9.6%
Driver75.2%
Other1.5%
Source: Statistics Canada. 1996 and 2001 Census of Population – Labour Force Activity, Occupation and Industry, Place of Work, Mode of Transportation to Work, Unpaid Work, Provinces and Territories in Canada.
Note: “Other” includes commuting to work by motorcycle, taxi, and other modes not listed. During this period the provincial median commuting distance declined from 8.3 to 7.8 kilometres, although this is still the second longest commute distance of any Canadian province or territory and does not therefore constitute sufficient improvement to denote a definite trend towards sustainability. For the present, the increase in driving and the decline in transit and bicycle commuting constitute trends away from sustainability.
Trend Rating:
Between 1990 and 2003 the proportion of Nova Scotians with convenient public transit access declined, particularly in the Halifax region, due to urban sprawl (more residents locating in areas not served by transit). The King’s Transit Authority also recorded a reduction in service availability, although this may be attributable to some extent to inconsistent reporting practices during the period studied. On paper there was an increase in the percentage of the population
GENUINE PROGRESS INDEX xvi Measuring Sustainable Development

served by Cape Breton Regional Municipality Transit Services, but this seems to be attributable to emigration from the island rather than to an improvement in transit coverage.
Trend Rating:
Telework (use of telecommunications to substitute for physical travel) can improve accessibility and reduce automobile travel. The portion of Nova Scotian households with Internet access nearly doubled from 32% in 1997 to 63% in 2003, indicating increased potential for telework. No clear trend could be established for the proportion of Nova Scotians actually working from home, which was 6.7% in both 1996 and 2001, so the positive rating given to this trend here is based on increased potential that remains to be realized.
Trend Rating:
Motor vehicle crashes are a major cause of death, disability, potential years of life lost, and property damages. In Nova Scotia, the number of road accident deaths have been declining since 1990 and the number of injuries have been declining since 2000, but both rose again in 2004. Off-road vehicle accidents have increased drastically since 1996 largely due to the increased popularity of ATVs. There were 991 reported day surgeries and hospital admissions and 35 fatalities involving off-road vehicles between 1995 and 2004. The incidence of off-road vehicles involved in accidents resulting in injuries increased by 150% over the period.15, 16 The recent 2004 increase in road accident deaths and injuries leads to a negative trend rating here, though it must be acknowledged that present road accident death and injury rates are still well below 1990 levels.
Trend Rating: Accidents involving dangerous goods decreased significantly in Nova Scotia between 1990 and 2003. Road and facility accidents have shown the most marked declines. Air, marine, and rail accidents involving dangerous goods remained minimal. Data were unavailable for potential sources of water pollution from transportation like oil spills, bilge discharges, and fluid leaks from cars and trucks.
Trend Rating:
Some professional organizations (such as the Canadian Institute of Transportation Engineers) and governments (such as Halifax Regional Municipality) are taking steps to implement policies and planning practices for integrated land use and transportation planning to create more
15 Nova Scotia Department of Transportation and Public Works. Motor Vehicle Collision Statistics. www.gov.ns.ca/tran/publications/publication.asp Accessed July 2004. 16 Sellon, Gary. Policy Analyst, Nova Scotia Department of Transportation and Public Works. (Personal communication: July, 2004).
GENUINE PROGRESS INDEX xvii Measuring Sustainable Development

accessible land use patterns and a more multi-modal transportation system. Based on HRM’s current planning process, this trend is rated positively here, even though evidence is lacking for the province as a whole.
Trend Rating:
Economic Indicators Economic indicators reflect impacts on economic development, productivity, employment, government and business costs, household budgets, and wealth. Transportation activities impose significant costs on consumers, businesses, and governments. Increasing transportation system efficiency supports economic development by reducing the costs of business and consumption and increasing productivity, employment, and wealth. These impacts can be large. For example, residents of more densely populated, multi-modal communities tend to save hundreds of dollars annually compared with demographically equal households living in more dispersed and automobile-dependent communities.17,18 Such households often incur significant additional expenses by supporting more than one car per household. Transportation Expenditures as a Percentage of Total Household Expenditures in Nova Scotia were consistently the second highest household expense during the period 1998-2002, exceeded only by shelter. Of the top three household expenses, transportation was the only one that rose over this term as a proportion of total expenses, an indication that transportation is becoming less affordable. Households in the three highest income quintiles (i.e. the richest 60% of households) spent a greater proportion of their budgets (close to 25%) on transportation than those in the two lowest income quintiles (the poorest 40%). The lowest quintile spent 14% of household expenses on transport, and the second lowest spent 18%, but all quintiles except the second saw their transportation expenses increase significantly as a percentage of their total household spending (see Figure 7).
Trend Rating:
Public expenditures on alternative transportation modes (walking, cycling, and public transit) are an indicator of transportation equity, as such expenditures ensure basic mobility for people who are transportation disadvantaged, and so that people who rely on these alternative modes receive a fair share of transportation budget expenditures. Government expenditures on public transit are a small portion of total government transportation expenditures. For example, between 1991 and 2002, expenditures on public transit in Nova Scotia ranged between 5.3% and 3.4% of total transportation spending. During this
17 Center for Transit-Oriented Development and the Center for Neighborhood Technology, The Affordability Index: A New Tool for Measuring the True Affordability of a Housing Choice. (Center for Transit-Oriented Development and the Center for Neighborhood Technology, Brookings Institute, 2006) www.brookings.edu/metro/umi/20060127_affindex.pdf 18 Victoria Transport Policy Institute. “Affordability,” Online TDM Encyclopedia, (Victoria Transport Policy Institute, 2006b). www.vtpi.org
GENUINE PROGRESS INDEX xviii Measuring Sustainable Development

period government spending on transit actually declined 24%, and by an even greater amount during the most recent years. The provincial government has provided no funding for transit since 1999. Since then all funding has been provided by municipal governments, resulting in a cycle of increasing fares and declining ridership.
Trend Rating:
Figure 7. Nova Scotia: Transportation Expenditures as a Percentage of Total Household Expenditures, by Income Quintile, 1998-2002.
0.0%
5.0%
10.0%
15.0%
20.0%
25.0%
30.0%
Year
% o
f Tot
al H
ouse
hold
Exp
endi
ture
Sp
ent o
n T
rans
port
atio
n
1 10.2% 10.8% 12.9% 12.0% 13.7%
2 19.8% 15.8% 17.7% 18.0% 17.7%
3 17.6% 19.6% 21.0% 20.7% 24.2%
4 20.7% 20.5% 21.0% 20.2% 23.0%
5 19.2% 20.0% 20.2% 20.2% 24.1%
1998 1999 2000 2001 2002
Source: Statistics Canada. Survey on Household Spending. (1998-2002).
Note: 1 represents the lowest income quintile and 5 is the highest. Summary Nova Scotia’s current rate of per capita motor vehicle travel exceeds what can be considered sustainable due to the various economic, social, and environmental costs that current transportation patterns impose. People sometimes argue that high levels of mobility are sustainable if they use energy efficient or alternative fuel vehicles, and that increased mobility should be supported for the sake of economic development. However, despite the undoubted advantages of energy efficient and alternative fuel vehicles over conventional and inefficient vehicles for a number of environmental reasons, the arguments for increased mobility are not supported by the evidence for the following reasons. First, although more efficient and alternative fuel vehicles help achieve some sustainability objectives, they have neutral or negative effects with regard to others. For example, even “zero emission” vehicles (that produce no tailpipe emissions) impose significant external costs from
GENUINE PROGRESS INDEX xix Measuring Sustainable Development

vehicle and facility construction, traffic congestion, crash damages, noise and water pollution, and the inequity of a transport system that fails to service non-drivers. Increasing vehicle fuel efficiency without correcting other market distortions has been shown to have the unintended effect of increasing vehicle kilometres (since it reduces vehicle operating costs), and thereby exacerbating problems such as congestion, facility costs, and crashes. As long as motor vehicles impose significant external costs, high levels of vehicle travel can be considered unsustainable. Economically excessive motor vehicle travel (defined here as motor vehicle travel that results from market distortions) is harmful rather than beneficial to the economy.19 Mobility can be decoupled from economic development by increasing transportation system efficiency, which has been demonstrated to support economic development far more effectively than increased transportation dependency and motorized travel.20 For example, economic development requires that employees access work and that shoppers purchase goods and services, but not necessarily by automobile. Many employees can commute by alternative modes (walking, cycling, ridesharing, public transit, and telecommuting), and shopping can take place at local stores, by internet, and using ridesharing, allowing economic development without increased vehicle trips. These alternative modes are usually cheaper than driving overall, taking into account all costs to consumers (vehicle expenses, parking, time, risk, etc.), governments (roads and traffic services), businesses (parking facilities), other motorists (congestion delay and accident risk), and the environment (pollution and GHG damages and community liveability). As well, money spent on vehicles and fuel tends to provide far fewer regional jobs and less business activity for provinces like Nova Scotia than most other consumer expenditures, since fuel, vehicles, and parts are almost all imported. So transportation policies that reduce driving and vehicle expenditures are usually economically beneficial and stimulate the local economy. Described differently, the economically optimal level of motorized mobility is what consumers would choose in a truly efficient market that offers multiple transport options (walking, cycling, ridesharing, and public transit services) and prices that accurately reflect the marginal costs of transportation activity (direct charges for using roads and parking, mileage-based insurance and registration, and fees for environmental impacts, fossil fuel energy use, and congestion charges).21 Current transport markets are distorted in various ways that presently increase motor vehicle travel beyond what is economically efficient and sustainable.22 In the past, many transportation professionals considered shifts from alternative modes (walking, cycling, ridesharing, and public transit) to automobile transport to be acceptable and desirable, assuming that the shifts simply reflected consumer preferences. However, a growing body of 19 Victoria Transport Policy Institute. “Economic Development,” Online TDM Encyclopedia. (Victoria Transport Policy Institute, 2006c). www.vtpi.org 20 European Conference of Ministers of Transport, Transport and Economic Development. (Round Table 119, European Conference of Ministers of Transport, February 2001). www.oecd.org/cem/about.htm 21 Victoria Transport Policy Institute. “Market Principles,” Online TDM Encyclopedia, (Victoria Transport Policy Institute, 2006d). www.vtpi.org 22 Litman, Todd. Socially Optimal Transport Prices and Markets. (Victoria Transport Policy Institute, 2006b). www.vtpi.org/opprice.pdf
GENUINE PROGRESS INDEX xx Measuring Sustainable Development

evidence in recent years has caused many experts and individuals to realize that such shifts have in fact often reflected reduced travel options (degradation of walking and cycling conditions, and declining public transit service availability and quality), under-pricing of motor vehicle travel, and more automobile-dependent community design, which in turn stimulates additional driving. Surveys indicate that many people would actually prefer to drive less and to rely more on alternative modes, provided that they offered quality service (convenience, comfort, security, etc.). Sustainable transportation planning requires, among other key considerations, that we evaluate transport efficiency in terms of accessibility (people’s ability to reach desired goods, services, and activities) rather than mobility (physical travel).23 Accessibility is the ultimate goal of most transportation activity, except for the very small portion of travel that has no particular destination. For example, people travel to stores to access goods and services, they commute to access work, and they travel to parks to access recreation activities. High levels of mobility often reflect poor accessibility due to inadequate travel options, dispersed destinations and disconnected road networks. This is indicated by the fact that increased vehicle travel speeds have not reduced the time people devote to travel, nor the frustration many motorists express at the large amount of time and money they devote to motorized travel. In these cases, increased mobility may provide little net benefit to society when it actually reflects reduced accessibility and increased external costs. For example, if motor roadway improvements lead to more automobile-dependent sprawl, people can end up driving more annual kilometres but be no better off overall as a result, when all costs (time, money, congestion, crash risk, environmental quality, the quality of consumer options) are considered. Thus, sprawl frequently reduces or complicates access to goods, services, work, entertainment, and recreational facilities, and makes such access more expensive. This is not to suggest that sustainability requires giving up motorized travel altogether, but it does indicate that high rates of per capita vehicle travel can be considered unsustainable from an accessibility perspective as well as for environmental reasons, particularly if they result from market distortions and impose significant external costs. Described more positively, policies that reduce economically excessive motor vehicle travel by correcting market distortions help increase transport system sustainability. Of course, the actual degree to which motorized travel is unsustainable varies, depending on the type of vehicle, travel conditions, and the value of the vehicle trip. For example, some types of drivers and vehicles are particularly dangerous, polluting, and resource intensive, while driving under urban-peak conditions tends to impose higher infrastructure, congestion, and pollution costs than the same number of kilometres driven under rural or off-peak conditions. Some forms of vehicle travel reflect basic accessibility (they provide access to what is considered to have high value to society such as employment and basic services), while other vehicle travel can be considered a luxury activity, either because the trip purpose is of low value, or because it could easily shift to a more efficient mode, route, or destination. Distinguishing types of vehicle travel
23 Victoria Transport Policy Institute, “Accessibility and Mobility,” Online TDM Encyclopedia, (Victoria Transport Policy Institute, 2006a). www.vtpi.org
GENUINE PROGRESS INDEX xxi Measuring Sustainable Development
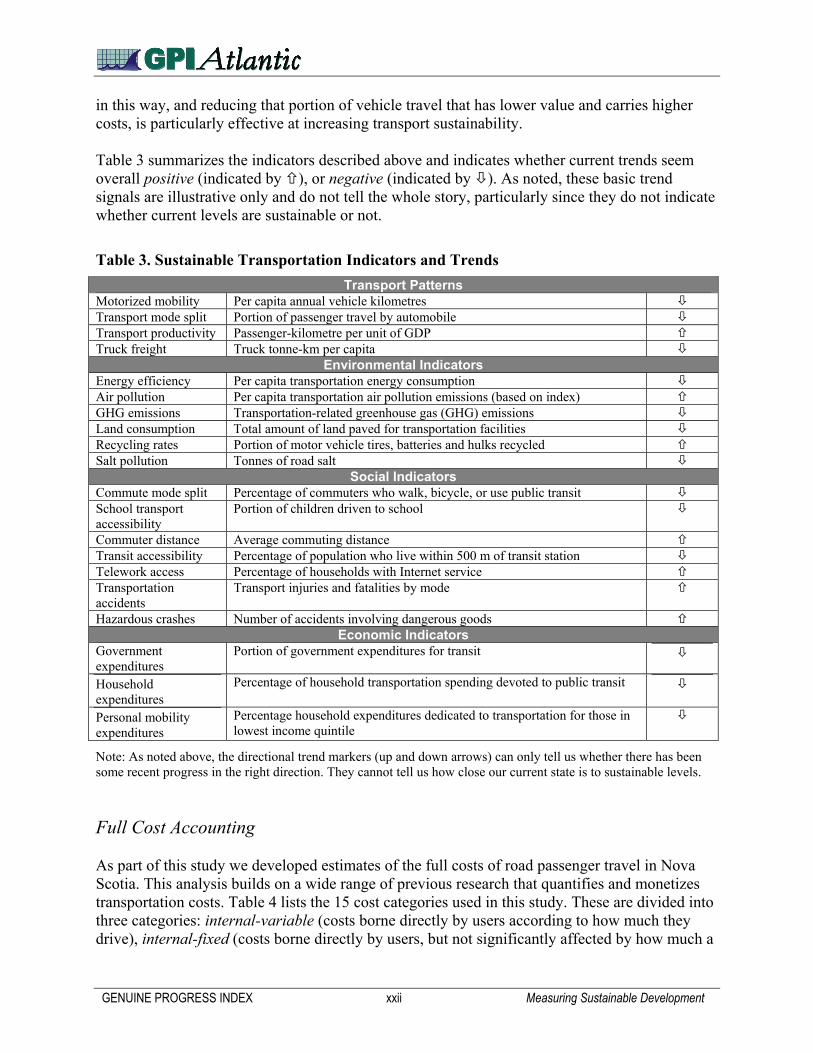
in this way, and reducing that portion of vehicle travel that has lower value and carries higher costs, is particularly effective at increasing transport sustainability. Table 3 summarizes the indicators described above and indicates whether current trends seem overall positive (indicated by ), or negative (indicated by ). As noted, these basic trend signals are illustrative only and do not tell the whole story, particularly since they do not indicate whether current levels are sustainable or not.
Table 3. Sustainable Transportation Indicators and Trends Transport Patterns
Motorized mobility Per capita annual vehicle kilometres Transport mode split Portion of passenger travel by automobile Transport productivity Passenger-kilometre per unit of GDP Truck freight Truck tonne-km per capita
Environmental Indicators Energy efficiency Per capita transportation energy consumption Air pollution Per capita transportation air pollution emissions (based on index) GHG emissions Transportation-related greenhouse gas (GHG) emissions Land consumption Total amount of land paved for transportation facilities Recycling rates Portion of motor vehicle tires, batteries and hulks recycled Salt pollution Tonnes of road salt
Social Indicators Commute mode split Percentage of commuters who walk, bicycle, or use public transit School transport accessibility
Portion of children driven to school
Commuter distance Average commuting distance Transit accessibility Percentage of population who live within 500 m of transit station Telework access Percentage of households with Internet service Transportation accidents
Transport injuries and fatalities by mode
Hazardous crashes Number of accidents involving dangerous goods Economic Indicators
Government expenditures
Portion of government expenditures for transit
Household expenditures
Percentage of household transportation spending devoted to public transit
Personal mobility expenditures
Percentage household expenditures dedicated to transportation for those in lowest income quintile
Note: As noted above, the directional trend markers (up and down arrows) can only tell us whether there has been some recent progress in the right direction. They cannot tell us how close our current state is to sustainable levels. Full Cost Accounting As part of this study we developed estimates of the full costs of road passenger travel in Nova Scotia. This analysis builds on a wide range of previous research that quantifies and monetizes transportation costs. Table 4 lists the 15 cost categories used in this study. These are divided into three categories: internal-variable (costs borne directly by users according to how much they drive), internal-fixed (costs borne directly by users, but not significantly affected by how much a
GENUINE PROGRESS INDEX xxii Measuring Sustainable Development
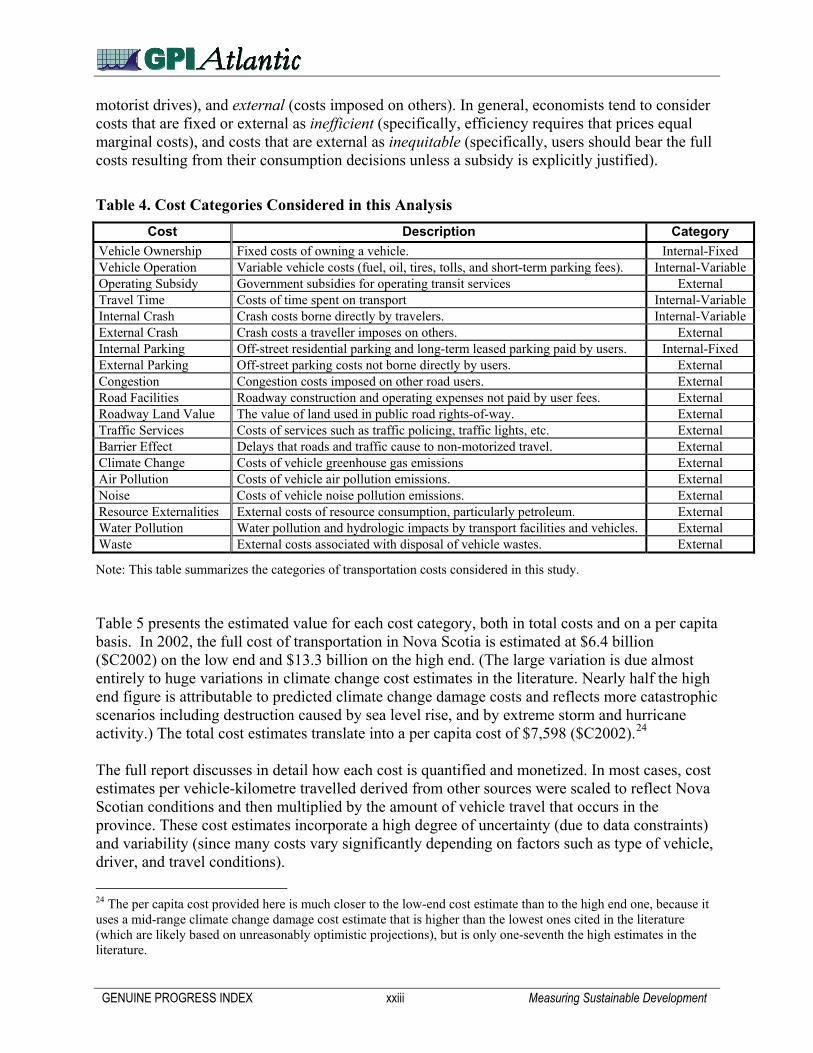
motorist drives), and external (costs imposed on others). In general, economists tend to consider costs that are fixed or external as inefficient (specifically, efficiency requires that prices equal marginal costs), and costs that are external as inequitable (specifically, users should bear the full costs resulting from their consumption decisions unless a subsidy is explicitly justified).
Table 4. Cost Categories Considered in this Analysis Cost Description Category
Vehicle Ownership Fixed costs of owning a vehicle. Internal-Fixed Vehicle Operation Variable vehicle costs (fuel, oil, tires, tolls, and short-term parking fees). Internal-Variable Operating Subsidy Government subsidies for operating transit services External Travel Time Costs of time spent on transport Internal-Variable Internal Crash Crash costs borne directly by travelers. Internal-Variable External Crash Crash costs a traveller imposes on others. External Internal Parking Off-street residential parking and long-term leased parking paid by users. Internal-Fixed External Parking Off-street parking costs not borne directly by users. External Congestion Congestion costs imposed on other road users. External Road Facilities Roadway construction and operating expenses not paid by user fees. External Roadway Land Value The value of land used in public road rights-of-way. External Traffic Services Costs of services such as traffic policing, traffic lights, etc. External Barrier Effect Delays that roads and traffic cause to non-motorized travel. External Climate Change Costs of vehicle greenhouse gas emissions External Air Pollution Costs of vehicle air pollution emissions. External Noise Costs of vehicle noise pollution emissions. External Resource Externalities External costs of resource consumption, particularly petroleum. External Water Pollution Water pollution and hydrologic impacts by transport facilities and vehicles. External Waste External costs associated with disposal of vehicle wastes. External
Note: This table summarizes the categories of transportation costs considered in this study. Table 5 presents the estimated value for each cost category, both in total costs and on a per capita basis. In 2002, the full cost of transportation in Nova Scotia is estimated at $6.4 billion ($C2002) on the low end and $13.3 billion on the high end. (The large variation is due almost entirely to huge variations in climate change cost estimates in the literature. Nearly half the high end figure is attributable to predicted climate change damage costs and reflects more catastrophic scenarios including destruction caused by sea level rise, and by extreme storm and hurricane activity.) The total cost estimates translate into a per capita cost of $7,598 ($C2002).24 The full report discusses in detail how each cost is quantified and monetized. In most cases, cost estimates per vehicle-kilometre travelled derived from other sources were scaled to reflect Nova Scotian conditions and then multiplied by the amount of vehicle travel that occurs in the province. These cost estimates incorporate a high degree of uncertainty (due to data constraints) and variability (since many costs vary significantly depending on factors such as type of vehicle, driver, and travel conditions). 24 The per capita cost provided here is much closer to the low-end cost estimate than to the high end one, because it uses a mid-range climate change damage cost estimate that is higher than the lowest ones cited in the literature (which are likely based on unreasonably optimistic projections), but is only one-seventh the high estimates in the literature.
GENUINE PROGRESS INDEX xxiii Measuring Sustainable Development

However, despite these limitations, these estimates are useful because they do reflect the value of indirect and non-market goods and services and thus indicate the general magnitude of impacts that are often overlooked in conventional economic analysis. Whatever the uncertainties and variabilities, the results provided here are far more accurate and comprehensive than conventional transportation cost estimates that ignore a wide range of real transportation impacts and thus implicitly (and mistakenly) assign such “externalities” a zero value. The accounting framework used here also allows these indirect and non-market impacts to be compared with more conventionally evaluated impacts using a common metric.
Table 5. Per Capita and Total Cost Estimates for Road Passenger Transportation in Nova Scotia ($C2002)
Per Capita Costs Total Costs (million$)
Internal-Variable
Internal-Fixed External Low*** High***
Vehicle Ownership $1,913 $1,788 $3,648 Travel Time $1,236 $1,155 $1,155 Vehicle Operation $1,052 $983 $1,112 Climate Change** $700 $99 $4,672 Internal Crash $695 $650 $650 External Parking $507 $474 $474 Air Pollution** $236 $56 $384 External Crash $347 $325 $325 Internal Parking $220 $206 $206 Resource Externalities $213 $199 $199 Land Value $125 $117 $117 Water Pollution $103 $96 $96 Road Facilities $98 $91 $91 Barrier Effect* $72 $67 $67 Traffic Services $71 $67 $67 Noise $67 $62 $62 Waste $16 $15 $15 Operating Subsidy* $13 $12 $12 Congestion* $13 $12 $12
Per Capita Costs: $2,982 $2,133 $2,483 Total Per Capita Costs: $7,598 Totals: $6,382 $13,273
Notes: *Congestion, Operating Subsidy and the Barrier Effect costs are presented here for illustrative and comparative purposes only. They have been netted out to indicate that they are not included in the totals presented in order to avoid double-counting, since congestion and the barrier effect are actually sub-components of the travel time costs and operating subsidy costs are a part of vehicle ownership costs. **The per capita cost estimates for climate change and air pollution are based on mid-range estimates of their costs, rather than on the low or high cost estimates. These costs also include both road freight costs and road passenger costs since data are not available for passenger vehicles only ***Low and High estimates for climate change and air pollution are calculated by using different costing methods than the other cost categories (these methods are explained in Part V).
Figure 8 illustrates the estimated comparative magnitude of these costs. The largest costs are vehicle ownership and operation, crash costs, and parking. Vehicle ownership and operation,
GENUINE PROGRESS INDEX xxiv Measuring Sustainable Development

and a portion of parking, crash, and roadway costs, are internal, and are paid directly by owners and operators and by user fees (e.g. residential parking costs, insurance, road taxes, and fuel). External costs, such as congestion, air pollution, and roadway land value, tend to be smaller individually, and so are easily overlooked, but they constitute a considerable cumulative cost.
Figure 8. Costs Ranked by Magnitude
$0.00
$0.02
$0.04
$0.06
$0.08
$0.10
$0.12
$0.14
$0.16
$0.18
$0.20
$0.22
Vehicl
e Owners
hip
Crash
Vehicl
e Opera
tion
Parking
Trave
l Tim
e
Climate
Chan
ge
Air Poll
ution
Resource
Extern
alitie
s
Land V
alue
Wate
r Poll
ution
Road Fac
ilities
Traffi
c Serv
ices
Barrie
r Effe
ct
Noise
Wast
e
Conge
stion
2002
Dol
lars
Per
Veh
icle
Kilo
met
re
External CostsInternal FixedInternal Variable
Note: This figure shows average car costs per vehicle-kilometre, ranked by magnitude. When added together, the fixed and external costs of driving are large in total, representing more than two-thirds of all transportation costs, as illustrated in Figure 9. This indicates that transportation markets are distorted, since fixed costs and externalities conceal full transportation impacts that are a function both of actual vehicle usage and of effects on non-market goods and services. This point is even more evident when the costs that are paid directly by Nova Scotians are compared against the “invisible” costs that are paid indirectly (for example, through taxes, higher prices for consumer goods, or through reduced health). Statistics Canada’s household spending data reveal that each Nova Scotian spent an average of $3,036 on road transportation costs in 2002.25 These costs include vehicle ownership and operating costs, transit fares, and out-of-pocket parking expenses. What most Nova Scotians do not realize is that there are an additional $4,562 in indirect costs that are not counted in their conventional transportation expenditures. These costs are either non-market costs, like travel time and climate change costs, or are costs paid through taxes, rent, and 25 Statistics Canada. Spending Patterns in Canada 2003, Catalogue no. 62-202-XIE. 2005. www.statcan.ca/english/freepub/62-202-XIE/0000362-202-XIE.pdf. Based on Table 1.
GENUINE PROGRESS INDEX xxv Measuring Sustainable Development

mortgage and other payments, like road facility expenditures, some taxpayer funded medical costs associated with automobile crashes, and residential off-street parking. In other words, Nova Scotians are only directly paying for about 40% of the full costs of passenger road transportation. When added together, the fixed and external costs of driving are large in total, representing more than two-thirds of all transportation costs, as illustrated in Figure 9. This indicates that transportation markets are distorted, since fixed costs and externalities conceal full transportation impacts that are a function both of actual vehicle usage and of effects on non-market goods and services. In particular, automobile travel is significantly under-priced and, to the degree that these costs are overlooked in economic analysis, policy and planning decisions are skewed to favour automobile transportation improvements. That in turn results in economically excessive automobile travel, excessive automobile-dependency, and reduced transportation options. The more that costs are transferred from the fixed and external categories to the internal variable category, the more distortions will be rectified and removed, and the more users will pay the full costs of the transport modes they choose. That in turn will naturally encourage development of a wider range of more sustainable transportation options.
Figure 9. Average Car Cost Distribution
Internal Variable
39%
External33%
Internal Fixed28%
Note: This figure illustrates the aggregate distribution of costs for an average car. More than two-thirds of total vehicle costs are either External or Internal-Fixed. To give just one example: Failure to charge users for road space and environmental externalities favours truck over rail freight, which increases both environmental impacts and road wear, congestion delay and accident risk that heavy truck traffic imposes on motorists. An earlier GPI Atlantic report on the full-cost accounting of freight traffic on the Halifax-Amherst corridor found that a 10% shift of freight from road to rail would save more than $10 million annually (see Appendix A of the Nova Scotia GPI Greenhouse Gas Accounts at www.gpiatlantic.org).
GENUINE PROGRESS INDEX xxvi Measuring Sustainable Development

The accounting framework used in this report provides a tool for incorporating these generally hidden impacts into policy and planning decisions, and thereby provides guidance in identifying more sustainable transportation options, and reducing total transportation-induced costs to society. Policy Reforms At first glance, the transportation analysis in this study may seem discouraging, because it identifies such a variety of problems and unsustainable trends. However, there is actually a very positive message that emerges from the evidence and particularly from the identification and compilation of full transportation costs. This analysis does indicate that the current transportation system is distorted in various ways that result in economically excessive motor vehicle travel (that is, more motor vehicle travel than would occur in an efficient market), which in turn is harmful in a number of ways. But what this means is that that market reforms which correct existing distortions can provide a wide range of economic, social, and environmental benefits that will enhance wellbeing, produce cost-savings, improve environmental quality, and boost long-term prosperity. For example, improved walking and cycling conditions, improved public transit services, and more efficient pricing can help reduce traffic congestion, road and parking facility costs, consumer costs, accident risk, energy consumption, and pollution emissions, while improving public fitness and health, increasing beneficial economic activity, supporting strategic land use objectives (such as reducing sprawl), and even supporting specific objectives such as urban redevelopment, tourism activities, and heritage preservation. A wide range of tested and proven policy and planning reforms can help provide such benefits. We call them “Win-Win Transportation Solutions” because each intervention achieves multiple benefits across economic, social, and environmental dimensions. They are cost-effective and technically feasible market reforms that help solve transportation problems by increasing consumer options and removing market distortions that encourage inefficient travel behaviour. Although their individual impacts may appear modest, their combined benefits can be substantial. If fully implemented to the degree that is economically justified, Win-Win Solutions can provide very significant total benefits. They are “no regrets” measures that are justified regardless of uncertainties about global warming or other environmental and social impacts. They therefore represent true sustainability strategies, as opposed to strategies that help address one or two planning objectives, but exacerbate other problems by increasing total motor vehicle travel and sprawl. Table 6 lists examples of these strategies in summary form. Each of these options has been described in detail in the literature, with examples of best practices.26
26 Litman, Todd. Win-Win Transportation Solutions: Cooperation for Economic, Social and Environmental Benefits. (Victoria Transport Policy Institute, 2005f). www.vtpi.org
GENUINE PROGRESS INDEX xxvii Measuring Sustainable Development

Table 6. Win-Win Solutions Name Description Transport Impacts
Least-Cost Planning Reforms
More comprehensive and neutral planning and investment practices.
Increases investment and support for alternative modes and mobility management, improving transport options.
Regulatory Reforms Reduced barriers to transportation and land use innovations.
Tends to improve transport options.
Transportation Demand Management Programs
Local and regional programs that support and encourage use of alternative modes.
Increased use of alternative modes.
Commute Trip Reduction (CTR)
Programs by employers to encourage alternative commute options.
Reduces automobile commute travel.
Commuter Financial Incentives
Offers commuters financial incentives for using alternative modes.
Encourages use of alternative commute modes.
Fuel Taxes - Tax Shifting Increases fuel taxes and other vehicle taxes with concomitant reductions in income tax.
Encourages fuel-efficiency, and reduces vehicle fuel consumption and mileage.
Pay-As-You-Drive Pricing
Converts fixed vehicle charges into mileage-based fees.
Reduces vehicle mileage.
Road Pricing Charges users directly for road use, with rates that reflect costs imposed.
Reduces vehicle mileage, particularly under congested conditions.
Parking Management Various strategies that result in more efficient use of parking facilities.
Reduces parking demand and facility costs, and encourages use of alternative modes.
Parking Pricing Charges users directly for parking facility use, often with variable rates; provides cash payments to employees not using parking.
Reduces parking demand and facility costs, and encourages use of alternative modes.
Transit and Rideshare Improvements
Improves transit and rideshare services. Increases transit use, vanpooling and carpooling.
HOV (High Occupancy Vehicle) Lane Priority
Improves transit and rideshare speed and convenience.
Increases transit and rideshare use, particularly in congested conditions.
Walking and Cycling Improvements
Improves walking and cycling conditions. Encourages use of non-motorized modes, and supports transit and smart growth.
Smart Growth Policies More accessible, multi-modal land use development patterns.
Reduces automobile use and trip distances, and increases use of alternative modes.
Location Efficient Housing and Mortgages
Encourage businesses and households to choose more accessible locations.
Reduces automobile use and trip distances, and increases use of alternative modes.
Mobility Management Marketing
Improved information and encouragement for transport options.
Encourages shifts to alternative modes.
Freight Transport Management
Encourage businesses to use more efficient transportation options.
Reduced truck transport.
School and Campus Trip Management
Encourage parents and students to use alternative modes for school commutes.
Reduced driving and increased use of alternative modes by parents and children.
GENUINE PROGRESS INDEX xxviii Measuring Sustainable Development

Car-sharing Vehicle rental services that substitute for private automobile ownership.
Reduced automobile ownership and use.
Traffic Calming and Traffic Management
Roadway designs that reduce vehicle traffic volumes and speeds.
Reduced driving, improved walking and cycling conditions.
Source: Litman, Todd. Win-Win Transportation Solutions: Cooperation for Economic, Social and Environmental Benefits. (Victoria Transport Policy Institute, 2005f). www.vtpi.org
Note: There are various Win-Win Solutions, in addition to those listed here, which encourage more efficient transportation. Because they provide multiple benefits, Win-Win Solutions offer opportunities for cooperation and coordination among various organizations and political interests. For example, developers can support these strategies because they reduce parking costs, social service agencies can support them because they improve affordable mobility for non-drivers, health professionals can support them for their health benefits, and environmentalists can support them because they reduce energy consumption, greenhouse gas and pollution emissions and sprawl. Conclusions and Recommendations This study indicates that many current Nova Scotia transport trends are leading away from sustainability. Per capita vehicle travel, consumer expenditures, energy consumption, greenhouse gas and pollution emissions, land use sprawl, and traffic congestion are all high and either steady or increasing, while transportation options for non-drivers seem to be declining due to transportation and land use trends. The full-cost accounting performed as part of this study shows that Nova Scotians bear far higher transportation costs than is conventionally acknowledged, and that current levels of motor vehicle travel appear to be economically excessive, that is, more than what consumers would choose if they had better travel options and efficient prices. There are also positive trends and opportunities. Changing consumer preferences and planning practices support more sustainable transport and land use patterns. These include urban redevelopment, growing preference by some households for more accessible residential locations, improved walking and cycling conditions, reinvestment in public transit, and various programs like HRM’s new Metrolink service that encourage use of alternative modes. Some communities in various parts of the world have demonstrated that it is possible to improve transportation options, redevelop urban neighbourhoods, increase use of alternative modes, and reduce driving. HRM’s new Municipal Planning Strategy and proposed Transportation Master Plan are intended to move the municipality in this more sustainable direction. On the basis of the indicators, trends, evidence, costing analysis, and concrete examples presented in this report, we have developed practical recommendations for creating more efficient transportation and land use patterns. The evidence clearly indicates that if market distortions are corrected, many consumers would choose to drive less, rely more on alternative
GENUINE PROGRESS INDEX xxix Measuring Sustainable Development

modes, and be better off overall as a result. This reduction in driving would provide a wide variety of economic, social, and environmental benefits. We have identified approximately two dozen specific Win-Win Transportation Solutions, summarized above, which are cost-effective, technically feasible, market reforms that can help solve current transportation problems by increasing consumer options and removing market distortions. We believe that such solutions can provide a strong basis for true sustainable transportation and a practical means of attaining the sustainability objectives outlined in this study.
Improving Evaluation Practices: Through this research we have identified various gaps in data availability and indicator analysis. Improvements in evaluation require better data on: Rail, marine, and air transportation, including:
o Tonne-kilometre o Energy Intensity o Land used for rail, air and marine facilities
(These data are compiled by various agencies, but are not released publicly for confidentiality restrictions).
Water pollution attributable to vehicles, spills, and run-off from roads and parking lots Transportation waste, such as, batteries, oil, and anti-freeze – in particular, the degree
of compliance and proper disposal Land-use patterns and land used for transportation, in particular, up-to-date data on
population density, road density, road lengths, and area used for transportation facilities.
Vehicle travel by mode. Mode split Transportation expenditures by consumers, businesses, and governments The quality of transportation services available, particularly for people who are
GENUINE PROGRESS INDEX xxx Measuring Sustainable Development

BULLETIN Just as this report went to press, the Government of Canada announced a significant investment in Nova Scotia's public transit systems. This investment is directly consonant with one of this report's key recommendations. Following is the press bulletin released on 24 November, 2006: Government of Canada Invests $37.5 million in Transit in Nova Scotia Service Nova Scotia and Municipal Relations November 24, 2006 11:05 Eleven public transit systems in Nova Scotia will be improved thanks to the Government of Canada's investment of $37.5 million. The announcement was made today, Nov. 24, by Peter MacKay, Minister of Foreign Affairs and ACOA, on behalf of Lawrence Cannon, Minister of Transport, Infrastructure and Communities, and Jamie Muir, Minister of Service Nova Scotia and Municipal Relations. These investments towards public transit infrastructure will help reduce traffic congestion and improve air quality, as well as help reduce carbon dioxide and other greenhouse gas emissions. Transit services that will benefit from the federal funding include Metro Transit in Halifax Regional Municipality, Cape Breton Transit, Kings Transit (Kings County and surrounding area), and eight other community transit organizations. Eligible capital investments may include the purchase of buses and accessible transit vehicles, the construction of new terminals and maintenance facilities, and the acquisition of improved computerized systems for transit services. "Reliable and efficient public transit is key to ensuring environmentally sound, vibrant, and healthy communities," said Mr. MacKay. "The Government of Canada recognizes that improving public transit use can help reduce congestion, lower automobile emissions, and make our communities more liveable by supporting their economic, social, and cultural development." "Today's investments will help improve our public transit systems in both urban and rural Nova Scotian communities," said Mr. Muir. "They support healthy, vibrant, sustainable communities, as well as help protect our environment. They also reduce isolation through better access to employment, education, medical services, and community and social events." The funds include more than $11.7 million from the Canada-Nova Scotia Agreement on the Transfer of Federal Public Transit Funds, and $25.8 million to Nova Scotia through the federal Public Transit Capital Trust. Service Nova Scotia and Municipal Relations will administer the distribution of these funds, primarily based on ridership. Public transit providers will likely receive funding before March 31, 2007.
GENUINE PROGRESS INDEX xxxi Measuring Sustainable Development

"We are delighted that the Canadian government is investing in public transit systems throughout Nova Scotia," said Russell Walker, president of the Union of Nova Scotia Municipalities. "Larger transit services, which include HRM, Kings, and CBRM, will be able to provide improved services, and rural communities will be able to enhance accessible services to seniors, persons with disabilities, and the disadvantaged." Through Budget 2006, the Government of Canada has provided $1.3 billion in dedicated funding for public transit across Canada. Nationally, $900 million was provided through the Public Transit Capital Trust and $400 million was committed through the Public Transit Fund.
GENUINE PROGRESS INDEX xxxii Measuring Sustainable Development

IMPORTANT NOTE: HRM CHAPTER FORTHCOMING
Halifax Regional Municipality (HRM) has recently completed its 25 year regional Municipal Planning Strategy (MPS). Although this report includes many references to HRM data and information and also to the new strategy, GPI Atlantic plans to produce an additional chapter, applying the framework, analysis, and methodology in this report to HRM in particular. This new chapter will provide an overview of the regional plan as it relates to transportation, and will assess both the current sustainability of transportation in HRM, and also the potential future impacts of the regional plan on transportation sustainability. In particular, the additional chapter will undertake a full cost accounting analysis of the current cost of driving in HRM that will be helpful to planners in assessing the cost-effectiveness of options proposed in the new Municipal Planning Strategy. We are expecting to release this additional chapter and the revised report in the spring of 2007.
GENUINE PROGRESS INDEX xxxiii Measuring Sustainable Development