measuring success in the global economy: international...
TRANSCRIPT

Measuring success in the global economy: international trade, industrial
upgrading, and business function outsourcing in global value chains
An essay in memory of Sanjaya LallTimothy J. Sturgeon and Gary Gereffi1*
This article contributes to an assessment of the scholarly work of Sanjaya Lall, especially as it relates to improved measures of industrial upgrading and technological learning. We argue for the collection of new statistics, in addition to reworking and linking existing data sets. Changes in the global economy, especially the rise of global value chains (GVCs), have created measurement problems that require not only continued innovation in the use of existing data sources, but also the development and deployment of new measures that analyze GVCs more directly. Specifically, we advocate for the collection of establishment-level economic data according to business functions. Data collected according to a standardized set of generic business functions can provide researchers and policymakers with a better map of the value chain, reveal the roles that domestic establishments, firms, and industries play within GVCs, and offer a unique view of the competitive pressures facing domestic firms and industries.
Keywords: global value chains, international trade, business function outsourcing, industrial upgrading, technological learning
1. IntroductionThis article contributes to an assessment and celebration of the scholarly
and policy work of the late Sanjaya Lall. As Rasiah (2009) highlights, Lall’s work was at once broad, deep and intensely focused. Over his long career, Lall and his many collaborators used the lenses of the transnational corporation (TNC), competitiveness, globalization and technological learning to uncover
* Timothy J. Sturgeon is Senior Research Affiliate at the MIT Industrial Performance Center. Contact: [email protected]. Gary Gereffi,is Director of the Center on Globalization, Governance & Competitiveness at Duke University. Contact: [email protected]. We thank Industry Canada for its support of an early draft of this paper. We would also like to thank Rajah Rasiah for organizing these special issues and for his editorial work. Two anonymous reviewers provided helpful suggestions. We owe Peter Bøegh Nielsen of Statistics Denmark our gratitude for providing us with data from the European Union Survey on International Sourcing, and for his patience and generosity in helping us with its presentation and interpretation. We acknowledge Ursula Huws and Sharon Brown for their path breaking efforts and tireless enthusiasm for the business function approach. Most importantly, we remember the late Sanjaya Lall for his inspiration, warm collegiality and sparkling intelligence.

2 Transnational Corporations, Vol. 18, No. 2 (August 2009)
the determinants of economic change – or lack thereof – in the developing world. There is a clear continuity to this intellectual path, one that reveals Lall’s commitment to empirical investigation, his skepticism of conventional wisdom, his open-mindedness and his sustained focus on improving the lot of those in the world who have less.
During his early career, a time when TNCs were driving rapid economic development in pockets of the developing world, he did not simply celebrate or demonize their presence in host economies, but explored both their positive impact (such as local linkages and technology transfer) and their negative effects (such as crowding out of domestic firms and international transfer pricing). With the organizational fragmentation that came with global outsourcing and the rise of more advanced capabilities in the developing world, Lall added questions related to globalization and technological learning. What is most admirable is that Lall adapted his research and shifted his policy targets as the world economy evolved, while retaining his central focus on the key agents of change and their implications for developing countries. This is the path of a pragmatic, observant and curious mind, guided by a strong moral compass.
The focus of this article is narrower. We assess a single aspect of Lall’s work, his technological classification of exports, and related research utilizing international trade statistics, from the point of view of global value chains (GVCs). We see this work on international trade as useful, but ultimately limiting. While the techniques for estimating the technological content of trade can certainly be further refined by constructing more sophisticated and detailed product-based analyses of trade flows within or across industries, there is an urgent need to enrich existing metrics with additional data resources and measures that allow us to investigate GVCs more directly. In our view, changes in the global economy, and especially the rise of GVCs, have created measurement problems that require new information and new methods. In an effort to be constructive as well as critical, we propose one possible approach: the collection of economic data according to a generic and parsimonious list of business functions.
2. Tracking global shifts: conceptual and measurement issues Among the enduring mysteries of political economy is why
some places surge ahead in the global economy while others grow more slowly or fall behind in relative or even absolute terms. Is it sound macroeconomic policy, the development of human capital, protection
Transnational Corporations, Vol. 18, No. 2 (August 2009) 3
under the geopolitical umbrella of a superpower, sector-specific industrial development policies, natural resource endowments, or some combination that has led to the success of certain countries, especially in East Asia (Deyo, 1987; World Bank, 1993)? There are also debates about the optimal industry structures for technological learning and industrial upgrading. Is a concentrated industrial structure best because large firms can afford to invest in major research and development (R&D) efforts, or are open, flexible networks of small and medium-sized firms better able to identify and fit into the ephemeral niches of a fast changing global economy (Piore and Sabel, 1982; Amsden, 1989; Wade, 1990)? The institutional basis for development has also been a topic of much debate (Evans, 1995; Berger and Dore, 1996; Hall and Soskice, 2001).
For Sanjaya Lall and many others (e.g. Kimura, 2007), learning is the key to industrial upgrading. For places that are behind, learning must, at least in part, come from absorbing knowledge created elsewhere. Many mechanisms for this have been examined, from arm’s-length technological “borrowing” (Amsden, 1989) through a range of practices that encompass technology licensing, reverse engineering, the injection of equipment and know-how through foreign direct investment, and firm-level adaptation to demands made by both foreign affiliates and overseas buyers (Gereffi, 1994; Feenstra and Hamilton, 2006).
Answers to these questions are complex, and debates about what shapes economic development outcomes will certainly continue. However, we are now at a critical juncture where rising complexity in the global economy has begun to overwhelm the slow and partial analytical progress that has been made in the past 25 years. Recent examples, such as how firms based in the United States, Japan, the Republic of Korea, and Taiwan Province of China interact with each other and with local firms to produce Apple iPods in southern China for export to world markets (Linden et al., 2007), illustrate both the intricacies of economic globalization and the limits of existing data. In this setting, some of the core assumptions of mainstream economics – that demand begets supply, that nations draw mainly on their own knowledge and physical resources to compete with other nations, that exports reflect the industrial capabilities of the exporter, that firms and individuals act independently, rationally and at arm’s-length, and so on – appear, if not as gross distortions, then as quaint reminders of simpler times. But if the tools of mainstream economics are being blunted by global integration, so too are those offered by other social science disciplines, which typically assume levels of institutional and cultural cohesiveness and economic autarky that no longer exist.

4 Transnational Corporations, Vol. 18, No. 2 (August 2009)
For us, the GVC framework provides a useful guide as we seek answers to questions about the dynamic political economy of industries.1 GVC analysis highlights three basic characteristics of any industry: 1) the geography and character of linkages between tasks, or stages, in the chain of value added activities; 2) how power is distributed and exerted among firms and other actors in the chain; and 3) the role that institutions play in structuring business relationships and industrial location. These elements help explain how industries and places evolve, and offer clues about possible changes in the future. The chain metaphor is purposely simplistic. It focuses on the location of work and the linkages between tasks as a single product or service makes its way from conception to end use.
The analysis of GVCs identifies new actors in the global economy (e.g. global buyers and global suppliers) and shows how their emergence alters the ways that industries are organized and governed across borders (Gereffi, 2005). Recent theorizing about the governance of GVCs highlights three key determinants that affect the organization and power dynamics within GVCs (complexity, codifiability and supplier competence), and characterizes three distinct business network forms (modular, relational and captive) that lie between the classic duality of arm’s-length markets and hierarchies (i.e. vertically integrated firms) (Gereffi et al., 2005). The GVC governance types were derived from direct field observation in a variety of global industries, including footwear and apparel (Gereffi, 1999; Schmitz, 1999; Bair and Gereffi, 2001), horticulture (Dolan and Humphrey, 2000), bicycles (Galvin and Morkel, 2001), electronics (Borrus et al., 2000; Lee and Chen, 2000; Sturgeon, 2002), and motor vehicles (Humphrey, 2003; Sturgeon and Florida, 2004).
Qualitative industry research and conceptual theory-building of this sort have been extremely helpful in developing the framework, in identifying emerging trends in GVCs, and in providing researchers and policymakers with a vocabulary to discuss some of their key features without getting bogged down in industry-specific nomenclature. The framework has been used, challenged and extended in recent research on industries such as tourism (Barham et al., 2007), electronics (Vind and Fold, 2007), textiles and apparel (Evgeniev, 2008), motor vehicles (Sturgeon et al., 2008), and coffee and tea (Neilson and Pritchard, 2009), and in regions such as Latin America (Pietrobelli and Rabellotti, 2007) and East Asia (Kawakami and Sturgeon, forthcoming).
1 See www.globalvaluechains.org for more detail on this approach and a list of publications and researchers that directly engage with it.

Transnational Corporations, Vol. 18, No. 2 (August 2009) 5
A major impediment to using qualitative research and conceptual theories to support specific policy interventions is the lack of comparable and detailed data on the industrial capabilities of firms, industries, and countries and the roles that they play in the global economy. The GVC framework provides a conceptual toolbox, but quantitative measures are lacking. While the development of objective, industry-neutral measures of GVC governance is a laudable goal, and survey questions are currently being fielded to collect data on the governance character of inter-firm linkages in both cross-border and domestic sourcing relationships,2 better information to characterize the roles of firms, regions and countries in GVCs is urgently needed.
In this article, we examine the state of the art in GVC metrics and chart a way forward. First, we summarize some of the best recent academic research that has used official statistics to examine issues related to GVCs and industrial upgrading, including Lall’s (2000) technological classification of exports, Feenstra and Hamilton’s (2007) trade-data archeology, research on intermediate goods trade, and efforts to enrich trade data by linking it to “micro-data” underlying national statistics and policy programmes. We then point to what is perhaps the most glaring data gap of all: the appallingly poor level of product detail in international services trade.
While the research we review provides useful insights into the dynamics of GVCs, and helps to identify some of the key drivers of industrial upgrading, we are left with a dilemma. The rise in intermediate goods trade strongly suggests that countries no longer rely only or even primarily on domestic resources to develop and export products to the rest of the world. Countries and regions do not make products and deliver services in their entirety, but have come to specialize in specific functions within larger regional and global value chains. Surging trade in services complicates the picture. As a result, industrial output and trade statistics provide a very partial and even misleading view of where value is created and captured in the global economy.
Even the best trade statistics, as they currently exist, can only hint at what is happening in GVCs and how this sort of “integrative trade” (Maule, 2006) is shaping development outcomes. If key GVC-related questions are not asked on any official survey and do not exist
2 Specifically, Statistics Canada, in an international sourcing survey currently being tested, asks firms if relationships with important suppliers are simple market relationships or something more complex, and if transactions involve the exchange of codified or tacit information.

6 Transnational Corporations, Vol. 18, No. 2 (August 2009)
on any administrative form, then existing data resources can never yield adequate results. Thus, there is an urgent need to collect new information. To illustrate, we present a new business function classification scheme that is currently being developed and deployed by statistical agencies and academic researchers in North America and Europe in the hope that it will soon be standardized and adopted more broadly.3
3. What trade statistics can reveal about global value chainsData on international trade in physical goods and commodities
are available in considerable detail online in the United Nations Statistical Division’s Commodity Trade Statistics Database (known as UN COMTRADE). The database contains import and export statistics reported by the statistical authorities of nearly 200 countries, from 1962 to the most recent year, currently 2006 to 2008, depending on the country.4 Because these data are collected from many different national statistical agencies, they vary in quality and coverage. Nevertheless, the UN COMTRADE database provides information on imports and exports by value and in some cases by the number of units or volume shipped, according to seven different product (commodity) lists, the most detailed being the 2002 Harmonized Tariffs Code list, which at the six-digit level includes more than 8,000 product descriptions.5
The fine-grained product detail and the ease of access to COMTRADE data have allowed researchers to create alternatives to the industry classification schemes that its commodity lists are based on. While industries are an important and often relevant category, they typically contain products that are very heterogeneous in terms of labour or capital intensity, technological content, and so on. This section examines three distinct approaches to analyzing trade data that shed light distinct aspects of GVC development and industrial upgrading. The first is Sanjaya Lall’s (2000) classification of technological sophistication, which groups products based on their technological requirements. Increases in “high technology” exports suggest that learning and industrial upgrading is taking place in the exporting country. Second is the trade-data archaeology approach developed by Feenstra and
3 See, for example, the National Science Foundation funded Project, “A National Survey of Organizations to Study Globalization, Innovation and Employment.” http://www.nsf.gov/awardsearch/showAward.do?AwardNumber=0926746&version=noscript.
4 See http://unstats.un.org/unsd/comtrade/.5 The United States data, published by the Department of Commerce, is available
at the ten-digit HTC level, and it includes more than 16,000 product descriptions.

Transnational Corporations, Vol. 18, No. 2 (August 2009) 7
Hamilton (2006), which tracks highly detailed export flows from the Republic of Korea and Taiwan Province of China to the United States over long periods of time. This approach reveals that specific products, rather than broad industries, have been key to upgrading in these countries (e.g. microwave ovens from the Republic of Korea, not white goods in general; computer monitors from Taiwan Province of China, not electronics in general). Feenstra and Hamilton also tie these exports of narrow product categories to the strategies of United States retailers and marketers to show how buyer-driven GVCs have influenced development outcomes in East Asia. The third is work on the relationship between GVCs and intermediate goods trade. Increases in intermediate goods trade signals the geographic fragmentation of the production process driven, we argue, by the increasing importance of GVCs in international trade.
3.1 Upgrading as learning: Sanjaya Lall’s technological classification of exports
Gereffi (2005, p. 171) defines industrial upgrading as “the process by which economic actors – nations, firms and workers – move from low-value to relatively high-value activities in global production networks”. Lall et al. (2005) share this view, and start with a reasonable assumption, that the learning required to export high value added, technology-intensive products will be greater than for simpler products. Even if the knowledge embedded in imported intermediate inputs and machinery and know-how from foreign affiliates and global buyers is invisible in export statistics, as it typically is, we can at least assume that technology-intensive exports heighten the potential for rapid learning by local actors.
To examine the path of technological learning in the global economy using export statistics, Lall (2000) devised a technological classification of goods exports. To provide an example of how we can assess industrial upgrading for export-oriented economies, we examine shifts in the technology content of China’s and Mexico’s exports over time. Following Lall (2000), we divide each country’s exports into five product groupings, which are listed in ascending levels of technological content: primary products, resource-based manufactures, and low-, medium-, and high-technology manufactures (see table 1).6 The main
6 Sanjaya Lall (2000) developed this technological classification of exports based on 3-digit Standard International Trade Classification (SITC) categories. His article provides the detailed list of products under each category.

8 Transnational Corporations, Vol. 18, No. 2 (August 2009)
contributing industries to each category (agro-forest products, textile and apparel, automotive, and electronics) are broken out to simplify the analysis.
Table 1. Lall’s technological classification of exports
Classification Examples
Primary products (PP) Fresh fruit, meat, rice, cocoa, tea, coffee, wood, coal, crude petroleum, gas
Manufactured products
Simple Manufac-tures
RB: Resource-based manufactures
RB1: Agro/forest based products Prepared meats/fruits, beverages, wood products, vegetable oils
RB2: Other resource based products Ore concentrates, petroleum/rubber products, cement, cut gems, glass
LT: Low-technology manufactures
LT1: Textile/fashion cluster Textile fabrics, clothing, headgear, footwear, leather manufactures, travel goods
LT2: Other low-technology Pottery, simple metal parts/structures, furniture, jewellery, toys, plastic products
Complex Manufac-tures
MT: Medium-technology manufactures
MT1: Automotive productsMT2: Medium-technology process industries
Passenger vehicles and parts, commercial vehicles, motorcycles and partsSynthetic fibres, chemicals and paints, fertilizers, plastics, iron, pipes/tubes
MT3: Medium-technology engineering industries
Engines, motors, industrial machinery, pumps, switchgear, ships, watches
HT: High-technology manufactures
HT1: Electronics and electrical products
Office/data processing/telecommunications equipment, TVs, transistors, turbines, power-generating equipment
HT2: Other high-technology Pharmaceuticals, aircraft, optical/measuring instruments, cameras
Other transactions Electric current, cinema film, printed matter, special transactions, gold, works of art, coins, pets
Source: Lall (2000, p. 341).
In figure 1, panel 1, we see that in 1988, 45 per cent of Mexico’s total exports to the United States market were primary products, the most important of which was oil. In 1993, one year prior to the establishment of the North America Free Trade Agreement (NAFTA), medium-technology manufactures (mainly automotive products) and high-tech manufactures (largely electronics items) moved ahead of raw materials in Mexico’s export mix. By 2008, over 60 per cent of Mexico’s exports of $234 billion to the United States market were in the medium- and high-technology product categories, followed by primary products with 20 per cent of all exports (which rebounded from their nadir of 10 per cent of total exports in 2001) and low-technology manufactures (such

Transnational Corporations, Vol. 18, No. 2 (August 2009) 9
as textiles, apparel, and footwear). Thus, in just two decades, Mexico’s export structure was transformed from one based on raw materials to one dominated by medium- and high-technology manufactured items.
Figure 1. Technological composition of Mexico’s and China’s exports to the United States, 1988–2008
Panel 1: Technological composition of Mexico’s cxports to the United States
Panel 2: Technological composition of China’s exports to the United States
Source: UN COMTRADE (http://comtrade.un.org/db/dqBasicQuery.aspx).
TotalexportsUS$ bn
%Ex
port
mar
ket
23422321218416714513813614712010293806652433719181613
0
10
20
30
40
50
60
70
1988 1990 1992 1994 1996 1998 2000 2002 2004 2006 2008
Primary products
Resource-based manufactures
Low-tech manufactures
Medium-tech manufactures
High-tech manufactures
TotalexportsUS$ bn
%Ex
port
mar
ket
3 4 5 6 9 17 21 25 27 33 38 42 52 54 70 93 125 163 204 233 253
0
10
20
30
40
50
60
70
1988 1990 1992 1994 1996 1998 2000 2002 2004 2006 2008
Primary products
Resource-based manufacturesLow-tech manufactures
Medium-tech manufactures
High-tech manufactures

10 Transnational Corporations, Vol. 18, No. 2 (August 2009)
In figure 1, panel 2, we see the composition of China’s exports to the United States market during the 1988–2008 period. Unlike Mexico, the leading product category in China’s exports to the United States market in 1988 was low-technology manufactured goods. These were primarily made up of a wide variety of light consumer goods – apparel, footwear, toys, sporting goods, house wares, and so on. These products accounted for about two thirds of China’s overall exports to the United States in the early 1990s. By 2008, however, high-technology exports had increased to 35 per cent of China’s total exports to the United States market, and were virtually tied with low-technology exports for the top spot in China’s export mix.
Thus, Mexico and China have had a number of commonalities in their export trajectories to the United States market during the past two decades. Both are diversified economies, with a range of export product types. In both cases, manufactured exports are more important than primary product or resource-based exports; within manufacturing, high- and medium-technology exports are displacing low-technology goods. While these export data have limitations as indicators of industrial upgrading, as we will discuss below, both economies appear to be increasing the technological sophistication of their exports.
3.2 Trade-data archaeology
Feenstra and Hamilton (2006) utilize highly disaggregated international trade statistics to shed new light on the debate surrounding the origins of the “East Asian miracle”. Conventional explanations of East Asia’s economic success, beginning with Japan in the 1950s and 1960s, and including the Republic of Korea, Taiwan Province of China, Hong Kong (China) and Singapore in the 1970s and 1980s, revolve around the role of markets and states in promoting export-oriented industrialization in this region. The World Bank and neoclassical economists have favoured the market-friendly explanation, which focuses on the solid macroeconomic fundamentals in the early East Asian industrializers (World Bank, 1993), while other scholars have highlighted the directive role of the state in promoting this transition (Amsden, 1989; Wade, 1990; Evans, 1995). Feenstra and Hamilton offer a contending demand-side perspective to account for the sustained export success of the Republic of Korea and Taiwan Province of China, which ties their performance to the retail revolution and the rise of “big buyers” in the United States (see also Gereffi, 1999).
Using what they call “trade-data archaeology”, Feenstra and Hamilton recreate the export trajectories of the Republic of Korea and
Transnational Corporations, Vol. 18, No. 2 (August 2009) 11
Taiwan Province of China, not merely at the level of industries, but by tracing the flow of very specific products over several decades from the early 1970s to the present. This approach reveals that the Republic of Korea’s and Taiwan Province of China’s dramatic export success was actually concentrated in a handful of product categories, such as garments, footwear, bicycles, toys, televisions, microwave ovens, computers and office products. The analysis shows that although exports from Taiwan Province of China and the Republic of Korea were in the same industries, they specialized in different kinds of products within these industries: the Republic of Korea’s large vertically integrated chaebol firms emphasized mass-produced, standardized items, while Taiwan Province of China excelled in making a wide variety of more specialized products that fitted the capabilities of the smaller firms that dominate the island’s diversified economy.
The authors go beyond standard supply-side accounts of East Asia’s export success, by showing precisely how these exports were linked to the “retail revolution” in the United States, where retailers (such as Sears, JC Penney, Kmart and Wal-Mart) and companies with global brands (such as Nike, Liz Claiborne, Disney and many others) set up international sourcing networks to tap and expand the global supply base. It was the dynamics within GVCs, as much as any supply-side market or state-society characteristics, that fuelled the export-oriented development model that has been promoted by the World Bank and a variety of international development agencies since the 1980s. The fact that both the Republic of Korea and Taiwan Province of China developed these “demand-responsive” economies has important theoretical implications for economic sociology and international trade theories alike (Hamilton and Gereffi, 2008).
3.3 Examining intermediate goods trade
Merchandise trade has increased dramatically since the 1970s, far surpassing pre-World War I peaks in most OECD countries. Feenstra (1998) notes a sectoral shift in United States imports away from agricultural products and raw materials and towards capital and technology-intensive goods. Explanations include trade liberalization, falling transportation costs, and equalization of gross domestic products (GDPs) among trading countries, given the tendency for countries of similar size to trade more than countries of disproportionate size. Of course, there are many other possible explanations for these shifts, including rising production skills and better capital stock in poor countries, and speedier transportation, which opens up trade for perishable goods

12 Transnational Corporations, Vol. 18, No. 2 (August 2009)
such as fresh vegetables as well as for goods with very volatile prices, such as computer memory.
The rise of GVCs is not only enabled by these factors, but is itself a cause of trade increases. As Feenstra (1998, p. 36) argues, the geographic fragmentation of production causes increases in the volume of total trade because intermediate inputs may cross borders several times before final products are delivered to end users. Thus, the trade content of an average product rises when it is made in the context of GVCs.
The fact that intermediate goods trade is rising much faster than overall trade has stimulated a vast body of research and multiple labels, including a new international division of labour (Fröbel et al., 1980), multistage production (Dixit and Grossman, 1982), slicing up the value chain (Krugman, 1995), the disintegration of production (Feenstra, 1998), fragmentation (Arndt and Kierzkowski, 2001), vertical specialization (Hummels et al., 2001), global production sharing (Yeats, 2001), offshore outsourcing (Doh, 2005), and integrative trade (Maule, 2006). Sturgeon and Memedovic (forthcoming), using the United Nations’ broad economic categories of consumption, capital, and intermediate goods, calculate that global trade in intermediate goods has far outpaced these other categories (figure 2). This rise is most dramatic after 1988, when the developing world was linked more systematically in GVCs. Developing countries’ share of global intermediate good imports rose from 5.2 per cent to 29.6 per cent from 1988 to 2006, while their share of intermediate goods exports increased even more dramatically, from 3.9 per cent to 31.7 per cent.
Figure 2. Intermediate, capital, and final goods trade, 1962–2006 (Millions of constant United States dollars)
Source: Sturgeon and Memedovic (forthcoming).
0
1 000
2 000
3 000
4 000
5 000
6 000
Capital goodsConsumption goodsIntermediate goods
1962 1967 1972 1977 1982 1987 1992 1997 2002 2007
Transnational Corporations, Vol. 18, No. 2 (August 2009) 13
While soaring intermediate goods trade is a strong indicator of the rise of GVCs, their growing dominance of world trade can lead to odd and confusing metrics. For example, because Malaysia imported so many intermediate goods for inclusion in exports, its ratio of exported goods and services to GDP in 2005 reached 123.4 per cent (World Development Indicators, 2007). Such ratios are not uncommon in classic entrepôt economies such as Singapore, and Hong Kong (China), and as a comparative measure of trade integration this is fine, but upon seeing such statistics without reference to GVCs, one has to wonder how a country can export more than it produces.
Clearly, the global economy is changing. Rising intermediate goods trade means that goods are flowing, increasingly, within the same industry. Research on intra-industry trade (Grubel and Lloyd, 1975; Lloyd and Lee, 2002) has shown steady increases of about 4–5 per cent per year in countries trading the same or seemingly similar products. This challenged the central tenet of Ricardian trade theory: country specialization according to factor-based comparative advantage that would lead only to inter-industry trade. Finger (1975) claimed that coarse industry classifications disguised vast heterogeneity within industries; in other words, countries could specialize within the same industry, especially in intermediate inputs versus final goods.
For Krugman (1991), intra-industry trade is driven by firms seeking increasing returns from large-scale production, thereby generating exports, while consumer demand for product variety stimulates imports of very similar products. Although this work was based on horizontal differentiation (of similar products), the quality ladder growth models from Grossman-Helpman (1991), which are formally very similar to Krugman’s model, have a vertical dimension that includes intermediate goods. Others have tested and refined these theories in the context of East Asia’s economic rise (Ng and Yeats, 1999) and provided evidence of increasing “vertical” specialization in intermediate inputs (Hummels et al., 2001). Using updated statistics, Brülhart argues that, “since the 1990s, [the increase in intra-industry trade] appears to be driven to a significant extent by the international fragmentation of vertical production chains” (Brülhart, 2008, abstract).
Our argument is that trade statistics can only hint at the changes occurring in the global economy. Trade statistics alone contain very partial information about the location of value added, and no information about ownership of productive assets and output, where profits are reaped, or how these increasingly complex systems are coordinated. Certainly,
14 Transnational Corporations, Vol. 18, No. 2 (August 2009)
work will continue on the causes and meaning of inter-industry trade. But there are limits to what can be learned from trade statistics alone.
4. Using administrative and micro-data resources to understand global value chains Linking trade statistics to other datasets can enhance their
usefulness. Through careful matching, or by taking advantage of especially rich administrative data,7 researchers can sometimes push beyond the limitations of published statistics. A host of government programs collect detailed economic data. Typically more detailed “micro-data” underlie what is ultimately made available to the public. While these data are usually confidential, researchers who gain security clearance and have their proposals accepted by data collection agencies can gain access, as along as government personnel screen the results before the research is published. Some micro-data sets have also been assembled by data agencies and released, with confidential information removed, as public-use files. Over the past decade, a burgeoning body of research has relied on government-collected micro-data. In this section, we provide a few examples.
Feenstra and Hanson (2004, 2005) take advantage of administrative data from China and from Hong Kong (China) to reveal new information about the workings of GVCs. Specifically, the data contain re-export values for Hong Kong (China), and information about factory and input ownership in China. These data allow the authors to estimate the mark-up charged by Hong Kong-based GVC “intermediaries” such as Li and Fung, a trading company. The authors also use these data to calculate the share of China’s exports to Hong Kong (China) that are re-exported (45.4 per cent in 1998), an indicator of the important coordination role that companies like Li and Fung play in GVCs, especially in apparel and other consumer goods industries. By taking advantage of data that describe the ownership of factories exporting from China, the authors are able to show that independent suppliers working under “export processing” arrangements (i.e. suppliers that are provided with inputs by intermediaries and their customers) are much more likely to send goods through Hong Kong (China) for re-export than exporting factories that are wholly owned by non-Chinese firms.
Feenstra and Spencer (2005) use the same Chinese data, from 1998 through 2000, to explore the relationship between outsourcing
7 Governments collect data for the purpose of administering their programmes such as tax collection, compliance with environmental protection laws, and the like. For this reason, such data are typically referred to as “administrative data”.
Transnational Corporations, Vol. 18, No. 2 (August 2009) 15
arrangements (arm’s-length vs. contractual) and the proximity of suppliers (onshore vs. offshore) and find that relationships vary according to the technological sophistication of the product being outsourced. The more technologically sophisticated the product, the more likely it is that firms will source from affiliates or outsource to suppliers located nearby. Dani Rodrick and his collaborators (Haussman et al., 2006) use these data to show that the basket of goods exported by China is of higher technological content than would be predicted by its GDP per capita (using averages for all other countries’ export mixes).
By linking these same data to Chinese input-output data, Dean, Fung and Wang (2007) estimate that China’s “vertical specialization”, that is, the use of imported intermediate inputs in exported goods, increased between 1997 and 2002 in most industries. This is the opposite of what one would expect. Instead of engaging in progressive import substitution as domestic capabilities rise, as most theories of development predict, China increased its reliance on imported intermediates as exports increased. Here we see that, because of the intricacies of production and trade networks within GVCs, we cannot assume deterministic causal linkages between export-led industrialization, the technological content of exports, and industrial upgrading.
Researchers have creatively used micro-data to explore specific questions related to GVCs. For example, Bernard et al. (2005) link administrative data from United States Census mailing lists8 to the universe of import and export transactions for 1993–2000, revealing a detailed picture of the characteristics of firms that do and do not trade. Harrison and McMillan (2006) and others have used the parent and foreign affiliate micro-data from the Bureau of Economic Analysis surveys on TNCs to examine the relationship between affiliate activity and United States employment. Swenson (2005) has examined the permanency of offshore assembly arrangements using extremely detailed data from United States International Trade Commission (USITC) reports. Kletzer (2002) has used micro-data from the Displaced Worker Survey to explore the experiences of workers displaced from manufacturing industries associated with increased foreign competition, and has made policy recommendations based on her findings.
8 We are referring here to the United States Census Bureau’s Business Register, which is the sampling frame used for the Economic Census. The data included are business name, address, a unique establishment-level identifier, industry, employment, and the identity of the firm that owns the enterprise. Data about ownership allows the enterprises in the Business Register to be aggregated to the firm level. Jarmin and Miranda (2002) have assembled the Business Register into a time-series for 1976–2002, referred to as the Longitudinal Business Database (LBD).

16 Transnational Corporations, Vol. 18, No. 2 (August 2009)
Administrative micro-data from public surveys and linked data sets can enrich our view of how domestic firms engage with the global economy. Micro-data collected from TNCs, for example, when combined with data on international trade, can provide new information about the cross-border activities of TNCs and how they use local resources in offshore locations. Such approaches can be difficult to replicate and extend, however, because not all researchers can access confidential micro-data, and because the painstaking work of cleaning and matching raw micro-data files can be very difficult for other researchers to understand and replicate. Furthermore, unique administrative data sets tend to be available only for individual countries, and data collected in support of specific policy initiatives are commonly phased out after the programmes they were intended to support come to an end. As a result, studies based on micro-data can have limited scope with regard to multiple countries and longer-term trends.
5. What trade statistics hideThe easy availability and richness of UN COMTRADE data has
led to their wide use among researchers and policymakers. However, we need to keep in mind what trade statistics do not tell us, and even what they might obscure. First, trade data contain no actual information about the process by which products are made. Certain production processes, such as semiconductor wafer fabrication, involve the manipulation of items so small, or require tolerances so exact, that they have moved beyond the limits of human dexterity and must always be carried out by machines. Other processes, such as sewing, have so far resisted automation and can only be done by hand. But for a very wide range of products and processes, the labour content of production is variable. The degree of labour or capital intensity used in production is, in many instances, a strategic managerial choice rather than an intrinsic characteristic of the product. Thus, we cannot rigidly associate technological content or capital requirements with most specific categories or classes of products. Industries are even poorer indicators of technological sophistication.
Furthermore, the technological content of high-technology exports may be embodied in imported components, subsystems, or production equipment. The highest value added elements of high-technology exports from developing countries are often produced in a third country. Even if these “high-tech” inputs are produced locally, and final assembly processes are truly technology-intensive, they may be carried out by foreign-owned and operated firms with few meaningful linkages to the local economy. With rising wages, worker militancy, political friction or even a prolonged natural disaster, such footloose firms might easily

Transnational Corporations, Vol. 18, No. 2 (August 2009) 17
pack up and move elsewhere. Thus, trade statistics run a real risk of over-stating the technological competence of exporters, and especially of local firms.
Even when production is carried out by local firms and is truly technology-intensive, the reality of GVCs is that the innovative work of product conception, design, marketing and supply-chain management may well continue to be conducted outside of the exporting country. These “intangible assets” cannot be measured by current international trade statistics. The value of imports plus the intangible assets held by the most powerful firms in GVCs, such as lead firms with global brands, suppliers with platform leadership (Gawer and Cusumano, 2002) and large retailers, can be extremely high.
For example, Linden et al. (2007) estimate that only $4 of the $299 retail price of an Apple 30 gigabyte video iPod MP3 player is captured in China, where they are assembled and tested by the contract manufacturers based in Taiwan Province of China, Hon Hai (also known as Foxconn), Asustek and Inventec. This is, in part, because iPods are assembled from components made mostly in other countries, such as the United States, Japan and the Republic of Korea. But more importantly, it is because Apple, which conducts high-level design work and software development in-house, and orchestrates the product’s development, production, marketing and distribution, is estimated to capture $80 of the sale price. This study also estimates that $83 is captured in the United States by Apple’s technology suppliers and by retailers. Clearly, assigning the $183 per unit wholesale price of exported iPods (as would be reported in trade statistics) to the Chinese economy misrepresents where value is created in the global economy. Concluding that Chinese firms have the capability to develop and market products such as the iPod, simply because the country is the source of exports, would also be a mistake.
5.1 A glaring data gap: services trade
The easy availability and richness of UN COMTRADE data has tilted research on international trade towards the goods sector. While this work has contributed greatly to our understanding of international trade and its impacts on various national economies and industries, the lack of similar detail or global coverage on international trade in services has created a significant knowledge gap. In the case of the United States, the Bureau of Economic Analysis collects import and export data for only 17 service product categories (see table 2). Statistics Canada collects

18 Transnational Corporations, Vol. 18, No. 2 (August 2009)
only 28, and the OECD, which relies on member countries for data, publishes only 11. Contrast the poor detail in traded services with detail on goods in the COMTRADE database (8,000 product codes) and the magnitude of the data gap becomes clear.
Because of this data gap, we lack the basic knowledge about services trade needed to even glimpse trends in industrial upgrading driven by services. The paucity of detail in services means that we have no information about what is happening in the service product categories that have been mentioned as moving “offshore” from developed to developing countries, including back-office functions such as accounting, customer support, R&D and software programming.
Why are the data resources related to services so poor? One reason is that the data are difficult to collect. While companies might track the source of every physical input to manufacturing, for warranty or quality control purposes, services expenditures are typically grouped into very coarse categories, such as “purchased services”. The absence of tariffs on services, and their non-physical character, means that when service work moves across borders, no customs forms are filled out and no such data are generated. Another reason is that service work has historically been thought to consist of non-routine activities that require face-to-face contact between producers and users. Services as different as haircuts and legal advice have traditionally been consumed, in place, as soon as they are produced. The customized and ephemeral nature of many services has led them to be considered “non-tradable” by economists or at least very “sticky” in a geographic sense relative to the production of tangible goods. Finally, services have long been viewed as ancillary to manufacturing, either as direct inputs (e.g. transportation) or as services provided to people who worked in manufacturing (e.g. residential construction, retail sales etc.). As such, services have been viewed as a by-product, not a source, of economic growth. Thus, data collection on services has been given a low priority by statistical agencies.
Nevertheless, services trade is burgeoning, both domestically and internationally. Computerization is allowing a growing range of service tasks to be standardized, fragmented, codified, modularized, and more readily and cheaply transported between producers and consumers who might be at a great distance. As in goods production, the application of information technology to the provision of services allows some degree of customization within the rubric of high-volume production, or what Pine and Davis (1999) call “mass customization”. With computerization and inexpensive data storage, the second defining feature of services, that they cannot be stored, has also become less true than in the past. With

Transnational Corporations, Vol. 18, No. 2 (August 2009) 19
deregulation, business process outsoucing, and the rise of the Internet, services have become the focus of intense international competition and rampant innovation. Clearly, the assumptions behind current data regimes have changed and statistical systems must catch up.
Table 2. The seventeen product categories collected by the United States Bureau of Economic Analysis for traded services
Travel, passenger fares, and other transportation services (1)
Royalties and licence fees (2)
Education (3)
Financial services (4) Insurance services (5) Telecommunications services (6)
Business, professional, and technical servicesComputer and information servicesComputer and data processing services (7)Database and other information services (8)
Management and consulting services (9)
Research, development and testing services (10)
Construction, architectural, engineering services (11) Industrial engineering services (12)
Operational leasing services (13)
Installation, maintenance, and equipment repair services (14)
Advertising services (15) Legal services (16)
Other business, professional, and technical services (17)
Source: United States Bureau of Economic Analysis.
Recent progress has been made in the context of NAFTA. In the spring of 2006, the United States Census Bureau, in collaboration with its counterpart agencies in Canada and Mexico, completed the development of 99 detailed product lists that identify and define the significant products of about 370 service industries. Work to date on the North American Product Code System (NAPCS) has focused on the products made by service industries in 12 two-digit industry sectors (48–49 through 81). In all, more than 3,500 individual service products have been defined so far. The NAPCS product definitions are extremely detailed in terms of what they do, and in many cases do not, include. This level of detail, if fully deployed, would go a long way toward filling the data gap in services trade.9
To sum up, data resources are falling behind economic realities. Innovative work to create new classification schemes from disaggregated datasets, to mine “micro-data” from government surveys and administrative records (as well as from private sources), and to combine and match data to create new data resources, is breaking new ground and providing important insights. A few of the most severe data gaps could eventually be filled. However, more needs to be done to collect
9 For more information on NAPCS, see http://www.census.gov/eos/www/napcs/napcs.htm.
20 Transnational Corporations, Vol. 18, No. 2 (August 2009)
data specifically designed to provide insights into the characteristics and effects of GVCs. Work of this sort is proceeding along multiple fronts, including the surveys that test the GVC governance framework developed by Gereffi et al. (2005) and the quantification of value capture in specific GVCs (Linden at al., 2007). Equally important is the ongoing stream of detailed field-based research on the functioning of GVCs in particular industries and places (e.g. Kawakami and Sturgeon, forthcoming). In the next section, we propose another approach: the collection of a broad range of economic data, such as employment, sourcing locations and job characteristics according to an exclusive, exhaustive, parsimonious and generic list of business functions.
6. Collecting new data on business functionsVertical fragmentation and the growth of integrative trade – the
very stuff of GVCs – has served to expand the arena of competition beyond final products to the vertical business function slices that can be offered (horizontally, to diverse customers) as generic goods and services within and across industries. This dynamic has raised the performance requirements for firms and workers that may have been insulated from global competition in the past. Workers, almost regardless of their role, can suddenly find themselves in competition with a range of consultants, vendors, suppliers, contractors and affiliates from places both far and near. Global value chains raise, among other things, the possibility that entire societies can become highly specialized in specific sets of business functions, while others fail to develop or atrophy. Development paths that include heavy GVC engagement can have positive or negative consequences for wealth creation, employment, innovation, firm autonomy, social welfare and economic development (Whittaker et al., forthcoming). Despite their growing importance as discrete realms of value creation, competition and industry evolution, we currently have no standard method for collecting data about business functions.
While there are a host of business functions that have long been disembodied from specific industries (e.g. from janitorial to IT to manufacturing services), qualitative research has shown that managers often experiment with a wide variety of “make” or “buy” choices and onshore or offshore sourcing (Berger et al., 2005). Decisions about how to bundle and unbundle, combine and recombine, and locate and relocate business functions have become a central preoccupation of strategic decision-making. Because industry classification schemes typically describe only the main output or process of the firm, and input-output statistics refer only to those products that the firm buys or sells, existing enterprise and establishment-level data resources are not well suited to

Transnational Corporations, Vol. 18, No. 2 (August 2009) 21
capturing the dynamics of business function bundling or revealing the spatial and organizational patterns that result.
In our view, this data gap will become more important over time as the capabilities that reside in the domestic and global supply bases continue to rise, increasing the potential for fragmenting, outsourcing and relocating a wide variety of business functions. A standardized list of exclusive and generic business functions is needed. An exclusive list will have no overlap between categories and will account for all of the functions of the firm. A generic list will be equally applicable to all firms and organizations, regardless of industry. The list should be extremely parsimonious at first, with detail collected only after the main categories have stabilized through field testing. While this is a difficult and time-consuming prospect, work to develop business function lists, and deploy them in surveys, is well underway.
6.1 Developing, deploying and refining business function lists: a brief history
To our knowledge, the earliest use of a business function list to collect economic data was for the EMERGENCE Project (Huws and Dahlman, 2004) funded by the European Commission. This research used a less-than-generic list of seven business functions tailored to collect information about the outsourcing of information technology-related functions, such as software development and data processing. Industry-specific bias in business function lists can simplify data collection and focus research on specific questions, but the results cannot be easily compared to or aggregated with other data, and they increase the risk of creating non-exhaustive lists. When business function lists are non-exhaustive, they leave some functions unexamined and block our view of how specific business functions contribute to the total employment or output of a firm. Business function lists should seek to include the full range of activities that all establishments must either do in-house or have done by others, regardless of industry.
In his 1985 book, Competitive Advantage, Michael Porter published a list of nine generic business functions: R&D, design, production, marketing and sales, distribution, customer service, firm infrastructure, human resources, and technology development. A list similar to Porter’s was developed for the European Union (EU) Survey on International Sourcing (Neilsen, 2008) and adopted by Statistics Canada for the Survey of Changing Business Practices in the Global Economy. This list, while not industry-specific in any way, was not fully exhaustive because it included an “other functions” category. Such
22 Transnational Corporations, Vol. 18, No. 2 (August 2009)
categories are useful as checks on the exhaustiveness of the list used, but researchers should then combine them with an exiting category or, if needed, define a new, exclusive category, rather than accepting an undefined category of data.
Firms, especially at the establishment level, typically have a main output, be it a product or service. The main operational function that produces this output is associated with the firm’s standardized industrial code. Instead of counting all output and employment under this classification, as business censuses typically do, business function lists can be used to measure economic activity (e.g. employment, occupational mix, wages paid etc.) in other functions as well. In business function frameworks, this main productive function has been designated variously as “production” (Porter, 1985), the “core function” (Neilsen, 2008), and “operations” (Brown, 2008). In contrast, the EMRGENCE project list (Huws and Dahlman, 2004) and a more recent list developed by the Offshoring Research Network for the purpose of detecting R&D offshoring (Lewin et al., 2009) did not include a category for the firm’s main operational function, but instead used a list of commonly outsourced functions (product development, IT services, back office functions, call centres etc.). A business function list cannot be considered exhaustive unless it includes a category that captures the main productive function of the firm, a function that can be partially or even completely outsourced.
The United States Bureau of Labor Statistics’ (BLS) Mass Layoff Statistics (MLS) Program has developed a list to collect data on business functions fulfilled by workers who have been separated in large-scale layoffs in the United States (Brown, 2008). In the 2007 MLS survey of establishments, respondents were asked a question about the primary and secondary roles, or “business functions”, performed by laid-off workers. According to Brown (2008, p. 56), “ ‘Do not know’ responses to the business function question remained low [less than 6%], indicating that the correct person is being reached for the interview and that most respondents in fact think in terms of business functions”. In other words, the BLS found business function data to be highly collectable because company officials appear to recognize the business function concept. A tabulation of respondents’ literal responses generated a very long, non-exclusive list of business functions that were then coded by BLS personnel to create detailed, mutually exclusive categories. This list was further coded to nine higher-level business functions (named “business processes” in the MLS), similar to the Porter list. It is the bottom-up methodology used by the BLS – beginning with literal responses rather

Transnational Corporations, Vol. 18, No. 2 (August 2009) 23
than using a list that researchers develop subjectively or iteratively with industry informants – along with its exhaustive, exclusive, and generic character, that gives us a high level of confidence in the BLS list.
6.2 A proposed list of business functions
The growing use of business function lists in survey research suggests a need to delve within the firm to observe the details of organizational design, organizational change, outsourcing and industrial location. Clearly, new realities are spurring researchers to develop these new metrics. In our view, the sooner a business function classification scheme can be standardized and broadly deployed, the better.
Table 3 presents a proposed list of 12 business functions, along with their definitions. The list adds four business functions to the 2007 BLS MLS list. First, there is a function called “strategic management”. This reflects the common separation of the command, control and strategy-setting activities of top management from more mundane managerial
Table 3. Twelve generic business functions and their definitionsBusiness function Definitions
Strategic management1) Activities that support the setting of product strategy (i.e. deciding what “new product development” works on), choosing when and where to make new investments and acquisitions, or sales of parts of the business, and choosing key business partners (e.g. suppliers and service providers).
Product or service 2) development
Activities associated with bringing a new product or service to market, including research, marketing analysis, design and engineering.
Marketing, sales and account 3) management
Activities to inform buyers, including promotion, advertising, telemarketing, selling, retail management.
Intermediate input and 4) materials production
The fabrication or transformation of materials and codification of information to render them suitable for use in operations
Procurement5) Activities associated with choosing and acquiring purchased inputs
Operations (industry code)6) Activities that transform inputs into final outputs, either goods or services. This includes the detailed management of such operations. (In most cases, operations will equate with the industry code of the establishment or the activity most directly associated with the industry code.)
Transportation, logistics and 7) distribution
Activities associated with transporting and storing inputs, and storing and transporting finished products to customers.
General management and 8) corporate governance
Activities associated with the administration of the organization, including legal, finance, public affairs, government relations, accounting, and general management.
Human resource management9) Activities associated with the recruiting, hiring, training, compensating and dismissing of personnel.
Technology and process 10) development
Activities related to maintenance, automation, design/redesign of equipment, hardware, software, procedures and technical knowledge.
Firm infrastructure (e.g. 11) building maintenance and IT systems)
Activities related to building maintenance, and ITC systems
Customer and after-sales 12) service
Support services to customers after purchase of good or service, including training, helpdesks, customer support for guarantees and warranties.
Source: Adapted from the United States Bureau of Labor Statistics, Mass Layoff Statistics Program.

24 Transnational Corporations, Vol. 18, No. 2 (August 2009)
functions that can sometimes be located offshore and/or carried out in supplier firms. The most recent BLS MLS surveys distinguish strategic management from a set of “general management” functions. Second, because they typically occur at nearly opposite ends of the value chain, procurement has been separated from distribution, transportation and logistics. Third, our list breaks out “intermediate input and materials production” from operations. This is meant to capture the very common practice of externally sourcing physical parts or blocks of services for inclusion in larger products and systems. In the BLS MLS list, intermediate input production is considered part of operations. Fourth, because they contain very different activities, firm infrastructure has been broken out from general management (and corporate governance). Despite these differences, the lists are compatible, since the functions in Table 3 can be combined to match the BLS MLS list.
6.3 Collecting data on the geography of business functions
Although business function data can be used to inform other research questions, as the BLS’ Mass Layoff Statistics Program does in identifying the functional role of laid-off workers, our main interest in using it is to identify patterns of business function bundling (i.e. organizational design) and the locational characteristics of outsourcing and offshoring. Because business functions can be bundled and located differently, we can identify four non-exclusive quadrants for any given function: 1) domestic in-house; 2) domestic outsourced; 3) offshore in-house (i.e. the MNC affiliate); and 4) offshore outsourced. However, it is important that business function surveys that seek to capture data on global engagement be designed not only to capture all four, but also the ways that firms combine them. Firms can, and typically do, combine internal and external sourcing of specific business functions. For example, some intermediate inputs may be produced in-house while others are outsourced. Operations may be outsourced, but only when internal capacity is fully utilized. Firms might combine internal and external sourcing for strategic reasons (Bradach and Eccles, 1989).
The same can be said of location. Managers can decide to locate business functions in proximate or distant locations, in high- or low-cost locations, near customers, suppliers, specialized labour markets, and so on, but most typically, they combine these approaches and motives. This is why detailed information about the location of business functions is of great interest. Surveys that identify sourcing locations and either domestic or international are not very helpful. Outsourcing from the

Transnational Corporations, Vol. 18, No. 2 (August 2009) 25
United States to Germany, for example, will likely involve different functions and have very different and motivations and implications than outsourcing from the United States to China. But even on the domestic front, outsourcing to a vendor in the same city is very different from outsourcing to a supplier located in a distant, rural location.
The surveys on international sourcing fielded by Eurostat, Statistics Canada and the Offshoring Research Network collect no data on domestic locations and use predetermined lists of geographic locations to identify countries of great interest (e.g. India, China), but combine others into vast, amorphous groupings (e.g. “other Asia”). It is better, in our view, to ask respondents to provide geographic information according to city and country. In this way, a single question can begin to identify, with great precision, both domestic and international patterns of outsourcing and offshoring. Geographic aggregations can be made after the fact, and detailed locational coordinates can allow the use of geographic information system (GIS) software to create and examine a host of potentially important variables (e.g. clustering, distances, travel times, prevailing labour market conditions).
Data collected according to business function can provide researchers and policymakers with a rough map of the value chain; reveal the roles that domestic establishments, firms and industries play within GVCs; and offer a unique view of the competitive pressures facing domestic firms and industries. Over time, it will be possible to develop a hierarchy of business functions to provide information about business functions in greater detail, but in the shorter term, a parsimonious, high-level list can provide important information, such as an at-a-glance perspective on how enterprises bundle value chain functions, and a benchmark for how this is changing. As metrics for the key variables of GVC governance and the five GVC governance modes described earlier are developed, they can be used to characterize the internal and external linkages between specific business functions, testing our assumptions about the relationships between GVC governance and the “offshorability” and location of work. Nationally representative surveys can begin to characterize business function gaps and specializations in specific countries, while international surveys can develop comparisons between trading partners. When combined with existing data on employment, occupations, wages, worker career paths, firm performance, e-commerce, trade etc., new data on business functions will open up important new avenues for research and policy analysis.

26 Transnational Corporations, Vol. 18, No. 2 (August 2009)
6.4 A new European survey on business functions
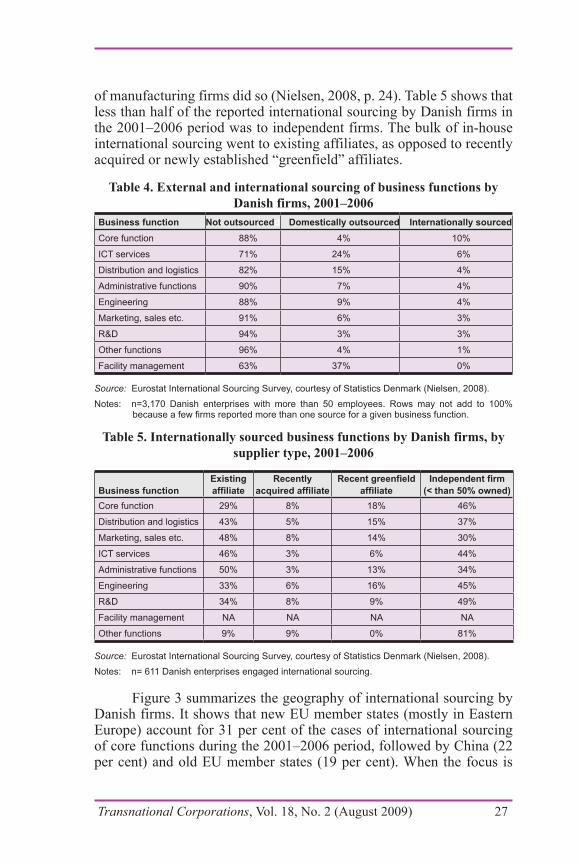
To provide an example of the usefulness of business function data, we present some preliminary data from the EU Survey on International Sourcing. So far, the survey has been administered in 14 out of 27 European Union (EU) member states and 60,000 responses have been collected, but only the data from four Nordic countries have been tabulated (see Nielsen, 2008 for details). Figure 3 and tables 4 and 5 overleaf show the results from Denmark, where the survey was carried out as a census for all 3,170 private sector non-agricultural enterprises with 50 or more employees.10 Because a few of the core questions were mandatory, the response rate for this group of establishments was 97 per cent. The questions about business functions on this survey were straightforward: Were business functions outsourced domestically or internationally in the 2001-2006 period (table 4), and if so, what kind of business partner was used (table 5), and (from a predetermined list) where were internationally sourced functions located (figure 3).
The data in table 4 show that Danish firms sourced the majority of business functions in-house. About 88 per cent were not engaged in international sourcing of any kind. Facilities management was the most commonly outsourced function (37 per cent), but because vendors provide these services on-site, the source was invariably domestic. The business function that was sourced internationally the most frequently was the “core” function (10 per cent of all firms), analogous to “operations” in table 3, followed by information technology and communications (ITC) services. Twenty-nine percent of the 1,567 functions reported as internationally sourced were core functions, followed by ITC services (16 per cent), distribution and logistics functions (13 per cent), engineering functions (11 per cent), administrative functions (10 per cent), marketing and sales functions (10 per cent), and research and development functions (9 per cent).
These data support anecdotal evidence that international sourcing is most advanced in manufacturing (a “core” function for goods- producing firms). This assumption gains further support when firms reporting their core function as manufacturing are compared to service-producing firms. Only 28 per cent of service-producing firms in Denmark reported international sourcing of their core function, while 70 per cent
10 The survey was also administered to 1,968 smaller Danish manufacturing and business services firms. For simplicity’s sake, these data are not presented in this paper. In general, they show similar patterns, but slightly less domestic and international outsourcing across business functions than the sample of larger firms.
Transnational Corporations, Vol. 18, No. 2 (August 2009) 27
of manufacturing firms did so (Nielsen, 2008, p. 24). Table 5 shows that less than half of the reported international sourcing by Danish firms in the 2001–2006 period was to independent firms. The bulk of in-house international sourcing went to existing affiliates, as opposed to recently acquired or newly established “greenfield” affiliates.
Table 4. External and international sourcing of business functions by Danish firms, 2001–2006
Business function Not outsourcedd Domestically outsourced Internationally sourced Core function 88% 4% 10%
ICT services 71% 24% 6%
Distribution and logistics 82% 15% 4%
Administrative functions 90% 7% 4%
Engineering 88% 9% 4%
Marketing, sales etc. 91% 6% 3%
R&D 94% 3% 3%
Other functions 96% 4% 1%
Facility management 63% 37% 0%
Source: Eurostat International Sourcing Survey, courtesy of Statistics Denmark (Nielsen, 2008).Notes: n=3,170 Danish enterprises with more than 50 employees. Rows may not add to 100%
because a few firms reported more than one source for a given business function.
Table 5. Internationally sourced business functions by Danish firms, by supplier type, 2001–2006
Business functionExisting affiliate
Recently acquired affiliate
Recent greenfield affiliate
Independent firm (< than 50% owned)
Core function 29% 8% 18% 46%
Distribution and logistics 43% 5% 15% 37%
Marketing, sales etc. 48% 8% 14% 30%
ICT services 46% 3% 6% 44%
Administrative functions 50% 3% 13% 34%
Engineering 33% 6% 16% 45%
R&D 34% 8% 9% 49%
Facility management NA NA NA NA
Other functions 9% 9% 0% 81%
Source: Eurostat International Sourcing Survey, courtesy of Statistics Denmark (Nielsen, 2008).Notes: n= 611 Danish enterprises engaged international sourcing.
Figure 3 summarizes the geography of international sourcing by Danish firms. It shows that new EU member states (mostly in Eastern Europe) account for 31 per cent of the cases of international sourcing of core functions during the 2001–2006 period, followed by China (22 per cent) and old EU member states (19 per cent). When the focus is

28 Transnational Corporations, Vol. 18, No. 2 (August 2009)
shifted to ITC services, the importance of the new member states falls to only 8 per cent, while old member states account for 57 per cent of the cases of international sourcing. India, a country typically identified as a destination for ITC outsourcing in the popular press and in qualitative research, is identified as a source country in 12 per cent of the cases of ITC sourcing, in comparison with only 5 per cent of the international sourcing cases for core functions. International outsourcing of R&D and engineering functions is also concentrated in Western Europe (42 per cent) with China (9 per cent) and “other Asian” countries (8 per cent) playing a larger role than in ITC services. Interestingly, the role of India in R&D outsourcing is very small. The combined shares of marketing, distribution and administrative functions show a more balanced pattern across locations.
The results presented here are largely unsurprising. They confirm both qualitative GVC research and, to some extent, popular perceptions. Of the business functions that are sourced outside of Denmark, 30% to 50% are outsourced to independent suppliers, a substantial but not dominant share. Existing affiliates provide most of the in-house international sourcing, but international acquisitions and the establishment of new “greenfield” facilities are not unheard of. Core functions, mostly manufacturing, are the most commonly outsourced and offshored, followed by ITC services. Functions based on tacit and local knowledge, such as marketing and sales, engineering, and R&D are less likely to be internationally outsourced or offshored. Most international sourcing by Danish firms is within Europe, but China is a popular location for sourcing core functions (mainly manufacturing). While India is more likely to be a source location for ITC service functions (12 per cent of cases) than for core functions (5 per cent of cases), it is notable that the majority (57 per cent) of instances of international ITC services sourcing are to the original 12 member states of the EU.
While it is important to have our impressions confirmed, the greater value of these data is that they establish a baseline for future research. Is the practice of outsourcing to independent suppliers becoming more prevalent? Will India grow as a location for ITC sourcing at the expense of old European Union member states? Will the outsourcing of engineering and R&D functions grow, and if so, where? Will service-producing firms increase the outsourcing and offshoring of core functions (operations)? If these are trends, then how quickly will they progress? Will Eastern Europe lose out to East Asia? These are some of the most pressing policy questions of the day. When and if new rounds of business function data are collected, we will be in a much better position to provide answers.

Transnational Corporations, Vol. 18, No. 2 (August 2009) 29
What the Eurostat international sourcing survey did not collect was employment and wage data according to business function. Such data would begin to quantify the importance of specific business functions within firms, industries and countries, and provide a benchmark for comparison with other countries that could reveal patterns of organizational design and national specialization within GVCs. It is our hope that future surveys will collect these data. One way could be to code census data that reveal performance metrics such as sales, employment and payroll according to a business function framework.
Figure 3. International sourcing of business function by Danish firms, 2001–2006
Source: Eurostat International Sourcing Survey, courtesy of Statistics Denmark (Nielson, 2008).Notes: Other is Latin and South America plus Africa. Other Europe is Switzerland, Norway, Turkey,
the Russian Federation, Belarus, Ukraine and the Balkan states. n=611 Danish enterprises engaged international sourcing
7. Conclusions
In the mosaic of value chain specialization and intermediate goods flows that underlie the most recent trends in global integration, ownership and capability development cannot so easily be linked to the
Core function
China22%
Other Asian10%
Other European7%
India5%
United Statesand Canada
4%
EU 15 (oldmember States)
19%
EU 12 (newmember States)
31%
Other2%
ITC services
Other Asian5%
Other European9%
EU 12 (newmember States)
8%United Statesand Canada
4%
Other1%
India12%
China4%
EU 15 (oldmember States)
57%
R&D and engineering functions
Other European6%
Other Asian8%
EU 15 (oldmember States)
46%
China9%
India5%
Other3%
United Statesand Canada
5% EU 12 (newmember States)
18%
Marketing distribution and administrative functions
Other European9% Other Asian
9%
EU 15 (oldmember States)
30%
China5%
India12%
Other2%
United Statesand Canada
22%
EU 12 (newmember States)
11%
30 Transnational Corporations, Vol. 18, No. 2 (August 2009)
domestic context, even if we allow that it is based in part on “borrowed” technology. The implications for policy are far-reaching. How can workers, firms and industries be provided with the best environment for engaging with the global economy? How can we be sure that enough wealth, employment, and innovative capacity are generated at home as global integration proceeds? How much national specialization – and by extension, interdependence with other societies – is too much? These are open questions. Even if policymakers seek few direct interventions in the areas of trade, industrial or innovation policy, global integration can make the process of economic adjustment more difficult because it accelerates the pace of change.
Because the picture of global integration provided by current official statistics is incomplete, the causal links to economic welfare indicators such as employment and wages tend be weak and unconvincing. New thinking is required to develop useful insights into the character and implications of our increasingly globally integrated national economies. Perhaps the most pressing need is for new kinds of data to be collected, data that shed light on the position of domestic firms, establishments and workers in GVCs. As a partial solution to this data gap, we advocate the collection of establishment-level economic data according to a standardized set of generic business functions. We share with Lall the desire to move beyond given industry and product classifications, and to create broad analytical frameworks and data collection tools to examine aspects of global integration that cut across specific industries and countries. The GVC framework, the business function scheme, and Lall’s technological classification of exports are all attempts to create intellectual tools and data classification schemes of exactly this sort.
ReferencesAmsden, A.H. (1989). Asia’s Next Giant: South Korea and Late Industrialization, New
York: Oxford University Press.
Arndt, S. and H. Kierzkowski (eds.) (2001). Fragmentation: New Production Patterns in the World Economy, Oxford: Oxford University Press.
Bair, J. and G. Gereffi (2001). “Local clusters in global chains: the causes and consequences of export dynamism in Torreon’s blue jeans industry”, World Development, 29(11), pp. 1885-1903.
Barham, N., S. Dörry and E.W. Schamp (2007). “Relational governance and regional upgrading in global value chains – the case of package tourism in Jordan”, Die Erde, 138(2), pp. 169-186.

Transnational Corporations, Vol. 18, No. 2 (August 2009) 31
Berger, S. and R. Dore (eds.) (1996). National Diversity and Global Capitalism, Ithaca, New York: Cornell University Press.
Berger, S. and the MIT Industrial Performance Center (2005). How We Compete, New York: Doubleday.
Bernard, A.B., J.B. Jensen and P.K. Schott (2005). “Importers, exporters and multinationals: a portrait of firms in the U.S. that trade goods”, NBER Working Paper, 11404.
Borrus, M., D. Ernst and S. Haggard (eds.) (2000). International Production Networks in Asia, Routledge: London and New York.
Bradach, J. and Eccles, R. (1989). “Price, authority, and trust: From ideal types to plural forms”, Annual Review of Sociology, 15, pp. 97-118.
Brown, S. (2008). “Business processes and business functions; a new way of looking at employment”, Monthly Labor Review, December, pp. 51-70.
Brülhart, M. (2008). “An account of inter-industry trade, 1962-2006”, Research Paper Series in Globalization, Productivity, and Technology, 2008/08, Leverhulme Centre for Research on Globalization and Economic Policy: University of Nottingham.
Dean, J.M., K.C. Fung and Z. Wang (2007). “Measuring the vertical specialization in Chinese trade”, United States International Trade Commission, Office of Economics Working Paper, No. 2007-01-A.
Deyo, F.C. (ed.) (1987). The Political Economy of the New Asian Industrialism, Ithaca and London: Cornell University Press.
Doh, J. (2005). “Offshore outsourcing: implications for international business and strategic management theory and practice”, Journal of Management Studies, 42(3), pp. 695-704.
Dolan, C. and J. Humphrey (2000). “Governance and trade in fresh vegetables: the impact of UK supermarkets on the African horticulture industry”, Journal of Development Studies, 37(2), pp. 147-176.
Evans, P. (1995). Embedded Autonomy: States and Industrial Transformation, Princeton, New Jersey: Princeton University Press.
Evgeniev, E. (2008). Industrial and Firm Upgrading in the European Periphery: The Textile and Clothing Industry in Turkey and Bulgaria, Bulgaria: Professor Marin Drinov Academic Publishing House.
Feenstra, R. (1998). “Integration of trade and disintegration of production in the global economy”, Journal of Economic Perspectives, 12(4), pp. 31-50.
Feenstra, R. and G. Hansen (2004). “Intermediaries in entrepôt trade: Hong Kong re-exports of Chinese goods”, Journal of Economics and Management Strategy, 13(1), pp. 3-35.
Feenstra, R. and G. Hansen (2005). “Ownership and control in outsourcing to China: estimating the property-rights theory of the firm”, Quarterly Journal of Economics, 120, pp. 729-761.

32 Transnational Corporations, Vol. 18, No. 2 (August 2009)
Feenstra, R.C. and G.H. Hamilton (2006). Emergent Economies, Divergent Paths: Economic Organization and International Trade in South Korea and Taiwan, Cambridge, United Kingdom: Cambridge University Press.
Feenstra, R.C., and B. J. Spencer (2005). “Contractual versus generic outsourcing: the role of proximity”, NBER Working Paper, 11885.
Finger, J. (1975). “Trade overlap and intra-industry trade”, Economic Inquiry, 13(4), pp. 581–89.
Fröbel, F., J. Heinrichs and O. Kreye (1980). The New International Division of Labour, Cambridge: Cambridge University Press.
Galvin, P. and A. Morkel (2001). “The effect of product modularity on industry structure: the case of the world bicycle industry”, Industry and Innovation, 8(1), pp. 31–47.
Gereffi, G. (1994). “The organization of buyer-driven global commodity chains: how U.S. retailers shape overseas production networks”, pp. 95–122 in G. Gereffi and M. Korzeniewicz, eds., Commodity Chains and Global Capitalism. Westport, Connecticut: Praeger.
Gereffi, G. (1996). “Commodity chains and regional divisions of labour in East Asia”, Journal of Asian Business, 12(1), pp. 75-112.
Gereffi, G. (1999). “International trade and industrial upgrading in the apparel commodity chain”, Journal of International Economics, 48(1), pp. 37–70.
Gereffi, G. (2005). “The global economy: organization, governance, and development”, pp. 160–182 in N.J. Smelser and R. Swedberg (eds.), The Handbook of Economic Sociology, second ed. Princeton, New Jersey: Princeton University Press and Russell Sage Foundation.
Gereffi, G., J. Humphrey, and T. Sturgeon (2005). “The governance of global value chains”, Review of International Political Economy, 12(1), pp. 78–104.
Gower, A. and M. Cusumano (2002). Platform Leadership: How Intel, Microsoft, and Cisco Drive Industry Innovation, Cambridge, Massachusetts: Harvard Business School Press.
Grossman, G. M. and Helpman, E. (1991). “Quality Ladders in the Theory of Growth”, The Review of Economic Studies, 58: pp. 53–61.
Hall, P.A. and D. Soskice (eds.) (2001). Varieties of Capitalism: The Institutional Foundations of Comparative Advantage, Oxford: Oxford University Press.
Hamilton, G.H. and G. Gereffi (2008). “Global commodity chains, market makers, and the rise of demand-responsive economies”, in J. Bair (ed.), Frontiers of Commodity Chain Research. Palo Alto, California: Stanford University Press.
Harrison, A.E. and M.S. McMillan (2006). “Outsourcing jobs? Multinationals and U.S. employment”, NBER Working Paper, 12372.
Hausmann, R., J. Hwang and D. Rodrik (2006). “What you export matters”, Center for International Development, Harvard University, Working Paper, No. 123, December 2005 (revised March 2006).

Transnational Corporations, Vol. 18, No. 2 (August 2009) 33
Head, K.,J. Ries and B. Spencer (2004). “Vertical networks and US auto parts exports: is Japan different?” Journal of Economics and Management Strategy, 13(1), pp. 37–67.
Hummels, D., J. Ishii, and K.-M. Yi (2001). “The Nature and Growth of Vertical Specialization in World Trade”, Journal of International Economics, 54(1), pp. 75–96.
Humphrey, J. (2003). “Globalization and supply chain networks: The auto industry in Brazil and India”, Global Networks, 3(2), pp. 121–141.
Huws, U. and S. Dahlmann (2004). “Outsourcing of ICT and related services in the EU: a status report”, European Foundation for the Improvement of Living and Working Conditions. Luxembourg: Office for Official Publications of the European Communities. www.eurofound.europa.eu/emcc/publications/2004/ef04137en.pdf.
Jarmin, R.S. and J. Miranda (2002). “The longitudinal business database”, US Census Bureau Working Paper, July 16. http://ideas.repec.org/p/cen/wpaper/02-17.html
Kawakami, M. and T. Sturgeon (eds.) (forthcoming). The Dynamics of Local Learning in Global Value Chains: Experiences from East Asia, London: Palgrave.
Kimura, S. (2007). The Challenges of Late Industrialization: The Global Economy and the Japanese Commercial Aircraft Industry, Basingstoke and New York: Palgrave Macmillan.
Kletzer, L. (2002). Imports, exports, and jobs: what does trade mean for employment and job loss? Kalamazoo, Michigan: W.E. Upjohn Institute for Employment Research.
Krugman, P. (1991). “Increasing returns and economic geography”, Journal of Political Economy, 99, pp. 483–99.
Lall, S. (2000). “The technological structure and performance of developing country manufactured exports, 1985-98”, Oxford Development Studies, 28(3), pp. 337–369.
Lall, S. and M. Albaladejo (2004). “China’s competitive performance: A threat to East Asian manufactured exports?” World Development, 32(9), pp. 1441–1466.
Lall, S., J. Weiss and J. Zhang (2005). “The ‘sophistication’ of exports: a new measure of product characteristics”, Queen Elzabeth House (QEH) Working Paper Series (WPS), 123. January. Oxford, United Kingdom.
Lee, J. R. and J. S. Chen (2000). “Dynamic synergy creation with multiple business activities: Toward a competence-based business model for contract manufacturers”, in Ron Sanchez and Aime Heene (eds.), Advances in Applied Business Strategy, 6A (Theory Development for Competence-based Management). Stamford, Connecticut: JAI Press.
Lewin, A.Y., S. Massini and C. Peeters (2009). “Why are companies offshoring innovation? The emerging global race for talent”, Journal of International Business Studies, 40(6), pp. 901–925.

34 Transnational Corporations, Vol. 18, No. 2 (August 2009)
Linden, G., K.L. Kraemer and J. Dedrick (2007). “Who captures value in a global innovation system? The case of Apple’s iPod”, Personal Computing Industry Center (PCIC) Working Paper, University of California at Irvine, California. http://pcic.merage.uci.edu/papers.asp.
Lloyd, P.J. and H-H. Lee (eds.) (2002). Frontiers of Research in Intra-Industry Trade, London: Palgrave Macmillan.
Maule, C. (2006). “Integrative trade: issues for trade analysis, statistics and policy”, Paper prepared for the CTPL Conference on Integrative Trade between Canada and the United States – Policy Implications. http://www.dfait-maeci.gc.ca/eet/research/TPR_2006/Chapter_2_Maule-en.pdf
Neilson, J. and B. Pritchard (2009). Value Chain Struggles: Institutions and Governance in the Plantation Districts of South India. West Sussex, UK: Wiley-Blackwell.
Ng, F. and Yeats, A. (1999). “Production Sharing in East Asia. Who Does What for Whom, and Why?”, World Bank Policy Research Working Paper, No. 2197, October.
Nielsen, P.B. (ed.) (2008). International Sourcing - Moving Business Functions Abroad, Statistics Denmark, www.dst.dk/publ/InterSourcing.
Pietrobelli, C. and R. Rabellotti (2007). Upgrading to Compete: Global Value Chains, Clusters and SMEs in Latin America, Cambridge, Massachusetts: Harvard University Press.
Pine, J.P. and S. Davis (1999). Mass Customization: The New Frontier in Business Competition, Cambridge, Massachusetts: Harvard Business School Press.
Piore, M. and C. Sabel (1984). The Second Industrial Divide, New York: Basic Books.
Porter, M. (1985). Competitive Advantage, New York: Free Press.
Rasiah, R. (2009). “Sanjaya Lall: the scholar and the policy advisor”, International Journal of Institutions and Economies, 1(1), pp. 8–22.
Saxenian, A. (2006). The New Argonauts: Regional Advantage in a Global Economy, Cambridge, Massachusetts: Harvard University Press.
Schmitz, H. (1999). “Global competition and local cooperation: success and failure in the Sinos Valley, Brazil”, World Development, 27(9), pp. 1627–1650.
Sturgeon, T. (2002). “Modular production networks: a new American model of industrial organization”, Industrial and Corporate Change, 11(3), pp. 451–496.
Sturgeon, T. (2007). “How globalization drives institutional diversity: the Japanese electronics industry’s response to value chain modularity”, Journal of East Asian Studies, 7(1), pp. 1–34.
Sturgeon, T. and J.-R. Lee (2005). “Industry co-evolution: a comparison of Taiwan and North American electronics contract manufacturers”, in Suzanne Berger and Richard K. Lester (eds.), Global Taiwan: Building Competitive Strengths in a New International Economy, Armonk, New York: M.E. Sharpe.

Transnational Corporations, Vol. 18, No. 2 (August 2009) 35
Sturgeon, T. and O. Memedovic, Olga (forthcoming). “Measuring global value chains: intermediate goods trade, structural change and compressed development”, UNIDO Working Paper, Vienna.
Sturgeon, T. and R. Florida (2004). “Globalization, deverticalization, and employment in the motor vehicle industry”, in M. Kenny with R. Florida (eds.): Locating Global Advantage: Industry Dynamics in a Globalizing Economy. Palo Alto, California: Stanford University Press
Sturgeon, T., J. Van Biesebroeck and G. Gereffi (2008). “Value chains, networks and clusters: reframing the global automotive industry”, Journal of Economic Geography, 8, pp. 297–321.
Swenson, D. (2005). “Overseas assembly and country sourcing choices”, Journal of International Economics, 66(1), pp. 107–130.
Vind, I. and N. Fold (2007). “Multi-level modularity vs. hierarchy: global production networks in Singapore’s electronics industry”, Danish Journal of Geography, 107(1), pp. 69–83.
Wade, R. (1990). Governing the Market: Economic Theory and the Role of Government in East Asian Industrialization, Princeton, New Jersey: Princeton University Press.
Whittaker, D.H, T. Zhu, T. Sturgeon, M.H. Tsai and T. Okita (forthcoming). “Compressed development”, Studies in Comparitive International Development.
World Bank (1993). The East Asian Miracle: Economic Growth and Public Policy, New York: Oxford University Press.
World Development Indicators (2007). New York: World Bank. http://web.worldbank.org. Cited in Federation of International Trade Associations, http://fita.org/countries/malaysia.html?ma_rubrique=economie.
Yeats, A. (2001) “Just how big is global production sharing?”, in S. Arndt and H. Kierzkowski (eds.), Fragmentation: New Production Patterns in the World Economy, Oxford: Oxford University Press.

36 Transnational Corporations, Vol. 18, No. 2 (August 2009)