measuring science instructional practice: a survey … · measuring science instructional practice:...
TRANSCRIPT
Measuring Science Instructional Practice: A SurveyTool for the Age of NGSS
Kathryn N. Hayes1• Christine S. Lee1
•
Rachelle DiStefano1• Dawn O’Connor2
•
Jeffery C. Seitz1
� The Association for Science Teacher Education, USA 2016
Abstract Ambitious efforts are taking place to implement a new vision for science
education in the United States, in both Next Generation Science Standards (NGSS)-
adopted states and those states creating their own, often related, standards. In-
service and pre-service teacher educators are involved in supporting teacher shifts in
practice toward the new standards. With these efforts, it will be important to doc-
ument shifts in science instruction toward the goals of NGSS and broader science
education reform. Survey instruments are often used to capture instructional prac-
tices; however, existing surveys primarily measure inquiry based on previous def-
initions and standards and with a few exceptions, disregard key instructional
practices considered outside the scope of inquiry. A comprehensive survey and a
clearly defined set of items do not exist. Moreover, items specific to the NGSS
Science and Engineering practices have not yet been tested. To address this need,
we developed and validated a Science Instructional Practices survey instrument that
is appropriate for NGSS and other related science standards. Survey construction
was based on a literature review establishing key areas of science instruction, fol-
lowed by a systematic process for identifying and creating items. Instrument
validity and reliability were then tested through a procedure that included cognitive
interviews, expert review, exploratory and confirmatory factor analysis (using
independent samples), and analysis of criterion validity. Based on these analyses,
final subscales include: Instigating an Investigation, Data Collection and Analysis,
Critique, Explanation and Argumentation, Modeling, Traditional Instruction, Prior
Knowledge, Science Communication, and Discourse.
& Kathryn N. Hayes
1 California State University, East Bay, 25800 Carlos Bee Blvd., Hayward, CA 94542, USA
2 Alameda County Office of Education, 313 W. Winton Ave., Hayward, CA 94544, USA
123
J Sci Teacher Educ
DOI 10.1007/s10972-016-9448-5

Keywords Inquiry � Instructional practice � Survey tool � Next Generation Science
Standards
Introduction
National goals for science education in the United States include increasing the
number of students who pursue advanced degrees in science (National Research
Council [NRC], 2012), reducing disparities in participation of minorities and
women in the science workforce (NRC, 2012; President’s Council of Advisors on
Science and Technology [PCAST], 2010), and improving science literacy. In order
to fulfill these goals, the Framework for K-12 Science Education (Framework)
(NRC, 2012) and Next Generation Science Standards (NGSS) (NRC, 2013) call for
significant shifts in science teaching that enable all students to actively engage in
scientific practices and apply crosscutting concepts to core disciplinary ideas (NRC,
2013). Yet as NGSS and related standards systems are rolled out across states,
policy makers and PD providers will need to know the results of their efforts. The
hopes and challenges associated with efforts to support teacher implementation of
the NGSS put a great onus on researchers to measure relevant changes in science
teachers’ instructional practice.
Survey instruments are commonly used to capture instructional practices due to
their practicality in administration (Desimone, Porter, Garet, Yoon, & Birman,
2002; Dorph, Sheilds, Tiffany-Morales, Hartry, & McCaffrey, 2011). Yet, many of
the existing science instruction surveys focus on measuring a set of inquiry practices
based on previous science education standards and research (e.g., NRC, 1996), and
most do not cover relevant non-inquiry instructional practices (e.g., incorporating
student discourse; an exception is the subscale for ‘‘engaging prior knowledge,’’
Lee, Maerten-Rivera, Buxton, Penfield, & Secada, 2009). No existing instrument
comprehensively measures both inquiry and other relevant instructional practices
with clearly defined sets of items. Moreover, the adoption of NGSS necessitates
updated items that make explicit links to the NGSS Science and Engineering (SE)
practices.
In an effort to understand science teachers’ instructional approaches in the
context of current education reform and professional development efforts, we
developed and validated the Science Instructional Practices (SIPS) survey
instrument to assess key instructional practices underscored by research and the
Framework for K-12 Science Education (NRC, 2012). Data for analysis were
sampled from primarily third- to tenth-grade teachers participating in a large NSF-
funded professional development project in a large California urban area.
Fig. 1 Phases of survey design and validation
K. N. Hayes et al.
123

Instrument development and testing proceeded in seven phases (Fig. 1), starting
with a literature review to generate the range of instructional practices and potential
items, and proceeding through instrument design, validation, and reliability tests. In
the process of validation, we included an analysis of the factors underlying teacher
instructional practices, and explored whether teacher perception of their instruc-
tional behaviors focused more on activity type or on level of cognitive demand.
Through this process, this study provides researchers and teacher educators with a
valid and reliable survey that measures a range of science instructional practices
appropriate and necessary for third- to tenth-grade science education, including the
NGSS SE practices.
Review of the Literature: Defining Instructional Practices
Before beginning survey construction, we conducted a literature review to
identify key areas of instructional practice that needed to be covered by sets of
survey items (phase 1), resulting in five major areas (Table 1). As many of these
areas emerged from inquiry research over the last several decades, we begin with a
brief review of inquiry practices, followed by an overview of each area as it is
defined in the literature and policy documents.
Inquiry as a pedagogical approach was defined somewhat broadly by the NRC
(1996) as involving students in investigation and experimentation activities to
‘‘develop knowledge and understanding of scientific ideas, as well as an
understanding of how scientists study the natural world’’ (p. 23). Despite being
the hallmark of excellent science education for decades, inquiry has eluded precise
definition in both research and practice, due to lack of consistency in implemen-
tation (Anderson, 2002; NRC, 2012), and tensions between students practicing
inquiry and students learning about inquiry (Abd-El-Khalick et al., 2004). These
Table 1 Areas of literature pertaining to science instructional practices
Literature area Definition
Empirical Investigation Focus on investigation procedure: asking questions, determining what
needs to be measured, observing phenomena, planning experiments, and
collecting and analyzing data
Evaluation and Explanation Focus on modeling, evaluation, and argumentation: constructing
explanations, evaluating appropriateness based on evidence, fitting
models, and critiquing ideas
Science Discourse and
Communication
Opportunities for participation in scientific discourse that enculturates
students into scientific language and practices
Engaging Prior Knowledge Engaging students’ prior knowledge and real-world and home applications
of science to bridge between science epistemologies and student
experience
Traditional Instruction Traditional teacher-centered approaches, including direct instruction,
demonstration, worksheet or textbook work
Measuring Science Instructional Practice: A Survey Tool for…
123
issues have been mitigated in part through the creation of inquiry continuums, such
as the level of student-centeredness (Marshall, Smart, & Horton, 2009). Still, the
resulting definitions of inquiry are fairly wide-ranging, incorporating data collection
and analysis, engaging in reasoning, explanation and argumentation, and commu-
nicating (Abd-El-Khalick et al., 2004; Forbes, Biggers, & Zangori, 2013). The
NGSS SE practices build upon inquiry research by explicating eight specific
practices to engage students in understanding science phenomena. Below, the
literature reviewed is organized along five major areas, including (where
appropriate) explicit links to the NGSS SE practices as well previous research on
inquiry practices.
Area 1: Empirical Investigation
In specifying the scientific practices, the Framework for K-12 Science Education
(NRC, 2012) proposed three spheres of activity: (1) Investigating, (2) Evaluating,
and (3) Developing explanations and solutions. The first area of the literature
discussed here, Empirical Investigation, corresponds to the Framework sphere 1
(Investigating) and includes determining what needs to be measured (NGSS SE
practice 1), and observing phenomena, planning experiments, and collecting data
(NGSS SE practice 3) (NRC, 2012).
Although scientists conducting empirical investigations engage in highly
complex tasks, teachers often use cookbook laboratories or a relatively rigid
‘‘scientific process’’ (NRC, 2012) absent the sense-making necessary to understand
the development of scientific knowledge (McGinn & Roth, 1999; Tekkumru Kisa,
Stein, & Schunn, 2015). Because a classroom based on NGSS (and recent inquiry
research) should move toward investigation activities involving students in critical
thinking and meaning construction (Zimmerman, 2007), we propose that a
delineation is needed to elucidate teacher instructional approaches in this area.
This delineation has two components: (1) the level of student involvement, which
reflects long-standing literature regarding the role of teacher guidance and carefully
structured scaffolds for student decision-making (Campbell, Abd-Hamid, &
Chapman, 2010; Marshall et al., 2009) and (2) the level of cognitive demand,
necessary to complex thinking and reasoning (NRC, 2012; Tekkumru Kisa et al.,
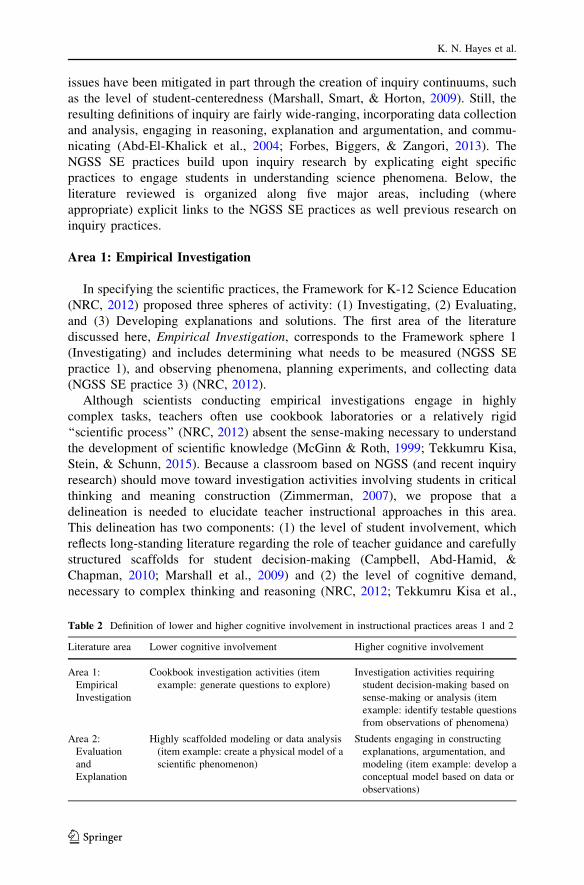
Table 2 Definition of lower and higher cognitive involvement in instructional practices areas 1 and 2
Literature area Lower cognitive involvement Higher cognitive involvement
Area 1:
Empirical
Investigation
Cookbook investigation activities (item
example: generate questions to explore)
Investigation activities requiring
student decision-making based on
sense-making or analysis (item
example: identify testable questions
from observations of phenomena)
Area 2:
Evaluation
and
Explanation
Highly scaffolded modeling or data analysis
(item example: create a physical model of a
scientific phenomenon)
Students engaging in constructing
explanations, argumentation, and
modeling (item example: develop a
conceptual model based on data or
observations)
K. N. Hayes et al.
123

2015) (Table 2). These are collectively summarized here for ease of labeling as
‘‘cognitive involvement.’’ For example, the item ‘‘identifying testable questions
from observations of phenomena’’ implies activity at a higher student cognitive
involvement than simply ‘‘generating questions or predictions to explore,’’ which is
in turn higher than students simply being given a question to investigate by a teacher
(NRC, 2013) (Table 2).1
Area 2: Evaluation and Explanation
The second area of the literature, Evaluation and Explanation, corresponds to the
Framework spheres 2 and 3 (Evaluating and Developing explanations and solutions;
NRC 2012) and is based on research that demonstrates the importance of
opportunities for students to develop competence for analysis (Bartholomew,
Osborn, & Ratcliffe, 2004), argumentation (Driver, Newton, & Osborne, 2000;
Duschl & Osborne, 2002), modeling (Stewart, Cartier, & Passmore, 2005), and
explanation (McNeill & Krajcik, 2008; Schwarz et al., 2009). This area of the
literature thus includes activities related to qualitatively and quantitatively
analyzing data (NGSS SE practices 4 and 5), constructing explanations and
evaluating appropriateness based on evidence (NGSS SE practice 6), generating and
using models (NGSS SE practice 2), and argumentation and critique (NGSS SE
practice 7) (NRC, 2012).
The literature in area 2 suggests that students must come to understand, through
scaffolded experiences, the norms by which scientists make decisions about
alternative explanations (Driver et al., 2000; Schwarz et al., 2009), as well as the
nature of current and past scientific disputes (Lemke, 2004). However, students
clearly have difficulties in composing arguments and linking claims to evidence
(Jimenez-Aleixandre & Erduran, 2007). Teachers consequently sometimes engage
students in Evaluation and Explanation tasks in ways that lower cognitive
involvement, breaking tasks into subtasks with detailed directions (Smith, 2000;
Tekkumru Kisa et al., 2015). For example, students might engage in creating a
physical model of the solar system after a diagram in the book or follow a series of
procedural steps that requires little decision-making (Table 2) (Krathwohl, 2002).
Teachers wishing to demand higher levels of student cognitive involvement move
into guided evaluation and explanation tasks, supporting student induction into
scientific habits of mind (Kuhn, 2015; Richmond and Striley, 1996; Tekkumru Kisa
et al., 2015). Thus, as in the literature area 1, items in area 2 delineate how teachers
engage students in a continuum from low to high student cognitive involvement for
aspects of instructional practice (Tables 2, 8). However, because the literature is not
clear on how teachers perceive activities versus cognitive involvement, the
delineation of items also provided an opportunity for us to analyze the factors
underlying whether teachers’ reported instructional behaviors pertain more to
activity (e.g., investigation, modeling) or to cognitive level.
1 Although it is difficult to precisely measure the cognitive level in any given task in a survey instrument
(Tekkumru Kisa et al., 2015), the delineations described in this instrument represent a reasonable step
toward attending to levels of cognitive involvement in the practices examined.
Measuring Science Instructional Practice: A Survey Tool for…
123
Area 3: Science Discourse and Communication
The role of argumentation and communication in the NGSS practices (NRC,
2012) and the importance of language acquisition for science literacy also
necessitate measuring opportunities for scientific discourse and communication
(Forbes et al., 2013; Kuhn, 2015). Drawing from sociocultural learning theory
(Wertsch, 1985) and language acquisition theory (Canale & Swain, 1980), scholars
contend that scientific knowledge is socially constructed and therefore science
education involves introducing learners to the language and symbols of science
through engagement in shared discourse (Driver, Asoko, Leach, Scott, & Mortimer,
1994; Lemke, 2001). Indeed, it has been argued that discourse is a central tenet of
scientific practice (Driver et al., 2000; McGinn & Roth, 1999). Research in this area
has demonstrated that scaffolded participation in dialogue in a variety of group
sizes—dyads, small groups, and whole class; with and without the teacher—assists
academic language acquisition and scientific reasoning (Driver et al., 1994; Hogan,
Nastasi, & Pressley, 1999; Richmond & Striley, 1996). These opportunities, when
facilitated, can result in enculturation into the discourse of science (Lemke, 2001).
In addition, science literacy includes the ability to read, understand, and
synthesize science text, to understand and produce science charts, and to
communicate results (Norris, Phillips, & Osborne, 2008). Such literacy practices
(encapsulated in NGSS SE practice 8, obtaining, evaluating, and communicating
information) facilitate disciplinary meaning-making, allowing students to become
critical participants in the production and analysis of science (NRC, 2012).
Area 4: Engaging Prior Knowledge
The fourth area concerns a body of research demonstrating the importance of
incorporating student experience and prior knowledge into the classroom to mitigate
the inequities reproduced within traditional science instruction (e.g., Calabrese
Barton, 2002; Lee, Luykx, Barton, & Shaver, 2007). Many students, particularly
those who are female, African American or Latino, take up messages that they
cannot excel in STEM as early as middle school (PCAST, 2010). In facilitating
student agency and participation, inquiry teaching practices may contribute to
science identity building, but research has demonstrated additional ways for
teachers and programs to create ‘‘bridges’’ for students, including incorporating
student epistemologies and funds of knowledge in class (Calabrese-Barton, Tan, &
Rivet, 2008; Lee et al., 2007; Moll, Amanti, Neff, & Gonzalez, 1992). For example,
Rosebery, Warren and Conant (1992) suggest that for underrepresented students,
learning scientific habits of mind is facilitated by students ‘‘finding a way to
accommodate one’s purposes and values alongside those of the scientific and the
school cultures’’ (p. 26). Although it is difficult to measure such opportunities in a
survey, we incorporate items used by Lee et al. (2009) pertaining to incorporating
student prior knowledge and real-world connections in the classroom.
K. N. Hayes et al.
123
Area 5: Traditional Instruction
Area 5 includes pedagogical approaches such as direct instruction, demonstra-
tion, and worksheets. Measuring shifts in science instructional practice requires
gauging traditional approaches because (1) it may be necessary to establish a
baseline to note changes in practice and (2) science learning is dependent on an
interweaving of content and process, which may at times require direct instruction
to scaffold students’ understanding of scientific ideas and principles (Zimmerman,
2007). However, traditional and inquiry instructional approaches must be kept in
careful balance; research has shown that teacher-centered instruction such as lecture
is not well positioned to support student generative understanding (McGinn & Roth,
1999).
Altogether, the survey instrument presented in this paper aims to capture
complex science instructional practices based on the extensive body of research on
inquiry and other relevant practices, the theoretical foundation identified in the K-12
Framework for Science Education, and links to the eight NGSS practices. Although
we identify items as related to specific NGSS SE practices, the instrument in total is
based on a broad review.
Methods
Instrument development and testing proceeded in seven phases (Fig. 1),
summarized here and described in detail in this section. In phase 1, an extensive
review of the literature generated five areas of instructional practice (reported
above). Phase 2 consisted of a second review of the literature to determine existing
instruments as well as a systematic process for identifying, revising, and creating
items. Phases 3 and 4 involved face and content validation through expert review
and cognitive interviews. In phase 5, construct validity was assessed through
exploratory factor analysis (EFA). The emergent factors were then tested for
validity through confirmatory factor analysis (CFA) with an independent sample.
Reliability was established through internal consistency (phase 6). Finally, evidence
for criterion validity was generated through correlations between teacher hours of
NGSS PD participation and school demographics [free and reduced lunch (FRL),
accountability profile] in accordance with the literature (phase 7).
Instrument Design
Source and Item Selection; Content Validation (Phases 2–4)
Once the features of core practices were identified in the literature review, we
searched the literature to determine the range of existing survey instruments in these
areas from which to select a pool of items. Observational instruments were also
considered in cases where survey items were unavailable to represent a construct.
We aimed to gather or create an ‘‘instructional repertoire’’ of items for each area
(Burstein et al., 1995, p. 38) to lower random measurement errors and error
Measuring Science Instructional Practice: A Survey Tool for…
123

variance, leading to more acceptable reliability (consistency of measurement) and
greater validity (instrument measuring what it is designed to measure) (Crocker &
Algina, 1986).
After collecting all relevant studies that presented a survey or observational
instrument, we engaged in a selection and elimination process. Instruments or items
were not considered for selection in the following cases: First, instruments were not
considered if they did not target several types of science instructional practice (e.g.,
Garet, Birman, Porter, Desimone, & Herman, 1999), or if they consisted solely of
efficacy, belief or nature of science scales (e.g., Science for Inquiry Scale, Smolleck,
Zembal-Saul, & Yoder, 2006). Second, items (usually from observational instru-
ments) were not considered if they were too complex for the purpose of teacher self-
reporting (e.g., some Electronic Quality of Inquiry Protocol items, Marshall et al.,
2009), although the target and scope of such observational items were considered in
theme and item construction. Third, scales that were not focused on science
education were considered as sources for item adaptation, but not specific items
(e.g., the Teacher Follow-Up Survey, Walczyk & Ramsey, 2003). Finally, we
sought items at a mid-level of specificity (Marshall et al., 2009), avoiding items that
were too broad or were related to specific content (e.g., items such as ‘‘Time is
devoted to refining student questions so that they can be answered by investiga-
tions,’’ Campbell et al., 2010).
Items were considered for inclusion based on: (1) conceptual relevance to the
literature; (2) pervasiveness across existing surveys; (3) mid-level specificity; and
(4) wording clarity (Rea & Parker, 2005) (see Table 3). We selected or created at
least three items per area of literature in order to ensure reliability (Gogol et al.,
2014). For each NGSS practice, we also selected or created at least one item at
higher and lower cognitive involvement.
After eliminating inappropriate instruments, we finalized six main sources of
science instructional practices response items (Table 4). The first set originates largely
from work conducted at Horizon Research, Inc., over the last two decades to support
the National Survey of Science and Mathematics Education (NSSME) (e.g., scales
Table 3 Priorities for item selection and revision, with example
Priority Example
Conceptual relevance to
the literature
Included ‘‘Require students to supply evidence to support their claims’’
(Supovitz & Turner, 2000) because it follows the literature on
explanation and argumentation
Pervasiveness Items or constructs that were measured in different ways across studies and
contexts were carefully considered for inclusion; for example, ‘‘students
share ideas or solve problems with each other in small groups’’ reflects
items in Llewellyn (2013) and the Horizon surveys (Banilower et al.,
2007)
Mid-level specificity ‘‘Have students solve problems with each other in small groups’’ captures a
broader set of activities than ‘‘talking with group members about the
investigation,’’ yet is more specific than ‘‘participate in discussions to
deepen understanding’’
Broad applicability Items that were very specific to particular approaches were not considered,
such as ‘‘project-based learning’’
K. N. Hayes et al.
123

Ta
ble
4Overview
ofinstrumentsthat
served
asthemajoritem
sources
Source
Constructs
Exam
ple
item
Validityandreliability(from
original
source)
SupovitzandTurner
(2000),Klein
etal.
(2000),Banilower
etal.(2007,2013),
Huffman
etal.(2003)
Investigative
classroom
culture
Requirestudents
tosupply
evidence
to
supporttheirclaims
Item
svalidated
throughan
interview
process,whichdem
onstrateda
significantpositivecorrelation,althoughsomew
hat
low
(Spearm
an’s
q=
.44)withthesurvey
responses(K
lein
etal.2000).Constructs
emerged
throughEFA
(Supovitz&
Turner,2000).Test–retest
reliabilitywas
moderate(r
=.664–.671)(G
ermuth,Banilower,&
Shim
kus,2003)
Investigative
classroom
practices
[Students]designorim
plementtheir
owninvestigations
Traditional
classroom
practices
[Students]answ
ertextbookorworksheet
questions
Lee
etal.(2009)
Science
for
understanding
Talkaboutthingsdoneat
homethat
are
similar
towhatisdonein
science
class
Cronbach’s
a.77
Science
for
inquiry
Analyze
relationshipsusingtables,
charts,orgraphs
Cronbach’s
a.86
Conventional
practices
Providedirectinstructionto
explain
science
concepts
Cronbach’s
a.71
Llewellyn(2013)
Scientificinquiry
scale
[Students]writingquestionsand
hypothesis
toexplore;gathering
quantitativeandqualitativedata
Forbes
etal.(2013)
Practices
of
science
observation
protocol
Students
form
ulate
explanationsabout
phenomenonofinterest
that
buildon
theirexistingknowledge
Observer
1’sscore
explained
81%
ofobserver
2’sscore.Cronbach’sa
ranged
from
.71to
.98
Marshallet
al.(2009)
EQUIP
inquiry
observation
protocol
Form
alandinform
alassessments
measuredonly
factual,discreet
knowledge
Observer
1’sscore
explained
86%
ofobserver
2’sscore.Cronbach’sa
ranged
from
.82to
.91
NGSSpractices
(NRC,2013)
Descriptionof
practices
across
gradelevels
Construct,analyze,and/orinterpret
graphical
displaysofdata
Measuring Science Instructional Practice: A Survey Tool for…
123

used by Banilower, Heck, &Weiss, 2007; Banilower et al., 2013; Huffman, Thomas,
& Lawrenz, 2003; Klein et al., 2000; Supovitz & Turner, 2000). To supplement,
detailed items for inquiry and investigation constructs were drawn from Llewellyn’s
(2013) scientific inquiry scale, developed to ascertain the degree of student
engagement in inquiry practices. Llewellyn’s (2013) scale was chosen because it
represented a detailed list of investigation activities; other instruments often listed
many of the activities together (e.g., ‘‘use science process skills’’). A survey
instrument used by Lee et al. (2009) served as an additional source for items,
particularly measuring practices that elicit student funds of knowledge and prior
experience.
We drew from two observation protocols in areas that were underdeveloped in
survey instrument literature. Although measures of NGSS SE practices are still in
development, a field-tested inquiry practices observational tool (P-SOP, Forbes et al.,
2013) served as a basis for incorporating items related to NGSS evidence and
argumentation practices. Finally, we directly examined the NGSS SE practice
descriptions (NRC, 2013) to create items where needed. Wording of these items was
based on thewordingwithin the practices, adapted to fit a realistic instructional context
and teacher linguistic framing (Rea & Parker, 2005). In addition, we consulted with
teachers and science PD providers for any additional items needed to refine a theme.
Overall, although each of the extant instruments measures a subset of important
instructional practices, no one instrument comprehensively covered the five areas
identified from the literature review, and only one (observational instrument)
specifically addressed the NGSS practices, pointing again to the need for a
comprehensive survey.
Content validity of the initial collated instrument was established through the phase
1 literature search, as well as examination by three NGSS professional development
providers and two science education scholars who have current research and practice
interests in improving teacher science instructional practices. These expert reviewers
noted issues with wording and redundancy and ensured that all important constructs
were considered (Rea & Parker, 2005). For example, item 28 in Table 8 was changed
from ‘‘discuss student prior knowledge’’ to ‘‘elicit students’ prior knowledge’’ in order
to be specific about student contributions. In addition, face validity was established
through cognitive interviews with three teachers (Desimone & Le Floch, 2004),
resulting in item changes based on emic (teachers’ normal language) definitions and
clarity. For example, we added an item to clarify the different types of modeling
teachersmight dowith their students (e.g., physicalmodel that represents a structure or
system versus a conceptualmodel that represent students’ scientific ideas). Finally, the
instrument was considered for areas where items could be reduced to mitigate survey
fatigue, a source of measurement error (Stapleton, 2010).
Data Collection and Analysis
Participants
The resulting 31-item survey was piloted with third- to tenth-grade science
teachers taking part in NSF-funded professional development focused on improving
K. N. Hayes et al.
123

science content and implementing NGSS practices in urban schools. The first
3 years, the project had a dual focus on supporting teacher science content learning
and understanding of how to implement student-centered inquiry practices, carried
out through intensive summer and Saturday sessions, district-based PD, and Lesson
Study. In the latter 2 years (2013–2015), the project began to incorporate NGSS
approaches, focusing primarily on the NGSS SE practices. Teacher participation
ranged from a few hours to over 100 h per year.
A total of 397 teachers from nine districts participated in this study. Samples for
pilot testing and two field tests were selected based on the months teachers
participated in PD. Roughly, 147 teachers who participated in summer of 2014 were
part of the pilot test, 95 select teachers who participated in fall of 2014 were part of
Sample 1, and an independent sample of 155 teachers who participated in Spring
and Summer of 2015 were selected to be part of Sample 2.
The survey instrument was piloted with 147 teachers, resulting in minor changes
in item wording on seven items, the addition of five items to strengthen and
delineate constructs, and deleting two items that demonstrated issues with meaning
and interpretation. During the pilot, teachers’ struggle with interpreting an item
intended to measure higher cognitive involvement for computational thinking
(NGSS SE practice 5), ‘‘Apply statistics to analyze data,’’ resulted in its deletion. In
order to keep the survey at a reasonable length, and because of overlap with items 7
and 8, no new items were added for NGSS practice 5.
Field testing was conducted with two samples, Sample 1 for the EFA and an
independent sample (Sample 2) for the final CFA. Sample 1 consisted of 95
teachers from five districts. Although this sample size is slightly low for factor
analysis, because most emergent factors have five associated items with a
moderate to high factor loading, the fit of the model to the data may be deemed
adequate (Bandalos & Finney, 2010). Sample 2 consisted of 155 teachers from
nine districts. Grade band distribution was similar to that of Sample 1, with
34 % at grades 3–5 (or science specialists), 53 % at grades 6–8, and 13 % at
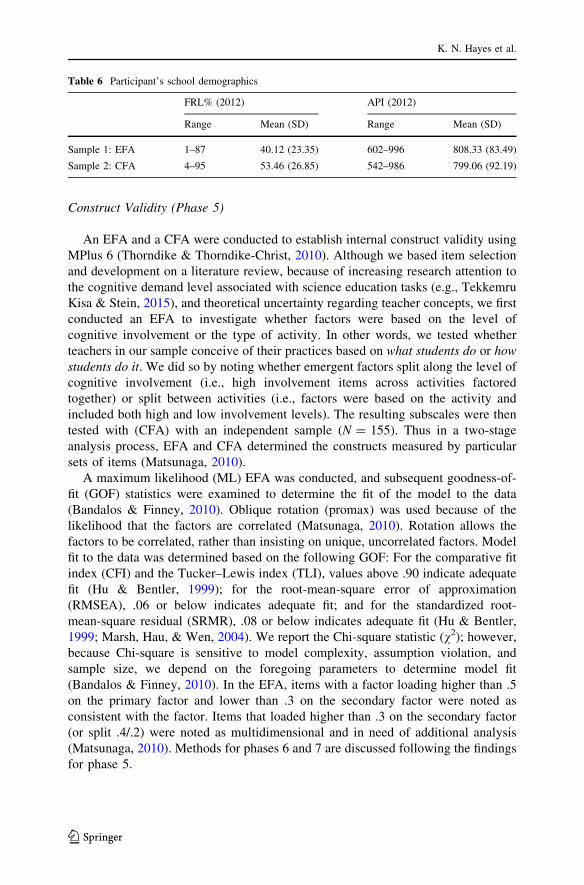
grades 9–10 (Table 5). For both samples, school percent FRL and Academic
Performance Index (API—a standardized test primarily measuring math and
language arts) were wide-ranging (Table 6).
Table 5 Participant demographics
N %
female
Grade bands (%) Teaching experience PD participation (h)
4–5 6–8 9–10 Range
(years)
Mean
(years)
Range Mean (SD)
Sample 1:
EFA
95 72 28 57 14 1–35 8a 0–487 63.96 (109.78)
Sample 2:
CFA
155 70 34 53 13 1–35 12a 0–495 60.75 (121.14)
a Because years teaching was measured by selection of a range, this table presents a rough mean; no
standard deviation is available
Measuring Science Instructional Practice: A Survey Tool for…
123
Construct Validity (Phase 5)
An EFA and a CFA were conducted to establish internal construct validity using
MPlus 6 (Thorndike & Thorndike-Christ, 2010). Although we based item selection
and development on a literature review, because of increasing research attention to
the cognitive demand level associated with science education tasks (e.g., Tekkemru
Kisa & Stein, 2015), and theoretical uncertainty regarding teacher concepts, we first
conducted an EFA to investigate whether factors were based on the level of
cognitive involvement or the type of activity. In other words, we tested whether
teachers in our sample conceive of their practices based on what students do or how
students do it. We did so by noting whether emergent factors split along the level of
cognitive involvement (i.e., high involvement items across activities factored
together) or split between activities (i.e., factors were based on the activity and
included both high and low involvement levels). The resulting subscales were then
tested with (CFA) with an independent sample (N = 155). Thus in a two-stage
analysis process, EFA and CFA determined the constructs measured by particular
sets of items (Matsunaga, 2010).
A maximum likelihood (ML) EFA was conducted, and subsequent goodness-of-
fit (GOF) statistics were examined to determine the fit of the model to the data
(Bandalos & Finney, 2010). Oblique rotation (promax) was used because of the
likelihood that the factors are correlated (Matsunaga, 2010). Rotation allows the
factors to be correlated, rather than insisting on unique, uncorrelated factors. Model
fit to the data was determined based on the following GOF: For the comparative fit
index (CFI) and the Tucker–Lewis index (TLI), values above .90 indicate adequate
fit (Hu & Bentler, 1999); for the root-mean-square error of approximation
(RMSEA), .06 or below indicates adequate fit; and for the standardized root-
mean-square residual (SRMR), .08 or below indicates adequate fit (Hu & Bentler,
1999; Marsh, Hau, & Wen, 2004). We report the Chi-square statistic (v2); however,because Chi-square is sensitive to model complexity, assumption violation, and
sample size, we depend on the foregoing parameters to determine model fit
(Bandalos & Finney, 2010). In the EFA, items with a factor loading higher than .5
on the primary factor and lower than .3 on the secondary factor were noted as
consistent with the factor. Items that loaded higher than .3 on the secondary factor
(or split .4/.2) were noted as multidimensional and in need of additional analysis
(Matsunaga, 2010). Methods for phases 6 and 7 are discussed following the findings
for phase 5.
Table 6 Participant’s school demographics
FRL% (2012) API (2012)
Range Mean (SD) Range Mean (SD)
Sample 1: EFA 1–87 40.12 (23.35) 602–996 808.33 (83.49)
Sample 2: CFA 4–95 53.46 (26.85) 542–986 799.06 (92.19)
K. N. Hayes et al.
123

Findings Phase 5
Descriptive Statistics
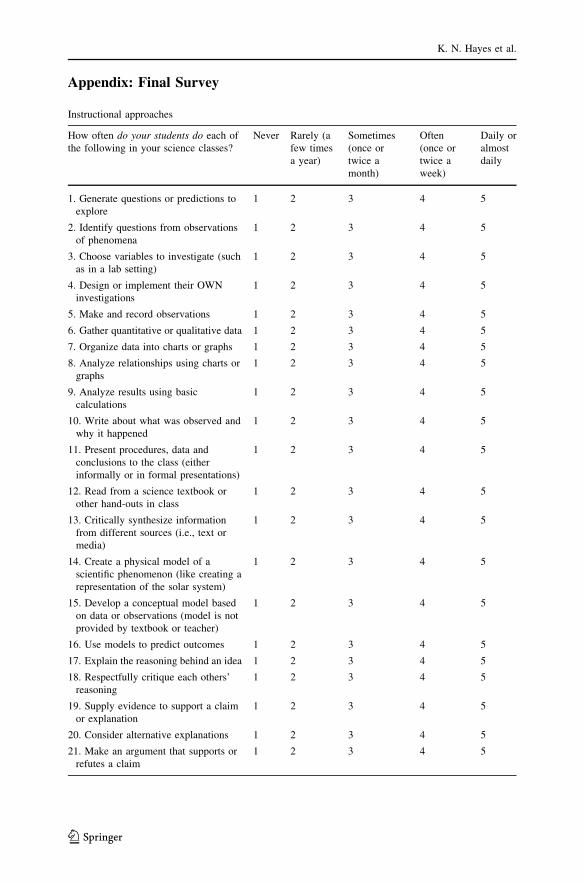
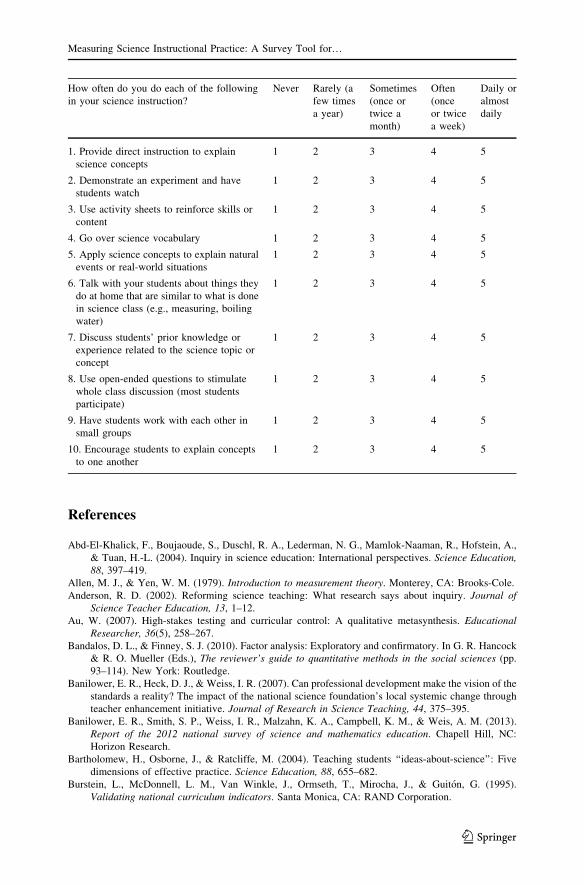
Table 8 presents the descriptive statistics for the instrument items. For items
1–21, teachers were asked, ‘‘How often do your students do each of the following in
your science classes?’’ For items 22–31, teachers were asked ‘‘How often do you do
each of the following in your science instruction?’’ Items were rated on a five-point
Likert scale ranging from 1 (Never) to 4 (Daily or almost daily) [adapted from
Banilower et al. (2013)]. The highest mean item was ‘‘Provide direct instruction to
explain science concepts’’ (4.20). The lowest mean item was ‘‘[Students] Design or
implement their own investigations’’ (2.19). Skewness and kurtosis values were
within a reasonable range (all items below an absolute value of 1.96).
Construct Validation Through Exploratory Factor Analysis (Phase 5)
GOFstatistics for four-, five-, and six-factor results arepresented inTable 7.Themodel
did not converge beyond six factors. A six-factor solution was selected for the following
reasons: (1) GOF statistics for models with one to three factors were well outside the
boundsof goodfit (Hu&Bentler, 1999); thus,weonly considered four-, five-, or six-factor
results (Table 7). (2) Fewer factors resolved the multidimensionality exhibited by certain
items (Bandalos&Finney, 2010). (3)A six-factor solution exhibits theoretical coherence,
and the resulting factors are consistentwith the literature. (4)GOFindices for the six-factor
model are approaching standards for good fit: RMSEA (.09), CFI (.82), and TLI (.75)
slightly miss the cutoffs; however, SRMR represents good fit at .06.
Table 8 displays pattern factor coefficients demonstrated in the EFA. Values in
bold indicate positive loading above .5. Values in italics indicate a primary
coefficient below .5, or secondary loading for items that exhibit a .5/.3 or .6/.4 split
(Matsunaga, 2010). As demonstrated in Table 8, several clear factors emerged from
the EFA as well as a few areas of uncertainty. These are described by factors below
(Table 9). The emergent factors were clearly aligned with activity rather than
cognitive involvement. In other words, loadings were associated with particular
instructional activities (and NGSS SE practices); the a’s and b’s (level of cognitive
involvement) did not factor together. Following is a brief overview of the factors.
Factor 1
A fairly clear factor emerged encompassing items related to the area of the
literature we called Empirical Investigations (encompassing NGSS SE practices 1
Table 7 EFA goodness-of-fit indices for four-, five-, and six-factor models
Model v2 df p value RMSEA CFI TLI SRMR
Four-factor 652.73 347 \.001 .09 .76 .68 .07
Five-factor 566.21 320 \.001 .09 .81 .72 .06
Six-factor 499.12 294 \.001 .09 .82 .75 .06
Measuring Science Instructional Practice: A Survey Tool for…
123

Ta
ble
8Item
mean,standarddeviation,andEFA
factorloadings
Label
Area
NGSS
SEP
Mean
SD
12
34
56
1.Generatequestionsorpredictionsto
explore
QuestionA
11a
3.33
.83
.64
3.362
.307
.268
.187
.40
4
2.Identify
questionsfrom
observationsofphenomena
QuestionB
11b
3.04
.82
.96
9.265
.316
.209
.188
.223
3.Choose
variablesto
investigate(such
asin
alabsetting)
InvVarB
13b
2.79
.91
.51
6.3
41
.42
0.231
.187
.155
4.Designorim
plementtheirOWN
investigations
InvOwnB
13b
2.19
.73
.56
4.183
.47
8.3
09
.077
.071
5.Makeandrecord
observations
InvObsA
13a
3.89
.66
.36
2.4
72
.277
.288
.279
.205
6.Gather
quantitativeorqualitativedata
InvDataA
13a
3.77
.66
.321
.62
9.198
.253
.132
.142
7.Organizedatainto
chartsorgraphs
AnalyzeA
24a
3.29
.67
.332
.78
0.147
.219
.019
.073
8.Analyze
relationshipsusingcharts
orgraphs
AnalyzeB
24b
3.16
.76
.392
.88
3.253
.319
.143
.173
9.Analyze
resultsusingbasic
calculations
MathB
25a
3.10
.84
.253
.66
6.398
.229
.214
.184
10.Write
aboutwhat
was
observed
andwhyithappened
ComWriteA
38a
3.74
.77
.45
5.307
.48
7.4
32
.263
.238
11.Presentprocedures,dataandconclusionsto
theclass(either
inform
ally
orin
form
alpresentations)
ComPresA
38a
3.06
.93
.47
3.247
.52
2.4
17
.41
4.130
12.Readfrom
ascience
textbookorother
hand-outs
inclass
ComReadA
3/5
8a
3.61
1.06
.103
-.085
.30
4.153
.55
9.3
44
13.Criticallysynthesizeinform
ationfrom
differentsources
(i.e.,textormedia)
ComSynthB
38b
2.92
.91
.200
.207
.43
2.6
00
.329
.334
14.Createaphysicalmodel
ofascientificphenomenon(likecreatinga
representationofthesolarsystem
)
ModelA
22a
2.95
.72
.097
.297
.215
.73
6.221
.274
15.Developaconceptual
model
based
ondataorobservations(m
odel
isnot
provided
bytextbookorteacher)
ModelB
22b
2.58
.91
.284
-.038
.366
.77
4.192
.208
16.Use
modelsto
predictoutcomes
ModPredB
22b
2.80
.84
.396
.246
.396
.73
1.212
.277
17.Explain
thereasoningbehindan
idea
ExpReasB
26b
3.44
.83
.334
.188
.78
0.5
42
.249
.193
18.Respectfullycritiqueeach
others’
reasoning
ArgCritB
27b
2.81
.91
.141
.077
.71
9.300
.271
.326
19.Supply
evidence
tosupportaclaim
orexplanation
ExpEvidB
26b
3.41
.92
.50
1.313
.71
8.357
.219
.175
20.Consider
alternativeexplanations
ExpAltB
26b
3.11
.98
.312
.116
.79
5.313
.281
.403
21.Makean
argumentthat
supportsorrefutesaclaim
ArgClaim
B2
7b
3.12
.93
.304
.213
.76
4.456
.188
.364
22.Providedirectinstructionto
explain
science
concepts
TradDirect
54.20
.70
.108
.203
.105
.020
.63
7.389
K. N. Hayes et al.
123

Ta
ble
8continued
Label
Area
NGSS
SEP
Mean
SD
12
34
56
23.Dem
onstrate
anexperim
entandhavestudentswatch
TradDem
on
53.34
.77
.107
.000
.185
.122
.53
6.280
24.Use
activitysheetsto
reinforceskillsorcontent
TradSheet
53.72
.82
.106
.168
.155
.280
.59
4.264
25.Goover
science
vocabulary
TradVocab
54.01
.81
.007
.051
.247
.291
.77
1.361
26.Apply
science
conceptsto
explain
naturalevents
orreal-w
orldsituations
PriorReal
44.00
.78
.181
.005
.358
.261
.49
4.7
37
27.Talkwithyourstudentsaboutthingsthey
doathomethataresimilar
towhat
isdonein
science
class(e.g.,measuring,boilingwater)
PriorH
ome
43.90
.78
.200
.214
.317
.42
5.4
27
.86
6
28.Elicitstudents’priorknowledgeorexperience
relatedto
thescience
topicor
concept
PriorExp
44.12
.80
.114
.278
.182
.384
.47
8.7
12
29.Use
open-ended
questionsto
stim
ulate
whole
classdiscussion(m
ost
students
participate)
DiscC
lass
33.69
.81
.36
6.275
.45
5.3
62
.317
.39
0
30.Havestudentswork
witheach
other
insm
allgroups
DiscG
roup
34.38
.67
.198
.049
.186
.121
.181
.38
7
31.Encouragestudentsto
explain
concepts
tooneanother
DiscE
xpl
38b/6b
3.96
.86
.273
.047
.39
0.3
67
.259
.37
4
Correspondingliterature
area
andNGSSpracticeareindicated.An(a)aftertheNGSSSEPnumber
represents
thelower
endofthecontinuum
ofstudentcognitive
involvem
ent.A
(b)representshigher
studentcognitiveinvolvem
ent.NGSSpractices
6(Explanation)and7(A
rgumentation)donothavelevel
(a)item
sbecause
they
all
requirehighcognitiveinvolvem
ent(K
rathwohl,2002)
Measuring Science Instructional Practice: A Survey Tool for…
123

and some of 3), including generating questions, choosing variables, and designing
and implementing an investigation. The items most associated with factor 1 (in
bold, Table 8) loaded on this factor between .516 and .969.
Factor 2
Two items pertaining to planning and carrying out investigations (NGSS SE 3)
exhibited multidimensionality between factors 1 and 2. In the final CFA, we placed
these items with factor 2, where they exhibited the highest loading. In addition,
items from the second area of the literature (Evaluation and Explanation) regarding
data analysis (including computational analysis) (NGSS practices 4 and 5) loaded
highly onto factor 2. These items exhibited factor loadings between .472 and .883.
Factors 3 and 4
The second area of the literature, Evaluation and Explanation, split into factor 3
(Critique, Explanation and Argumentation) and factor 4 (Modeling). Factor 3
encompassed all items pertaining to explanation, argumentation, and using evidence
(NGSS SE practices 6 and 7). All itemsmost associated with this factor loaded highly,
above .718, and none of items showed multidimensionality. Finally, factor 4 included
all items related to modeling (NGSS SE practice 2), with factor loading above .731.
Factor 5
This factor encompassed items that were labeled as traditional or conventional
approaches (Theme 5) by Lee et al. (2009) and Klein et al. (2000), including direct
instruction, demonstrations, and activity sheets. Loadings for items that factored
most highly onto factor 5 ranged from .536 to .771.
Factor 6
Items that were designated as pertaining to student funds of knowledge or real-
world applications demonstrated cohesiveness as factor 6, Prior Knowledge. These
Table 9 Factors emergent from the EFA, with descriptive statistics and Cronbach’s a
Area of the
literature
Factor name NGSS SE
practice
Items Mean SD Cronbach’s
a
Empirical
Investigation
Instigating an Investigation 1, 3 1–4 2.83 .65 .79
Data Collection and Analysis 3, 4, 5 5–9 3.44 .56 .83
Evaluation and
Explanation
Critique, Explanation and
Argumentation
6, 7 17–21 3.18 .74 .88
Modeling 2 14–16 2.75 .75 .79
Traditional
Instruction
Traditional Instruction 22–25 3.81 .58 .74
Prior Knowledge Prior Knowledge 26–28 4.01 .68 .83
K. N. Hayes et al.
123

items were primarily drawn from Lee et al.’s (2009) ‘‘science for understanding’’
construct and loaded between .712 and .866.
Additional Items
Almost all items pertaining to opportunities for science discourse and commu-
nication (items 10–13 and 29–31) loaded onto multiple factors. Extracting fewer
factors did not eliminate the multidimensionality of these variables, indicating a
strong possibility that the items correspond to more than one factor (Bandalos &
Finney, 2010). The multidimensionality makes theoretical and practical sense;
teachers may do communication and discourse activities described in these items as
part of their instructional activities measured by other factors. For example, a
teacher may have students ‘‘work with each other in small groups’’ (item 30) while
‘‘analyzing relationships using charts or graphs’’ (factor 2) or conversely while
‘‘explaining the reasoning behind an idea’’ (factor 3). Due to the practical and
empirical basis for the multidimensionality of discourse and communication items,
we did not test them in the CFA. These items will need additional research to
determine how they might best be used as a psychometrically valid measure of
teacher practices.
Construct Validation Through Confirmatory Factor Analysis (Phase 5)
Using an independent sample (Sample 2, N = 155), we ran a CFA to test the six
factors derived from the EFA (Model 1, Table 11). The resulting statistics met the
GOF cutoff values, except for TLI, which was .01 below the cutoff value
(Table 10). In addition, the factor loadings in this model were consistently high
(between .582 and .882, Table 11).
However, as is often the case in social science research, the residuals (error
terms) of several items were correlated with one another. In order to test the model
in a way that takes into account items with highly correlated residuals, we selected
items to covary based on both modification indices and item similarity (Model 2).
We allowed the residuals to correlate between two pairs of items: 5 and 6 (‘‘Make
and record observations’’ with ‘‘Gather quantitative or qualitative data’’) and 7 and 8
(‘‘Organize data into charts or graphs’’ with ‘‘Analyze relationships using charts or
graphs’’). In each case the similarity in wording and meaning between the two items
could result in participants responding to the items in similar ways—therefore,
items share error covariance. Factor loading and covariance for the two pairs of
items are specified in Fig. 2. The GOF indices for the Model 2 met all criteria for
adequate fit (Table 10). Except for four items, all factor loadings were high (above
Table 10 GOF statistics for CFA models
Model v2 df p value RMSEA CFI TLI SRMR
Factors 1–6 419.29 237 \.001 .07 .91 .89 .07
Factors 1–6 with error term covariance 368.92 235 \.001 .06 .93 .92 .07
Measuring Science Instructional Practice: A Survey Tool for…
123
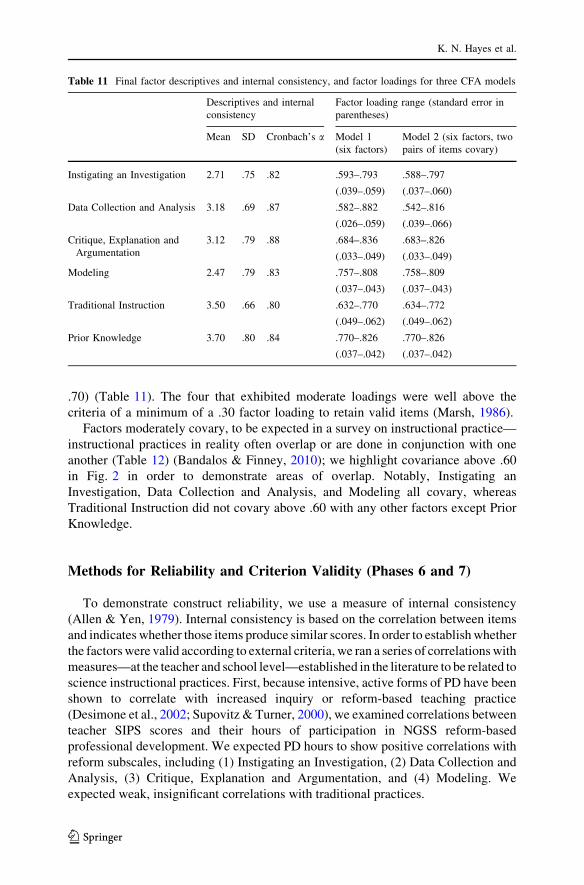
.70) (Table 11). The four that exhibited moderate loadings were well above the
criteria of a minimum of a .30 factor loading to retain valid items (Marsh, 1986).
Factors moderately covary, to be expected in a survey on instructional practice—
instructional practices in reality often overlap or are done in conjunction with one
another (Table 12) (Bandalos & Finney, 2010); we highlight covariance above .60
in Fig. 2 in order to demonstrate areas of overlap. Notably, Instigating an
Investigation, Data Collection and Analysis, and Modeling all covary, whereas
Traditional Instruction did not covary above .60 with any other factors except Prior
Knowledge.
Methods for Reliability and Criterion Validity (Phases 6 and 7)
To demonstrate construct reliability, we use a measure of internal consistency
(Allen & Yen, 1979). Internal consistency is based on the correlation between items
and indicates whether those items produce similar scores. In order to establishwhether
the factorswere valid according to external criteria, we ran a series of correlationswith
measures—at the teacher and school level—established in the literature to be related to
science instructional practices. First, because intensive, active forms of PD have been
shown to correlate with increased inquiry or reform-based teaching practice
(Desimone et al., 2002; Supovitz & Turner, 2000), we examined correlations between
teacher SIPS scores and their hours of participation in NGSS reform-based
professional development. We expected PD hours to show positive correlations with
reform subscales, including (1) Instigating an Investigation, (2) Data Collection and
Analysis, (3) Critique, Explanation and Argumentation, and (4) Modeling. We
expected weak, insignificant correlations with traditional practices.
Table 11 Final factor descriptives and internal consistency, and factor loadings for three CFA models
Descriptives and internal
consistency
Factor loading range (standard error in
parentheses)
Mean SD Cronbach’s a Model 1
(six factors)
Model 2 (six factors, two
pairs of items covary)
Instigating an Investigation 2.71 .75 .82 .593–.793
(.039–.059)
.588–.797
(.037–.060)
Data Collection and Analysis 3.18 .69 .87 .582–.882
(.026–.059)
.542–.816
(.039–.066)
Critique, Explanation and
Argumentation
3.12 .79 .88 .684–.836
(.033–.049)
.683–.826
(.033–.049)
Modeling 2.47 .79 .83 .757–.808
(.037–.043)
.758–.809
(.037–.043)
Traditional Instruction 3.50 .66 .80 .632–.770
(.049–.062)
.634–.772
(.049–.062)
Prior Knowledge 3.70 .80 .84 .770–.826
(.037–.042)
.770–.826
(.037–.042)
K. N. Hayes et al.
123
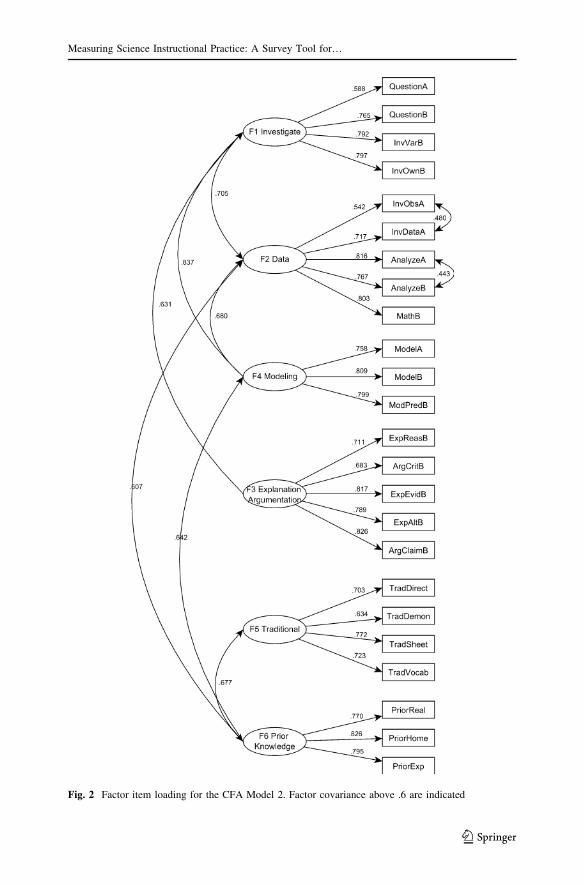
Fig. 2 Factor item loading for the CFA Model 2. Factor covariance above .6 are indicated
Measuring Science Instructional Practice: A Survey Tool for…
123

Second, we examined correlations with school context variables. Inquiry and
hands-on instructional practices have been shown to have a negative relationship
with student poverty (percent of students on FRL) (Supovitz & Turner, 2000) and a
focus on increasing test scores (Hayes & Trexler, 2016). In California, most schools
have to increase their yearly test scores (called the API) a certain percentage; when
they are not able to comply, they encounter sanctions. Several studies have noted a
negative association between the resulting accountability pressure and inquiry
practices (Au, 2007; Hayes & Trexler, 2016). The pressure to increase scores is less
apparent at higher-scoring schools, giving them time and bandwidth for science
education (Center on Education Policy [CEP], 2007). We use the 2012 API score as
a proximal measure of such pressure (if the score is lower, the pressure is higher),
and school FRL percent as a measure of poverty. We expected positive correlations
between scores from factors 1 to 4 and API scores, and negative correlations
between scores from factors 1 to 4 and FRL. We expected weak correlations
between Traditional Instruction and Prior Knowledge and both API and FRL.
Findings Phases 6 and 7
Internal Consistency
Cronbach’s a for each of the six main factors was moderate to high across both
samples (.74–.79 in Sample 1; .80–.88 in Sample 2; Tables 9, 11) (Crocker &
Algina, 1986).
Criterion Validity
As predicted, findings demonstrate low but consistently positive and significant
correlations between the NGSS reform-based teaching practices (factors 1–4) and
reform-based PD hours (Table 13). Also as predicted, Traditional Instruction
demonstrated a negative (but insignificant) relationship with PD hours. However,
contrary to predictions, the use of prior knowledge practices showed a significant
correlation with PD hours. In addition, as expected, NGSS/inquiry-related factors
1–4 demonstrated negative correlations with FRL% and positive correlations with
school API. Poverty and API demonstrated a weak relationship with Traditional
Instruction and Prior Knowledge. Overall, the patterns of correlations between the
Table 12 CFA factor
covarianceFactor 1 2 3 4 5
2 .705
3 .631 .586
4 .837 .680 .594
5 .176 .317 .233 .367
6 .590 .607 .532 .642 .677
K. N. Hayes et al.
123

six factors in the SIPS survey and these indicators showed some evidence for the
criterion validity of the present study.
Discussion and Implications
In this paper, we present the design and validation of a survey instrument (SIPS)
created to measure a range of pedagogical approaches relevant to science education
in the current context of NGSS reform. Since in-service professional development
and policy implementation research often relies on survey tools to obtain data on
teacher practices, the SIPS instrument addresses the need for an updated, valid, and
reliable survey including but not solely related to inquiry. The majority of the
activity-based themes developed through a review of the literature (phase 1) were
reflected in the final CFA, which resulted in six clear factors—Instigating an
Investigation, Data Collection and Analysis, Critique, Explanation and Argumen-
tation, Modeling, Traditional Instruction, and Prior Knowledge—and two additional
multidimensional sets of items (Science Communication and Discourse). Thus, the
SIPS instrument covers NGSS science practices (NRC, 2013) as well as traditional
teaching approaches, and engaging prior knowledge (Lee et al., 2009).
The measures of validity and reliability presented here are supportive of the
survey instrument. The final CFA using an independent sample with six factors
met all GOF indices. In addition, internal consistency for these factors was high
(Cronbach’s a ranged from .80 to .88). Criterion validity results met expectations.
Although the correlations were relatively low, in research on teacher practices the
percent of variance accounted for by predictor variables is also often somewhat low
(e.g., Hayes & Trexler, 2016; Supovitz & Turner, 2000). That said, further research
on the external validity of teacher reporting on this instrument would help support a
robust instrument.
Several noteworthy theoretical implications emerged from the second-round
EFA. First, items from NGSS practice 3 pertaining to data collection (items 5 and 6)
did not exhibit highest factor loading onto NRC’s (2012) proposed sphere of
‘‘Investigating’’ (literature area 1) with other items from NGSS practice 3. Likewise,
data analysis items (7–9) did not load with other elements within literature area 2—
Table 13 Correlations between the factors and measures of criterion validity
Teacher PD (h) School FRL% School API
Instigating an Investigation .21** -.16* .15*
Data Collection and Analysis .17** -.28** .16*
Critique, Explanation and Argumentation .17** -.16* .13*
Modeling .18** -.20** .14*
Traditional Instruction -.12 -.13 .08
Prior Knowledge .13* -.09 .01
N 252 239 239
* p\ .05; ** p\ .01
Measuring Science Instructional Practice: A Survey Tool for…
123

Analysis, Argumentation, and Critique (NRC, 2012). Instead, both data collection
and data analysis items loaded onto a unique factor, factor 2. This loading makes
sense in practical terms; analysis and computational thinking are a natural extension
to the types of empirical observations students often engage in at the 3rd through
10th grade levels. In addition, classroom analysis can, and often does, take place as
part of narrowly defined write-up of calculations and laboratory results. Thus,
teachers may be interpreting these items as procedural rather than as engaging
students in sense-making.
Second, the area of the literature we called Evaluation and Explanation (based on
NRC’s 2012 sphere 2 and 3) resulted in two factors. Critique, Explanation and
Argumentation (factor 3, from NGSS practices 6 and 7) exhibited particularly high
factor loadings (ranging from .638 to .876) and high internal consistency
(Cronbach’s a of .88). Modeling (factor 4) also exhibited high factor loadings
(ranging from .758 to .809) and internal consistency (Cronbach’s a = .83). The
EFA and CFA provide reasonable evidence that these practices make up unique
pedagogical constructs.
Third, although we carefully delineated items into higher and lower levels of
cognition and student-centeredness, these designations did not emerge in the EFA
factor structure; factors were more related to what students did than how they did
them. In other words, engaging in any kind of modeling, whether the cognitive
demand was low (diagram of solar system) or high (conceptual model based on
data) factored together. Likewise, items that involved students to a greater or lesser
degree in decision-making did not appear as a latent construct. Factors instead
pertained to activities—for example, students collecting and analyzing data factored
together, no matter the level of student cognitive involvement. These findings
provide insight into teachers’ conceptualizations of activities versus cognitive
demand. It is possible they recognize the activity (modeling) but not the demand.
This is an important finding to consider in light of recent teacher education efforts
focused on helping teachers recognize activities with high cognitive demand
(Tekumru Kisa & Stein, 2015).
The amount of time teachers indicated engaging in each area of instructional
practice reported here also provides a preliminary window into teacher practices, as
well as suggesting areas of future research. First, in both samples, teachers reported
engaging in Modeling (factor 4) the least (M = 2.75; 2.47 Sample 1 and Sample 2,
respectively), closely followed by Instigating an Investigation (factor 1) (M = 2.83;
2.71, respectively) and Critique, Explanation and Argumentation (factor 3)
(M = 3.18; 3.12, respectively). The relatively and consistently low average ratings
for factors 3 and 4 correspond to scholarship that suggests modeling, explanation,
and argumentation are the least familiar to teachers and the least often implemented
(Capps & Crawford, 2013; Forbes et al., 2013). However, low scores on Instigating
an Investigation are less explicable; although teachers often report less time on
inquiry than traditional practices, inquiry scores are usually not the lowest rated
instructional practices (Forbes et al., 2013). The low rating could be due to the
emphasis in these items on student decision-making (the lowest rated item in that
factor and on the entire survey was ‘‘[students] design or implement their OWN
investigations;’’ 2.19). As expected, Traditional Instruction averaged relatively high
K. N. Hayes et al.
123

(M = 3.81 and 3.50, Sample 1 and Sample 2, respectively), although not the highest,
which was Prior Knowledge (M = 4.01 and 3.70, respectively). The consistency in
subscale ratings over the two independent samples is an indication of both the
reliability of the survey instrument and the tendency of teachers’ practices to exhibit
consistency (Cuban, 2013).
Overall, this study presents a valid and reliable survey tool for measuring shifts in
teacher instructional practices. The SIPS instrument is critical for researchers and
teacher educators interested in understanding such instructional shifts in large
samples of teachers, whether measuring results from targeted professional
development or the implementation of broad science education policies. Further
research in this area will inform a nuanced understanding regarding teachers’
struggles implementing NGSS SE practices (factors 1–4). For example, will the
factors shift to encompass the level of student decision-making and cognitive
demand as teachers become more familiar with the NGSS SE practice progressions?
What kinds of professional development activities will allow teachers to move along
the continuum toward higher cognitive demand? Which instructional practice will
respond most readily to targeted professional development? And finally, will
context (poverty, policy milieu) play a role in teachers’ progress on various
instructional practices?
Limitations and Additional Refinement
Any survey instrument of instructional practices filled out by teachers has
inherent issues of validity, as teachers may rate themselves as implementing the
instructional practice to a greater or lesser extent depending on their perception of
their practice and of the desires of the researchers (Burstein et al., 1995; Desimone
et al., 2002). Ratings are also influenced by the degree to which teachers understand
the construct; for example, teachers may shift their understanding of how and to
what extent they implement Modeling as they come to understand the nature of this
NGSS SE practice. For this reason, some researchers recommend conducting a
retrospective pre-survey (if measuring results of an intervention), or triangulating
survey results with classroom observations (Hill & Betz, 2005). In addition,
researchers should be cautious when using this survey with elementary teachers, as
the available answers (never to daily) may not be interpreted in the same way by
science specialists and self-contained classroom teachers.
We encourage additional refining and testing of the SIPS instrument. As the
implementation of NGSS proceeds, new understandings of the constructs will be
generated among both teachers and researchers, potentially resulting in needed
wording changes or even a realignment of factors toward the student-centered/
cognitive demand continuum. In addition, Communication and Discourse items
clearly overlap with several other factors; researchers interested in using these items
should consider constructing exact factor scores as predictors (Bandalos & Finney,
2010).
Acknowledgments This work was supported by the National Science Foundation Grant No. 0962804.
Measuring Science Instructional Practice: A Survey Tool for…
123
Appendix: Final Survey
Instructional approaches
How often do your students do each of
the following in your science classes?
Never Rarely (a
few times
a year)
Sometimes
(once or
twice a
month)
Often
(once or
twice a
week)
Daily or
almost
daily
1. Generate questions or predictions to
explore
1 2 3 4 5
2. Identify questions from observations
of phenomena
1 2 3 4 5
3. Choose variables to investigate (such
as in a lab setting)
1 2 3 4 5
4. Design or implement their OWN
investigations
1 2 3 4 5
5. Make and record observations 1 2 3 4 5
6. Gather quantitative or qualitative data 1 2 3 4 5
7. Organize data into charts or graphs 1 2 3 4 5
8. Analyze relationships using charts or
graphs
1 2 3 4 5
9. Analyze results using basic
calculations
1 2 3 4 5
10. Write about what was observed and
why it happened
1 2 3 4 5
11. Present procedures, data and
conclusions to the class (either
informally or in formal presentations)
1 2 3 4 5
12. Read from a science textbook or
other hand-outs in class
1 2 3 4 5
13. Critically synthesize information
from different sources (i.e., text or
media)
1 2 3 4 5
14. Create a physical model of a
scientific phenomenon (like creating a
representation of the solar system)
1 2 3 4 5
15. Develop a conceptual model based
on data or observations (model is not
provided by textbook or teacher)
1 2 3 4 5
16. Use models to predict outcomes 1 2 3 4 5
17. Explain the reasoning behind an idea 1 2 3 4 5
18. Respectfully critique each others’
reasoning
1 2 3 4 5
19. Supply evidence to support a claim
or explanation
1 2 3 4 5
20. Consider alternative explanations 1 2 3 4 5
21. Make an argument that supports or
refutes a claim
1 2 3 4 5
K. N. Hayes et al.
123
References
Abd-El-Khalick, F., Boujaoude, S., Duschl, R. A., Lederman, N. G., Mamlok-Naaman, R., Hofstein, A.,
& Tuan, H.-L. (2004). Inquiry in science education: International perspectives. Science Education,
88, 397–419.
Allen, M. J., & Yen, W. M. (1979). Introduction to measurement theory. Monterey, CA: Brooks-Cole.
Anderson, R. D. (2002). Reforming science teaching: What research says about inquiry. Journal of
Science Teacher Education, 13, 1–12.
Au, W. (2007). High-stakes testing and curricular control: A qualitative metasynthesis. Educational
Researcher, 36(5), 258–267.
Bandalos, D. L., & Finney, S. J. (2010). Factor analysis: Exploratory and confirmatory. In G. R. Hancock
& R. O. Mueller (Eds.), The reviewer’s guide to quantitative methods in the social sciences (pp.
93–114). New York: Routledge.
Banilower, E. R., Heck, D. J., & Weiss, I. R. (2007). Can professional development make the vision of the
standards a reality? The impact of the national science foundation’s local systemic change through
teacher enhancement initiative. Journal of Research in Science Teaching, 44, 375–395.
Banilower, E. R., Smith, S. P., Weiss, I. R., Malzahn, K. A., Campbell, K. M., & Weis, A. M. (2013).
Report of the 2012 national survey of science and mathematics education. Chapell Hill, NC:
Horizon Research.
Bartholomew, H., Osborne, J., & Ratcliffe, M. (2004). Teaching students ‘‘ideas-about-science’’: Five
dimensions of effective practice. Science Education, 88, 655–682.
Burstein, L., McDonnell, L. M., Van Winkle, J., Ormseth, T., Mirocha, J., & Guiton, G. (1995).
Validating national curriculum indicators. Santa Monica, CA: RAND Corporation.
How often do you do each of the following
in your science instruction?
Never Rarely (a
few times
a year)
Sometimes
(once or
twice a
month)
Often
(once
or twice
a week)
Daily or
almost
daily
1. Provide direct instruction to explain
science concepts
1 2 3 4 5
2. Demonstrate an experiment and have
students watch
1 2 3 4 5
3. Use activity sheets to reinforce skills or
content
1 2 3 4 5
4. Go over science vocabulary 1 2 3 4 5
5. Apply science concepts to explain natural
events or real-world situations
1 2 3 4 5
6. Talk with your students about things they
do at home that are similar to what is done
in science class (e.g., measuring, boiling
water)
1 2 3 4 5
7. Discuss students’ prior knowledge or
experience related to the science topic or
concept
1 2 3 4 5
8. Use open-ended questions to stimulate
whole class discussion (most students
participate)
1 2 3 4 5
9. Have students work with each other in
small groups
1 2 3 4 5
10. Encourage students to explain concepts
to one another
1 2 3 4 5
Measuring Science Instructional Practice: A Survey Tool for…
123

Calabrese Barton, A. (2002). Learning about transformative research through others’ stories: What does it
mean to involve ‘‘others’’ in science education reform? Journal of Research in Science Teaching,
39, 110–113.
Calabrese Barton, A., Tan, E., & Rivet, A. (2008). Creating hybrid spaces for engaging school science
among urban middle school girls. American Educational Research Journal, 45(1), 68–103.
Campbell, T., Abd-Hamid, N. H., & Chapman, H. (2010). Development of instruments to assess teacher
and student perceptions of inquiry experiences in science classrooms. Journal of Science Teacher
Education, 21, 13–30.
Canale, M., & Swain, M. (1980). Theoretical bases of communicative approaches to second language
teaching and testing. Applied Linguistics, 1, 1–47.
Capps, D. K., & Crawford, B. A. (2013). Inquiry-based instruction and teaching about nature of science:
Are they happening? Journal of Science Teacher Education, 24, 497–526.
Center on Education Policy. (2007). Choices, changes, and challenges: Curriculum and instruction in the
NCLB era. Washington, DC: Center on Education Policy.
Crocker, L., & Algina, J. (1986). Introduction to classical and modern test theory. Orlando, FL: Holt,
Rinehart and Winston.
Cuban, L. (2013). Inside the black box of classroom practice: Change without reform in American
education. Cambridge, MA: Harvard Education Press.
Desimone, L. M., & Le Floch, K. C. (2004). Are we asking the right questions? Using cognitive
interviews to improve surveys in education research. Educational Evaluation and Policy Analysis,
26, 1–22.
Desimone, L. M., Porter, A. C., Garet, M. S., Yoon, K. S., & Birman, B. F. (2002). Effects of professional
development on teachers’ instruction: Results from a three-year longitudinal study. Educational
Evaluation and Policy Analysis, 24, 81–112.
Dorph, R., Sheilds, P., Tiffany-Morales, J., Hartry, A., & McCaffrey, T. (2011). High hopes-few
opportunities: The status of elementary science education in California. Sacramento, CA: The
Center for the Future of Teaching and Learning at WestEd.
Driver, R., Asoko, H., Leach, J., Scott, P., & Mortimer, E. (1994). Constructing scientific knowledge in
the classroom. Educational Researcher, 23(7), 5–12.
Driver, R., Newton, P., & Osborne, J. (2000). Establishing the norms of scientific argumentation in
classrooms. Science Education, 84, 287–312.
Duschl, R. A., & Osborne, J. (2002). Supporting and promoting argumentation discourse in science
education. Studies in Science Education, 38, 39–72.
Forbes, C. T., Biggers, M., & Zangori, L. (2013). Investigating essential characteristics of scientific
practices in elementary science learning environments: The practices of science observation
protocol (P-SOP). School Science and Mathematics, 113, 180.
Garet, M. S., Birman, B. F., Porter, A. C., Desimone, L., & Herman, R. (1999). Designing effective
professional development: Lessons from the Eisenhower Program [and] technical appendices.
Jessup, MD: Editorial Publications Center, US Department of Education.
Germuth, A., Banilower, E., & Shimkus, E. (2003). Test-retest reliability of the Local Systemic Change
teacher questionnaire. Chapel Hill, NC: Horizon Research.
Gogol, K., Brunner, M., Goetz, T., Martin, R., Ugen, S., Keller, U., … Preckel, F. (2014). ’’My
Questionnaire is Too Long!’’ The assessments of motivational-affective constructs with three-item
and single-item measures. Contemporary Educational Psychology, 34, 188–205.
Hayes, K. N., & Trexler, C. J. (2016). Testing predictors of instructional practice in elementary science
education: The significant role of accountability. Science Education. (in press).
Hill, L., & Betz, D. (2005). Revisiting the retrospective pretest. American Journal of Evaluation, 26(4),
501–517.
Hogan, K., Nastasi, B. K., & Pressley, M. (1999). Discourse patterns and collaborative scientific
reasoning in peer and teacher-guided discussions. Cognition and Instruction, 17, 379.
Hu, L., & Bentler, P. M. (1999). Cutoff criteria for fit indexes in covariance structure analysis:
Conventional criteria versus new alternatives. Structural Equation Modeling: A Multidisciplinary
Journal, 6, 1–55.
Huffman, D., Thomas, K., & Lawrenz, F. (2003). Relationship between professional development,
teachers’ instructional practices, and the achievement of students in science and mathematics.
School Science and Mathematics, 103, 378–387.
K. N. Hayes et al.
123

Jimenez-Aleixandre, M. P., & Erduran, S. (2007). Argumentation in science education: An overview. In
S. Erduran & M. P. Jimenez-Aleixandre (Eds.), Argumentation in science education: Perspectives
from classroom-based research (pp. 3–27). Berlin: Springer.
Klein, S., Hamilton, L., McCaffrey, D., Stecher, B., Robyn, A., & Burroughs, D. (2000). Teaching
practices and student achievement: Report of first-year findings from the ‘‘Mosaic’’ study of
Systemic Initiatives in Mathematics and Science. Santa Monica, CA: Rand Corporation.
Krathwohl, D. R. (2002). A revision of Bloom’s taxonomy: An overview. Theory into practice, 41(4),
212–218.
Kuhn, D. (2015). Thinking together and alone. Educational Researcher, 44, 46–53.
Lee, C. D., Luykx, A., Buxton, C., & Shaver, A. (2007). The challenge of altering elementary school
teachers’ beliefs and practices regarding linguistic and cultural diversity in science instruction.
Journal of Research in Science Teaching, 44, 1269–1291.
Lee, O., Maerten-Rivera, J., Buxton, C., Penfield, R., & Secada, W. G. (2009). Urban elementary
teachers’ perspectives on teaching science to English language learners. Journal of Science Teacher
Education, 20, 263–286.
Lemke, J. L. (2001). Articulating communities: Sociocultural perspectives on science education. Journal
of Research in Science Teaching, 38(3), 296–316.
Lemke, J. (2004). The literacies of science. In E. W. Saul (Ed.), Crossing borders in literacy and science
instruction: Perspectives on theory and practice. Newark, DE: International Reading Association.
Llewellyn, D. (2013). Teaching high school science through inquiry and argumentation. Thousand Oaks,
CA: Corwin.
Marsh, H. W. (1986). Global self-esteem: Its relation to specific facets of self-concept and their
importance. Journal of Personality and Social Psychology, 51(6), 1224.
Marsh, H. W., Hau, K.-T., & Wen, Z. (2004). In search of golden rules: Comment on hypothesis-testing
approaches to setting cutoff values for fit indexes and dangers in overgeneralizing Hu and Bentler’s
(1999) findings. Structural Equation Modeling, 11, 320–341.
Marshall, J. C., Smart, J., & Horton, R. M. (2009). The design and validation of EQUIP: An instrument to
assess inquiry-based instruction. International Journal of Science and Mathematics Education, 8,
299–321.
Matsunaga, M. (2010). How to factor-analyze your data right: Do’s, don’ts, and how-to’s. International
Journal of Psychological Research, 3(1), 97–110.
McGinn, M. K., & Roth, W. M. (1999). Preparing students for competent scientific practice: Implications
of recent research in science and technology studies. Educational Researcher, 28, 14–24.
McNeill, K. L., & Krajcik, J. (2008). Scientific explanations: Characterizing and evaluating the effects of
teachers’ instructional practices on student learning. Journal of Research in Science Teaching, 45,
53–78.
Moll, L., Amanti, C., Neff, D., & Gonzalez, N. (1992). Funds of knowledge for teaching, using a
qualitative approach to connect homes and classrooms. Theory into Practice, 31(2), 132–141.
National Research Council. (1996). National science education standards. Washington, DC: The
National Academies Press.
National Research Council (NRC). (2012). A framework for K-12 science education: Practices,
crosscutting concepts, and core ideas. Washington, DC: The National Academies Press.
National Research Council (NRC). (2013). Next generation science standards: For states, by states.
Washington, DC: The National Academies Press.
Norris, S., Philips, L., & Osborne, J. (2008). Scientific inquiry: The place of interpretation and
argumentation. In J. Luft, R. L. Bell, & J. Gess-Newsome (Eds.), Science as inquiry in the secondary
setting (pp. 87–98). Arlington, VA: NSTA Press.
President’s Council of Advisors on Science and Technology (PCAST). (2010). Report to the President:
Prepare and inspire: K-12 education in science, technology, engineering, and mathematics (STEM)
for America’s future. Washington, DC: Executive Office of the President. http://www.whitehouse.
gov/sites/default/files/microsites/ostp/pcast-stemed-report.pdf
Rea, L. M., & Parker, R. A. (2005). Designing and conducting survey research: A comprehensive guide.
San Francisco: Jossey-Bass.
Richmond, G., & Striley, J. (1996). Making meaning in classrooms: Social processes in small-group
discourse and scientific knowledge building. Journal of Research in Science Teaching, 33(8),
839–858.
Rosebery, A. S., Warren, B., & Conant, F. R. (1992). Appropriating scientific discourse: Findings from
language minority classrooms. The Journal of the Learning Sciences, 2, 61–94.
Measuring Science Instructional Practice: A Survey Tool for…
123

Schwarz, C. V., Reiser, B. J., Davis, E. A., Kenyon, L., Acher, A., Fortus, D., … Krajcik, J. (2009).
Developing a learning progression for scientific modeling: Making scientific modeling accessible
and meaningful for learners. Journal of Research in Science Teaching, 46(6), 632–654.
Smith, M. S. (2000). Balancing old and new: An experienced middle school teacher’s learning in the
context of mathematics instructional reform. The Elementary School Journal, 100(4), 351–375.
Smolleck, L. D., Zembal-Saul, C., & Yoder, E. P. (2006). The development and validation of an
instrument to measure preservice teachers’ self-efficacy in regard to the teaching of science as
inquiry. Journal of Science Teacher Education, 17, 137–163.
Stapleton, L. M. (2010). Survey sampling, administration, and analysis. In G. R. Hancock & R.
O. Mueller (Eds.), The reviewer’s guide to quantitative methods in the social sciences (pp.
399–412). New York: Routledge.
Stewart, J., Cartier, J. L., & Passmore, C. M. (2005). Developing understanding through model-based
inquiry. In S. Donovan & J. D. Bransford (Eds.), How students learn: Science in the classroom (pp.
515–565). Washington, DC: National Academies Press.
Supovitz, J. A., & Turner, H. M. (2000). The effects of professional development on science teaching
practices and classroom culture. Journal of Research in Science Teaching, 37(9), 963–980.
Tekkumru Kisa, M. T., & Stein, M. K. (2015). Learning to see teaching in new ways: A foundation for
maintaining cognitive demand. American Educational Research Journal, 52(1), 105–136.
Tekkumru Kisa, M., Stein, M. K., & Schunn, C. (2015). A framework for analyzing cognitive demand
and content-practices integration: Task analysis guide in science. Journal of Research in Science
Teaching, 52, 659–685.
Thorndike, R. M., & Thorndike-Christ, T. (2010). Measurement and evaluation in psychology and
education (8th ed.). Boston: Pearson, Merrill.
Walczyk, J. J., & Ramsey, L. L. (2003). Use of learner-centered instruction in college science and
mathematics classrooms. Journal of Research in Science Teaching, 40, 566–584.
Wertsch, J. V. (1985). Vygotsky and the social formation of mind. Cambridge, MA: Harvard University
Press.
Zimmerman, C. (2007). The development of scientific thinking skills in elementary and middle school.
Developmental Review, 27, 172–223.
K. N. Hayes et al.
123