measuring radioactivity in soil and dust samples from japan · samples in japan, which we used to...
TRANSCRIPT

1
Measuring Radioactivity in Soil and
Dust Samples from Japan An Interactive Qualifying Project Report
Submitted to the Faculty
of the
Worcester Polytechnic Institute
by
Thang Pham
Steven Franca
Son Nguyen

2
Abstract A radioactivity map of Cesium-137, a radioactive material emitted from the Fukushima
Dai-ichi Nuclear Power Plant, was created by examining 30 soil and dust samples originating
from Japan. A Sodium Iodide (NaI) detector measured gamma rays emitted from the samples.
Qualitative evaluation of human exposure to radio-cesium in five sets of locations in Japan
shows the radioactivity of tested samples. The Fukushima section of one of the Olympic
proposed torch route has a 60 times higher activity of Cesium-137 than the activity of the
samples from Tokyo.

3
Acknowledgement Over the course of six months, we received much guidance and assistance from several
individuals and organizations, whose involvement was vital to the success of this project.
Therefore, we would like to take the time to thank to all of those who have supported and helped
us throughout the course of this project.
First, our team would like to thank our advisors, Professor Germano Iannacchione,
Professor David Medich, Professor Izabela Stroe, and Dr. Marco Kaltofen from Worcester
Polytechnic Institute, for taking the time to help us with various aspects of this project.
We give special thanks to Dr. Marco Kaltofen for the help with the gathering of soil
samples in Japan, which we used to test and get our results. In addition, he gave constructive
advice concerning our paper and encouraged us to plan for publication. He really took the effort
to make sure we were on track and that every aspect of the project was correct.
We would also like to thank Professor Germano Iannacchione and Professor David
Medich for allowing us to use their lab space to conduct our research.
Robert DelSignore gave us invaluable help with the setup of the equipment. He wrote up
detailed manuals, which helped us smoothly run our tests.
We would like to thank the sampling team who helped with collecting the samples.
Furthermore, we would also like to thank the many Japanese volunteers who hosted, transported,
introduced and translated for the sampling team.
Funding is an essential part for this project’s completion and we would like to thank the
Fairewinds Energy Education Foundation and the Cynthia and George Mitchell Foundation of
Austin, Texas as well as the many individual donors from all over the worlds for funding the
sampling of radioactive materials in Japan.
Lastly, we would like to thank Worcester Polytechnic Institute for allowing us this
opportunity to help impact the Japanese society.

4
Executive Summary
Overview On March 11th, 2011, a magnitude 9.0 earthquake hit the Fukushima Prefecture of Japan
(AESJ, 2015, p.19). This resulted in major structural damage to the surrounding area. Following
the earthquake, a 13-meter tsunami hit the Fukushima Dai-ichi Nuclear Power Plant and disabled
the backup the diesel backup power generator and the cooling water pumps needed to keep the
Power Plant running in the event of a disaster. Since power restoration was unsuccessful and
there was major structural damage caused to the Units by the tsunami, there were high
concentrations of nuclear particles released into the air.
The amount of radioactive materials emitted from the Power Plant raised health and
environmental concerns to the people living in the areas around the Fukushima Dai-ichi Nuclear
Power Plant. In fact, several studies conducted after the accident determined the activity of
radioactive isotopes in the environments. These studies around Fukushima provided excellent
understanding of the activity of radioactive isotopes in the environment and the health effects on
humans.
With the upcoming XXXII Olympiad in 2020 hosted by Japan, it is necessary to look into
the radioactivity of Olympic venues as well as tourist attractions in the host cities. Previous
studies pose a major gap because they focused on regions that are closer to the Fukushima Dai-
ichi Nuclear Power Plant, where the highest concentration of radioactive fallout is located. On
the other hand, the radioactivity in other locations in Japan is relatively less studied. Since
thousands of athletes and millions of visitors are travelling to Japan for the Olympics, there has
been widespread concern from the international community about radiation exposure. Therefore,
it is important to investigate the extent of radioactive fallout from the Fukushima Dai-ichi
incident.
Project goals and Objectives The goals of the project were to measure the radioactivity of Cesium-137 in soil and dust
samples from Japan and to generate a map that illustrates the activity of Cesium-137 in five
locations in Japan. Understanding the radioactivity in Japan soil would help in giving an
estimation of human exposure to radioactivity in the studied areas. The primary objectives of this
project were to:
Perform soil sample preparation for measurement, including categorizing, drying and
sub-sampling.
Measure the activity of Cesium-137 in the samples and analyze the radioactivity at
different locations in Japan.
Generate a map to illustrate the radioactivity level in Japan soil.
Estimate qualitatively human exposure to radioactivity for people living in the studied
areas.

5
Development of methodology
The employment of various study methods and experiment designs helped complete the
objectives. Through literature review and discussion with advisors and lab instructors, we were
able to develop main steps and setting for our study.
Primarily, we performed preparation for 87 soil and dust samples collected in Japan and
transferred to Worcester Polytechnic Institute (WPI). The samples were classified into five
categories based on their original location: Tokyo samples, Azuma Sports Park samples,
proposed torch route samples, tourist route samples and non-Olympic samples. All the samples
were dried and sub-sampled so that their physical conditions were consistent throughout the
testing phase. From the 87 samples that are dried and sub-sampled, we eventually further
narrowed to 30 samples for radioactivity measurement.
Previous studies on radioactive nuclides accumulation in soil and dust samples from
Japan identified that Cesium-137 had the highest concentration among radionuclides in Japan
soil (Saito et al., 2015). Therefore, we set our goal to measure the activity of Cesium-137 in the
samples from Japan. A thallium-activated sodium iodine detector, or NaI (TI) detector, measured
the concentration of Cesium-137 in the soil samples. The calibrating sources used for Cesium-
137 measurement were Cesium-137, Sodium-22 and Manganese-54. The experiment reported
the radioactivity of the background and the radioactivity of Cesium-137 in the samples above the
background. Measurements were made in triplicate to provide counting variability statistics.
At the beginning of the project, samples were selected randomly for measurement. Our
focus then shifted, as we looked deeper into the four main areas that will be important to the
XXXII Olympiad in 2020. These Olympic areas included Azuma Sports Park, tourist attractions
in Tokyo, a proposed torch route, and official designated tourist routes. Time constraint and large
amount of samples, limited testing which resulted in results on only a limited part of each sample
set.
After finishing measuring, the radioactivity of the soil and dust samples helped generate a
map that shows the activity of Cesium-137 in Japan soil. Since there was a large variation in the
measured activity between samples at different locations, we decided to analyze the results based
on the samples’ original locations.
Our results were cross-referenced with information and results gathered from literature
reviews. Understanding the activity of Cesium-137 in Japan soil, we were able to give a
qualitative estimation of human exposure.
Results and Analysis By the end of the project, we were able to measure the activity of Cesium-137 in 30 soil
and dust samples. The results showed a great variation in radioactivity between samples from
different locations. The activity of Cesium-137 in the 30 samples ranged from 38.6 Bq/kg to
28041.5 Bq/kg with the mean radioactivity of 4903.3 Bq/kg (standard deviation, σ= 6611.0
Bq/kg).
Among the five categories of locations, the Tokyo sample set had the lowest radioactivity
mean of 117.6 Bq/kg. The following locations are ordered by increasing mean of radioactivity:
Azuma Sports Park samples (2703.9 Bq/kg), main tourist routes samples (3206.0 Bq/kg) and
proposed torch route samples (7896.0 Bq/kg). Only one of the non-Olympic samples, which

6
originates from the Entrance to Fukushima Dai-ichi waste mounds, had a radioactivity of
14119.8 Bq/kg. Due to this outlier, this sample set was omitted from the other sets.
The measured results showed that the Tokyo sample set had the lowest radioactivity
level, which was understandable based on its significant distance from the Fukushima Nuclear
Power Plant. On the contrary, the proposed torch route samples had the highest mean
radioactivity due to their close proximity to the plant. Based on the measurement, we estimated
qualitatively that the radiation exposure of people living near the Azuma Sports Park area was
20.7 times higher than that of people living in Tokyo. The main tourist and proposed torch routes
had radiation exposure of 24.6 and 60.6 times higher, respectively, than in Tokyo.
The results in this study were in agreement with published results qualitatively. Saito et
al. reported a much higher deposition of Cesium-137 in the area to the northeast of the
Fukushima Nuclear Power Plant and the further away from the plant, the lower the deposition of
Cesium-137 (2015). Accordingly, our results showed that the highest radioactivity level was at
the proposed torch route, which is located to the northeast of the plant. The further away from
the plant for example, in Tokyo and the Azuma Sports Park, the lower the activity of Cesium-
137. However, because of the differences in sampling techniques and reported unit of
radioactivity, there could not be an established direct comparison.
Recommendations Given the aforementioned results, there is significant evidence through our testing, that
there are still high amounts of radiation in areas close to the Fukushima Prefecture. Past and
current tests found that high amounts of radiation remain at the origin of the disaster. The results
showed a significantly higher amount of radioactive materials in the proposed torch route
compared to those in Tokyo.
Given the results from testing, we confidently make the following recommendations:
1. Further study on the activity of Cesium-137 on the proposed torch route is necessary to
understand how much radioactive materials remain.
2. A more detailed study with more soil and dust samples can give a more accurate map of
specific areas of interest.
3. Olympic officials should consider using the results of this project to decide whether the
radioactivity level at the proposed torch route and the Olympic venues are within acceptable
level.
4. Qualified health professionals should use this data to make connections about short and
long-term effects on health.

7
Authorship
Primary
Author(s)
Primary
Editor(s)
Abstract Steven/Thang All
Acknowledgement Steven All
Executive Summary All All
Introduction Steven/Thang All
Background
Fukushima Dai-ichi nuclear disaster Steven All
Radiation Thang All
Locations of Interest Son All
Methodology
Objective 1: Prepare soil samples for measurement Thang All
Objective 2: Measure the radioactivity of Cs-137 in
the samples
Thang All
Objective 3: Generate a map to illustrate the
radioactivity level of Japan soil
Thang All
Findings
Finding 1 Thang All
Finding 2 Thang All
Finding 3 Thang Thang
Discussions and Recommendations
Discussion All All
Limitations of methodology Son/Thang All
Summary All All
Recommendation Steven All
Appendix All All
Other tasks
Samples preparation All
Sample radioactivity measurement All
Maps creating Thang
Report formatting Son

8
Table of Contents
Abstract ........................................................................................................................................... 2
Acknowledgement .......................................................................................................................... 3
Executive Summary ........................................................................................................................ 4
Overview ..................................................................................................................................... 4
Project Goals and Objectives ...................................................................................................... 4
Development of Methodology .................................................................................................... 5
Results and Analysis ................................................................................................................... 5
Recommendations ....................................................................................................................... 6
Authorship....................................................................................................................................... 7
Table of Contents ............................................................................................................................ 8
List of Figures ............................................................................................................................... 10
List of Tables ................................................................................................................................ 11
1. Introduction ............................................................................................................................... 12
2. Background ............................................................................................................................... 14
2.1 Fukushima Dai-ichi nuclear disaster ................................................................................... 14
2.1.1 Radiation Testing Results ............................................................................................. 14
2.1.2 Radiation Standards for Consumption .......................................................................... 15
2.1.3 Aftermath ...................................................................................................................... 15
2.2 Radiation ............................................................................................................................. 16
2.2.1 Overview ...................................................................................................................... 16
2.2.2 Radioactivity Measurement .......................................................................................... 16
2.2.3 Gamma Radiation ......................................................................................................... 16
2.2.4 Previous Studies ........................................................................................................... 17
2.3 Locations of Interest ............................................................................................................ 18
2.3.1 Overview ...................................................................................................................... 18
2.3.2 Imperial Palace of Tokyo ............................................................................................. 19
2.3.3 Azuma National Sports Park ........................................................................................ 19
2.3.4 Olympic proposed torch route passing through the Fukushima Prefecture .................. 19
3. Methodology ............................................................................................................................. 20
3.1 Prepare soil samples for measurement. ............................................................................... 20
3.1.1 Overview ...................................................................................................................... 20

9
3.1.2 Sample classification .................................................................................................... 20
3.1.3 Sample drying ............................................................................................................... 20
3.1.4 Sub-sample creating ..................................................................................................... 21
3.2 Measure the radioactivity of Cs-137 in the samples ........................................................... 21
3.2.1 Lab Setup ...................................................................................................................... 21
3.2.2 Measurement Procedure ............................................................................................... 24
3.2.3 Data Analysis ................................................................................................................ 25
3.3 Generate a map to illustrate the radioactivity level of Japan soil........................................ 26
4. Findings..................................................................................................................................... 28
4.1 Sample preparation and parameters measurement .............................................................. 28
4.1.1 Sample preparation ....................................................................................................... 28
4.1.2 Detector Efficiency ....................................................................................................... 28
4.2 Radioactivity measurement ................................................................................................. 29
4.2.1. Background measurement ........................................................................................... 29
4.2.2. Control samples ........................................................................................................... 29
4.2.3. Japan soil and dust samples measurement ................................................................... 29
4.3 Japan soil radioactivity maps .............................................................................................. 30
4.3.1 Overall heat map ........................................................................................................... 30
4.3.2 Tokyo sample ............................................................................................................... 31
4.3.3 Azuma Sports Park Sample .......................................................................................... 32
5. Discussions and Recommendations .......................................................................................... 37
5.1 Discussions .......................................................................................................................... 37
5.2 Limitations and Follow-up Study ........................................................................................ 38
5.3 Conclusion ........................................................................................................................... 38
5.4 Recommendations ............................................................................................................... 38
References ..................................................................................................................................... 40
Appendix A. Sample Preparation ................................................................................................. 43
Appendix B. Equipment................................................................................................................ 44
Appendix C. Efficiency measurement and blank measurement ................................................... 45
Appendix D: Sample measurement .............................................................................................. 45

10
List of Figures Figure 1: Gamma radiation emission rate for four common calibration sources. (Knoll, 2010) .. 17
Figure 2: Sodium iodide (NaI) detector surface containing five concentric zones ....................... 22
Figure 3: High Voltage Power Supply setting .............................................................................. 24
Figure 4: Multi-channel analyzer (MCA) setting ......................................................................... 24
Figure 5: Acquisition setting ......................................................................................................... 25
Figure 6: Sample of a .cvs file generated by ProSpect®. Data from sample 024S. ..................... 25
Figure 7: A sample of the .cvs file used in Google Map. ........................................................... 26
Figure 8: Efficiency profile as a function of distance from the center ......................................... 28
Figure 9: Histogram showing the number of soil samples from Japan by order of magnitude of
radioactivity of 137Cs in Bq/kg. ................................................................................................... 30
Figure 10: Overall activity of 137Cs in Japan soil and dust samples. .......................................... 31
Figure 11: Activity of 137Cs in Tokyo soil and dust samples. ..................................................... 32
Figure 12: Activity of 137Cs in Azuma Sports Park soil and dust samples. ................................ 33
Figure 13: Activity of 137Cs in Tourist route soil and dust samples. .......................................... 34
Figure 14: Activity of 137Cs in Proposed torch route soil and dust samples. .............................. 35
Figure 15: Activity of 137Cs in Non-Olympic soil and dust sample. .......................................... 36
Figure 16: Samples drying by keeping them open to ambient air in one week (62.2 °F, 22%
humidity and 1 atm) ...................................................................................................................... 43
Figure 17: Sample ordering. ......................................................................................................... 43
Figure 18: Sodium Iodide (NaI) detector. ..................................................................................... 44
Figure 19: Cesium-137 in a Whirlpak® bag. ................................................................................ 45
Figure 20: Sodium iodide (NaI) detector surface was divided into seven concentric zones. ....... 45
Figure 21: Efficiency measurement setup..................................................................................... 46
Figure 22: Background measurement setup. ................................................................................. 46
Figure 23: Sample measurement setup. ........................................................................................ 47

11
List of Tables Table 1: Cesium regulation values in food (Bq/kg) ....................... Error! Bookmark not defined.
Table 2: Measurement details for each sample ............................................................................. 23
Table 3: Number counts for the three background measurements. .............................................. 29

12
1. Introduction On March 11th, 2011, a magnitude 9.0 earthquake hit the Fukushima Prefecture of Japan
(AESJ, 2015, p.19). Following the earthquake, a 13-meter tsunami hit the Fukushima Dai-ichi
Nuclear Power Plant and disabled the diesel backup power generator and the cooling water
pumps needed to keep the Power Plant running in the event of a disaster. Since power restoration
was unsuccessful and there was major structural damage caused to the reactor units by the
tsunami, there were high concentrations of nuclear particles released into the air.
The amount of radiation emitted from the Power Plant raised health and environmental
concerns to the people living in the areas around the Fukushima Dai-ichi Nuclear Power Plant. In
fact, several studies conducted after the accident determined the activity of radioactive isotopes
in the environments. These studies investigated the transportation of radioactive materials in the
atmosphere to the deposition of radioactive nuclides in Japan soil. Morino et al. used a chemical
transport model to simulate the transport and deposition of Iodine-131 and Cesium-137,
estimating that approximately 13% of Iodine-131 and 22% of Cesium-137 emitted from the
Nuclear Power Plant were distributed in Japan soil (2011). Yasunari et al. measured the
deposition of Cesium-137 in Japan soil and created a radiocesium deposition map, showing that
Cesium-137 was highly deposited in eastern and northeastern of Japan (2011).
More recently, Saito et al. measured the deposition of radioactive nuclides in 10,915 soil
samples within 100 km from the Fukushima Dai-ichi Nuclear Power Plant and concluded that the
amount of radioactive cesium was much higher than other radioactive nuclides (2015). Kaltofen
et al. isolated and analyzed the activity of radiocesium in 180 dust and soil samples from Japan,
showing a high mean radioactivity of 25.7 kBq/kg among the sample set (2017). These studies
around Fukushima provided excellent understanding of the activity of radioactive isotopes in the
environment, which can translate into health effects on humans.
With the upcoming Games of the XXXII Olympiad in 2020 hosted by Japan, it is
necessary to look into the radioactivity of Olympic venues as well as tourist attractions in the
host cities. Previous studies pose a major gap because they focused on regions that are closer to
the Fukushima Dai-ichi Nuclear Power Plant, where the highest concentration of radioactive
fallout is located. On the other hand, the deposition in other locations in Japan is relatively less
studied. Since thousands of athletes and millions of visitors are travelling to Japan for the
Olympics, there has been widespread concern from the international community about radiation
exposure. Therefore, it is important to investigate the extent of radioactive fallout from the
Fukushima Dai-ichi incident.
In this study, we addressed this concern by measuring the activity of Cesium-137 in 30
soil and dust samples from tourist attractions and Olympic venues in the Fukushima Prefecture
and in Tokyo. Some of the noteworthy locations include the Imperial Palace, Azuma Sports
Park, as well as various points in the Olympic proposed torch route and tourist route intersecting
the Fukushima prefecture.
The goals of this project were to measure and document the radioactivity of soil and dust
samples from Japan, generate an activity map of Cesium-137 in Japan soil, and qualitatively
estimate human exposure to Cesium-137 among the five locations. A sodium iodide (NaI)
detector with ProSpect® software analyzed the data from radioactive measuring of the soil and
dust samples. Using Google Maps, a map shows the Cesium-137 activity in the samples.

13
Cesium-137 was the only radionuclide studied because it has the longest half-life among the
emitted radioisotopes from the Fukushima Nuclear Power Plant and is the highest deposited
radioisotope (Saito et al., 2015).
The measured radioactivity of soil in Japan from the study can be used as a database for
further interpretation in choosing suitable locations for the Olympic.

14
2. Background This chapter gives background details around the Fukushima Dai-ichi Nuclear Power
Plant disaster, which occurred in 2011. Details give how much emitted radiation occurred in the
following months. Other areas of discussion include the basics to radioactive terminology used in
the paper, the methods used to test the samples gathered from Japan and previous studies on
radiation emitted from the Nuclear Power Plant. Finally, information about the samples’ location
of origin discuss the importance of those areas.
2.1 Fukushima Dai-ichi Nuclear Disaster Fukushima City is located in the Fukushima Prefecture, which has an area of 5,320 mi2;
Japan’s third largest out of 43 total prefectures. It is located on the South Eastern part of the
country and is perfect for shipping routes especially in the coastal region of Hokkaido and
Tohoku. Currently there is around 1.9 million people living in the entire Fukushima area. (Future
From Fukushima, 2018) The weather makes this region comfortable to live in and is not
susceptible to many natural disasters; only small, undisruptive earthquakes are common to the
country of Japan. Around the city of Fukushima, mountainous areas and many national parks
attract many tourists to this vibrant area (Jnto Japan: The Official Guide).
Since this prefecture expands to the coastline, the Fukushima Dai-ichi Nuclear Power
Plant commissioned in 1971, thrived off being close the water and located far from any major
cities. The power plant, comprised of six reactors, generating around 4.7 million kW, which is a
significant portion of the total energy generated in the country (INES, 2015, p.7). The oldest unit,
Unit 1 and the oldest, Unit 6 have varying differences mainly including function. For example,
Unit 6 has more efficient jet pumps to allow for better water circulation that in Units 4 and 5.
At 14:46 JTC on Friday March 11th 2011, a magnitude 9 earthquake originating near the
towns of Naraha and Tomioka, triggered a chain of events that would ultimately result in a level
7 nuclear event (INES, 2015, p.19). The earthquake itself only prompted the automatic shutdown
of the fission reactions at the active reactors. This is the fourth largest earthquake recorded in
world history.
In 1990, the International Atomic Energy Agency (IAEA) introduced the International
Nuclear and Radiological Event Scale (INES), which gives a scale on how much response and
protocol is associated to a particular nuclear event. This scale range from zero to seven. A zero
on the scale simply refers to a lack of breach of safety. A one on the scale refers to an anomaly,
which corresponds to a leak of nuclear particles contained only in a small area, which does not
cause much harm (INES, 2017). In the case of Chernobyl and the Fukushima Dai-ichi disaster,
they were both rated a seven, which is the highest value on the scale and considered a major
threat to safety for workers and people around the area. To give a scale about the different levels,
they increase logarithmically which means that every level increase represents a ten times greater
severity level (INES, 2017).
First, the earthquake damaged external power supplies, which automatically caused the
nuclear reactors to shut down their power. When the power cut, emergency diesel generators
activated which restored power to all of the Units except for Unit 4, which was under inspection
at the time of the earthquake (INES, 2015, p.19). Not a lot of physical damage to the reactors as
reported by officials inspecting the damage.

15
Around an hour after the earthquake, a tsunami caused by the earthquake hit the coast of
Japan. TEPCO reported that the height of the tsunami was around 13 meters (AESJ, 2015, p.20).
Warnings issued in the area alerted citizens to prepare for incoming water. As the seawater
entered the land, the Fukushima Dai-ichi Nuclear Power Plant Units flooded. In turn, the power
cut and could not be restored. Emergency plans included rerouting power and generation power
for the plants off site but the water damage was critical enough to render those plans useless. In
addition, debris from affected structures hindered any help. This massive tsunami ranked as
fourth largest in recorded history. Over the span of 3 days from March 12th to March 15th, the
cores in Unit 1, 2 and 3 melted and released radioactive particles in the environment (AESJ,
2015, p.222). These radioactive particles not only spread all over Japan, but also spread to
adjacent countries as well as in the ocean. Unit 2 caused the most damage because damage to the
structure itself allowed the escape of particles into the atmosphere (AESJ, 2015, p.31).
2.1.1 Radiation Testing Results
Air tests revealed that the areas around Fukushima, around 24 km from ground zero,
experienced a spike in µSv/h. The highest reported reading was around 24 µSv/h (AESJ, 2015,
p.75). To give perspective, 100 µSv/h will give heightened sickness risk and 20 µSv/h will give
sickness risk (Shoebridge, 2012). Both of these, considered high danger. To be considered safe,
the reading had to be around 1 µSv/h. At around 5 µSv/h, there is an elevated risk and
relocations are suggested (Shoebridge, 2012). 10 days after the earthquake, the levels ranged
from around 3 µSv/h to 7 µSv/h (AESJ, 2015, p.75).
2.1.2 Radiation Standards for Consumption
In Japan, there are standards for the concentration of radiation in food allowed in the
country. In 2012, these standard values were reduced and the current value is 100 Bq/kg (Stefan
Merz, Katsumi Shozugawa, and Georg Steinhauser; Analysis of Japanese Radionuclide
Monitoring Data of Food Before and After the Fukushima Nuclear Accident; Environ. Sci.
Technol. 49, 5, 2875-2885).
During any major disaster, the government has a responsibility to keep its citizens safe by
taking the right precautions and following procedures. The main responsibilities include
effectively moving resources to help with relief and conducting the proper research, which will
in turn cause less harm to workers and reduce damage in general. The licensee operating any
nuclear power plant can sufficiently fulfill the government’s rules and regulations, but it does not
mean that those rules are sufficient for the safety of the power plant. These regulations are not
always the most current and with ever changing technology, we get a barebones outline of how a
licensee can ignore many risk factors that the government’s rules do not cover. It is easy for them
to not take further action to improve upon safety.
2.1.3 Aftermath
During the disaster, as expected, the government issued warnings of a possible tsunami in
the area, which just experienced the earthquake. Response teams executed the procedures in the
event of a nuclear meltdown from the Fukushima Dai-ichi Power Plant. Around six hours after
the earthquake hit, the Governor of Fukushima ordered an evacuation of the residents living in
the towns where the earthquake’s origin was. At the start of the evacuations, a 3 km radius was

16
designated. By the next day, the evacuation radius grew to 20 km because of the severity of the
events. At the peak of the incident, the radius grew to 30 km around the Fukushima Dai-ichi
plant because wind and air carried particles to the surrounding area (AESJ, 2015, p.323).
Fortunately, for the citizens in the Fukushima Prefecture, there were no casualties
resulting from the Fukushima Dai-ichi nuclear meltdown. However, long-term effects from
radiation exposure are possible. Thyroid cancer in children is a concern. With the 2020 Summer
Olympics set in Tokyo, Japan, a major focus is to examine if the areas designated for the games
is safe for the athletes, staff, and all in attendance. Furthermore, with a proposed torch route and
some of the events set to be held in parts of the Fukushima Prefecture it is our group’s primary
concern to look into the samples of origination from the aforementioned locations first.
2.2 Radiation
2.2.1 Overview
Radiation is the emission or transmission of energy in the forms of waves or particles
through space. There are four types of radiation: Charged particulate radiation (including Fast
electrons and Heavy charged particles) and uncharged radiation (including Electromagnetic
radiation and Neutrons). A more detailed description for each category of radiation can be found
in “Radiation Detection and Measurement” (Knoll, 2010).
Our project studied gamma radiation, a source of Electromagnetic radiation.
2.2.2 Radioactivity Measurement
Radioactivity, or the activity of a radionuclide, is the rate of decay. A radionuclide
(radioisotope) is an atom that possesses excess nuclear energy and thus is unstable. The
International System of Units (SI) unit for radioactivity measurement is Becquerel (Bq), defined
as one disintegration per second.
Different radiations have different energy levels. The traditional unit for radiation energy
measurement is electron volt (eV).
2.2.3 Gamma Radiation
Gamma radiation, or gamma ray, is a penetrating electromagnetic radiation. Gamma
radiation is often emitted during radioactive decay when a parent radionuclide decays to a
daughter nucleus that initially exists in an excited state. This decay released gamma ray photon
with an energy equal to the difference between the two energy states. Because different
radioisotopes release gamma rays at different energy levels, identification of the radioisotope
uses the comparison of its gamma radiation energy to literature values. For example, 137Cs, the
radionuclide of interest in this project, emits gamma photons of 662 keV. For other
radioisotopes, the typical energy for gamma ray radiation is above 100 keV.
Four common widely used calibration sources are 𝑁𝑎1122 , 𝐶𝑜27
57 , 𝐶𝑜2760 and 𝐶𝑠55
137 (Knoll,
2010). Their absolute gamma emission rates are depicted in the decay diagrams below.

17
Figure 1: Gamma radiation emission rate for four common calibration sources. (Knoll, 2010)
To illustrate, in Fig. 1, the 0.662 MeV gamma photon is only observed during 85% (not
100%) of Cesium-137 decay because of a competing de-excitation mode for the excited Barium-
137 nucleus.
The four main radionuclides emitted from Japan include 137Cs (half-life 30.17 years), 134Cs (half-life 2.06 years), 131I (half-life 8.02 days), 129mTe (33.6 days) and 110mAg (249.79
days). Because this project was conducted more than 6 years after the Fukushima disaster, our
study aimed to measure the radioactivity of only 137Cs in soil samples because its half-life is the
highest and it was reported to be the most abundant radionuclide emitted from the Fukushima
Nuclear Power Plant.
2.2.4 Previous Studies
Several studies indicate the distribution and deposition of gamma ray emitting
radionuclides from the Fukushima Dai-ichi Nuclear Power Plant. The topics of these studies
range from the radionuclide transport in the air to the deposition in water and soil. Morino et al.
(2011) used the chemical transport model to study the deposition of radioactive materials in the
air after the Fukushima disaster. Nagao et al. studied the export of 134Cs and 137Cs in the
Fukushima river systems, showing that rain events are one factor contributing to the transport of
radiocesium in the river (2012). Saito et al, analyzed 10,915 soil samples to study the deposition
of gamma-ray emitting radioactive nuclides in the soils within 100 km from the Fukushima
Nuclear Power Plant (2015). The large of number of studies on radionuclides from the disaster
have shown the public’s concern on human health and environment. Among the articles studying
on deposition of radionuclides in the soil, there were two main approaches: one concentrating on
the depth distribution of deposited radionuclides in the soil, the other focusing on the deposition
of radionuclides on the surface of the soil. These studies around Fukushima provided excellent

18
understanding of the activity of radioactive isotopes in the environment, which can translate into
health effects on humans.
In the former category, Tanaka et al. studied the vertical profile of 131I and 137Cs in soil in
Fukushima prefecture (2011). Their results showed that highest distribution of the Iodine and
Cesium radionuclides occur close to the surface at depths of 0 to 5 cm, suggesting that studying
the deposition of 137Cs on the surface soil could be more important than the depth distribution.
In the latter category, Yasunari et al (2011) estimated the distribution of 137Cs in Japan
soils due to the Fukushima nuclear accident using Lagrangian particle dispersion model.
Kinoshita et al. (2011) measured the concentration of five radioisotopes (137Cs, 136Cs, 134Cs, 131I, 129mTe and 110mAg) in the soil using a high pure germanium detector. Saito et al. (2015) showed
that the four main radionuclides emitted from the Nuclear Power Plant are 137Cs, 131I, 129mTe and 110mAg. The study concluded that the radiation doses from radioactive Cesium were found to be
much higher than those from other radioisotopes. Kaltofen et al. isolated and analyzed the
activity of radiocesium in 180 dust and soil samples from Japan, showing a high mean
radioactivity of 25.7 kBq/kg among the sample set (2017).
2.3 Locations of Interest
2.3.1 Overview
To examine the effect of nuclear fallout from the Fukushima accident, our research
looked into dust and soil samples collected from the Fukushima prefecture as well as regions that
are relatively far away from the Fukushima Dai-ichi site. Specifically, our team chose to focus
on samples collected from the Fukushima prefecture as well as the Tokyo prefecture. Among our
locations of interest were the Azuma National Sports Park which is the Olympic baseball
stadium, the Imperial Palace of Tokyo, the Meiji Shrine, and several sites in the Fukushima
prefecture that are going to be parts of a possible Olympic proposed torch route. Regarding our
choice of sample, the Fukushima prefecture was an obvious choice due to its vicinity to the
original site of the meltdown, the Fukushima Dai-ichi Nuclear Power Plant. On the other hand,
we chose to investigate samples in the Tokyo prefecture and specifically, Tokyo city, because we
wanted to examine whether regions that are relatively far away from Fukushima are in the range
of the nuclear fallout from the Fukushima-Fukushima Dai-ichi accident. Furthermore, Tokyo city
was an important choice due to its importance as the capital of Japan and one of the world's
busiest and most populous city. Another thing that we were primarily mindful of was that Tokyo
is also one of Japan's prime tourist destination as the city welcomed nearly 12 million visitors in
just 2015 alone.
More importantly, it is worth noting that the 2020 Summer Olympic will be primarily
held in Tokyo with some minor softball and baseball preliminary games held in
Fukushima. Thus, an already impressive number of tourists visiting Tokyo is only going to
increase and Fukushima city will also see an uptick in the number of tourists visiting as well
come to the Olympics games in 2020. This uptick influenced our decision to look into samples
from Tokyo and Fukushima. To be more specific, the Azuma National Sports Park, located in the
Fukushima Prefecture, is going to be the venue for baseball and softball games. Meanwhile, the
Imperial Palace in Tokyo and the Meiji Shrine, aside from being a top-rated tourist attraction, are

19
also included in the "heritage zone" that will be used as part of the cycling route for the
Olympics.
2.3.2 Imperial Palace of Tokyo
Our first location of interest was the Imperial Palace of Tokyo or 皇居 in Japanese, a
location of great importance and prestige in Japan as well as one of Tokyo’s most popular tourist
attraction. The Imperial Palace of Tokyo, also known as the Imperial Residence, as its name
suggested is comparable to Japan as the Buckingham Palace is to Britain. Not only is the
Imperial Palace of Tokyo of great historical significance it is the residence of the Emperor of
Japan, his consort, the Empress and their extended family, and all 19 members of the Imperial
Family. Built on the site of the old Edo Castle, which traced its origin way back to the Tokugawa
Shogunate, the Imperial Palace bore witness to Japan's decline during the Second World War as
well as the country's resurgence during the modern era (JNTO, 2014). Moreover, the Imperial
Palace of Tokyo is an extremely foot trafficked landmark that attracts hundreds of thousands of
tourists every year as well (Kyodo, 2015). With most of the Olympic Games held in Tokyo, the
number of tourists that are going to visit the Imperial Palace of Tokyo will increase substantially
come the Olympics. Most importantly, as part of the 2020 Olympics, the Imperial Palace is also
going to host Olympic venues for the cycling competitions.
2.3.3 Azuma National Sports Park
Another location of interest was the Azuma National Sports Park. The National Sports
Park is in Fukushima city. The Stadium itself can contain about 6000 spectators, and the
organizer expects that most of these seats to be filled by the time the Olympic torch is lit in
Tokyo. Since some of the preliminary baseball and softball games held at the Azuma National
Sports Park in the Fukushima Prefecture, the Japanese government wished to show the world
that this region as a whole has entirely recovered from the Fukushima Dai-ichi incident and now
safe to inhabit. Although the Azuma National Sports Park is located within the Fukushima
prefecture, it is located 90 km northwest of the Fukushima Dai-ichi nuclear power plant.
2.3.4 Olympic Proposed Torch Route Passing Through the Fukushima
Prefecture
Our last location of interest was the area in the Fukushima prefecture that is going to be
part of the Olympic proposed torch route. Compared to other two sites, these areas are neither
tourist attractions nor places of great importance and historical significance. These locations
remain of great interest because some points are relatively close to the Fukushima Dai-ichi plant.
Furthermore, this area is also close to the mountain range in the Fukushima prefecture where
most of the prefecture's natural water resources are located. More importantly, this area is also
close to farmland that produces vegetables and plants for local and exported use. This is a good
reason to look into the samples collected here to see whether the agriculture areas in the
Fukushima prefecture has nuclear fallout and radioactive material.

20
3. Methodology
The goals of the project were to measure the radioactivity of Japan soil, to document the
results and to generate a map that illustrates the soil radioactivity level at different locations in
Japan. To accomplish these goals, a list of objectives was set to follow:
1. Prepare soil samples for measurement.
2. Measure the radioactivity of 137Cs in the samples and analyze the results.
3. Generate a map to illustrate the radioactivity level.
3.1 Prepare Soil Samples for Measurement.
3.1.1 Overview
Eighty-seven samples originate from Japan in 2017, which is 6 years after the Fukushima
Dai-ichi nuclear disaster. Of the 87 samples, 35 were street dirt and dust, and 52 were surface
soils and sediments. Due to the variety of locations and weather conditions, the samples arrived
at different physical conditions (wet, dry, weight, etc.). Therefore, samples were prepared to
have similar physical conditions, which would ensure consistent radioactivity measurement.
3.1.2 Sample Classification
The samples were first classified into five categories based on their original locations and
Olympic purposes.
Tokyo sample: Samples collected from Tokyo, including samples from the Imperial Palace
and Meiji Shrine.
Azuma Sports Park sample: Samples collected from a baseball court in the Azuma National
Sports Park in Fukushima city.
Olympic proposed torch route sample: Samples collected on routes for an Olympic proposed
torch route.
Tourist route sample: Samples collected from main routes taken by tourists to different
Olympic locations.
Non-Olympic sample: Samples collected on road or sites unrelated to the Olympic events.
3.1.3 Sample Drying
More than 60 percent of the samples arrived in wet condition. The wet samples were
open to the ambient air (62.2 °F, 22% humidity and 1 atm) in one week to ensure dehydration.
Once these samples were dried, their dry net weights were measured using the following
formula:
mdry, net = mdry, total – mbag
Where: mdry, net is the dry net weight of the soils, mdry, total is the dry weight of the sample
(including the bag) and mbag is the average mass of the bag.
21
3.1.4 Sub-sample Creation
The 87 samples arrived at different weight, and the difference in weight could generate
variance in the radioactivity measurement. Therefore, to eliminate the possible variance arising
from the sample size, we created sub-samples from the original samples. After the wet samples
was dried, sub-samples were created. The ideal weight of the sub-samples were 8 ± 0.6 grams.
The value of 8 grams was determined to be suitable for the measurement because of two reasons:
1. Approximately 25 percent of the samples were at this size so the effort to make sub-sample
was reduced and 2. At 8 grams, the sample spread evenly on the detector surface, giving higher
geometric efficiency and thus better measurement.
Samples that were smaller in size (dry net weight less than 8 grams) measured directly
without being sub-sampled.
By creating sub-samples, we ensured that the collected radioactivity was consistent in all
measurement. A drawback is the chance of the removal of radioactive particles from the original
samples, thereby lowering the true radioactivity.
3.2 Measure the Radioactivity of Cs-137 In the Samples
Numerous studies have shown that the emitted radionuclides after the Fukushima disaster
included 137Cs (half-life 30.17 years), 134Cs (half-life 2.06 years), 131I (half-life 8.02 days) and 129mTe (half-life 33.6 days). Of these radionuclides, Saito et al. reported that 137Cs had the highest
concentration in soils (2015). Moreover, because this study was conducted 6 years after the
Fukushima nuclear disaster, and only 137Cs has a half-life higher than that, measuring the activity
of 137Cs in the soil was expected to yield detectable activity.
This section described the lab set up, the measurement procedure, and data analysis.
3.2.1 Lab Setup
a. Equipment
The information for the equipment was described in the Nuclear Lab Manual
(DelSignore, 2017). Here is the summary of the main details for the equipment in the manual.
The thallium-activated sodium iodide detector, or NaI (TI) detector was used for the
measurement. Photos of the detector are shown in Appendix B.
The detector has sodium iodide (NaI) as the scintillating crystal, which emits visible or
ultraviolet (UV) light after absorbing ionizing radiation. The detector used in this study contains
a 3-inch diameter by 3-inch tall cylindrical NaI crystals. The light photon hits the photocathode,
which is made of a material that emits electrons when struck by visible light photons. The
electrons ejected from the photocathode are then multiplied in the photomultiplying tube (PMT),
which generates a signal multiplication for an electron leaving the photocathode. The pre-
amplifier, which is in close proximity to the signal output of the PMT, captures the current-signal
and converts it into a voltage pulse. An amplifier for further amplification and pulse shaping then
collects the voltage pulse. The amplifier’s job is to produce an output voltage pulse proportional
to the charge deposited in the PMT. The output is recorded and analyzed by the multi-channel
analyzer (MCA) and Pulse Height Analysis (PHA). The MCA channel contains an analog-to-
digital converted, a memory with storage location, control circuity and a timer. The MCA

22
channel number was 2048. As pulses are collected, PHA, which is a histogram of recorded
spectrum, can be created and shown in the ProSpect® software.
b. Detector Efficiency
Since the scintillator surface does not have a uniform efficiency distribution, the
measurement for each sample will vary if the sample is put at different parts on the surface of the
NaI detector. Therefore, an efficiency profile of the NaI detector surface was analyzed.
Figure 2: Sodium iodide (NaI) detector surface containing five concentric zones
To develop the efficiency profile, the 137Cs point source was put into a Whirlpak® bag,
and the whole container was placed on the detector surface and measured the activity. This setup
(with the Whirlpak® bag) was similar to the measurement of an actual sample and made the
efficiency profile more realistic. The surface of the NaI detector was divided into five concentric
zones (Figure 2), which the radii from the innermost circle to the outermost circle be r, 2r, 3r, 4r
and 5r respectively, where r is equal to 0.318 cm. The 137Cs source (in the Whirlpak® bag) was
then put at different zones and number of counts at that zone was recorded. The detailed setup
for the efficiency measurement is shown in Appendix C.
𝜖𝑑𝑒𝑡𝑒𝑐𝑡𝑜𝑟 = 𝑁𝑐
𝜖𝑔𝑒𝑜𝑚𝑒𝑡𝑟𝑦 × 𝑁𝑝
Where: 𝑁𝐶: Number of counts per second recorded by the detector
𝑁𝑝: Number of photons incident on detector face
𝜖𝑑𝑒𝑡𝑒𝑐𝑡𝑜𝑟: The detector efficiency for distributed sample on detector surface
𝜖𝑔𝑒𝑜𝑚𝑒𝑡𝑟𝑦: The geometric efficiency, which depends on the geometry used to measure a
sample. Here the assumed 𝜖𝑔𝑒𝑜𝑚𝑒𝑡𝑟𝑦 is 0.5, which the geometric efficiency of a point source
lying flat on the detector surface.
Since the container size of the soil sample could vary, developing an efficiency profile
for the NaI detector would help determine the detector efficiency for each sample.
c. Experiment setup
The folded size of the measured sub-samples are 3.5 ± 0.4 cm × 3.5± 0.4 cm. The reason
for this step was to ensure that the correctly recorded measurement at the high efficiency region.
The sub-samples were placed directly on top the surface of the NaI detector.

23
According to the Nuclear Lab Manual (DelSignore, 2017), each sample’s photopeaks
must contain at least 10,000 counts for good statistics. Therefore, we ran the radioactivity
measurement for the least radioactive sample (based on preliminary results from the sample
gatherers) and estimated that three hours would be sufficient to have 10,000 counts for all the
samples.
Each sub-sample was measured three times and the number counts (Nc) for each sub-
sample was averaged. This step was to ensure good statistics for the results.
In our measurements, the detector remained unshielded. This step measured the
radioactivity of the background and considered those in our final calculations. The setup for our
measurement is shown in Appendix D.
Table 2 below summarized the details of our measurement.
Measurement criteria Details for each sample
Sub-sample mass 8 ± 0.6 grams
(Samples below 7.4 grams was measured directly)
Sub-sample size 3.5 ± 0.4 cm * 3.5 ± 0.4 cm
Detector efficiency Based on the detector efficiency profile and sub-sample size
Geometric efficiency 0.5
Number of measurements Each sample 3 times
Detector shielding Not shielded
Table 1: Measurement details for each sample
d. Background measurement
Other objects in the lab could generate background noise in the measurements. Therefore,
we measured the radioactivity of the background running the measurement with a clean
Whirlpak® bag, which was the sample container, on top of the detector surface. The
radioactivity of the background was subtracted from the sub-sample measurements to have the
corrected radioactivity. The setup for the background measurement is shown in Appendix C,
Figure 22.
e. Calibration source
The detector detected the energy level of the soil samples by correctly calibrating the
software. Since we aimed to identify the activity of 137Cs (photopeak: 662 keV) in our samples,
three calibrating sources with photopeaks close to that of 137Cs were chosen: 137Cs, 22Na (511
keV) and 54Mn (834.8 keV).

24
3.2.2 Measurement Procedure
Once the experiment was set up, the ProSpect® software measured the number of counts
that the sample generated on the NaI detector surface.
To set up the ProSpect® program, first, in the High Voltage Power Supply window, the
reading was turned on and set to be 900 V (Fig. 3).
Figure 3: High Voltage Power Supply setting
Next, in the MCA Settings tab, the Coarse and Fine Gain settings were adjusted to
optimize the usage of the MCA channels. The setting parameters were shown in figure 4 below.
Figure 4: Multi-channel analyzer (MCA) setting
Finally, the detector was set to be pulse height analysis (PHA) mode in the Acquisition
tab. The preset counting time was set at three hours as shown in Figure 5.

25
Figure 5: Acquisition setting
Once the measurement finished, the data saved as both .cvs and .ava file. While the .ava
file recorded the measurement done by, the .cvs file (Figure 6) was used to calculate the total
number of counts in a fixed range of energy, which was used later in our calculation.
Figure 6: Sample of a .cvs file generated by ProSpect®. Data from sample 024S.
The .cvs file showed the details of the measurement, including starting time, measuring
time, different energy level and the number of counts detected at that level.
3.2.3 Data Analysis
The actual net count for each sample (𝐶𝑛𝑒𝑡) used in the equation above was calculated
from:
𝐶𝑛𝑒𝑡 = 𝐶𝑔𝑟𝑜𝑠𝑠 − 𝐶𝑏𝑎𝑐𝑘𝑔𝑟𝑜𝑢𝑛𝑑
Where: 𝐶𝑔𝑟𝑜𝑠𝑠: Number of counts for each sub-sample
𝐶𝑏𝑎𝑐𝑘𝑔𝑟𝑜𝑢𝑛𝑑: Number of counts for the background
Since the radioactive isotope we aimed to identify is 137Cs, the set chosen energy range lies
between 550.03 keV and 700.82 keV , which calculate to number of counts for each sub-sample

26
and for the background. In other words, 𝐶𝑔𝑟𝑜𝑠𝑠 and 𝐶𝑏𝑎𝑐𝑘𝑔𝑟𝑜𝑢𝑛𝑑 was the number of counts
between 550.03 keV and 700.82 keV energy range.
The net count per second (𝐶𝑃𝑆𝑛𝑒𝑡) was calculated from the net count (𝐶𝑛𝑒𝑡) using the
following equation:
𝐶𝑃𝑆𝑛𝑒𝑡 =𝐶𝑛𝑒𝑡
𝑇
Where T is the measured time for each subsample in seconds, and T = 10800 seconds in this
study.
The disintegration per second (DPS) was calculated using the following equation:
𝐷𝑃𝑆 = 𝐶𝑃𝑆𝑛𝑒𝑡
𝜖𝑑𝑒𝑡𝑒𝑐𝑡𝑜𝑟 × 𝜖𝑔𝑒𝑜𝑚𝑒𝑡𝑟𝑦
The activity of each sample was then calculated using the formula:
𝐴𝑐𝑡𝑖𝑣𝑖𝑡𝑦 = 𝐷𝑃𝑆
𝑚𝑛𝑒𝑡
Where: mnet: dry net weight for each sample (kg)
3.3 Generating A Map to Illustrate the Radioactivity Level
of Japan soil
After accomplishing objective 2, the radioactivity of the samples was plotted on the
Japanese map based on their original locations. We chose Google Map because of its
convenience in mapping and its nice outlook.
A .cvs file was generated with 7 columns were generated (Figure 7). The named columns
include Latitude, Longitude, Name, Description, Icon, AppendataColumnsToDescription, and
Activity detected (Bq/kg) respectively.
Figure 7: A sample of the .cvs file used in Google Map.
The first two columns (Latitude and Longitude) contained the location of the sample. The
Name, Description and Icon showed the details of the samples. The icon column, left blank,

27
showsed the icon for each sample on Google map. The AppendataColumnsToDescription
showed the column that Google map used to create the color-coded radioactivity. The last
column, Activity detected (Bq/kg), contained our measured radioactivity.

28
4. Findings In this chapter, we described the results for each objective set in the Methodology
chapter. The section began with the results of experiment preparation, including our sample
preparation and efficiency measurement, then results of the radioactivity measurement and
finally the results of our mapping process. We were able to achieve the ultimate goal for this
study, which was to generate maps that illustrate the soil radioactivity level at different locations
in Japan.
4.1 Sample Preparation and Parameters Measurement
4.1.1 Sample Preparation
a. Sample Drying
Forty-three samples were completely dried in ambient air in the Nuclear Lab (Olin Hall,
room 014). Appendix A shows our setup for the drying process
b. Sub-sample Creation
Of the 30 samples that we measured (30 out of 87 samples), the mean net weight of the
sub-samples was 6.9 g with a standard deviation (σ) of 2.5 g. The mean net weight was below
the ideal weight that we wanted (8 g) because 7 samples were undersized. If the 7 undersize
samples were disregarded, the mean net weight for the 23 sub-samples were 8.1 g (σ = 0.36 g).
4.1.2 Detector Efficiency
Figure 8: Efficiency profile as a function of distance from the center
The efficiency profile was developed for the surface of the NaI detector. Figure 8 shows a
plot of the detector efficiency versus the distance from the center of the detector. The efficiency
of the detector was expressed as a quadratic function of the distance from the center of the
detector with a high R-squared value of 0.96. The strong dependence of the surface efficiency on

29
the distance from the center of the detector required our group to calculate the detector efficiency
for each sample based on its size.
4.2 Radioactivity Measurement
4.2.1 Background Measurement
The background radioactivity was measured three times and the number of counts within
the interested energy range (550.03 keV and 700.82 keV) was averaged. Table 3 showed the total
number of counts for the three background measurements in 3 hours.
Run 1 Run 2 Run 3
𝐶𝑏𝑎𝑐𝑘𝑔𝑟𝑜𝑢𝑛𝑑 (counts) 22097 21955
22041
Table 2: Number counts for the three background measurements.
The average number of counts for the background measurements is 22031 counts (σ =
71.5 counts). The differences between each measurement arose because of the radioactive
samples within the lab and other groups conducting their measurements nearby. A sample of
background measurement is shown is Appendix B.
4.2.2 Control Samples
One soil sample from Worcester Polytechnic Institute (100 Institute Road, Worcester,
MA) was measured to example the activity of radiocesium in the soil. The result showed that
activity of 137Cs in the sample was 0.0 Bq/kg, confirming that there is no radiocesium in the soil
sample at WPI.
4.2.3 Japan soil and Dust Samples Measurement
The radioactivity of the dust and soil samples ranged from 38.6 Bq/kg to 28041.5 Bq/kg.
Figure 9 shows the radioactivity of 137Cs in 30 samples (30 of 87 samples) measured in our
study. The mean radioactivity of the 30 Japan soil and dust samples was 4903.3 Bq/kg (σ =
6611.0 Bq/kg). The radioactivity data in the study was assumed to be 137Cs and not corrected for 134Cs. Thirty percent of the samples (9 of 30 samples) exceeded the overall mean radioactivity.
Of these samples, four (4 of 9) exceeded 11514.3 Bq/kg (mean + 1σ) and one (1 of 9) exceeded
18125.3 Bq/kg (mean + 2σ).
The large standard deviation showed that the radioactivity varied greatly between
samples from different locations. Therefore, a detailed analysis of the radioactivity at each
location would be discussed in the sequential sections to fully understand the activity of 137Cs in
Japan soil.

30
Figure 9: Histogram showing the number of soil samples from Japan by order of magnitude of
radioactivity of 137Cs in Bq/kg.
4.3 Japan Soil Radioactivity Maps
Once we calculated the radioactivity of the samples, we created maps that shows the
radioactivity level of soil in Japan. This section explored the overall radioactivity level of Japan
soil and went into details for each sample categories.
4.3.1 Overall Heat Map
Figure 10 showed the radioactivity of 137Cs in Japan soil. Every soil samples were
measured three times and the average radioactivity was reported and mapped. The general trend
was that the further away from Fukushima Nuclear Power Plant, the lower the radioactivity of 137Cs in the samples.
While the samples from Tokyo set showed the least activity of 137Cs, samples from the
proposed torch route set showed much higher activity.
6
4
13
7
<100 100-1000 1000-10000 >10000
Nu
mb
er o
f sa
mp
les
Radioactivity (Bq/kg)
31
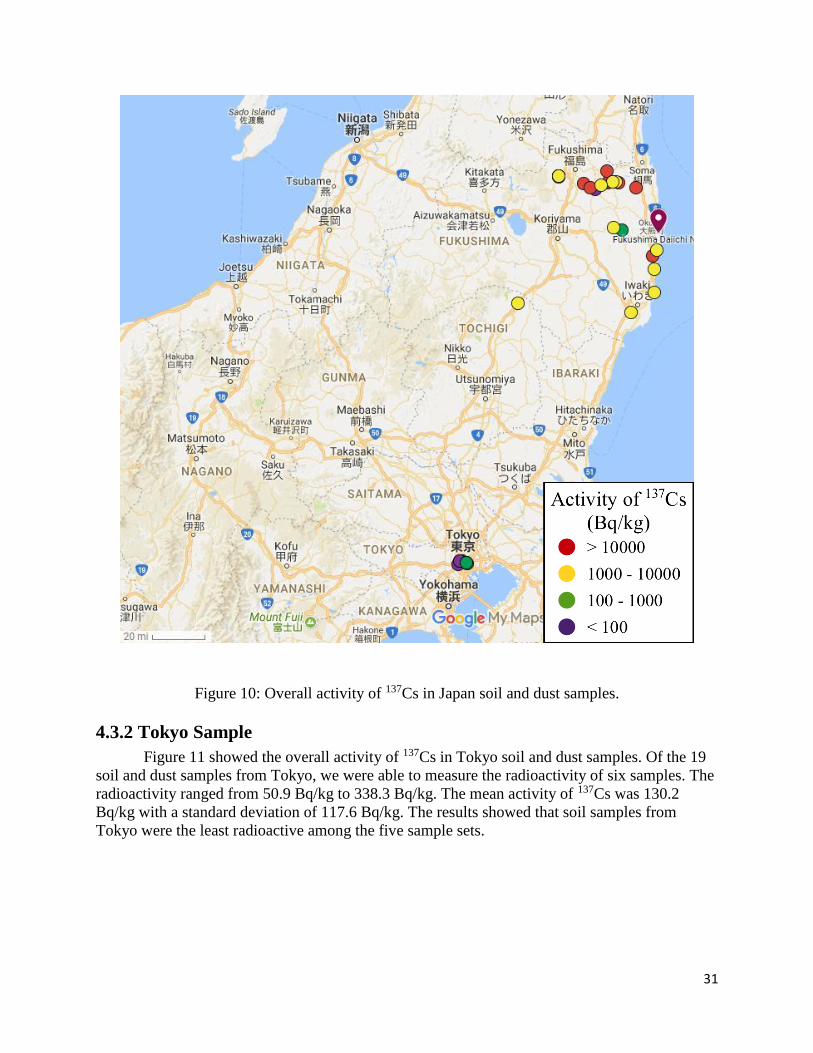
Figure 10: Overall activity of 137Cs in Japan soil and dust samples.
4.3.2 Tokyo Sample
Figure 11 showed the overall activity of 137Cs in Tokyo soil and dust samples. Of the 19
soil and dust samples from Tokyo, we were able to measure the radioactivity of six samples. The
radioactivity ranged from 50.9 Bq/kg to 338.3 Bq/kg. The mean activity of 137Cs was 130.2
Bq/kg with a standard deviation of 117.6 Bq/kg. The results showed that soil samples from
Tokyo were the least radioactive among the five sample sets.

32
Figure 11: Activity of 137Cs in Tokyo soil and dust samples.
4.3.3 Azuma Sports Park Sample
Of the 13 samples from the Azuma Sports Park, we were able to measure the
radioactivity of five samples. The radioactivity ranged from 78.1 Bq/kg to 6176.0 Bq/kg. The
mean radioactivity is 2703.9 Bq/kg with a standard deviation of 2729.8 Bq/kg. The mean
radioactivity of this sample set was 20.7 times higher than the mean radioactivity of the Tokyo
sample set.
Figure 12 showed the activity of 137Cs in Baseball court soil and dust samples. Only four
plotted samples appear in Fig 12 because one sample was an infield dirt with no recorded
location. The mean radioactivity of the Azuma Sports Park sample set was the second least
radioactive set among the five sets.

33
Figure 12: Activity of 137Cs in Azuma Sports Park soil and dust samples.
4.3.4 Tourist Route Sample
Of the 18 soil and dust samples from the Tourist route samples, we were able to measure
the deposition of 137Cs in five samples. The radioactivity ranged from 1138.8 Bq/kg to 10831.7
Bq/kg. The mean radioactivity is 3206.0 Bq/kg (σ = 4266.7 Bq/kg). The mean radioactivity of
the Tourist route sample was 24.6 times higher than that of the Tokyo sample.

34
Figure 13: Activity of 137Cs in tourist route soil and dust samples.
4.3.5 Proposed torch route sample
Figure 14 showed the radioactivity of 137Cs in the proposed torch route soil and dust
samples. Of the 31 samples from the tourist route, we were able to measure 13 samples. The
proposed torch route sample was the most radioactive sample set and had the greatest variance
among the three previous sample categories. The radioactivity ranged from 38.6 Bq/kg to
28041.5 Bq/kg. The mean radioactivity was 7896.0 Bq/kg (σ = 8103.9 Bq/kg). Seven samples (7
of 13) exceeded the mean radioactivity.
The mean radioactivity of the proposed torch route sample was 60.6 times higher than
that of Tokyo sample.

35
Figure 14: Activity of 137Cs in proposed torch route soil and dust samples.
4.3.6 Non-Olympic sample
Of the seven Non-Olympic sample, we were able to measure the radioactivity of one
sample located at the Entrance to Fukushima Dai-ichi NPS waste mounds. The activity of 137Cs
of this sample was 14119.8 Bq/kg, 88.2 times higher than the mean radioactivity of the Tokyo
sample set. There is high activity of 137Cs in this sample, explained by its close proximity to the
Fukushima Nuclear Power Plant.

36
Figure 15: Activity of 137Cs in Non-Olympic soil and dust sample.

37
5 Discussions and Recommendations
5.1 Discussions
The results support our initial assumptions that samples that originate within the
Fukushima Prefecture possess a much higher concentration of radioactive material than those
further away. Especially over the years, although there has been numerous research done on
measuring the radioactivity of Japan soil, it was unclear whether the public’s health was at risk.
Through five months of researching and testing, this study provides the amount of radiation
detected in the gathered soil and dust samples. These findings give a template to determine any
long-term health risks associated with these measured values. Examples of the amount of
cesium-137 exposed to people in everyday life provides a reference to our results. The findings
showed that the Tokyo sample set had the lowest radioactivity level, which was understandable
based on its significant distance from the Fukushima Nuclear Power Plant. On the contrary, the
proposed torch route samples had the highest mean radioactivity due to their close proximity to
the plant. Based on the measurement, we estimated qualitatively that the radiation exposure of
people living near the Azuma Sports Park area was 20.7 times higher than that of people living in
Tokyo. The main tourist and proposed torch routes had radiation exposure of 24.6 and 60.6 times
higher, respectively, than in Tokyo. Although most of the radiation decayed rapidly following
the initial disaster and has decreased minimally throughout the following years, the significantly
high amount of Cesium-137 in the proposed torch route area showed concerns about public
health.
Our studies seek to compare the results with previous studies. Kaltofen et al. isolated and
analyzed the activity of radiocesium in 180 dust and soil samples from Japan, showing a high
mean radioactivity of 25.7 kBq/kg among the sample set (2017). The results was 5.2 times higher
than our mean radioactivity and the difference was understandable because of the difference in
sampling criteria. While Kaltofen et al. focused on identifying the hot spots within the area
around the Fukushima Prefecture, our groups measured samples that were further away from the
Fukushima Nuclear Power Plant.
The results in this study were in agreement with Saito et al., who reported a much higher
deposition of Cesium-137 in the area to the northeast of the Fukushima Nuclear Power Plant and
the further away from the plant, the lower the deposition of Cesium-137 (2015). Accordingly,
our results showed that the highest radioactivity level was at the proposed torch route, which is
located to the northeast of the plant. The further away from the plant for example, in Tokyo and
the Azuma Sports Park, the lower the activity of Cesium-137. However, because of the
differences in sampling techniques and reported unit of radioactivity, there could not be an
established direct comparison.
With the 2020 Olympics hosted in Japan, our study will benefit officials when they
decide whether the radioactivity level at the Olympic venues are acceptable. The map created
also gives a quantitative summary of our findings, which estimates the actual dose that people
living in these areas may receive. Tourism and agriculture can benefit from our data by creating
a simple guide to the danger areas around Japan. This can heavily tie into economic situations as
well.
38
5.2 Limitations and Follow-up study
Through measuring the radioactivity of the samples and comparing our results with
published work, we were able to complete the project. The activity map of Cs-137 in Japan soil
was created. There were, however, limitations in our study that discusses suggestions on further
research.
The first obstacle that we faced in this study was the large number of samples collected
from Japan. Moreover, there was no clear suggestion on which sample to start with so at the
beginning of the project, samples were selected randomly. A direct consequence for the random
selection was that we could not measure all the samples within one set because of the time
constraint and measured samples were in different sets. Therefore, if we had a more concrete
approach, we would be able to have a better mechanistic understanding of the activity of
Cesium-137 in Japan soil.
The second limitation was the number of samples that we were able to measure in this
project. As shown in the findings, the radioactivity varied enormously even within one sample
set. Therefore, if we were able to measure the radioactivity of more samples, a better
radioactivity mean for each sample set would be collected.
The third limitation of the project was the mapping process. Google Map was an
acceptable software, but the control of information presented on Google Map was limited. For
example, the size of the icon that we used in the mapping could not be decreased, which resulted
in large and overlapping icons. Therefore, we were not able to show all the data points on the
overall activity map. In short, we learned that there is software that allows better controlling in
the map-making process, but due to our limitation in coding techniques, Google Maps was the
only viable choice for this project.
From the limitations that we learned from this project, the following studies allowed a better
understanding of the activity of Cesium-137 in Japan soil:
Measure the radioactivity of samples in on sample set instead of random selection. This
will save time and yield a more concrete result for each set.
Have a detailed schedule for measuring the radioactivity. Because each sample was
measured for three hours, only three samples could be measured in one day or equivalent
of one sample a day. If the rate of measuring is lower than this, it will take a much longer
time to go through all the samples.
Use a different software for mapping process. Example of software to use is Mapbox,
which requires knowledge on JavaScript to execute.
5.3 Summary This project aimed to study the activity of Cesium-137 in soil and dust samples from
Japan as the consequence of the Fukushima Dai-ichi nuclear disaster in March 2011. The goals
of the project were to measure and analyze the radioactivity at different locations in Japan,
generate a map to illustrate the radioactivity level in Japan soil, and qualitatively estimate human
exposure to radioactivity.

39
The employment of various study methods and experiment designs completed the
objectives. Through literature review and discussion with advisors and lab instructors, the
methodology allowed for measurement and analysis on the radioactivity of Cesium-137 in the
samples. We were able to measure the radioactivity of 30 samples and used the results to create
the Cesium-137 activity map using Google Map.
The measured results showed a much higher activity of Cesium-137 in the proposed torch
route compared to other areas. Overall, the further away from the Fukushima Dai-ichi Nuclear
Power Plant, the lower the radioactivity. The activity of Cesium-137 in Tokyo, the furthest site
from the plant, was the lowest when compared to the other sites. Therefore, the activity of
Cesium-137 in Tokyo sample was used as the baseline to qualitatively estimate the human
exposure to radiation. Upon measuring and analyzing, we compared our results to the literature
and published work to validate our data.
Furthermore, these results uses cross-references with the agriculture regulation amount of
Cs-137 in the soil. The value for radioactivity of Cesium-137 in soil must be below 5000 Bq/kg.
At the Azuma Sports Park, the soil and dust samples yielded a range of 78.1 Bq/kg to 6176.0
Bq/kg. This particular Olympic venue is around 90 km from the Nuclear Power Plant. The other
sites that are closer to the Nuclear Power Plant like the tourist route, proposed torch route, and
non-Olympic samples have higher amounts due to the close proximity to ground zero of the
disaster.
5.4 Recommendations and Suggestion for Follow Up Studies
From the results of our study, we observed that areas in and close to the Fukushima
prefecture exhibit a high concentration of radioactive fallout. Past and current tests show the
locations of high amounts of radiation at the locations, which originate close to the original site
of the disaster. Furthermore, the results showed a significantly higher amount of radioactive
materials in the proposed torch route compared to those in Tokyo.
Given the results from testing, we confidently make the following recommendations:
1. Further study on the activity of Cesium-137 on the proposed torch route is necessary to
understand how much radioactive materials remain.
2. A more detailed study with more soil and dust samples can give a more accurate map of
specific areas of interest.
3. Olympic officials should consider using the results of this project to decide whether the
radioactivity level at the proposed torch route and the Olympic venues are within acceptable
level.
4. Qualified health professionals should use this data to make connections about short and long-
term effects on health.

40
References
Agency for Toxic Substances and Disease Registry (2015, January 21). Toxic Substances Portal
Cesium. Retrieved March 02, 2018, from
https://www.atsdr.cdc.gov/toxprofiles/TP.asp?id=578&tid=107
Atomic Energy Society of Japan (AESJ). Atomic Energy Society of Japan, SpringerLink (Online
service), & Springer Books. (2015;2014;).
The Fukushima Dai-ichi nuclear accident: Final report of the AESJ investigation committee
(2015th ed.). Tokyo: Springer Japan.10.1007/978-4-431-55160-7
Dersee,Thomas & Pflugbeil, Sebastian (2011). Calculated Fatalities from Radiation Officially
Permissible Limits for Radioactively Contaminated Food in the European Union and
Japan. Retrieved from
https://www.foodwatch.org/uploads/tx_abdownloads/files/fw_report_CalculatedFatalities
fromRadiation11_2011.pdf
Evacuation Orders and Restricted Areas. (2017, March 31). Retrieved March 02, 2018, from
http://fukushimaontheglobe.com/the-earthquake-and-the-nuclear-accident/evacuation-
orders-and-restricted-areas
Epstein, Edward Jay. “What Was Lost (and Found) in Japan's Lost Decade.” The Hive, Vanity
Fair, 24 Feb. 2016, www.vanityfair.com/news/2009/02/what-was-lost-and-found-in-
japans-lost-decade.
Foodwatch (2011, September 19). Calculated Fatalities from Radiation - Officially Permissible
Limits for Radioactively Contaminated Food in the European Union and Japan. Retrieved
March 02, 2018, from https://www.foodwatch.org/foodwatch-report-calculated-fatalities-
from-radiation/
Future From Fukushima (2018, February 1). Estimated population in Fukushima Prefecture.
Retrieved March 02, 2018, fromhttps://www.pref.fukushima.lg.jp/sec/11045b/15846.html
Jnto Japan: The Official Guide. Japan National Tourism Organization. Retrieved March 03,
2018, from https://www.jnto.go.jp/eng/regional/fukushima/index.html
International Nuclear and Radiological Event Scale (INES). (2017, November 22). Retrieved
March 02, 2018, from https://www.iaea.org/topics/emergency-preparedness-and-
response-epr/international-nuclear-radiological-event-scale-ines
Kaltofen, M., & Gundersen, A. (2017). Radioactively-hot particles detected in dusts and soils
from northern japan by combination of gamma spectrometry, autoradiography, and
SEM/EDS analysis and implications in radiation risk assessment. Science of the Total
Environment, 607, 1065-1072. doi:10.1016/j.scitotenv.2017.07.091
Kato, H., Onda, Y., & Teramage, M. (2012;2011;). Depth distribution of 137Cs, 134Cs, and 131I
in soil profile after fukushima dai-ichi nuclear power plant accident. Journal of
Environmental Radioactivity, 111, 59-64. doi:10.1016/j.jenvrad.2011.10.003
41
Kinoshita, N., Sueki, K., Sasa, K., Kitagawa, J., Ikarashi, S., Nishimura, T., . . . Yamagata, T.
(2011). Assessment of individual radionuclide distributions from the Fukushima nuclear
accident covering central-east japan. Proceedings of the National Academy of Sciences of
the United States of America, 108(49), 19526-19529. doi:10.1073/pnas.1111724108
Knoll, G. F. (2010). Radiation detection and measurement (4th ed.). Hoboken, N.J: John Wiley.
Kyodo. “Tens of Thousands Flock to the Imperial Palace for Annual Viewing of Autumn
Foliage.” The Japan Times, 6 Dec. 2015,
www.japantimes.co.jp/news/2015/12/06/national/tens-of-thousands-flock-to-the-
imperial-palace-for-annual-viewing-of-autumn-foliage/.
Marks, Shannon. “Facts on the Imperial Palace.” USA Today, Gannett Satellite Information
Network, traveltips.usatoday.com/imperial-palace-9888.html.
Morino, Y., Ohara, T., & Nishizawa, M. (2011). Atmospheric behavior, deposition, and budget
of radioactive materials from the Fukushima Dai-ichi nuclear power plant in march 2011.
Geophysical Research Letters, 38(7), n/a. doi: 10.1029/2011GL048689
Nagao, S., Kanamori, M., Ochiai, S., Tomihara, S., Fukushi, K., & Yamamoto, M. (2013).
Export of (134) Cs and (137) Cs in the Fukushima river systems at heavy rains by
typhoon Roke in September 2011. Biogeosciences, 10(10), 6215-6223. doi:10.5194/bg-
10-6215-2013
Nuclear Power in Japan. (2017, December). Retrieved March 02, 2018, from http://www.world-
nuclear.org/information-library/country-profiles/countries-g-n/japan-nuclear-power.aspx
Ohno, T., Muramatsu, Y., Miura, Y., Oda, K., Inagawa, N., Ogawa, H., . . . Sato, M. (2012).
Depth profiles of radioactive cesium and iodine released from the Fukushima Dai-ichi
nuclear power plant in different agricultural fields and forests. Geochemical Journal,
46(4), 287-295. 10.2343/geochemj.2.0204
Radiation and Life. (2012, December). Retrieved March 02, 2018, from http://www.world-
nuclear.org/information-library/safety-and-security/radiation-and-health/radiation-and-
life.aspx
Saito, T., Saito, K., Tanihata, I., Fujiwara, M., Shimoura, S., Otsuka, T., . . . Shibata, T.
(2015;2014;). Detailed deposition density maps constructed by large-scale soil sampling
for gamma-ray emitting radioactive nuclides from the Fukushima Dai-ichi nuclear power
plant accident. Journal of Environmental Radioactivity, 139, 308-319.
doi:10.1016/j.jenvrad.2014.02.014
Shoebridge, G. (2012, January 6). Electric Car Conversion Blog. Retrieved March 02, 2018,
from http://www.gavinshoebridge.com/news/basic-guide-to-radiation-levels-in-
%C2%B5svh-and-msvh/
Tanaka, K., Takahashi, Y., Sakaguchi, A., Umeo, M., Hayakawa, S., Tanida, H., . . . Kanai, Y.
(2012). Vertical profiles of iodine-131 and cesium-137 in soils in Fukushima prefecture
related to the Fukushima Dai-ichi Nuclear Power Station Accident. Geochemical
Journal, 46(1), 73-76. doi:10.2343/geochemj.1.0137
The number of Fukushima children diagnosed with or suspected to have thyroid cancer became
172. (2016, June 07). Retrieved March 02, 2018, from

42
http://fukushimaontheglobe.com/the_earthquake_and_the_nuclear_accident/health-and-
medical-services/4625.html
Tomoko M. Nakanishi; Agricultural implications of the Fukushima nuclear accident, Journal of
Radiation Research, Volume 57, Issue S1, 1 August 2016, Pages i47–i52,
https://doi.org/10.1093/jrr/rrw042
Turner, J. E. (2008;2007;). Atoms, radiation, and radiation protection (1. Aufl.;3rd completely
rev. and enlarg;3; ed.). Hoboken: Wiley-VCH.
Tokyo Area – Japan National Tourism Organization, (2014). “The Imperial Palace Area - Japan
National Tourism Organization.” Japan National Tourism Organization Web Site, Japan
National Tourism Organization, www.jnto.go.jp/eng/regional/tokyo/imperial.html.
“Tokyo Imperial Palace• Historic Site in Tokyo.” Tokyo Imperial Palace, Japan Guide,
www.japan-guide.com/e/e3017.html.
Wang, Y., Morita, S., Kataoka, N., Imaizumi, H., & Kano, N. (2016, October 15). Observation
of Tritium Behavior Both in Monthly Precipitation in Niigata City and in Spring Water at
Top of Mt. Zao and Some Mountains in Fukushima Prefecture After the Fukushima Dai-
ichi Nuclear Power Plant Accident. Retrieved March 02, 2018, from
https://www.jstage.jst.go.jp/article/radioisotopes/65/10/65_651002/_article
World Cities Forum, “Number of International Tourists per Year.” World Cities Culture Forum,
World Cities Culture Forum, www.worldcitiescultureforum.com/data/number-of-
international-tourists-per-year.
Yasunari, T., Stohl, A., Hayano, R., Burkhart, J., Eckhardt, S., & Yasunari, T. (2011). Cesium-
137 deposition and contamination of Japan soils due to the Fukushima nuclear
accident. Proceedings of the National Academy of Sciences of the United States of
America, 108(49), 19530-19534. Retrieved from
http://www.jstor.org.ezproxy.wpi.edu/stable/23059528

43
Appendix A. Sample Preparation
Figure 16: Samples drying by keeping them open to ambient air in one week (62.2 °F, 22%
humidity and 1 atm)
Figure 17: Sample ordering. After the drying process, samples were sorted based on their name.

44
Appendix B. Equipment
Figure 18: Sodium Iodide (NaI) detector.

45
Appendix C. Efficiency Measurement and
Blank Measurement
Figure 19: Cesium-137 in a Whirlpak® bag.
Figure 20: Sodium iodide (NaI) detector surface was divided into seven concentric zones.

46
Figure 21: Efficiency measurement setup.
Figure 22: Background measurement setup.

47
Appendix D: Sample Measurement
Figure 23: Sample measurement setup.