measuring intangible investment - oecd · only to present the topics and do not pretend to be...
TRANSCRIPT
Measuring Intangible Investment
Towards an Interim Statistical Framework:Selecting the Core Components of
Intangible Investment
by
Alison Young
OECD Secretariat
© OECD 1998
ORGANISATION FOR ECONOMIC CO-OPERATION AND DEVELOPMENT
2
TABLE OF CONTENTS
TOWARDS AN INTERIM STATISTICAL FRAMEWORK: SELECTING THE CORE COMPONENTSOF INTANGIBLE INVESTMENT ............................................................................................................... 3
1. Introduction............................................................................................................................................. 32. An initial list of intangible investment components ............................................................................... 33. Criteria for selecting “core components” ............................................................................................... 54. Some investment terminology ................................................................................................................ 5
4.1 Need for the test ................................................................................................................................ 54.2 The example of tangible investment ................................................................................................. 54.3 Basic tenets applied to intangibles. ................................................................................................... 74.4 Relationship between tangible and intangible investment and between intangibles ...................... 10
5. Treatment of possible components of intangible investment in the system of National Accounts ..... 116. Treatment of the activities concerned in the main industrial and product classifications .................... 137. Treatment in specialist methodologies ................................................................................................. 14
7.1 The Frascati family of manuals....................................................................................................... 147.2 The model survey of computer services ......................................................................................... 167.3 The OECD training statistics manual.............................................................................................. 167.4 Other sources of methodology and data.......................................................................................... 16
8. Company accounting conventions ....................................................................................................... 169. Empirical studies ................................................................................................................................. 1810. Conclusions......................................................................................................................................... 20
10.1 Computer-linked ........................................................................................................................... 2010.2 Technology and production........................................................................................................... 2010.3 Human resources........................................................................................................................... 2110.4 Organisation of the firm ................................................................................................................ 2110.5 External: Marketing and sales..................................................................................................... 2210.6 Industry-specific............................................................................................................................ 22
REFERENCES............................................................................................................................................. 23
3
TOWARDS AN INTERIM STATISTICAL FRAMEWORK:SELECTING THE CORE COMPONENTS OF INTANGIBLE INVESTMENT
1. Introduction
Recent developments in economic theory provide attractive new conceptual frameworks foranalysing intangible investment, as shown in the preceding paper in this series (Clement, Paper 2).However, our understanding of national innovation systems is only just reaching a stage when a few newindicators can be proposed, but not a complete new statistical framework which can be translated into anew set of national and international surveys.
As was recognised at the 1992 Workshop, considerable work is still needed on the concepts andthe likelihood of special surveys is low. There is thus a need for an interim set of guidelines for themeasurement of intangible investment, making the best use of existing concepts, statistical frameworksand national and international data sources.
The aim of this summary overview is to set the scene for the practical recommendations in thenext paper (Vosselman, Paper 4) by reviewing the possible components of intangible investment in thelight of the information in Papers 5 to 10.
2. An initial list of intangible investment components
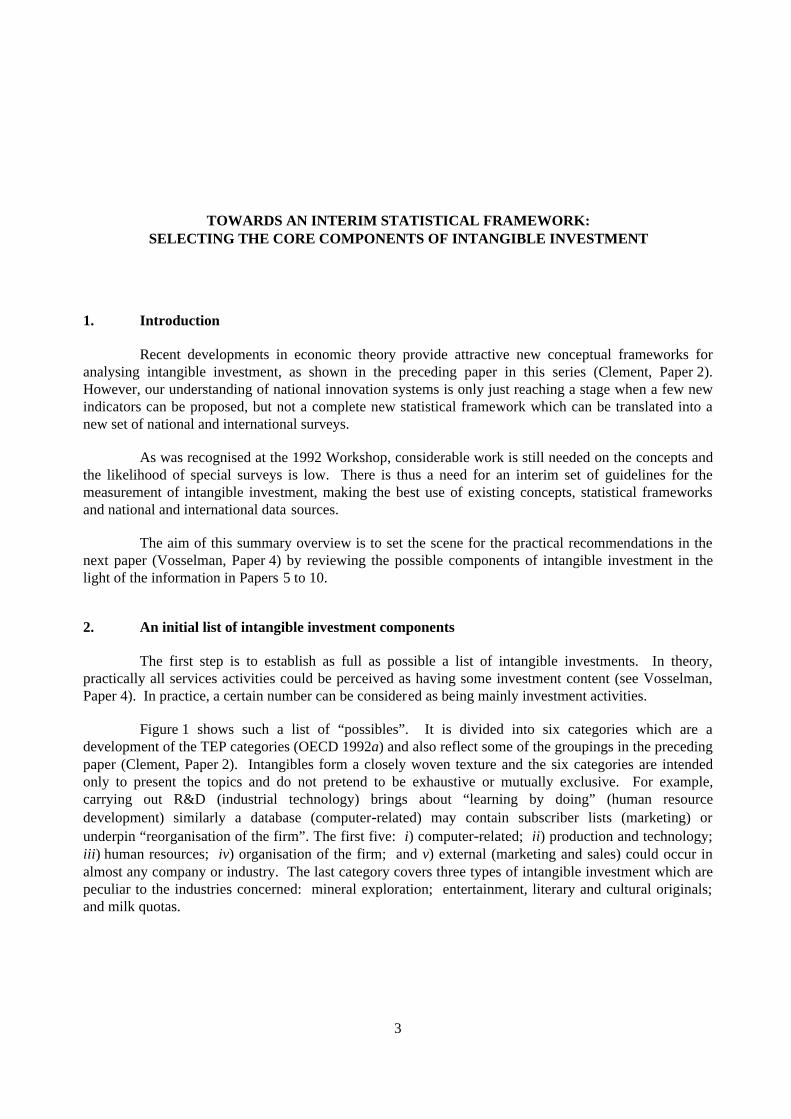
The first step is to establish as full as possible a list of intangible investments. In theory,practically all services activities could be perceived as having some investment content (see Vosselman,Paper 4). In practice, a certain number can be considered as being mainly investment activities.
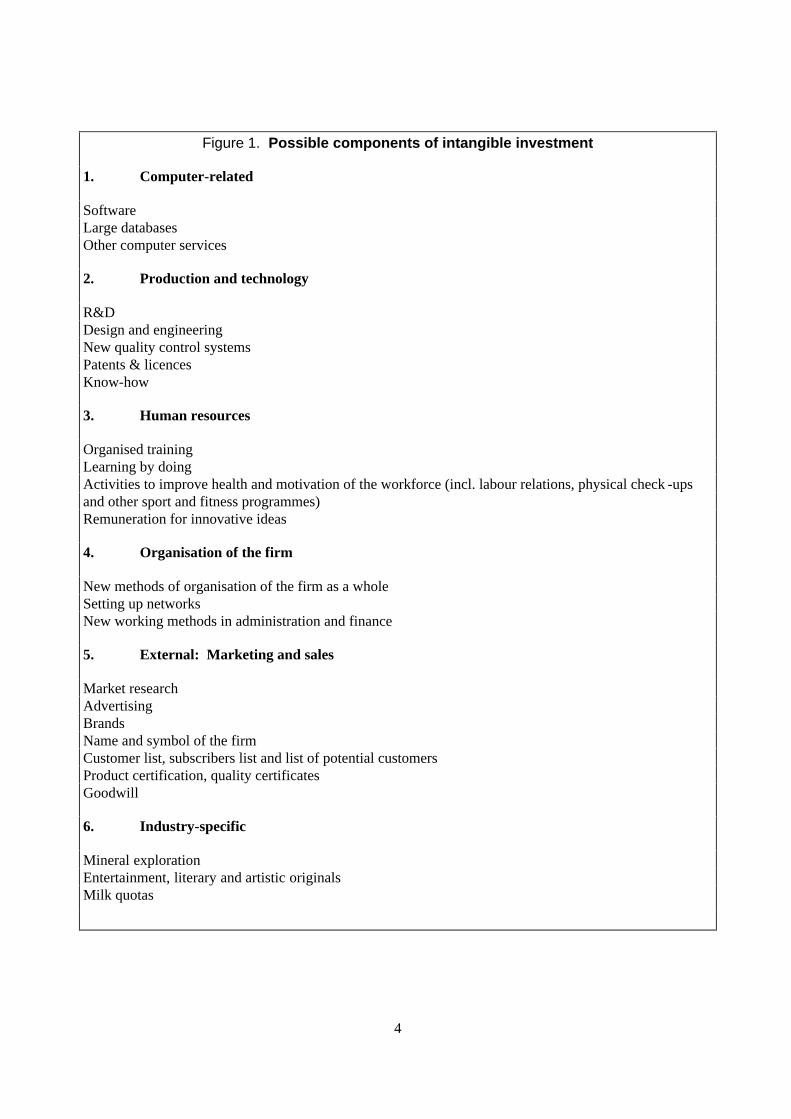
Figure 1 shows such a list of “possibles”. It is divided into six categories which are adevelopment of the TEP categories (OECD 1992a) and also reflect some of the groupings in the precedingpaper (Clement, Paper 2). Intangibles form a closely woven texture and the six categories are intendedonly to present the topics and do not pretend to be exhaustive or mutually exclusive. For example,carrying out R&D (industrial technology) brings about “learning by doing” (human resourcedevelopment) similarly a database (computer-related) may contain subscriber lists (marketing) orunderpin “reorganisation of the firm”. The first five: i) computer-related; ii) production and technology;iii) human resources; iv) organisation of the firm; and v) external (marketing and sales) could occur inalmost any company or industry. The last category covers three types of intangible investment which arepeculiar to the industries concerned: mineral exploration; entertainment, literary and cultural originals;and milk quotas.
4
Figure 1. Possible components of intangible investment
1. Computer-related
SoftwareLarge databasesOther computer services
2. Production and technology
R&DDesign and engineeringNew quality control systemsPatents & licencesKnow-how
3. Human resources
Organised trainingLearning by doingActivities to improve health and motivation of the workforce (incl. labour relations, physical check -upsand other sport and fitness programmes)Remuneration for innovative ideas
4. Organisation of the firm
New methods of organisation of the firm as a wholeSetting up networksNew working methods in administration and finance
5. External: Marketing and sales
Market researchAdvertisingBrandsName and symbol of the firmCustomer list, subscribers list and list of potential customersProduct certification, quality certificatesGoodwill
6. Industry-specific
Mineral explorationEntertainment, literary and artistic originalsMilk quotas
5
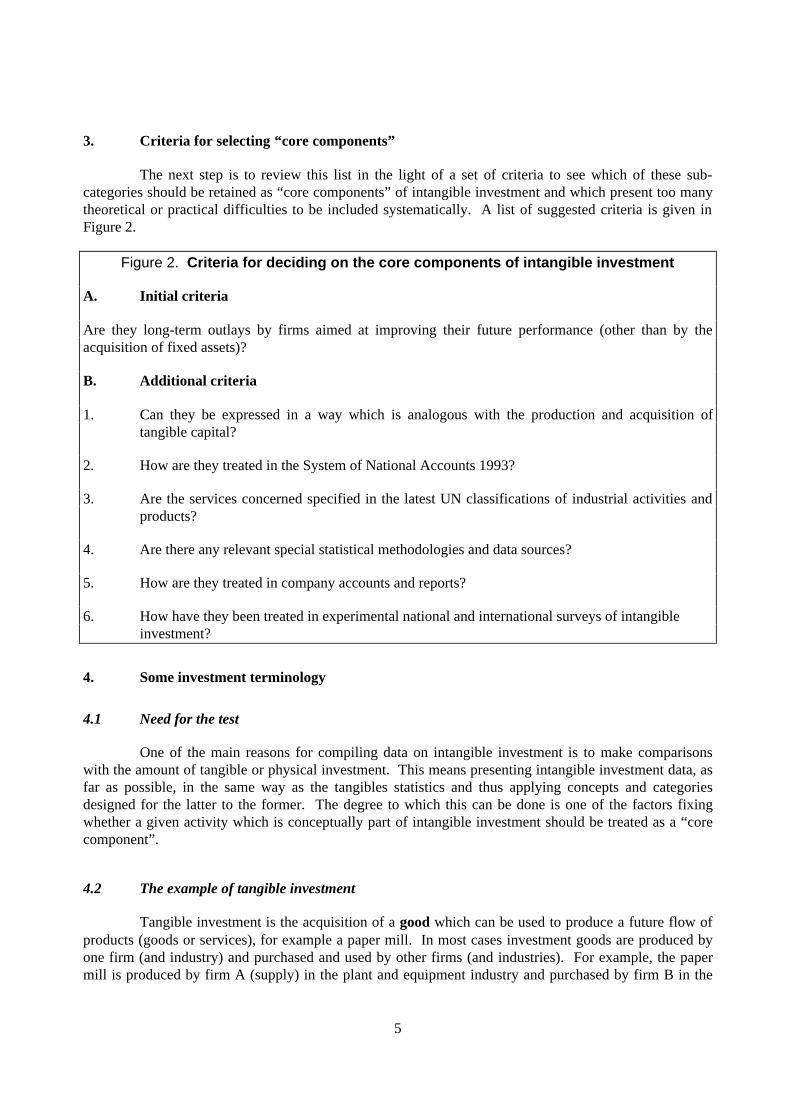
3. Criteria for selecting “core components”
The next step is to review this list in the light of a set of criteria to see which of these sub-categories should be retained as “core components” of intangible investment and which present too manytheoretical or practical difficulties to be included systematically. A list of suggested criteria is given inFigure 2.
Figure 2. Criteria for deciding on the core components of intangible investment
A. Initial criteria
Are they long-term outlays by firms aimed at improving their future performance (other than by theacquisition of fixed assets)?
B. Additional criteria
1. Can they be expressed in a way which is analogous with the production and acquisition oftangible capital?
2. How are they treated in the System of National Accounts 1993?
3. Are the services concerned specified in the latest UN classifications of industrial activities andproducts?
4. Are there any relevant special statistical methodologies and data sources?
5. How are they treated in company accounts and reports?
6. How have they been treated in experimental national and international surveys of intangible investment?
4. Some investment terminology
4.1 Need for the test
One of the main reasons for compiling data on intangible investment is to make comparisonswith the amount of tangible or physical investment. This means presenting intangible investment data, asfar as possible, in the same way as the tangibles statistics and thus applying concepts and categoriesdesigned for the latter to the former. The degree to which this can be done is one of the factors fixingwhether a given activity which is conceptually part of intangible investment should be treated as a “corecomponent”.
4.2 The example of tangible investment
Tangible investment is the acquisition of a good which can be used to produce a future flow ofproducts (goods or services), for example a paper mill. In most cases investment goods are produced byone firm (and industry) and purchased and used by other firms (and industries). For example, the papermill is produced by firm A (supply) in the plant and equipment industry and purchased by firm B in the
6
pulp and paper industry (demand). The cost to firm B is the “purchaser’s price”, which is higher than the“producer’s price” as it may include the value of non-recuperable VAT and transport costs.
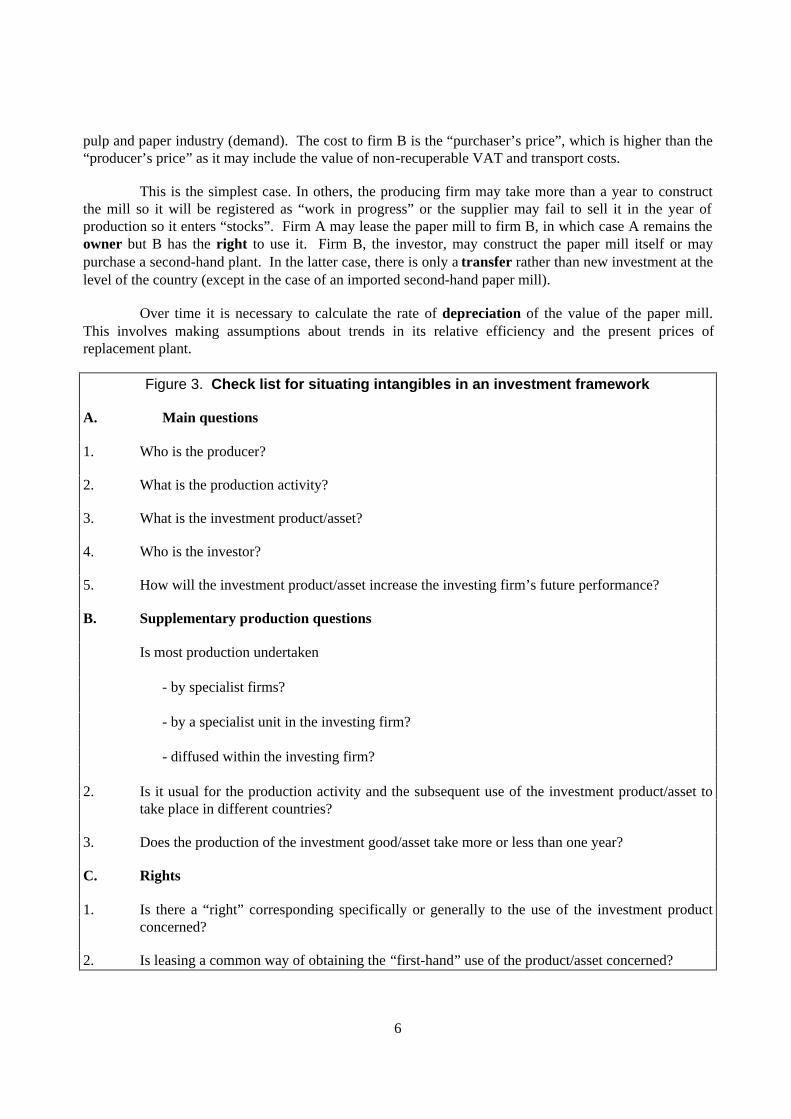
This is the simplest case. In others, the producing firm may take more than a year to constructthe mill so it will be registered as “work in progress” or the supplier may fail to sell it in the year ofproduction so it enters “stocks”. Firm A may lease the paper mill to firm B, in which case A remains theowner but B has the right to use it. Firm B, the investor, may construct the paper mill itself or maypurchase a second-hand plant. In the latter case, there is only a transfer rather than new investment at thelevel of the country (except in the case of an imported second-hand paper mill).
Over time it is necessary to calculate the rate of depreciation of the value of the paper mill.This involves making assumptions about trends in its relative efficiency and the present prices ofreplacement plant.
Figure 3. Check list for situating intangibles in an investment framework
A. Main questions
1. Who is the producer?
2. What is the production activity?
3. What is the investment product/asset?
4. Who is the investor?
5. How will the investment product/asset increase the investing firm’s future performance?
B. Supplementary production questions
Is most production undertaken
- by specialist firms?
- by a specialist unit in the investing firm?
- diffused within the investing firm?
2. Is it usual for the production activity and the subsequent use of the investment product/asset totake place in different countries?
3. Does the production of the investment good/asset take more or less than one year?
C. Rights
1. Is there a “right” corresponding specifically or generally to the use of the investment productconcerned?
2. Is leasing a common way of obtaining the “first-hand” use of the product/asset concerned?
7
4.3 Basic tenets applied to intangibles.
It is both enlightening and frustrating to apply these concepts to the items initially included inintangible investment. For each one we should be able to specify: the producer, the production activity,the investment product asset, the investor, the owner and the right to use the investment product for futureproduction. It is also useful to consider how the asset will improve the performance of the investor.
These questions are shown in the check list in Figure 3. It also covers some supplementaryquestions on production which are intended to identify typical relationships between the producer and theinvestor, including their geographic relationship. For example, if most production is undertaken byspecialist firms we can treat the output of the industry concerned as a proxy for the investment in theproduct. If, as in the case of R&D, much of it is undertaken within the investing firm, this approach is notvalid. The other questions invite reflection about trade in the investment product and whether there areproblems of “lumpiness” or “work in progress”. The second set of supplementary questions deals withrights and leasing.
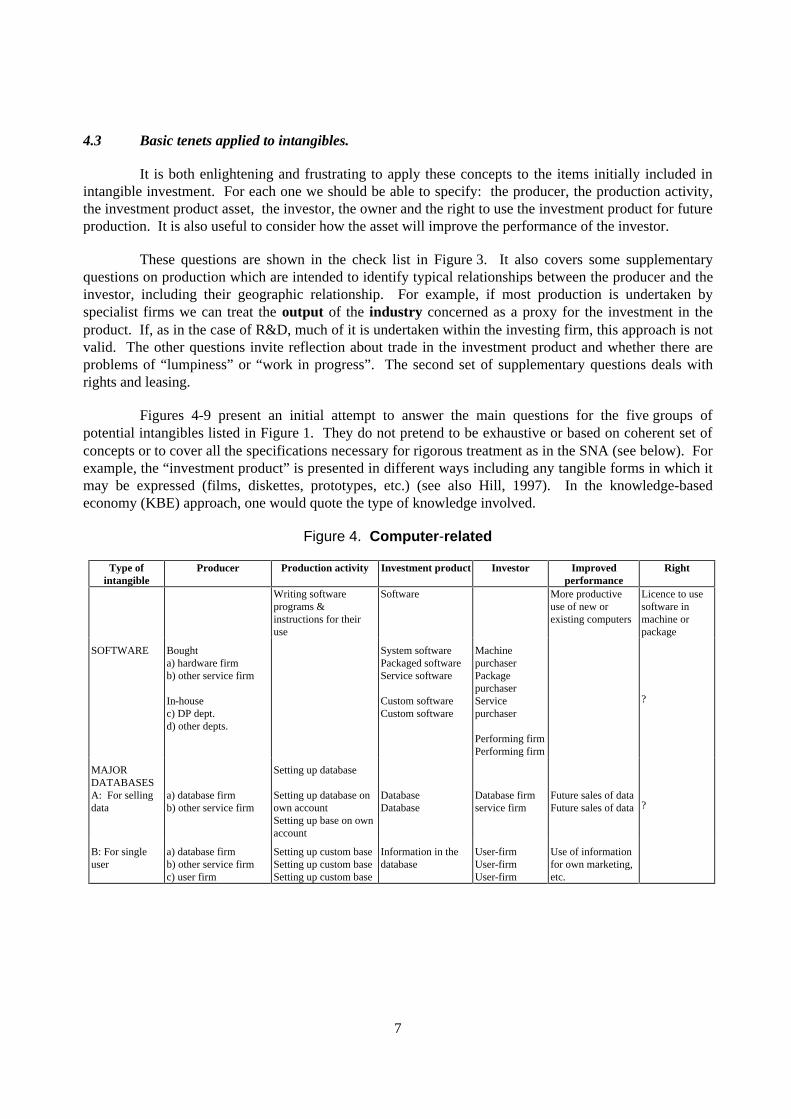
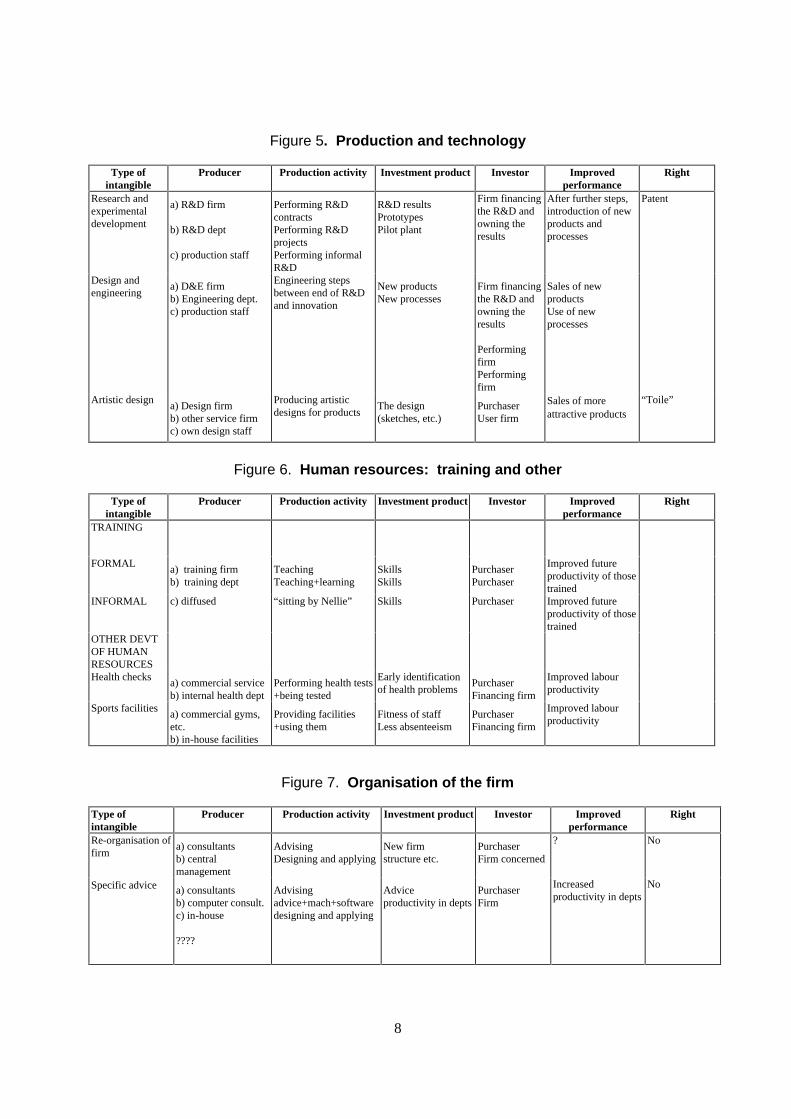
Figures 4-9 present an initial attempt to answer the main questions for the five groups ofpotential intangibles listed in Figure 1. They do not pretend to be exhaustive or based on coherent set ofconcepts or to cover all the specifications necessary for rigorous treatment as in the SNA (see below). Forexample, the “investment product” is presented in different ways including any tangible forms in which itmay be expressed (films, diskettes, prototypes, etc.) (see also Hill, 1997). In the knowledge-basedeconomy (KBE) approach, one would quote the type of knowledge involved.
Figure 4. Computer-related
Type ofintangible
Producer Production activity Investment product Investor Improvedperformance
Right
Writing softwareprograms &instructions for theiruse
Software More productiveuse of new orexisting computers
Licence to usesoftware inmachine orpackage
SOFTWARE Boughta) hardware firmb) other service firm
In-housec) DP dept.d) other depts.
System softwarePackaged softwareService software
Custom softwareCustom software
MachinepurchaserPackagepurchaserServicepurchaser
Performing firmPerforming firm
?
MAJORDATABASESA: For sellingdata
a) database firmb) other service firm
Setting up database
Setting up database onown accountSetting up base on ownaccount
DatabaseDatabase
Database firmservice firm
Future sales of dataFuture sales of data ?
B: For singleuser
a) database firmb) other service firmc) user firm
Setting up custom baseSetting up custom baseSetting up custom base
Information in thedatabase
User-firmUser-firmUser-firm
Use of informationfor own marketing,etc.
8
Figure 5. Production and technology
Type ofintangible
Producer Production activity Investment product Investor Improvedperformance
Right
Research andexperimentaldevelopment
a) R&D firm
b) R&D dept
c) production staff
Performing R&DcontractsPerforming R&DprojectsPerforming informalR&D
R&D resultsPrototypesPilot plant
Firm financingthe R&D andowning theresults
After further steps,introduction of newproducts andprocesses
Patent
Design andengineering
a) D&E firmb) Engineering dept.c) production staff
Engineering stepsbetween end of R&Dand innovation
New productsNew processes
Firm financingthe R&D andowning theresults
PerformingfirmPerformingfirm
Sales of newproductsUse of newprocesses
Artistic designa) Design firmb) other service firmc) own design staff
Producing artisticdesigns for products
The design(sketches, etc.)
PurchaserUser firm
Sales of moreattractive products
“Toile”
Figure 6. Human resources: training and other
Type ofintangible
Producer Production activity Investment product Investor Improvedperformance
Right
TRAINING
FORMALa) training firmb) training dept
TeachingTeaching+learning
SkillsSkills
PurchaserPurchaser
Improved futureproductivity of thosetrained
INFORMAL c) diffused “sitting by Nellie” Skills Purchaser Improved futureproductivity of thosetrained
OTHER DEVTOF HUMANRESOURCESHealth checks
a) commercial serviceb) internal health dept
Performing health tests+being tested
Early identificationof health problems
PurchaserFinancing firm
Improved labourproductivity
Sports facilitiesa) commercial gyms,etc.b) in-house facilities
Providing facilities+using them
Fitness of staffLess absenteeism
PurchaserFinancing firm
Improved labourproductivity
Figure 7. Organisation of the firm
Type ofintangible
Producer Production activity Investment product Investor Improvedperformance
Right
Re-organisation offirm
a) consultantsb) centralmanagement
AdvisingDesigning and applying
New firmstructure etc.
PurchaserFirm concerned
? No
Specific advice a) consultantsb) computer consult.c) in-house
????
Advisingadvice+mach+softwaredesigning and applying
Adviceproductivity in depts
PurchaserFirm
Increasedproductivity in depts
No
9
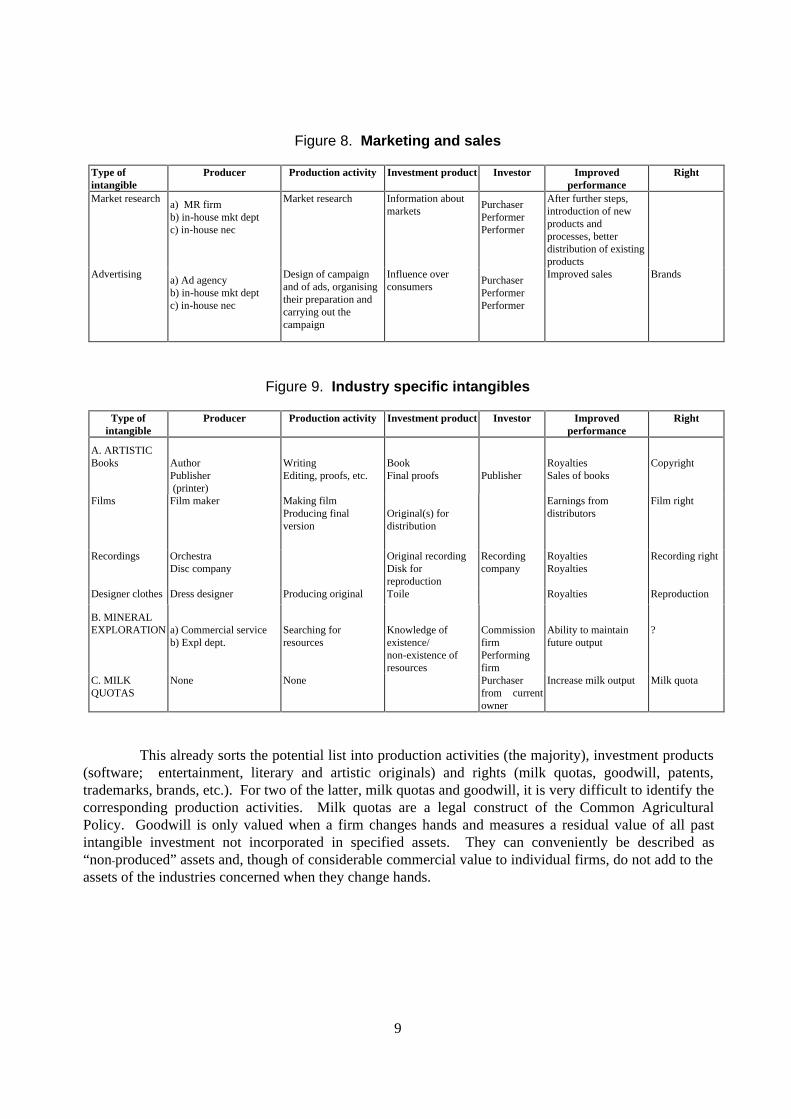
Figure 8. Marketing and sales
Type ofintangible
Producer Production activity Investment product Investor Improvedperformance
Right
Market researcha) MR firmb) in-house mkt deptc) in-house nec
Market research Information aboutmarkets
PurchaserPerformerPerformer
After further steps,introduction of newproducts andprocesses, betterdistribution of existingproducts
Advertisinga) Ad agencyb) in-house mkt deptc) in-house nec
Design of campaignand of ads, organisingtheir preparation andcarrying out thecampaign
Influence overconsumers
PurchaserPerformerPerformer
Improved sales Brands
Figure 9. Industry specific intangibles
Type ofintangible
Producer Production activity Investment product Investor Improvedperformance
Right
A. ARTISTICBooks Author
Publisher (printer)
WritingEditing, proofs, etc.
BookFinal proofs Publisher
RoyaltiesSales of books
Copyright
Films Film maker Making filmProducing finalversion
Original(s) fordistribution
Earnings fromdistributors
Film right
Recordings OrchestraDisc company
Original recordingDisk forreproduction
Recordingcompany
RoyaltiesRoyalties
Recording right
Designer clothes Dress designer Producing original Toile Royalties Reproduction
B. MINERALEXPLORATION a) Commercial service
b) Expl dept.Searching forresources
Knowledge ofexistence/non-existence ofresources
CommissionfirmPerformingfirm
Ability to maintainfuture output
?
C. MILKQUOTAS
None None Purchaserfrom currentowner
Increase milk output Milk quota
This already sorts the potential list into production activities (the majority), investment products(software; entertainment, literary and artistic originals) and rights (milk quotas, goodwill, patents,trademarks, brands, etc.). For two of the latter, milk quotas and goodwill, it is very difficult to identify thecorresponding production activities. Milk quotas are a legal construct of the Common AgriculturalPolicy. Goodwill is only valued when a firm changes hands and measures a residual value of all pastintangible investment not incorporated in specified assets. They can conveniently be described as“non-produced” assets and, though of considerable commercial value to individual firms, do not add to theassets of the industries concerned when they change hands.
10
4.4 Relationship between tangible and intangible investment and between intangibles
It is well known that intangible investment is often associated with tangible investment in newplant and equipment, incorporating advanced production processes. For example, a supermarket buys new“ Point of sales” equipment which requires retraining the cashiers.
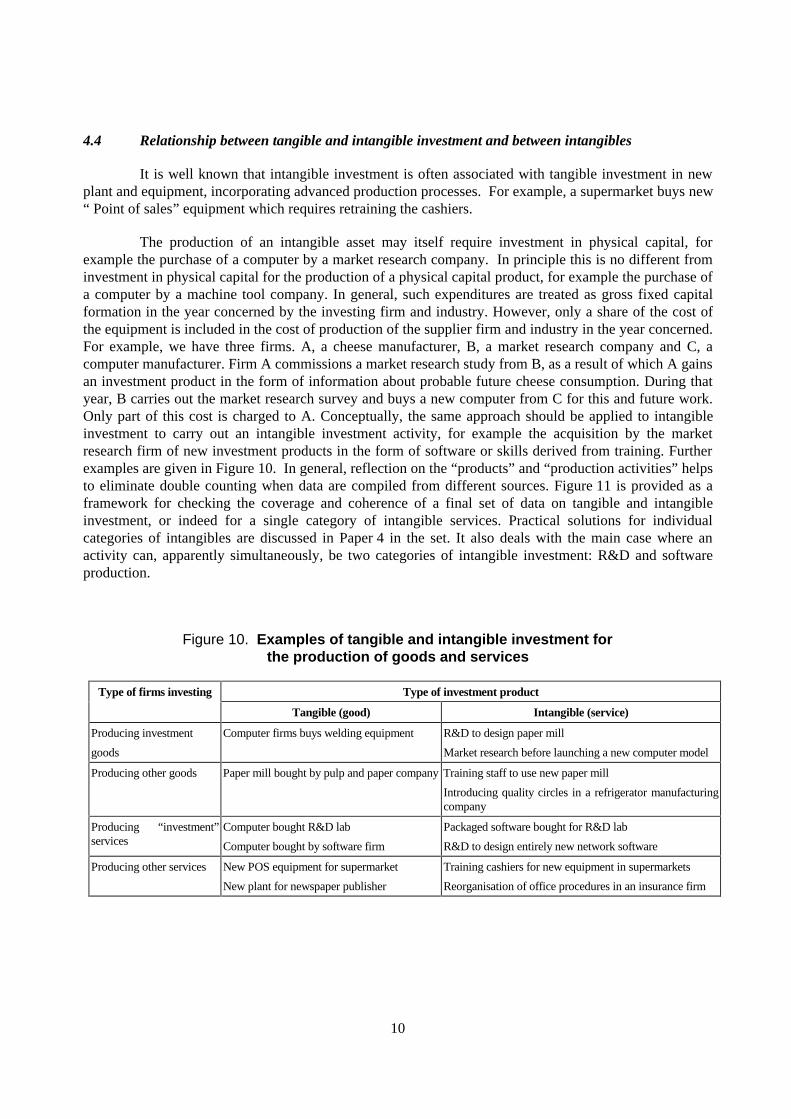
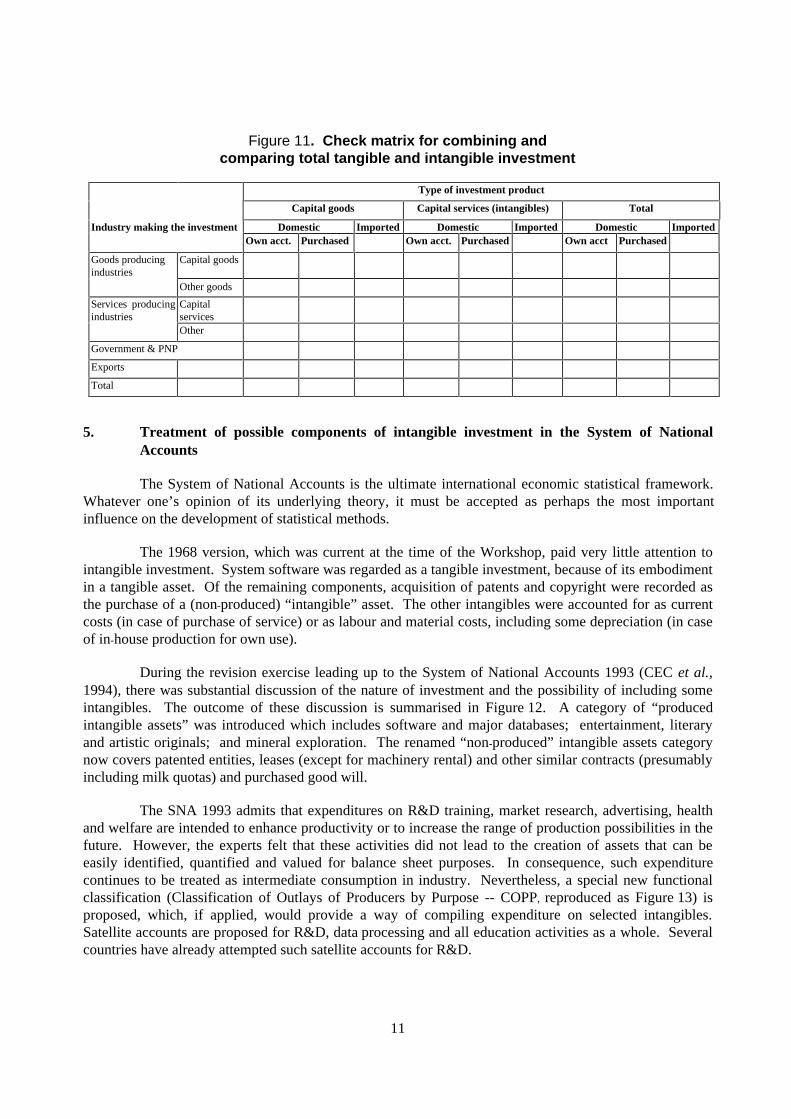
The production of an intangible asset may itself require investment in physical capital, forexample the purchase of a computer by a market research company. In principle this is no different frominvestment in physical capital for the production of a physical capital product, for example the purchase ofa computer by a machine tool company. In general, such expenditures are treated as gross fixed capitalformation in the year concerned by the investing firm and industry. However, only a share of the cost ofthe equipment is included in the cost of production of the supplier firm and industry in the year concerned.For example, we have three firms. A, a cheese manufacturer, B, a market research company and C, acomputer manufacturer. Firm A commissions a market research study from B, as a result of which A gainsan investment product in the form of information about probable future cheese consumption. During thatyear, B carries out the market research survey and buys a new computer from C for this and future work.Only part of this cost is charged to A. Conceptually, the same approach should be applied to intangibleinvestment to carry out an intangible investment activity, for example the acquisition by the marketresearch firm of new investment products in the form of software or skills derived from training. Furtherexamples are given in Figure 10. In general, reflection on the “products” and “production activities” helpsto eliminate double counting when data are compiled from different sources. Figure 11 is provided as aframework for checking the coverage and coherence of a final set of data on tangible and intangibleinvestment, or indeed for a single category of intangible services. Practical solutions for individualcategories of intangibles are discussed in Paper 4 in the set. It also deals with the main case where anactivity can, apparently simultaneously, be two categories of intangible investment: R&D and softwareproduction.
Figure 10. Examples of tangible and intangible investment forthe production of goods and services
Type of firms investing Type of investment product
Tangible (good) Intangible (service)
Producing investment
goods
Computer firms buys welding equipment R&D to design paper mill
Market research before launching a new computer model
Producing other goods Paper mill bought by pulp and paper company Training staff to use new paper mill
Introducing quality circles in a refrigerator manufacturingcompany
Producing “investment”services
Computer bought R&D lab
Computer bought by software firm
Packaged software bought for R&D lab
R&D to design entirely new network software
Producing other services New POS equipment for supermarket
New plant for newspaper publisher
Training cashiers for new equipment in supermarkets
Reorganisation of office procedures in an insurance firm
11
Figure 11. Check matrix for combining andcomparing total tangible and intangible investment
Type of investment product
Capital goods Capital services (intangibles) Total
Industry making the investment Domestic Imported Domestic Imported Domestic ImportedOwn acct. Purchased Own acct. Purchased Own acct Purchased
Goods producingindustries
Capital goods
Other goods
Services producingindustries
CapitalservicesOther
Government & PNP
Exports
Total
5. Treatment of possible components of intangible investment in the System of NationalAccounts
The System of National Accounts is the ultimate international economic statistical framework.Whatever one’s opinion of its underlying theory, it must be accepted as perhaps the most importantinfluence on the development of statistical methods.
The 1968 version, which was current at the time of the Workshop, paid very little attention tointangible investment. System software was regarded as a tangible investment, because of its embodimentin a tangible asset. Of the remaining components, acquisition of patents and copyright were recorded asthe purchase of a (non-produced) “intangible” asset. The other intangibles were accounted for as currentcosts (in case of purchase of service) or as labour and material costs, including some depreciation (in caseof in-house production for own use).
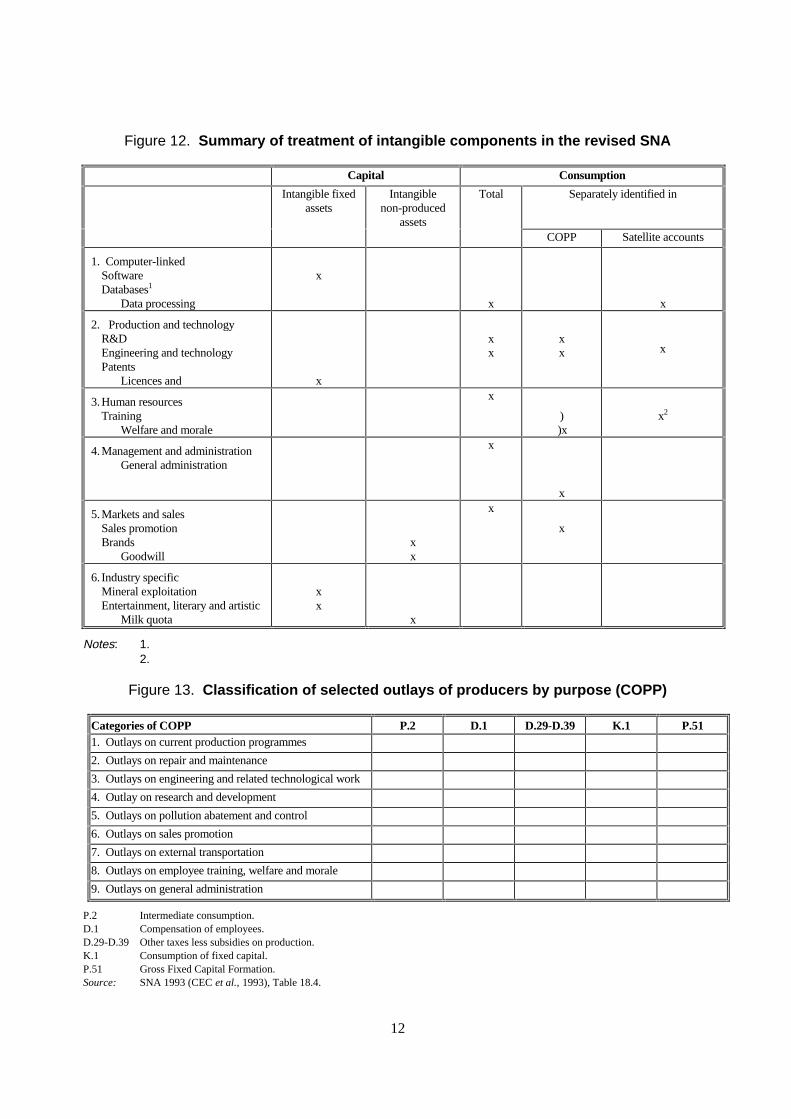
During the revision exercise leading up to the System of National Accounts 1993 (CEC et al.,1994), there was substantial discussion of the nature of investment and the possibility of including someintangibles. The outcome of these discussion is summarised in Figure 12. A category of “producedintangible assets” was introduced which includes software and major databases; entertainment, literaryand artistic originals; and mineral exploration. The renamed “non-produced” intangible assets categorynow covers patented entities, leases (except for machinery rental) and other similar contracts (presumablyincluding milk quotas) and purchased good will.
The SNA 1993 admits that expenditures on R&D training, market research, advertising, healthand welfare are intended to enhance productivity or to increase the range of production possibilities in thefuture. However, the experts felt that these activities did not lead to the creation of assets that can beeasily identified, quantified and valued for balance sheet purposes. In consequence, such expenditurecontinues to be treated as intermediate consumption in industry. Nevertheless, a special new functionalclassification (Classification of Outlays of Producers by Purpose -- COPP, reproduced as Figure 13) isproposed, which, if applied, would provide a way of compiling expenditure on selected intangibles.Satellite accounts are proposed for R&D, data processing and all education activities as a whole. Severalcountries have already attempted such satellite accounts for R&D.
12
Figure 12. Summary of treatment of intangible components in the revised SNA
Capital Consumption
Intangible fixedassets
Intangiblenon-produced
assets
Total Separately identified in
COPP Satellite accounts
1. Computer-linkedSoftwareDatabases1
Data processing
x
x x
2. Production and technologyR&DEngineering and technologyPatents
Licences and x
xx
xx x
3.Human resourcesTraining
Welfare and morale
x
))x
x2
4.Management and administrationGeneral administration
x
x
5.Markets and salesSales promotionBrands
Goodwillxx
x
x
6. Industry specificMineral exploitationEntertainment, literary and artistic
Milk quota
xx
x
Notes: 1.2.
Figure 13. Classification of selected outlays of producers by purpose (COPP)
Categories of COPP P.2 D.1 D.29-D.39 K.1 P.511. Outlays on current production programmes
2. Outlays on repair and maintenance
3. Outlays on engineering and related technological work
4. Outlay on research and development
5. Outlays on pollution abatement and control
6. Outlays on sales promotion
7. Outlays on external transportation
8. Outlays on employee training, welfare and morale
9. Outlays on general administration
P.2 Intermediate consumption.D.1 Compensation of employees.D.29-D.39 Other taxes less subsidies on production.K.1 Consumption of fixed capital.P.51 Gross Fixed Capital Formation.Source: SNA 1993 (CEC et al., 1993), Table 18.4.
13
The treatment of intangibles in the SNA 1993 is described at greater length in the sixth paper inthis series.
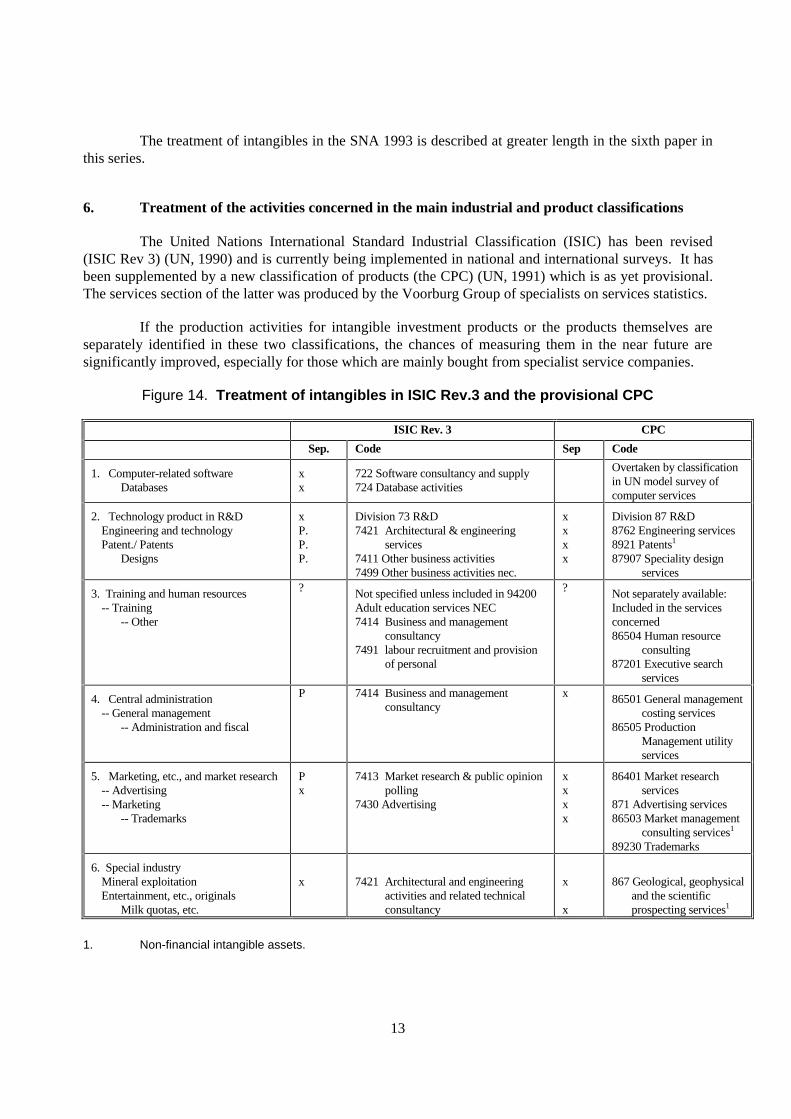
6. Treatment of the activities concerned in the main industrial and product classifications
The United Nations International Standard Industrial Classification (ISIC) has been revised(ISIC Rev 3) (UN, 1990) and is currently being implemented in national and international surveys. It hasbeen supplemented by a new classification of products (the CPC) (UN, 1991) which is as yet provisional.The services section of the latter was produced by the Voorburg Group of specialists on services statistics.
If the production activities for intangible investment products or the products themselves areseparately identified in these two classifications, the chances of measuring them in the near future aresignificantly improved, especially for those which are mainly bought from specialist service companies.
Figure 14. Treatment of intangibles in ISIC Rev.3 and the provisional CPC
ISIC Rev. 3 CPC
Sep. Code Sep Code
1. Computer-related softwareDatabases
xx
722 Software consultancy and supply724 Database activities
Overtaken by classificationin UN model survey ofcomputer services
2. Technology product in R&DEngineering and technologyPatent./ Patents
Designs
xP.P.P.
Division 73 R&D7421 Architectural & engineering
services7411 Other business activities7499 Other business activities nec.
xxxx
Division 87 R&D8762 Engineering services8921 Patents1
87907 Speciality designservices
3. Training and human resources-- Training
-- Other
? Not specified unless included in 94200Adult education services NEC7414 Business and management
consultancy7491 labour recruitment and provision
of personal
? Not separately available:Included in the servicesconcerned86504 Human resource
consulting87201 Executive search
services
4. Central administration-- General management
-- Administration and fiscal
P 7414 Business and managementconsultancy
x 86501 General managementcosting services
86505 ProductionManagement utilityservices
5. Marketing, etc., and market research-- Advertising-- Marketing
-- Trademarks
Px
7413 Market research & public opinionpolling
7430 Advertising
xxxx
86401 Market researchservices
871 Advertising services86503 Market management
consulting services1
89230 Trademarks
6. Special industryMineral exploitationEntertainment, etc., originals
Milk quotas, etc.
x 7421 Architectural and engineeringactivities and related technicalconsultancy
x
x
867 Geological, geophysicaland the scientificprospecting services1
1. Non-financial intangible assets.
14
Figure 14 summarises the situation. The actual definitions will be found in Paper 7 in this series.The table reveals that R&D and software and database activities now merit their own industries. Most ofthe other categories can be distinguished in the provisional CPC if not in ISIC Rev.3. The most difficultof all to identify is training. It is not clear where, compared with main function, the provision of trainingshould be classified. The CPC includes training with the corresponding service, for example computertraining with computer services.
7. Treatment in specialist methodologies
The compilation of intangible investment data will be easier if there are already internationallyaccepted statistical standards and surveys for the component concerned.
7.1 The “Frascati family” of manuals
The OECD Group of National Experts on Science and Technology Indicators (NESTI) hasproduced a set of guidelines for measuring scientific and technological activities and undertakes theassociated national surveys. Three of these manuals are relevant to the current exercise: i) The FrascatiManual on R&D (OECD, 1994); ii) the TBP Manual on the Technology Balance of Payments(OECD, 1990); iii) the Oslo Manual on the measurement of technological innovation (OECD, 1992b;OECD/Eurostat, 1997).
The Frascati Manual has been in existence since the early 1960s, and the fifth edition waspublished in 1994. OECD maintains a major database of R&D statistics. These series are not designedfor use for measuring intangible investment and require a certain amount of adjustment to meet the latterneed. These adjustments are discussed in the next paper and at greater length in the eighth paper in thisseries.
The Technology Balance of Payments measures flows of funds between country for patents(purchase, sales), licences for patents; know-how (not patented), models and designs; trademarks(including brands), technical services, finance of industrial R&D outside national territory. It excludescommercial, financial, managerial and legal assistance, advertising, insurance, transport, films, recordings,material covered by copyright, design and software. The data can be taken as a proxy for imports andexports of category 2 intangibles, but excludes transfers within the country or for any other category ofintangibles. OECD maintains a reasonable base of global TBP data but with no information on flowsbetween industries.
The Oslo Manual on the measurement of technical innovation was only issued in 1992 and thefirst extensive international (CIS) survey, organised and financed by the European Commission, inco-operation with OECD, has recently been completed. The second edition was published in 1997 and asecond CIS is currently in progress.
The theory of innovation, cited extensively in the first and second papers in this compendium, isstill developing and its extension to social innovations is making it increasingly difficult to distinguishfrom the wider concept of investment in knowledge and competence presented by Professor Clement(Paper 2). The Oslo Manual, however, covers only technological innovation.
As it currently stands, it is difficult to derive a set of data on intangible investment from theresults of innovation surveys. (Data for Finland suggest that only about half intangible investment is
15
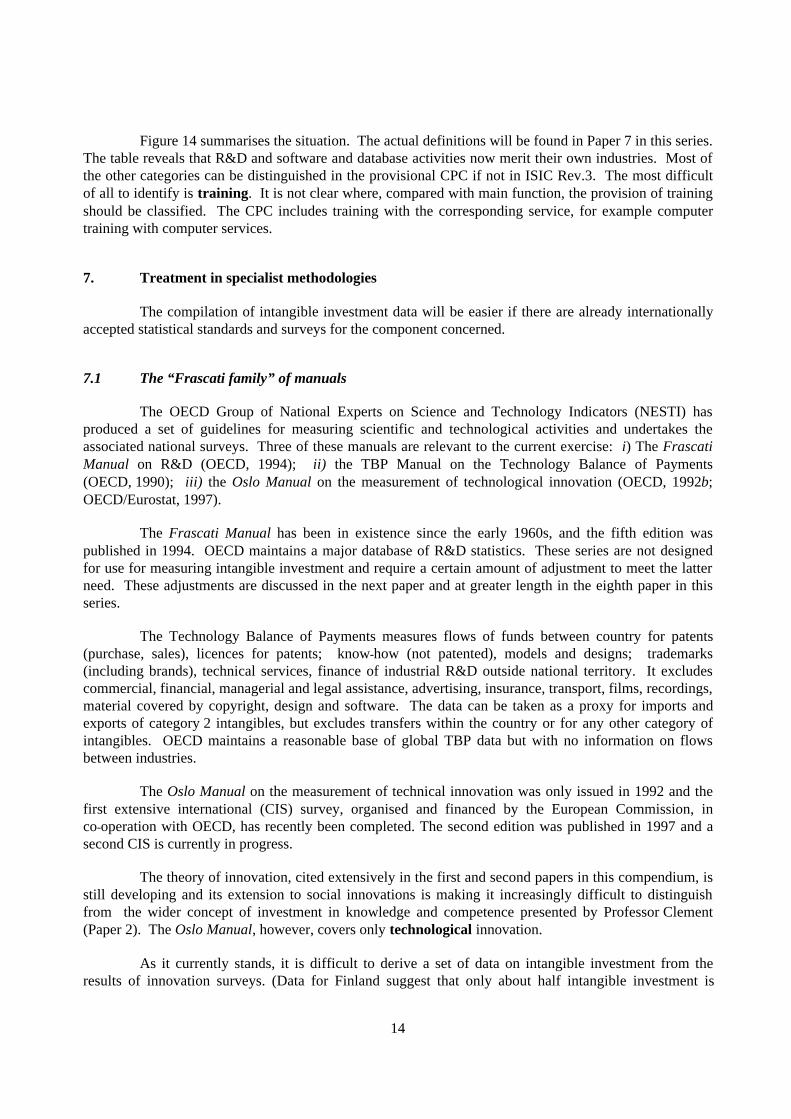
associated with technological innovation.) Such surveys only cover intangible activities associated withthe implementation of technologically new products and processes but include the associated physicalcapital (Figure 15). The first edition of the Oslo Manual and surveys only covered manufacturingwhereas the second edition and survey also include marketed services. The second edition of the Manualalso includes an annex dealing with non-technological innovation, e.g. concerning organisational change.
Figure 15. Treatment of selected activities in expenditure oninnovation activities and intangible investment
Innovation for new products andprocesses = FNPP Intangible investment
R&D All included All included
Training FNPP only All
Software FNPP only All
Marketing FNPP only All
Rights Technology only Also artistic, etc.
Mineral exploration Some in R&D All
Development of the organisation Currently excluded1 Major reorganisation included
Design & engineering FNPP only Exclusion proposed
Other production activities FNPP only Excluded
Acquisition of plant and equipment FNPP only Excluded
1. First surveys only covered manufacturing so not relevant.2. Surveys based on the first edition of the Oslo Manual (OECD, 1992b) exclude introduction of new processes in
support departments such as finance or sales. In the revised edition (OECD/Eurostat, 1997), technologicalinnovation in ancillary activities is included.
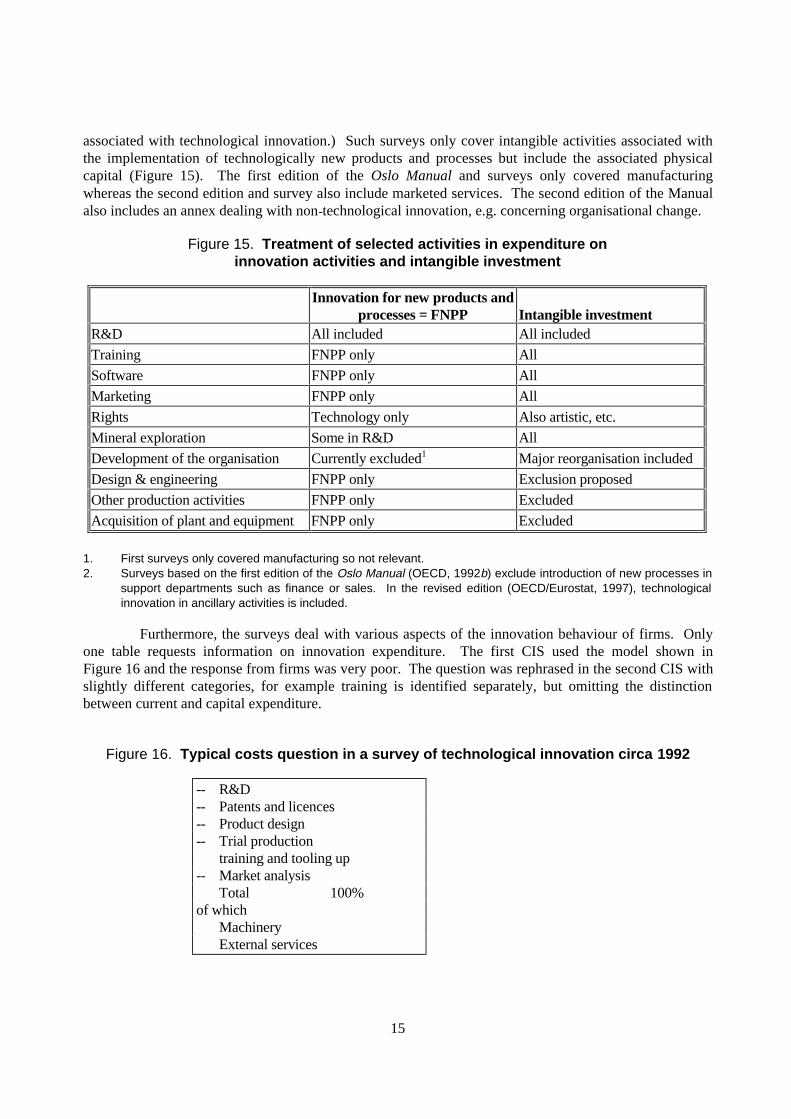
Furthermore, the surveys deal with various aspects of the innovation behaviour of firms. Onlyone table requests information on innovation expenditure. The first CIS used the model shown inFigure 16 and the response from firms was very poor. The question was rephrased in the second CIS withslightly different categories, for example training is identified separately, but omitting the distinctionbetween current and capital expenditure.
Figure 16. Typical costs question in a survey of technological innovation circa 1992
-- R&D-- Patents and licences-- Product design-- Trial production
training and tooling up-- Market analysis
Total 100%of which
MachineryExternal services
16
7.2 The model survey of computer services
This was designed by the Voorburg Group and adopted and published by the United Nations in1992. It consists of a set of “modules” dealing with different measures of computer services activities(including R&D) to be added to the appropriate surveys of industry. It provides a revised classification ofcomputing activities to replace those in the provisional CPC which deals extensively with software andalso specifies database services.
If and when its recommendations are introduced by national survey agencies, they should beable supply much of the information needed for measuring intangible investment in software, especiallypackaged software, and also some data on databases. For further details see the ninth paper in this series.
7.3 The OECD training statistics manual
Work has just been completed on a set of OECD guidelines for training statistics (Murphy andKlee, Paper 10). Its application is still at an early stage.
7.4 Other sources of methodology and data
In the computing area there are a number of commercial data services which can providerelevant but usually expensive data. Data on advertising and marketing can also be obtained from nationaland international trade sources.
8. Company accounting conventions
Although this paper concentrates on the need for economic statistics on intangible investmentand on conventions for treating services with investment characteristics, some comments on accountingrules are appropriate.
Accounting rules are of interest to statisticians. First of all it should be noted that in order toobtain economic statistics concerning enterprises, the latter must have suitable internal sources of data.Collecting statistical data may be severely hampered by insufficient data availability within firms.
The official accounting conventions set the standard, although firms may also keep internalaccounts using deviating accounting rules. Correspondence between statistical definitions and accountingrules has many advantages, i.e. data definitions are crystal clear, thus facilitating answering the questions.Furthermore, firms have easy access to the data in question, which results in a better response andhomogeneous data.
In all OECD countries, it is permitted to enter a few intangible items in the balance sheet.Common topics are: R&D expenses, costs for concessions, for patents and licences, paid goodwill, etc.However, international harmonization of accounting rules suffers from the same weakness asharmonization of statistics: differences between national standards were large from the outset andprogress has been made, but only rather slowly.
Nevertheless, the fact that firms may enter services in the balance sheet does not imply anyobligation to do so. Insertion is compulsory in several OECD countries and as a result only a minority ofthe firms treat these expenses as an investment.

17
Finally, balance sheet information pertains to the group of enterprises; often no balance sheetinformation is available for single enterprises, which hinders the production of useful statistics, especiallyrelating to industry branches or size classes.
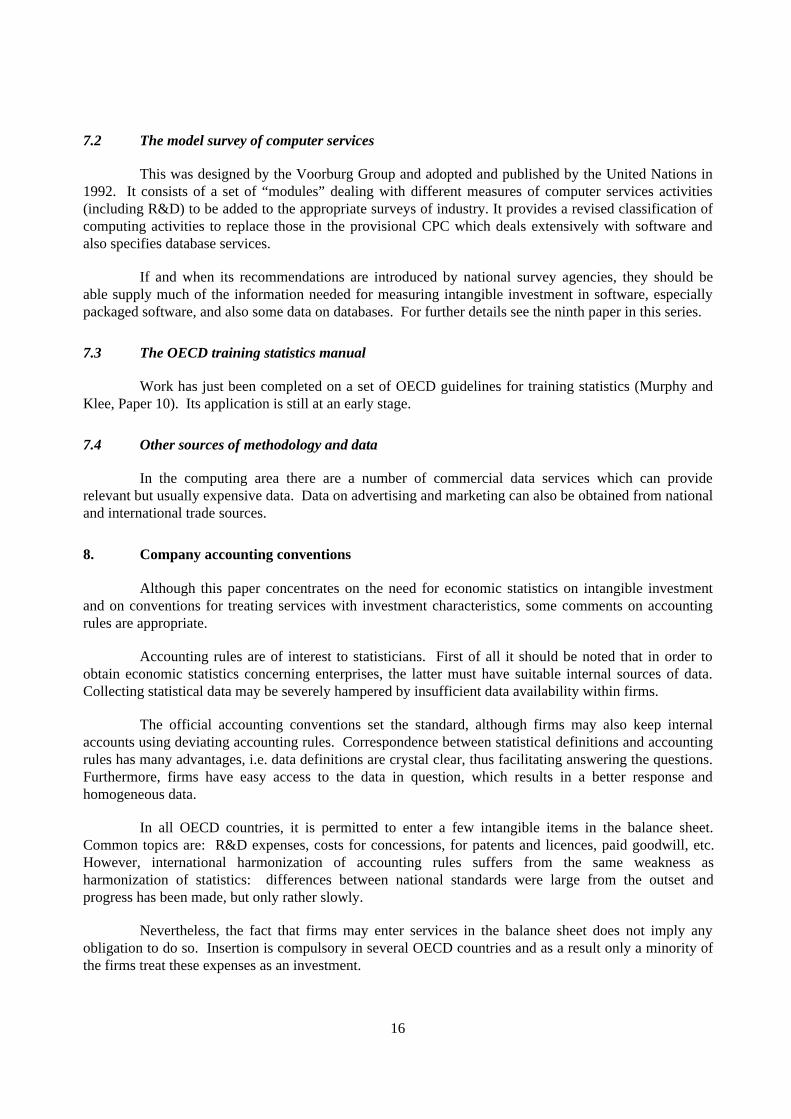
Most likely, balance sheets cannot act as a source of statistical data on intangible assets, inparticular not in the short term. For recent developments, see Papers 11 and 12 in this series.
Figure 17. Nature of intangible assets recognised
Patent/Trade
Marks/BrandsLicences/Publishing
rights, etc.
Research &developmentexpenditure
Computersoftware
Companyformationexpenses
Humanresources,training
Purchasedgoodwill
Australia Yes Yes NS NS NO Yes
Belgium Yes Yes NS Yes NO Yes
Canada Yes Yes NS NS NS Yes
France Yes Yes Yes Yes NS Yes
Germany Yes No NS Yes NO Yes
Italy Yes Yes Yes Yes NO Yes
Japan Yes Yes Yes Yes NO Yes
Luxembourg Yes Yes NS Yes NS Yes
Netherlands Yes Yes Yes Yes NS Yes
Portugal Yes Yes Yes Yes NS Yes
Sweden Yes Yes Yes NS NS Yes
Switzerland Yes Yes NS Yes NS Yes
Turkey NS NS NS Yes NS Yes
United Kingdom Yes Yes Yes NS NS Yes
United States Yes No Yes NS Yes Yes
European Community Yes Yes NS Yes NS Yes
ISASC Yes Yes NS Yes NS Yes
UN-ISAR Yes Yes NS Yes NS Yes
NS: Not specified.Source: OECD Working Group on Accounting Standards, 1991.
In short we may identify four levels of relevance in companies: i) when the activity can and istreated as a capital item in the company accounts; ii) when it is described in the company’s annual reportand a sum is quoted, which is now standard practice for R&D in the United States or the United Kingdom;iii) when the activity is subsidised in some way by the government, for example through a tax break, or iscovered by regulations of some kind, such as training in France; iv) where the management has some ideaof the activity and how much is spent on it for purely internal planning reasons.
It may be suggested that the understanding of intangible investment activities and the possibilityof putting a cost on them will be greater in large companies which may have specialist units such as R&D
18
labs or marketing departments, particularly in modern industries and much lower in small and medium-sized enterprises in traditional industries where any such activities may only be undertaken in a verydiffuse way.
9. Empirical studies
The original international survey in this area was that undertaken for the OECD in 1987(Kaplan, 1987). This paper listed a number of possible intangible investment items before settling on four“core components” for which data could be compiled for a number of countries. They were R&D,software, training and marketing.
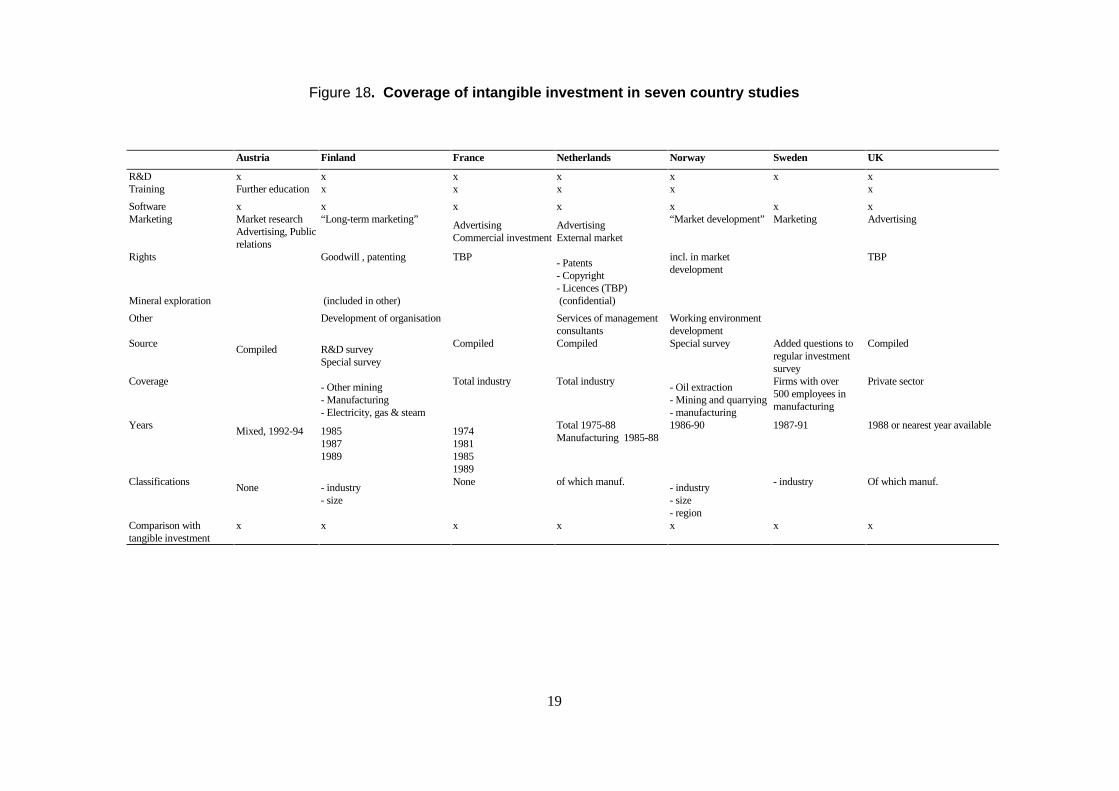
Six countries, Finland, France, the Netherlands, Norway, Sweden and the United Kingdom,contributed papers to the December 1992 Workshop describing national exercises to measure intangibleinvestment and to compare it with tangible investment. They are summarised in the fifth paper in theseries. Later information on Austria (Hammerer, 1996) and the Netherlands (Minne, 1996) has beenadded.
Two countries, Finland and Norway, had undertaken more than one special survey usingtailor-made questionnaire on intangible investment. In Sweden, additional questions, on R&D, softwareand marketing, had been added to a regular industrial survey. One of the two Austrian exercises involveda pilot survey of the electronic and electrical engineering industries. The studies for France, theNetherlands, the United Kingdom and one Austrian exercise were straight compilation exercisescombining data from existing sources. These compilations covered all industry, whereas the surveyscovered large firms in manufacturing (Sweden), mining and manufacturing (Norway) and mining,manufacturing and utilities (Finland).
All the exercises included investment in R&D. In all except Norway and Sweden, the data usedwere the results of national R&D surveys. Only in Norway do efforts seem to have been made to adjustthe R&D data to match the special requirements of intangible investment analysis.
Software investment was also included in all the exercises, as were at least some aspects ofmarketing. All except Sweden included training.
Some types of “rights” were included in all except Sweden. In France and the United Kingdomthe data are actually payments on the Technology Balance Payments and this source was also used in theNetherlands. Both Finland and Norway specifically included payments for “goodwill”. Only Finlandspecifically included mineral exploration. (The available data could not be used in the Netherlandsbecause of problems of statistical secrecy.)
19
Figure 18. Coverage of intangible investment in seven country studies
Austria Finland France Netherlands Norway Sweden UK
R&D x x x x x x xTraining Further education x x x x x
Software x x x x x x xMarketing Market research
Advertising, Publicrelations
“Long-term marketing”AdvertisingCommercial investment
AdvertisingExternal market
“Market development” Marketing Advertising
Rights Goodwill , patenting TBP- Patents- Copyright- Licences (TBP)
incl. in marketdevelopment
TBP
Mineral exploration (included in other) (confidential)
Other Development of organisation Services of managementconsultants
Working environmentdevelopment
SourceCompiled R&D survey
Special survey
Compiled Compiled Special survey Added questions toregular investmentsurvey
Compiled
Coverage- Other mining- Manufacturing- Electricity, gas & steam
Total industry Total industry- Oil extraction- Mining and quarrying- manufacturing
Firms with over500 employees inmanufacturing
Private sector
YearsMixed, 1992-94 1985
19871989
1974198119851989
Total 1975-88Manufacturing 1985-88
1986-90 1987-91 1988 or nearest year available
ClassificationsNone - industry
- size
None of which manuf.- industry- size- region
- industry Of which manuf.
Comparison withtangible investment
x x x x x x x
20
10. Conclusions
The outcome of this review is clear for some of the proposed list of intangibles but less so forothers. In this section six “core components” are suggested for inclusion in all studies of intangibles. Theother are matters of opinion and/or of availability of data for the country concerned.
10.1 Computer-linked
Here the core activity is investment in software. Software to be used for more than one year istreated as a form of intangible produced asset in the SNA 1993, which also gives a minimum set ofinstructions for its measurement. The corresponding industrial activity is specified in ISIC Rev.3 andguidance on measurement can be found in the model computer services survey (UN, 1992). Finally, inpractice, most countries seem to have collected some relevant data already.
The SNA definition of software as an intangible fixed asset also includes “large expenditures onthe purchase, development or extension of databases that are expected to be used for more than one year.”Such databases can be of two kinds, those set up by firms with the aim of selling the contents to users inother industries and those set up by firms for internal use. It is specified that both marketed andnon-marketed bases should be included.
In the first case, if the company concerned provides an on-line information retrieval service it iscovered by “database services” in the UN model computer services survey. If does not have on-lineaccess, for example if it only sells special extractions to order, it is not.
In the second case, that of data for internal use, the purchased, developed or extended databasemay be a tool for one aspect of the firm’s activity, for example billing or marketing. This may includepurchasing information from a market producer database firm. However, the combination of newdatabases and networking can also underlie major changes in the whole information system andorganisation of the firm.
Some relevant data about database firms (and perhaps establishments) will become availablefrom the results of surveys using the UN computer services modules. However building up in-housedatabases would seem much more difficult to measure. Until the SNA is supplemented by specificguidelines on in-house bases and how to distinguish between long- and short-term aspects of databases,particularly in the case of subscriptions and network access, it is suggested that databaseacquisition/construction should not be a core component of intangible investment.
10.2 Technology and production
Research and experimental development (R&D) is clearly the core component in this category.True it is still treated as intermediate consumption in the main text of the SNA 1993 but this new versionrecommends that a separate unit should be declared at establishment level within firms and that satelliteaccounts should be prepared. The activity is separated out in all the classifications reviewed. R&D is ameaningful concept to most large companies and is specially treated in company reports in many of them.It is covered by recommended accountancy practice in a number of countries. International methodologyand data for R&D data are already available, with a breakdown by industry.
21
Data on international trade in industrial technology can be derived from the TBP series. Incountries with an as yet small indigenous industrial R&D effort, purchases of technology from abroad canbe an important form of intangible investment and are recommended for inclusion.
Patents are a right associated with the output of some but not all R&D efforts. They could betreated either in this group or in a generic “rights” category, as is done in the next paper.
Ultimately it would be interesting to establish a way of measuring investment in all theintangible technological activities leading up to innovation (introduction of new products and processes),notably design and engineering. This must probably be postponed until after more experience has beengained with innovation surveys proper.
Artistic design is classified in a different part of standard industrial classifications fromengineering design. The revised Oslo Manual (OECD/Eurostat, 1997) also makes a distinction between“technical innovation” and improvements in products due to artistic design. It has been suggested that itis intangible investment in such artistic design which explains Italian industrial performance despite itslow level of industrial R&D. Some information might be available on the sales of design companies butin-house activities would be very difficult to measure.
10.3 Human resources
The core component here is “formal training”. Unfortunately it is not dealt with specifically inthe revised SNA or in ISIC Rev. 3 or the CPC. It is part of a broader “human resources” category inCOPP classification. It does not appear to receive much attention in company accounts. However, workhas recently been completed at OECD and Eurostat to set up a methodology for surveys of trainingactivities (Paper 10) and most of the countries who presented studies to the Workshop had been able toinclude some data on it.
Measurement of informal training, “learning by doing”, diffused throughout the firm is furtheraway. It might prove easier to obtain some information on activities to improve the long term health andmotivation of the labour force though it would certainly be difficult to separate them for other “fringebenefits”. There seems to be little possibility of compiling data on investment in the health and welfare ofthe workforce.
10.4 Organisation of the firm
This is, as yet, the least well-defined type of intangible investment as the underlying theory isstill being developed. The Finnish survey specifically handled “the cost of developing the organisation orthe overall functioning of the enterprise” as a sub-category. The Norwegian survey only included thecomputer-related aspects of “activities improving the administration and control of the entire organisation,administration and production”. The Netherlands study used the sales of the management consultingindustry from trade sources as a proxy for this category. A number of pilot studies are described inPapers 13-15. Such consultancy is defined in the provisional CPC.
Despite these advances, until one has a better idea of how much “organisation” investment takesplace in-house over and above expenditure on the services of management consultants, it is not possible todecide whether management consultancy can be recommended as a “core component” to represent thiscategory of intangible investment.
22
10.5 External: Marketing and sales
“Marketing” was a core component of the first OECD study (Kaplan, 1987) and one or other ofthe two following activities appear in most of the national surveys: market research and advertising.These are reasonably easy to identify in ISIC Rev.3 and the provisional CPC, and they are recognisableindustries. The problems of distinguishing long-term and short-term advertising are discussed in the nextpaper, which also deals with the practical treatment of brands.
10.6 Industry-specific
Mineral exploration was included in intangible investment in only one of the national studies,that of Finland. It was excluded in Norway even though their special survey intangibles included themining and extraction industries. The data for the Netherlands could not be used because of disclosureproblems. However, mineral exploration is a produced intangible asset in SNA 1993 and the productionactivities can be identified in ISIC Rev.3 and the CPC. It is suggested that it should henceforth be a“core-component” of intangible investment.
The same arguments apply to the production of entertainment, literary and artistic originalswhich should, therefore, be included wherever possible when measuring intangible investment.
In the author’s view it would be better to exclude “non-produced assets”, such as milk quotas,from the core components of intangible investment.
The next paper in this set deals with defining the coverage of these core components and thepractical problems of using the new or earlier version of the methodologies and sources mentioned above,to actually compile coherent sets of data which can be used for economic analysis.
23
REFERENCES
CEC-EUROSTAT, IMF, OECD, UN and THE WORLD BANK (1994), System of National Accounts,1993, prepared under the auspices of the Inter-Secretariat Working Group on National Accounts.
HAMMERER, G. (1996), “Intangible Investments in Austria”, paper presented to the OECD Conferenceon New S&T Indicators for a Knowledge-based Economy, Paris, 19-21 June.
HILL, P. (1997), “Tangibles, Intangibles and Services: A New Taxonomy for the Classification ofOutput”, paper presented to the CSLS Conference on Service Centre Productivity and theProductivity Paradox, Ottawa, Canada, 11-12 April.
KAPLAN, M.C. (1987), “Intangible Investment: An Essay at International Comparison”, memorandumto the OECD Industry Committee, OECD, Paris.
MINNE, B. (1996) “Expenditures in Relation to the Knowledge-based Economy in Ten OECDCountries”, paper presented to the OECD Conference on New S&T Indicators for theKnowledge-based Economy, Paris, 19-21 June.
OECD (1990), “Proposed Standard Method of Compiling and Interpreting Technology Balance ofPayments Data (TBP Manual)”, OECD, Paris.
OECD (1992a), Technology and the Economy: The Key Relationships, OECD, Paris.
OECD (1992b), “OECD Proposed Guidelines for Collecting and Interpreting Technological InnovationData (Oslo Manual)”, OECD, Paris.
OECD (1994a), The Measurement of Scientific and Technical Activities, Proposed Standard Practice forSurveys of Research and Experimental Development, “Frascati Manual” , OECD, Paris.
OECD (1997), The Measurement of Scientific and Technological Activities, Proposed Guidelines forcollecting and Interpreting Technological Innovation Data, “Oslo Manual”, OECD, Paris.
UNITED NATIONS (1990), International Standard Industrial Classification of All Economic Activities,Statistical Papers Series M, No. 4, Rev.3, UN, New York.
UNITED NATIONS (1991), Provisional Central Product Classification (CPC), UN, New York.
UNITED NATIONS (1992), Computer Services, UN, New York.