measuring effectiveness of phytoremediation for a tce ... · pdf filemeasuring effectiveness...
TRANSCRIPT

1
Measuring Effectiveness of Measuring Effectiveness of Phytoremediation for a Phytoremediation for a
TCETCE--Contaminated Contaminated Groundwater Plume Using Sap Flow Groundwater Plume Using Sap Flow
InstrumentationInstrumentation
Third International Third International Phytotechnologies Phytotechnologies Conference Atlanta, GAConference Atlanta, GA
April 2005April 2005
R

2
Presentation PlanPresentation PlanSite Setting and HistoryMonitoring MethodsSap Monitoring ResultsConclusions

3
Site Setting and History Site Setting and History
4
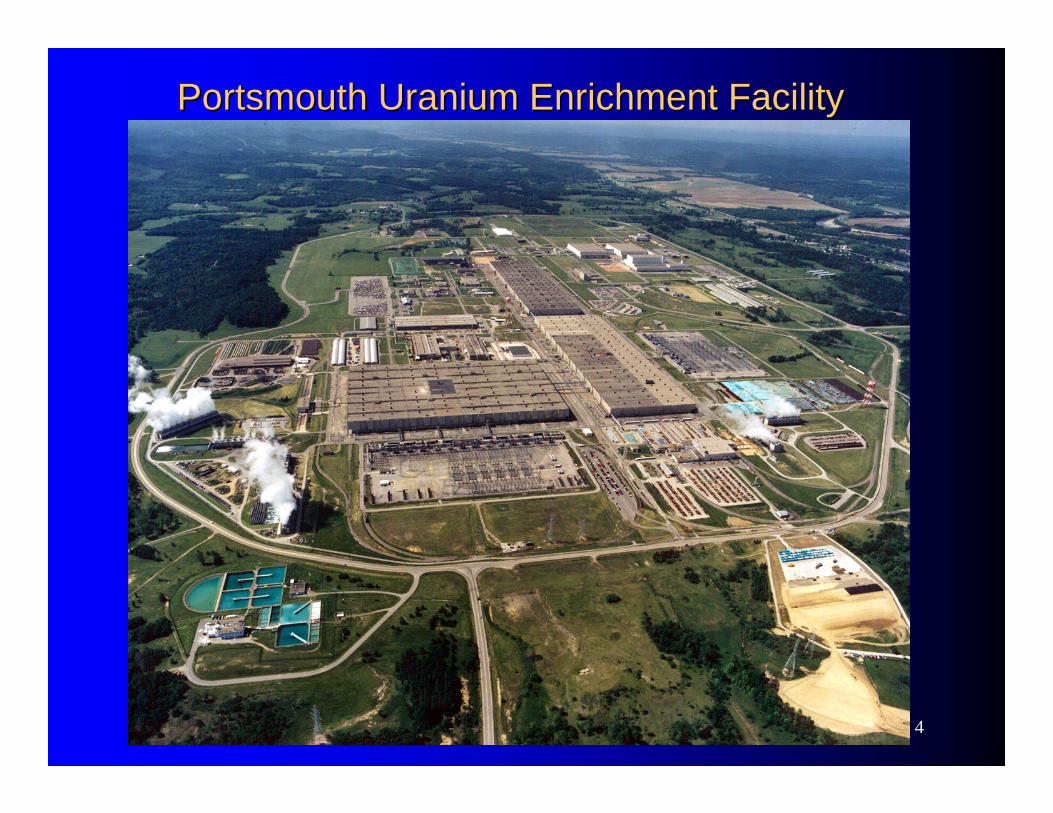
Portsmouth Uranium Enrichment FacilityPortsmouth Uranium Enrichment Facility
5
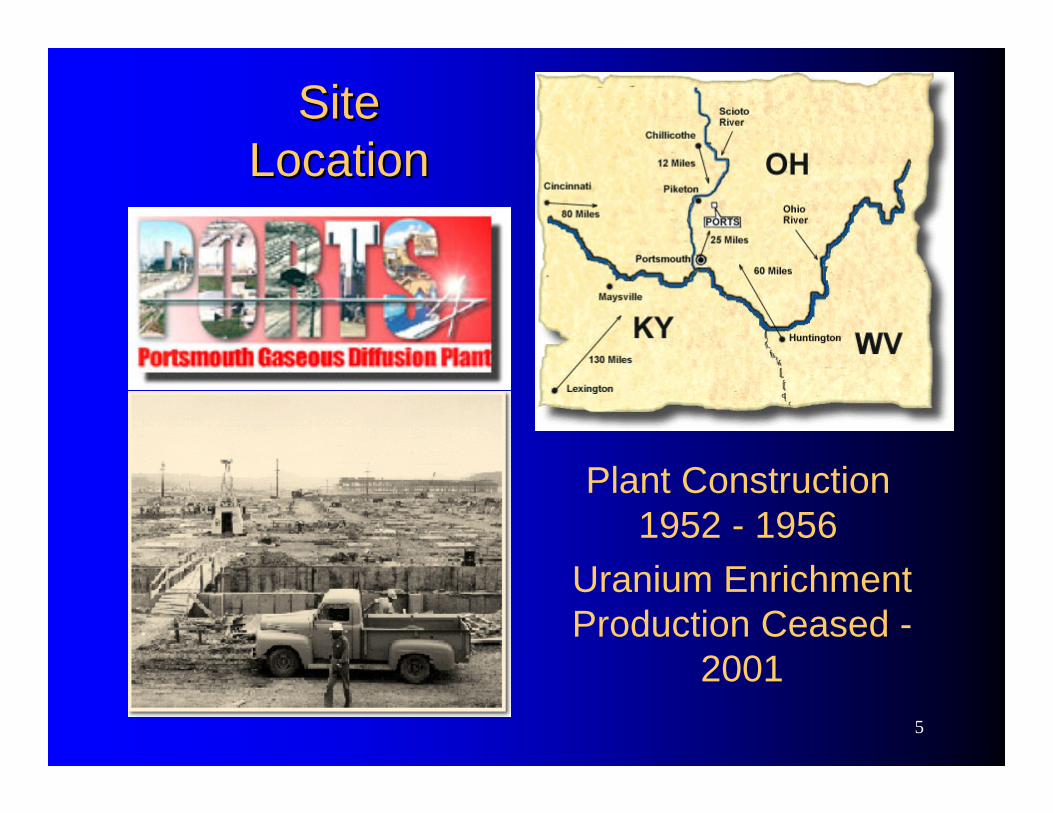
Site Site LocationLocation
Plant Construction 1952 - 1956
Uranium Enrichment Production Ceased -
2001
6
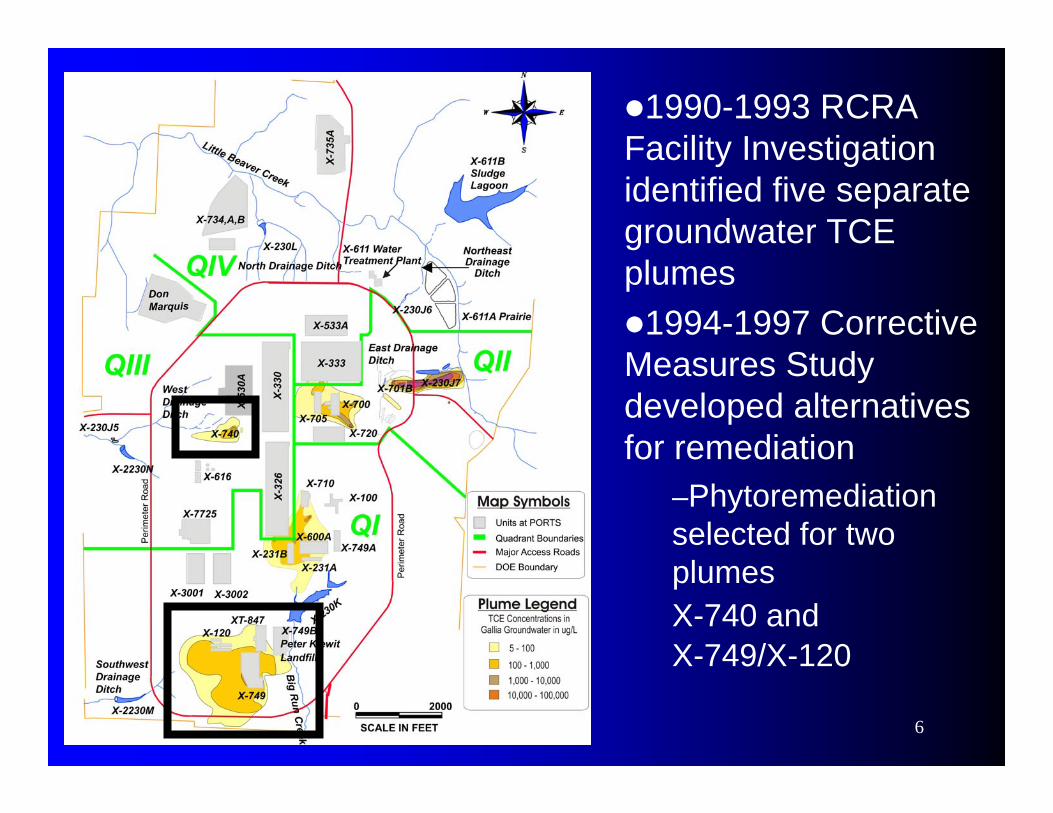
1990-1993 RCRA Facility Investigation identified five separate groundwater TCE plumes
1994-1997 Corrective Measures Study developed alternatives for remediation
–Phytoremediation selected for two plumes X-740 and X-749/X-120
7
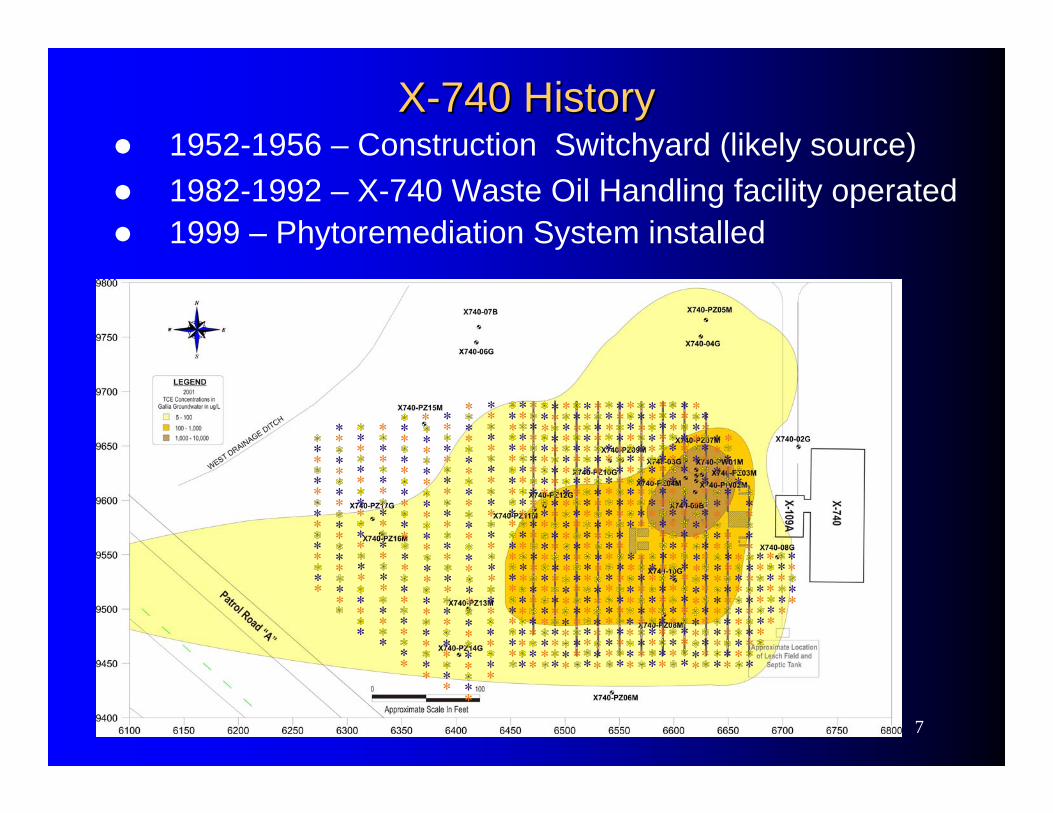
XX--740 History740 History1952-1956 – Construction Switchyard (likely source)1982-1992 – X-740 Waste Oil Handling facility operated1999 – Phytoremediation System installed
8
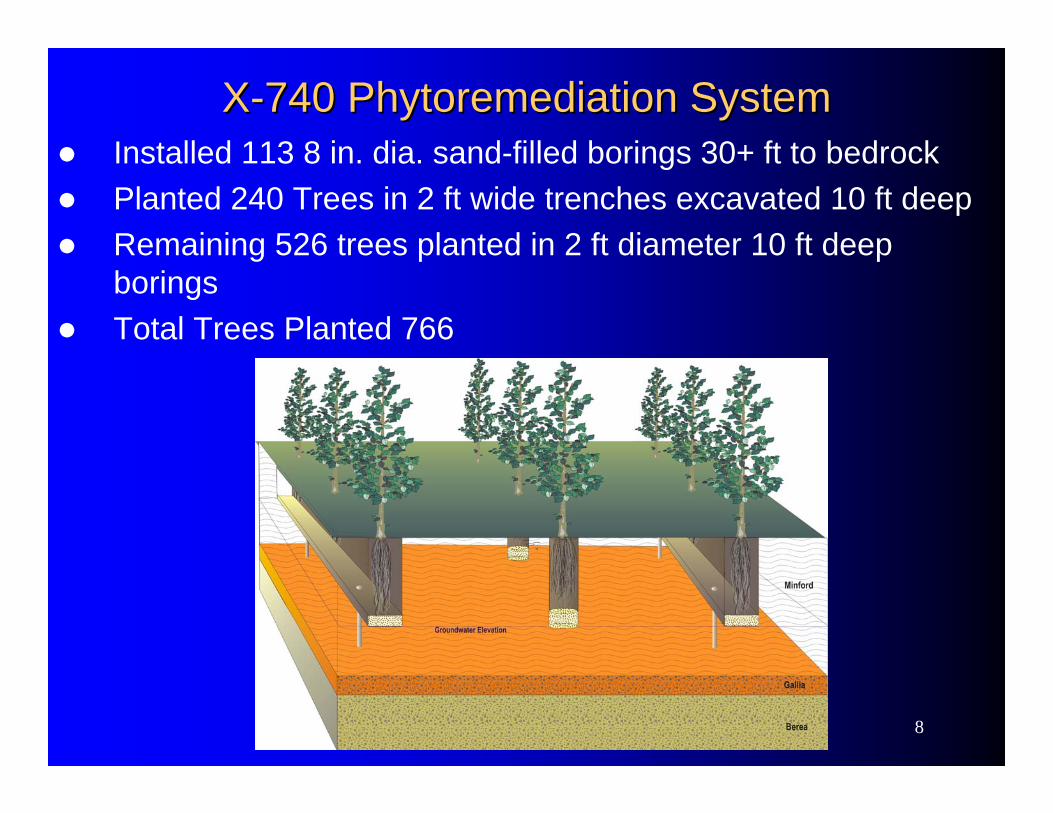
XX--740 Phytoremediation System740 Phytoremediation SystemInstalled 113 8 in. dia. sand-filled borings 30+ ft to bedrockPlanted 240 Trees in 2 ft wide trenches excavated 10 ft deepRemaining 526 trees planted in 2 ft diameter 10 ft deep boringsTotal Trees Planted 766
9
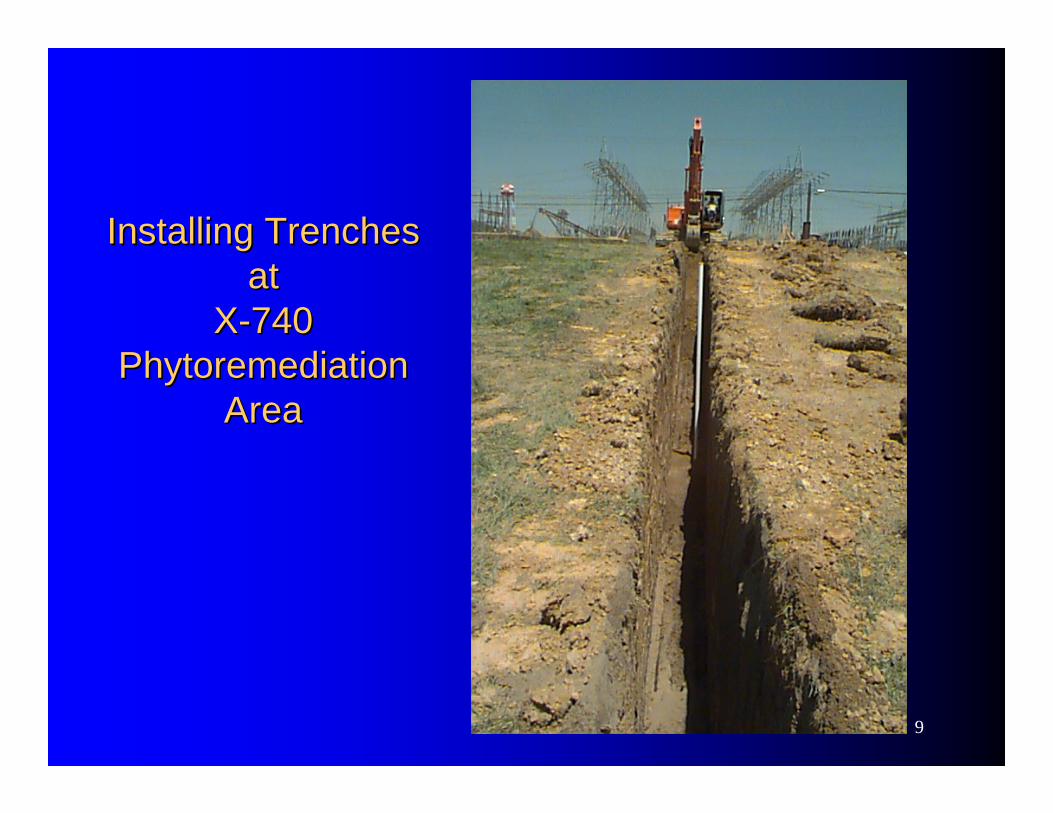
Installing Trenches Installing Trenches at at
XX--740 740 Phytoremediation Phytoremediation
AreaArea
10
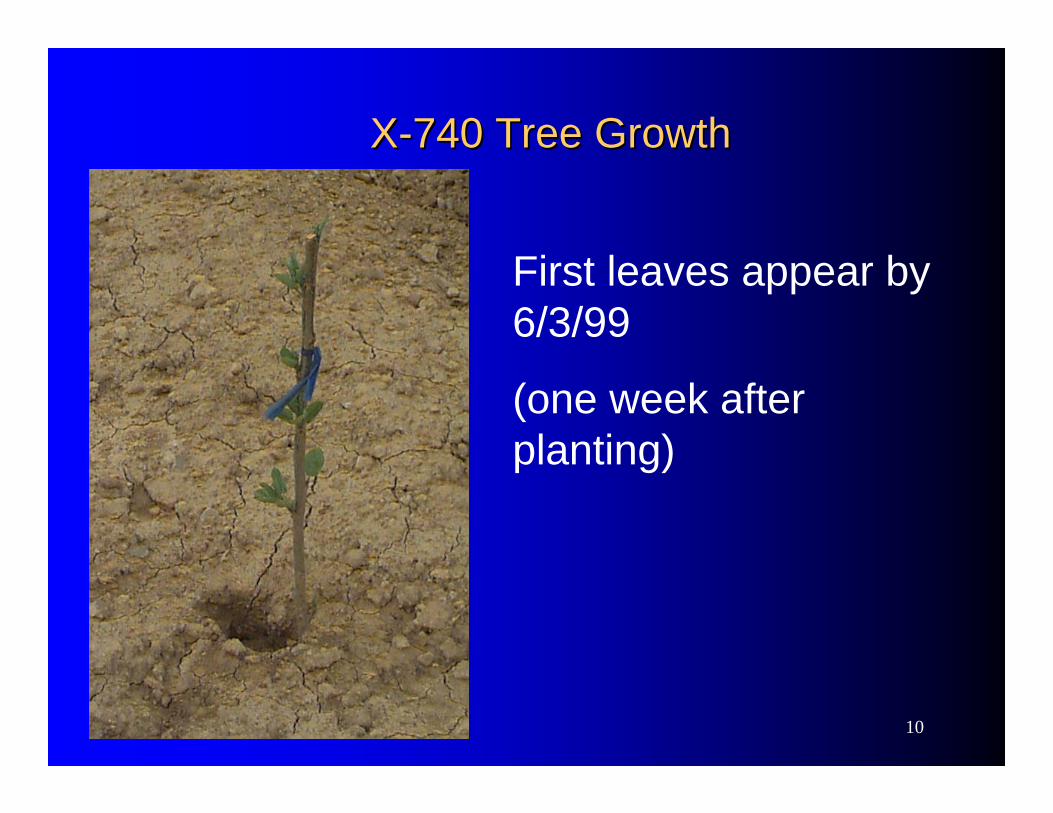
XX--740 Tree Growth740 Tree Growth
First leaves appear by 6/3/99
(one week after planting)
11
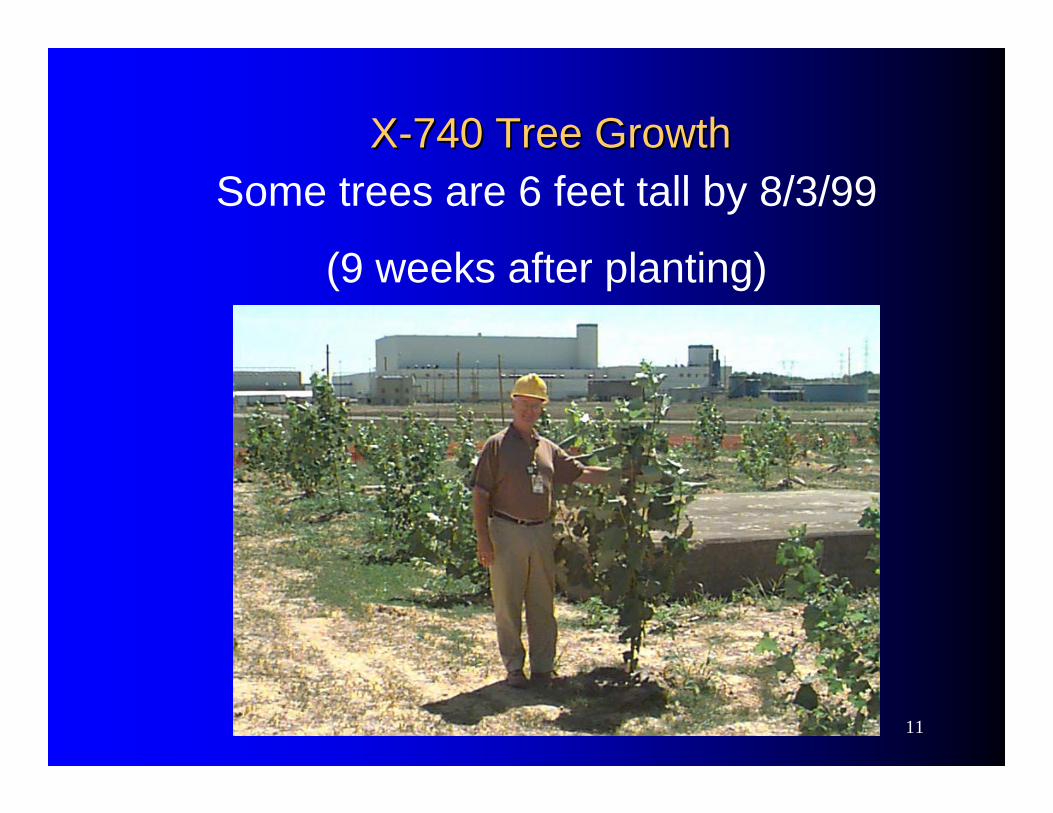
XX--740 Tree Growth740 Tree GrowthSome trees are 6 feet tall by 8/3/99
(9 weeks after planting)
12
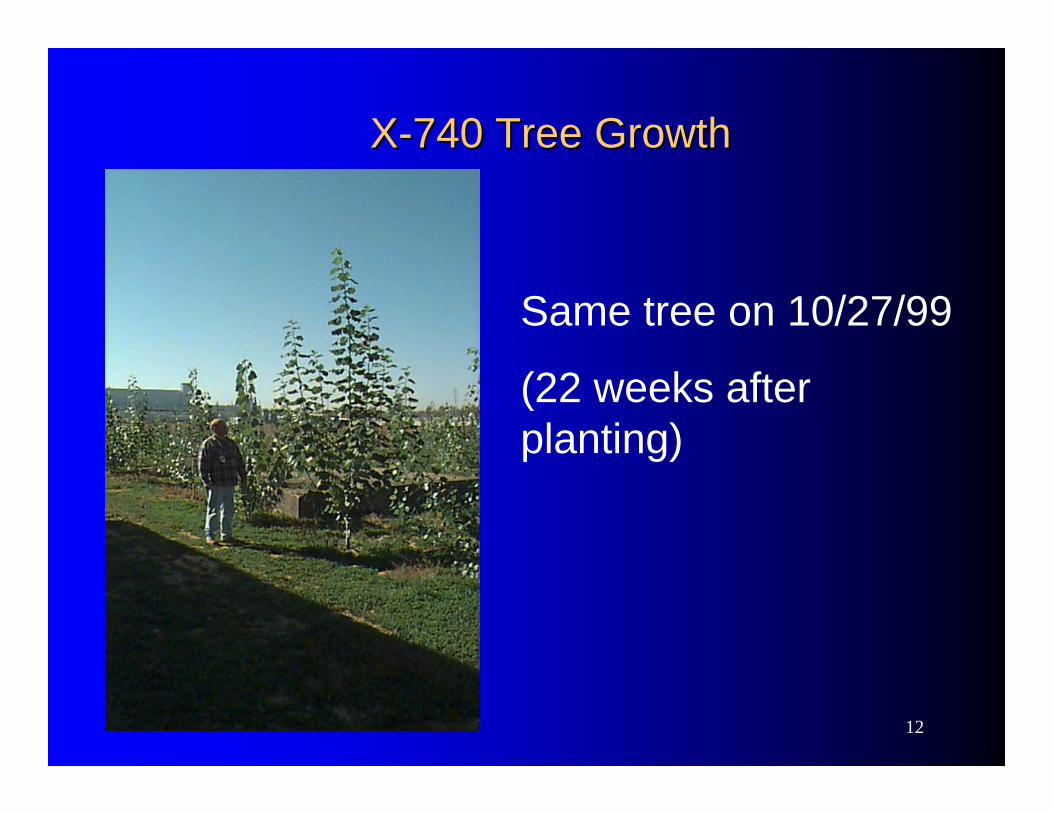
XX--740 Tree Growth740 Tree Growth
Same tree on 10/27/99
(22 weeks after planting)
13
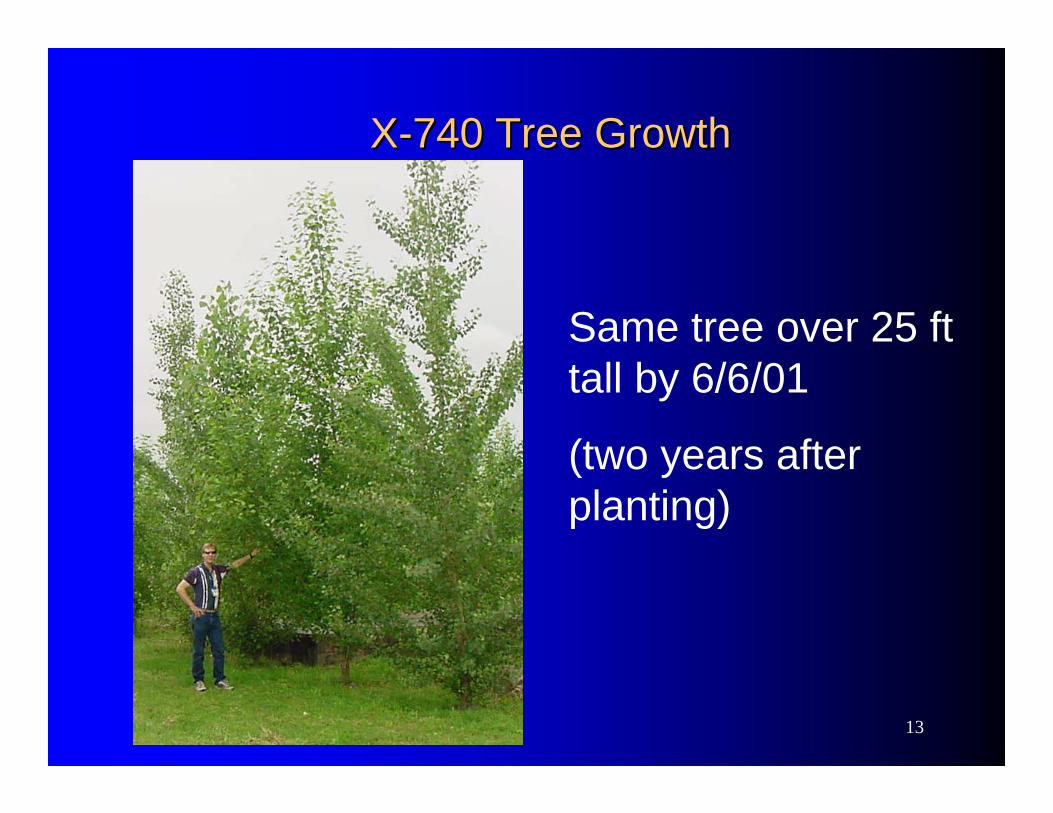
XX--740 Tree Growth740 Tree Growth
Same tree over 25 ft tall by 6/6/01
(two years after planting)
14
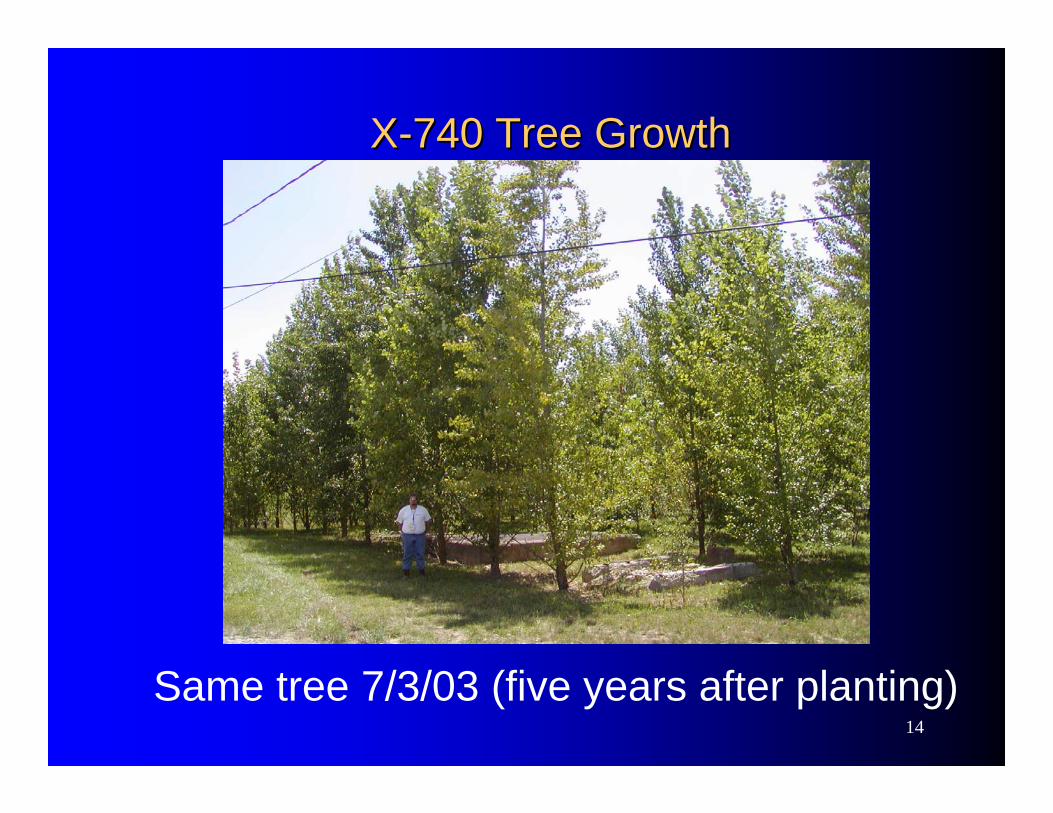
XX--740 Tree Growth740 Tree Growth
Same tree 7/3/03 (five years after planting)
15
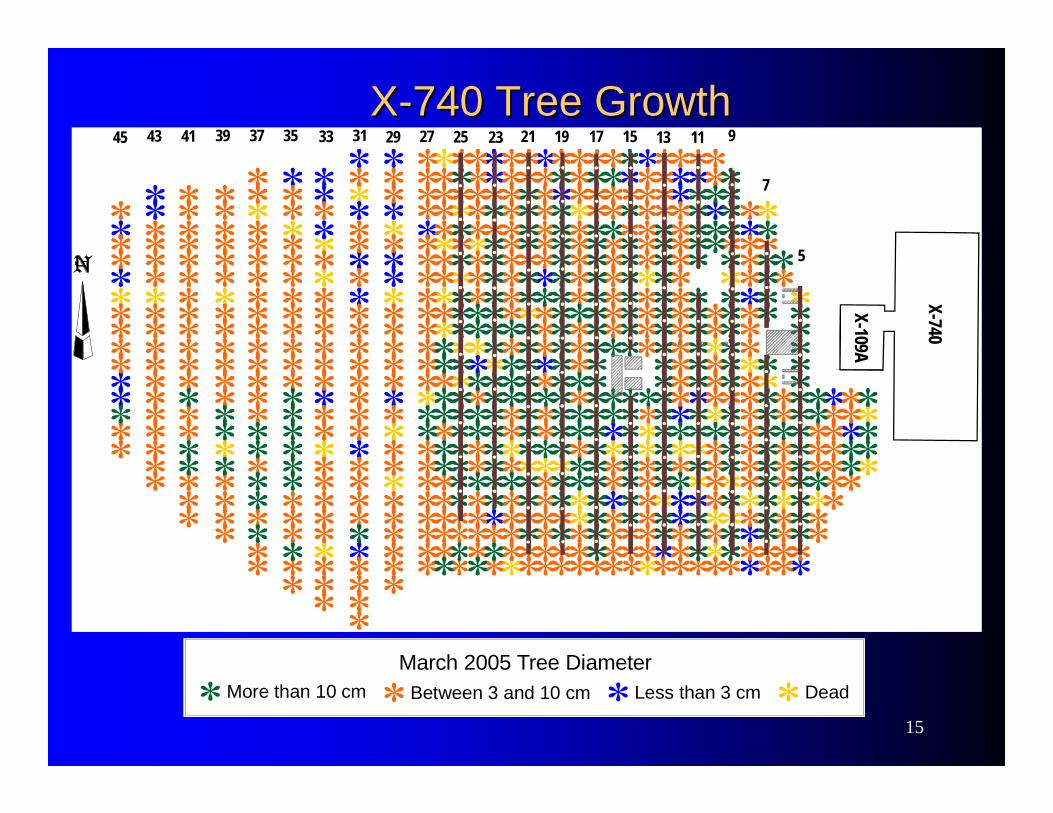
XX--740 Tree Growth740 Tree GrowthX-740
X-109 A
5
7
9111315171921232529333739414345 35 31 27
More than 10 cm Less than 3 cm Dead Between 3 and 10 cmMarch 2005 Tree Diameter
16
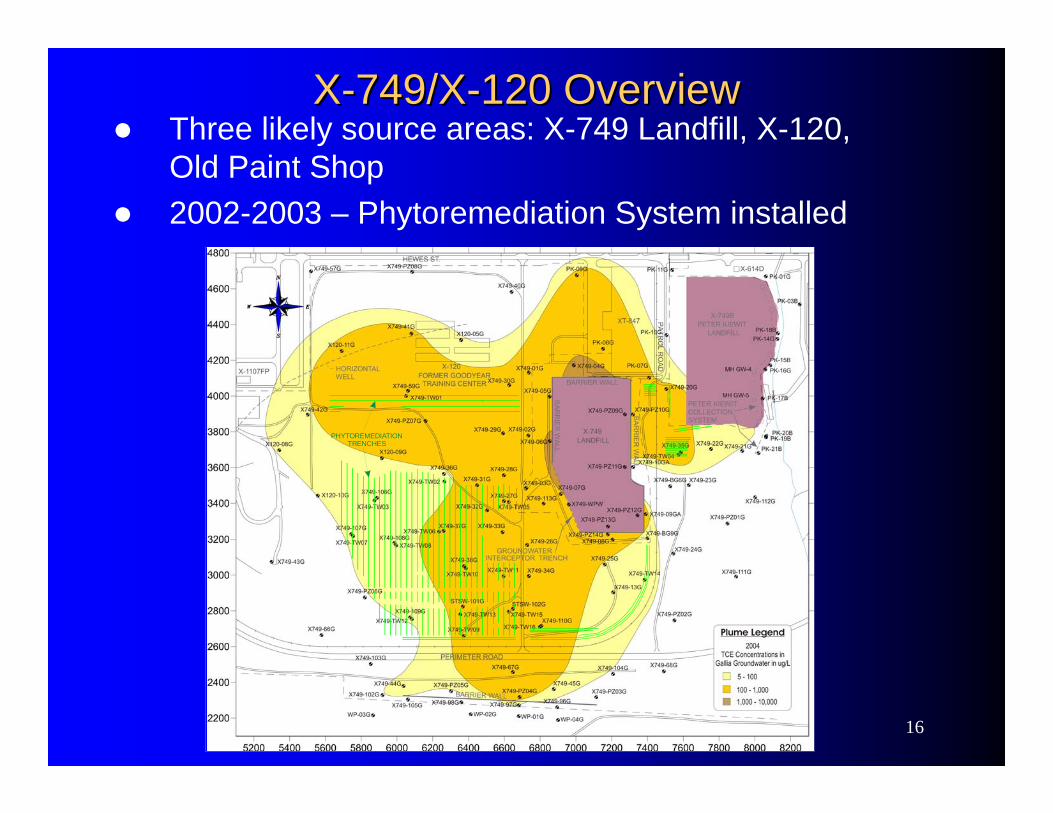
PHYTOREMEDIATIONTRENCHES
XX--749/X749/X--120 Overview120 OverviewThree likely source areas: X-749 Landfill, X-120, Old Paint Shop2002-2003 – Phytoremediation System installed
17
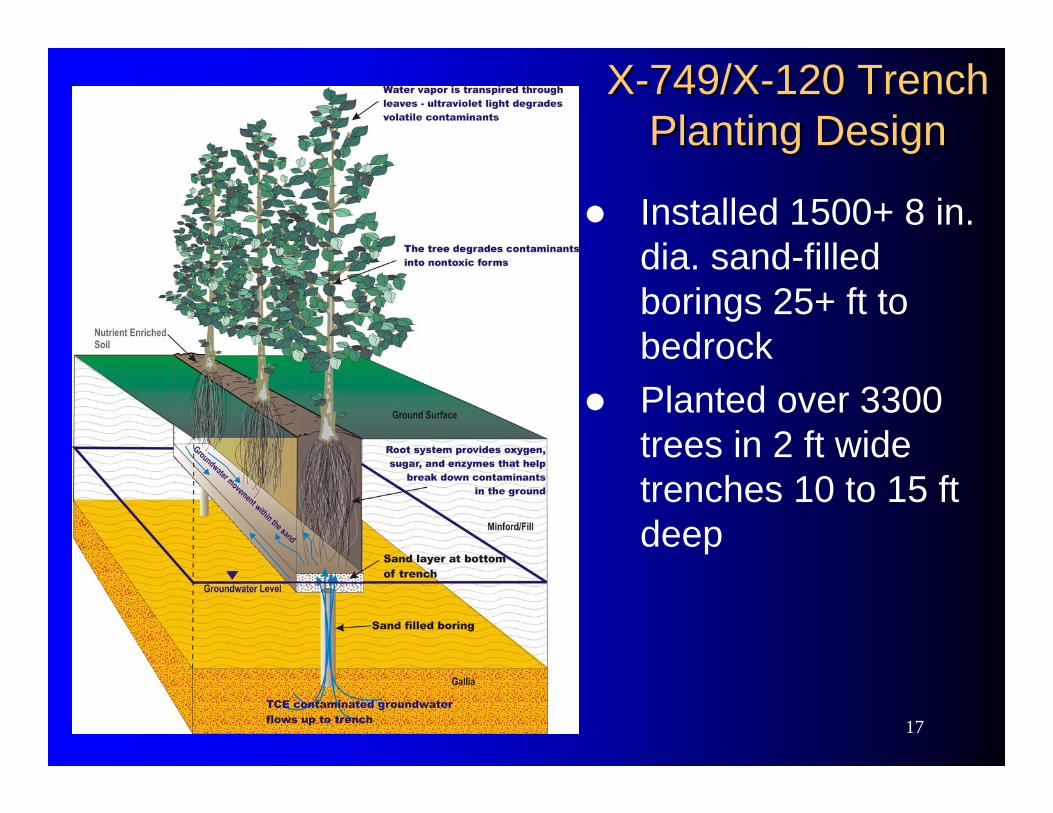
XX--749/X749/X--120 Trench 120 Trench Planting DesignPlanting Design
Installed 1500+ 8 in. dia. sand-filled borings 25+ ft to bedrockPlanted over 3300 trees in 2 ft wide trenches 10 to 15 ft deep
18
19
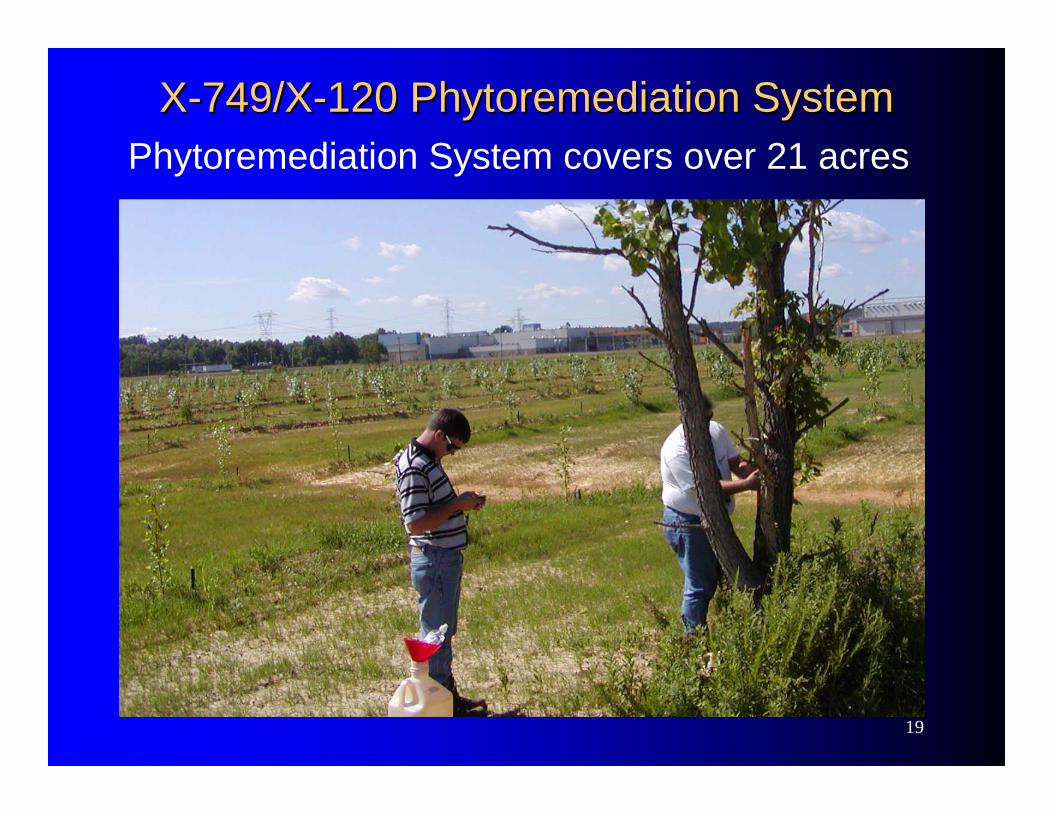
XX--749/X749/X--120 Phytoremediation System120 Phytoremediation SystemPhytoremediation System covers over 21 acres
20
Monitoring Methods Monitoring Methods
21
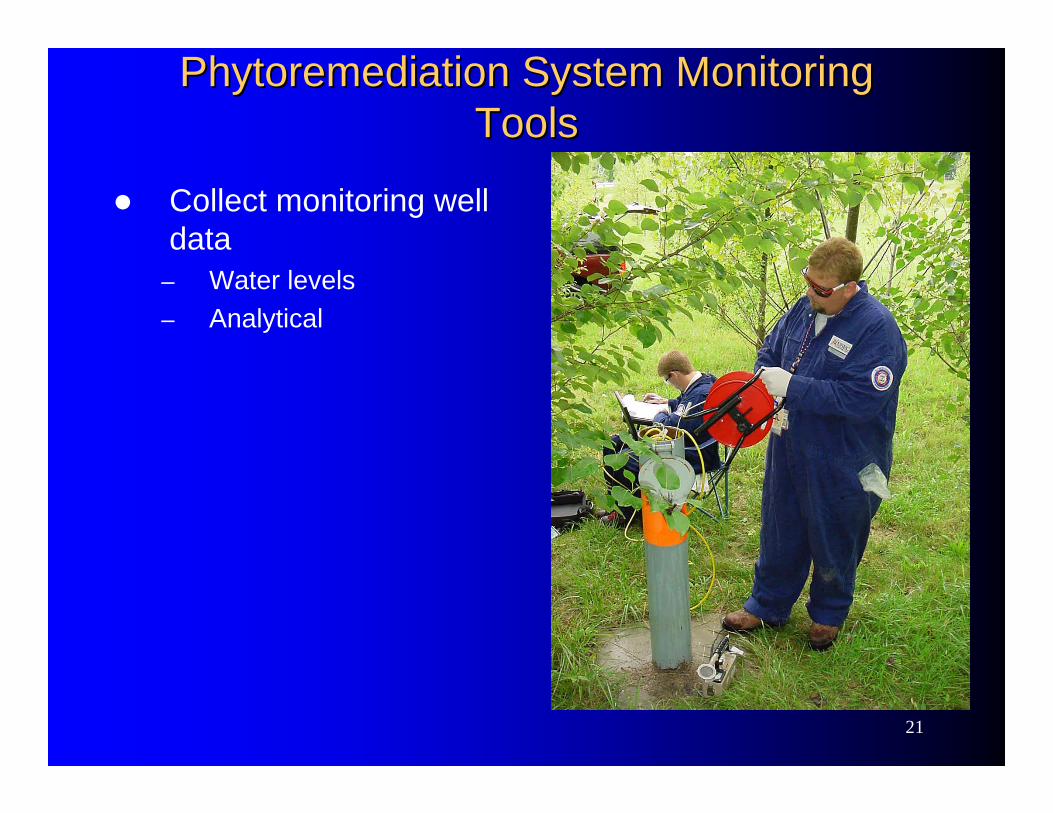
Phytoremediation System Monitoring Phytoremediation System Monitoring ToolsTools
Collect monitoring well data
– Water levels– Analytical
22
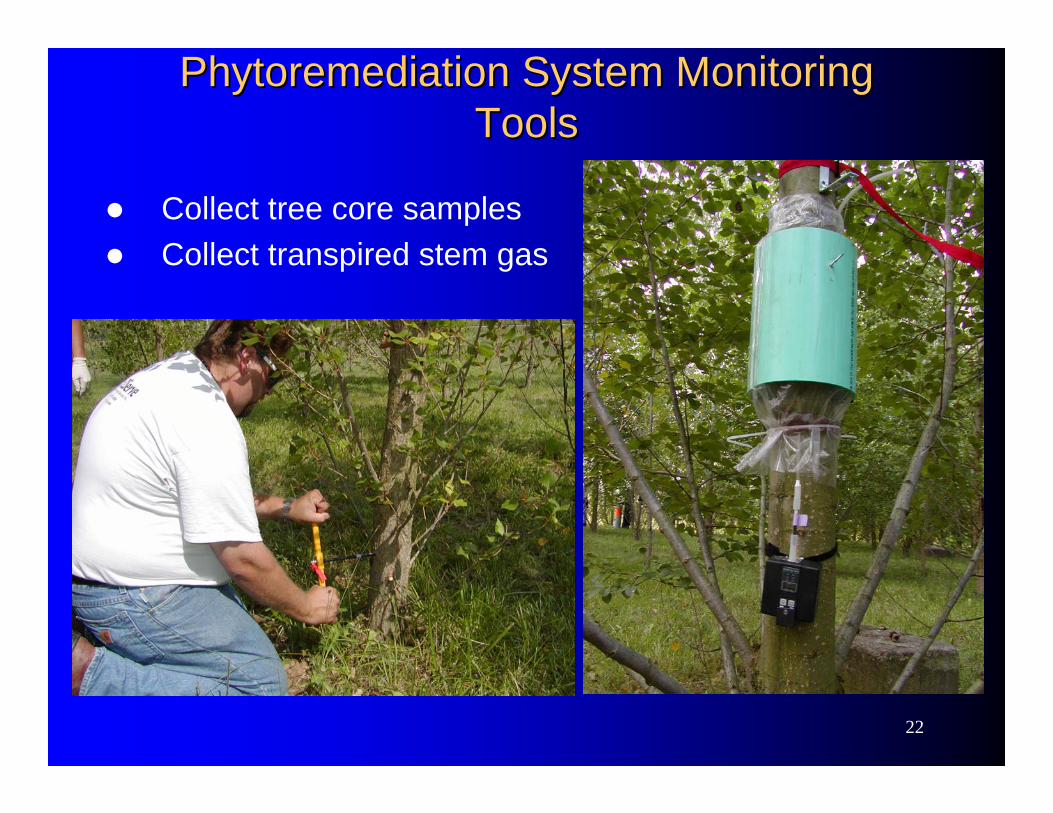
Phytoremediation System Monitoring Phytoremediation System Monitoring ToolsTools
Collect tree core samplesCollect transpired stem gas
23
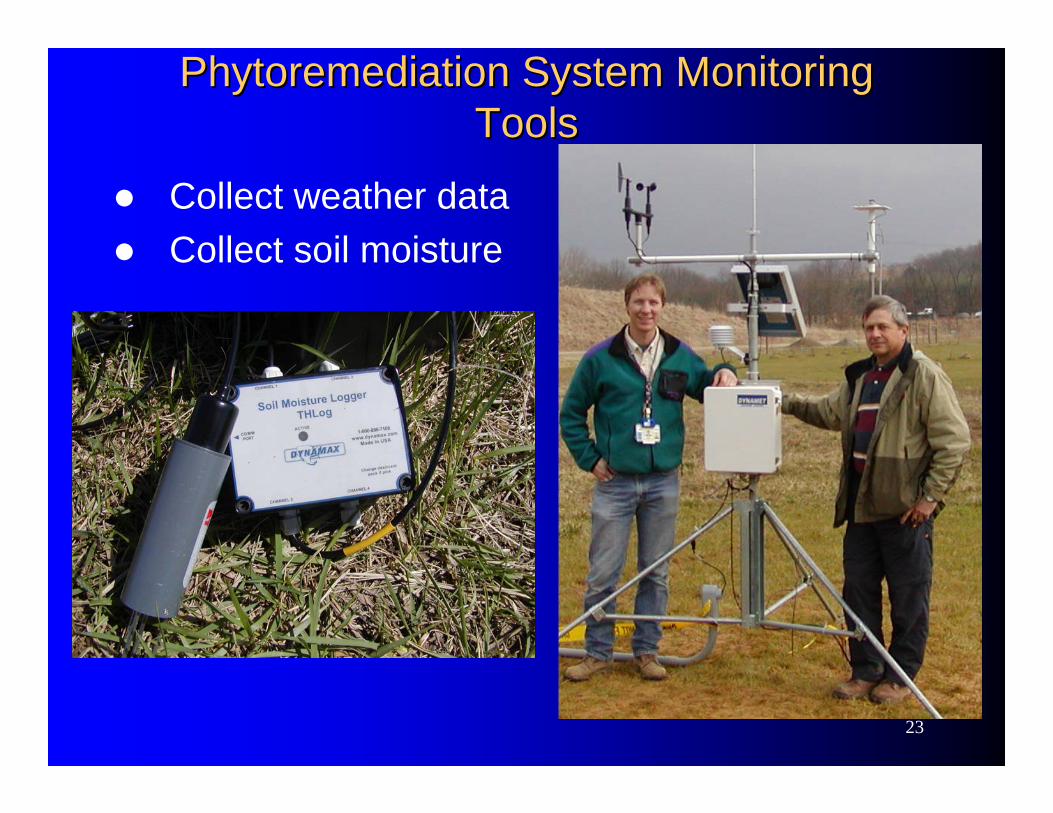
Phytoremediation System Monitoring Phytoremediation System Monitoring ToolsTools
Collect weather dataCollect soil moisture
24
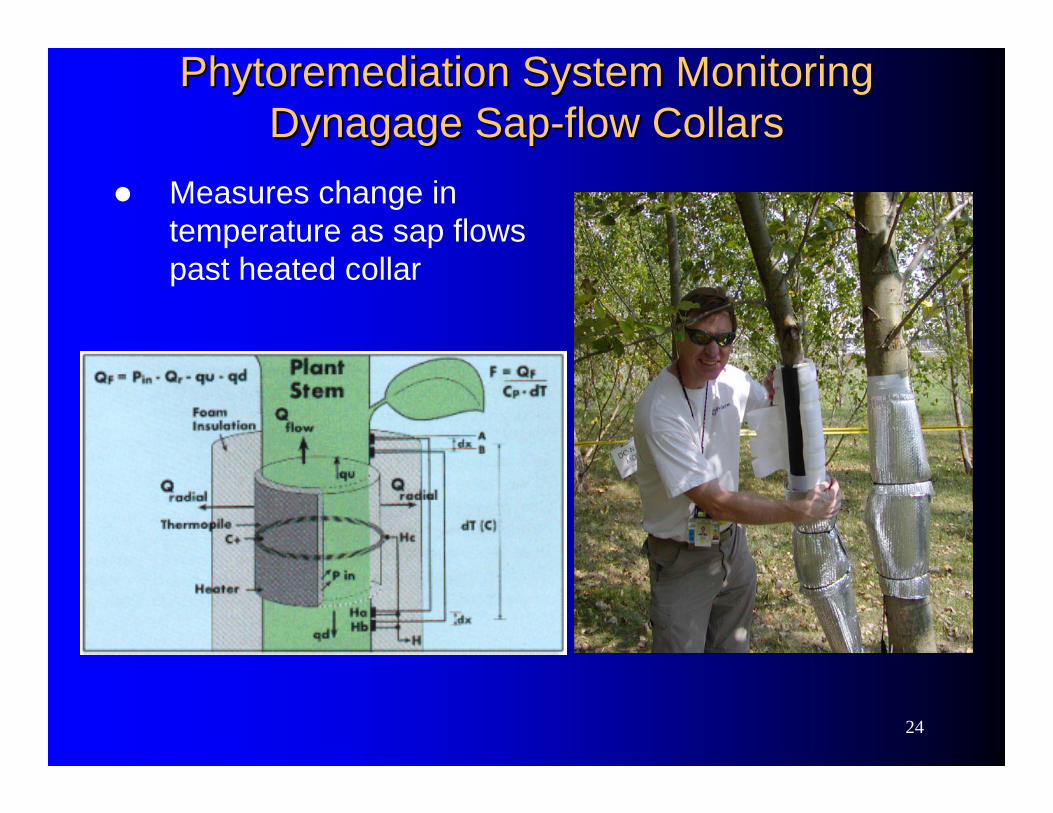
Phytoremediation System Monitoring Phytoremediation System Monitoring Dynagage Dynagage SapSap--flow Collarsflow Collars
Measures change in temperature as sap flows past heated collar
25
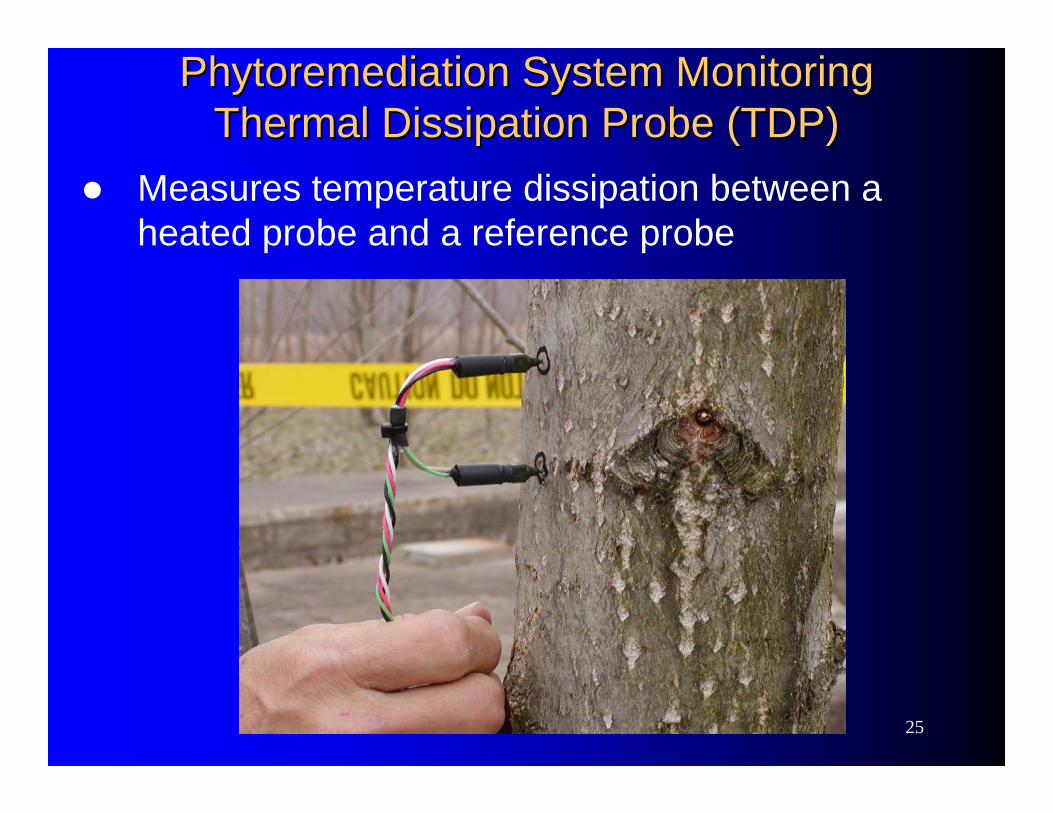
Phytoremediation System Monitoring Phytoremediation System Monitoring Thermal Dissipation Probe (TDP)Thermal Dissipation Probe (TDP)
Measures temperature dissipation between a heated probe and a reference probe
26
Objectives of the Sap Flow Objectives of the Sap Flow MonitoringMonitoring
1. Develop hydrologic budget• Determine sap flow relative to tree diameter• Determine sap flow relative to weather (ET)• Determine groundwater usage for plantation
2. Refine MODFLOW model input to more accurately predict remedial progress
3. Determine monitoring plan for next season at X-740 and adjust for X-749/X-120 area
27
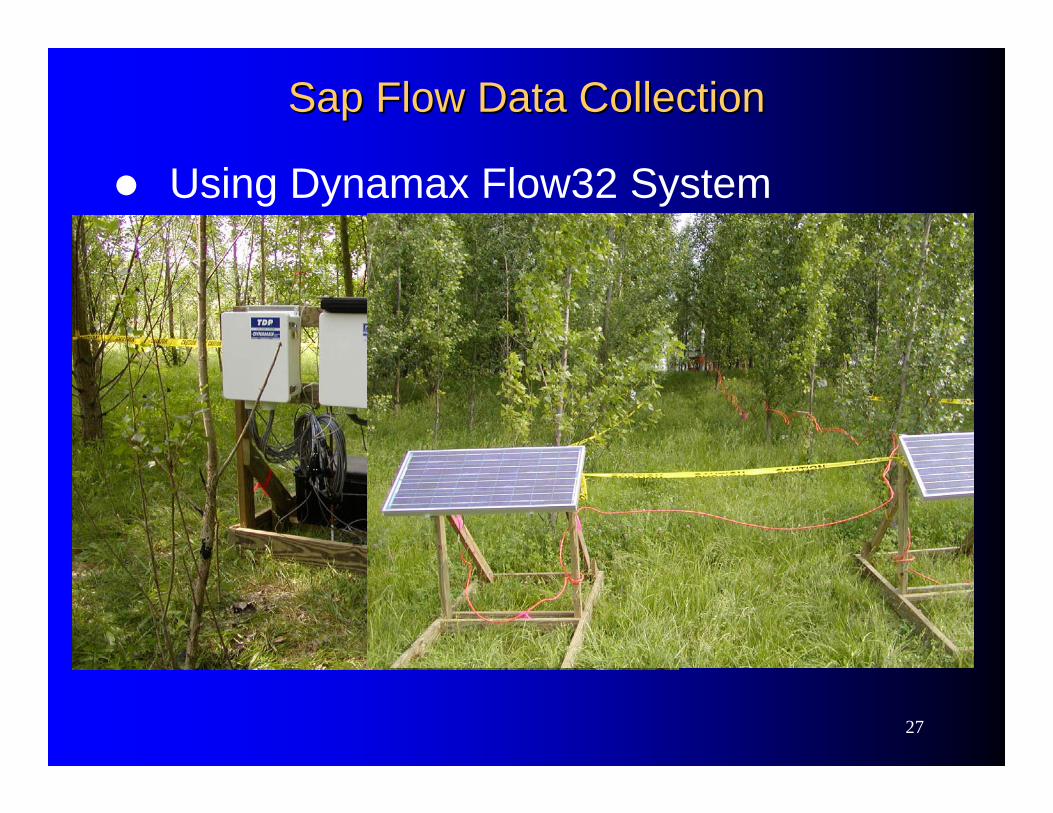
Sap Flow Data CollectionSap Flow Data Collection
Using Dynamax Flow32 System

28
Sap Monitoring Results Sap Monitoring Results
29
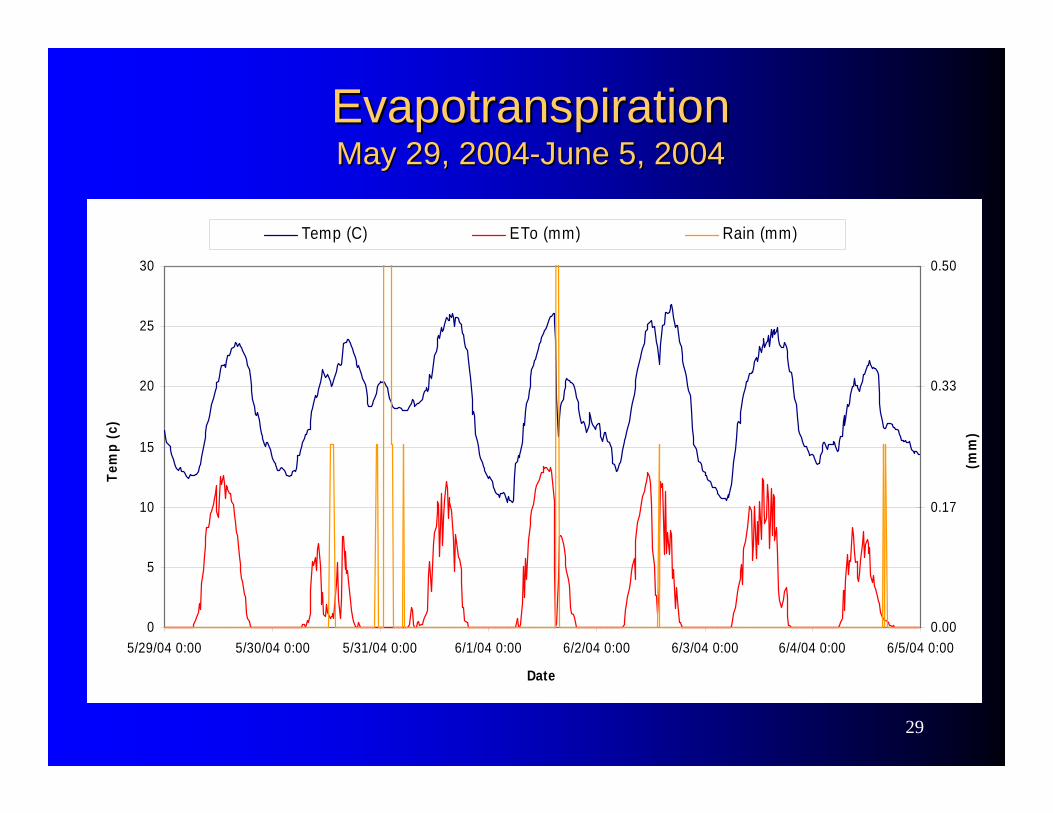
EvapotranspirationEvapotranspirationMay 29, 2004May 29, 2004--June 5, 2004June 5, 2004
0
5
10
15
20
25
30
5/29/04 0:00 5/30/04 0:00 5/31/04 0:00 6/1/04 0:00 6/2/04 0:00 6/3/04 0:00 6/4/04 0:00 6/5/04 0:00
Date
Tem
p (c
)
0.00
0.17
0.33
0.50
(mm
)
Temp (C) ETo (mm) Rain (mm)
30
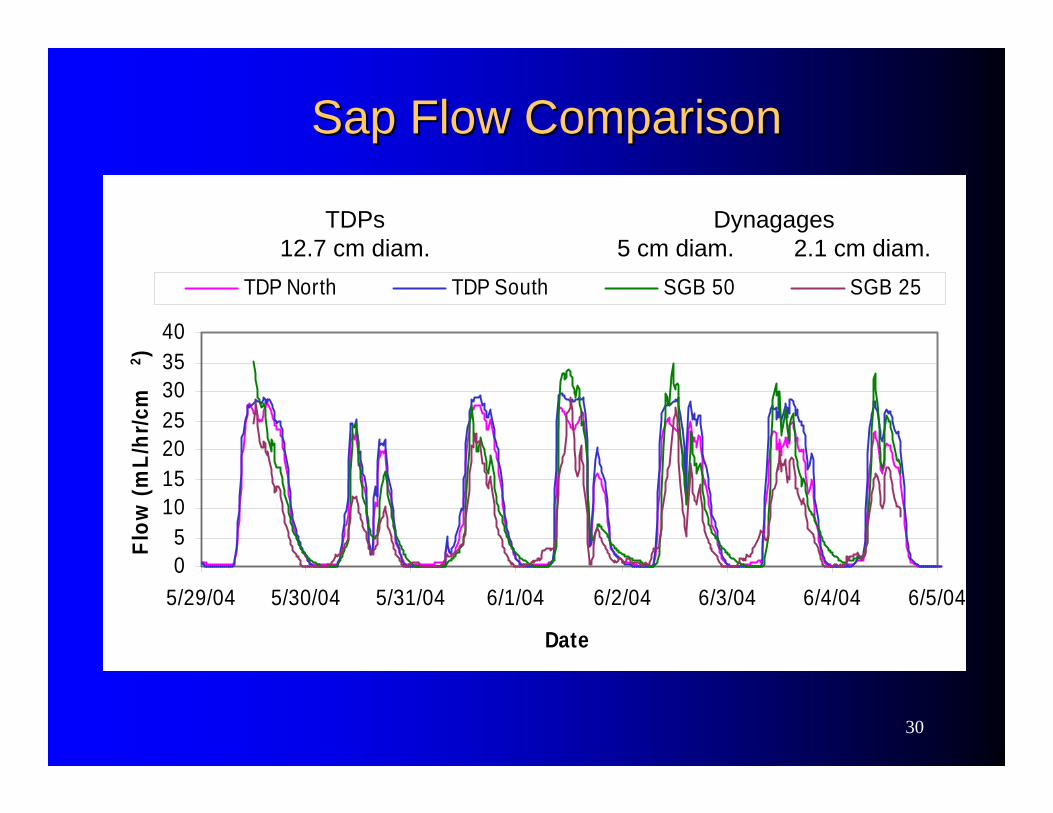
Sap Flow ComparisonSap Flow Comparison
05
10152025303540
5/29/04 5/30/04 5/31/04 6/1/04 6/2/04 6/3/04 6/4/04 6/5/04
Date
Flow
(mL/
hr/c
m2 )
TDP North TDP South SGB 50 SGB 25
TDPs 12.7 cm diam.
Dynagages 5 cm diam. 2.1 cm diam.
31
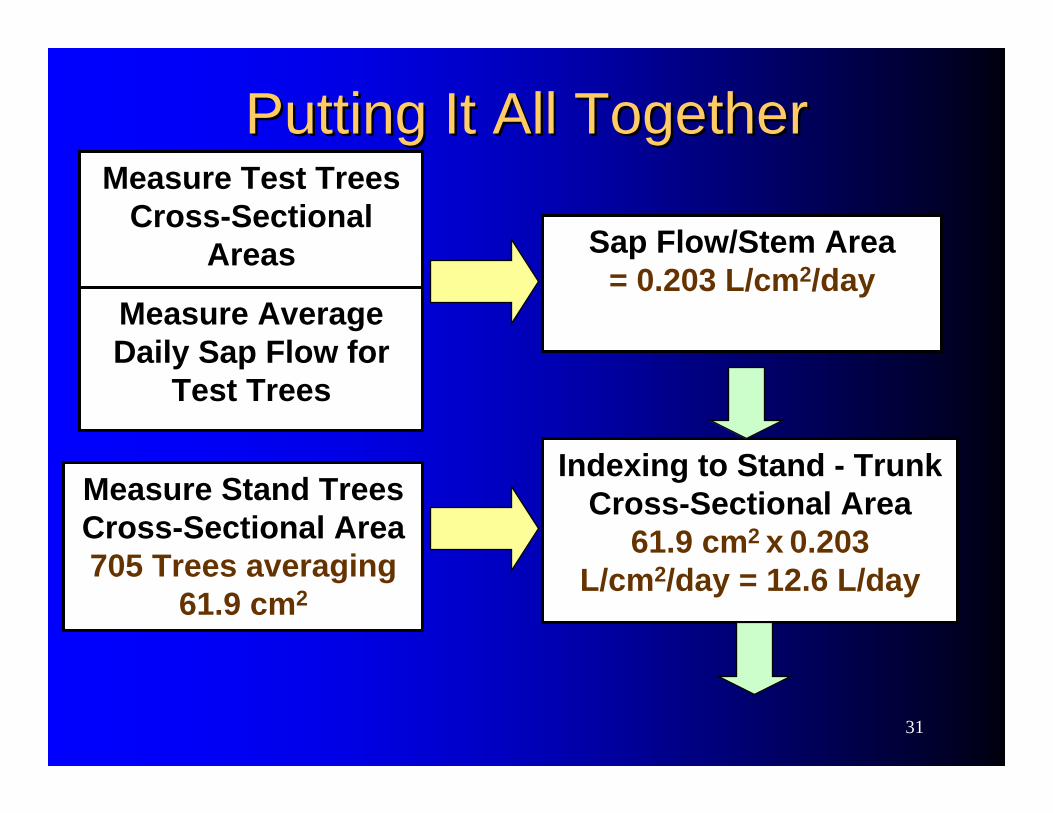
Putting It All TogetherPutting It All Together
Measure Average Daily Sap Flow for
Test Trees
Indexing to Stand - TrunkCross-Sectional Area
61.9 cm2 x 0.203 L/cm2/day = 12.6 L/day
Sap Flow/Stem Area= 0.203 L/cm2/day
Measure Test TreesCross-Sectional
Areas
Measure Stand TreesCross-Sectional Area705 Trees averaging
61.9 cm2
32
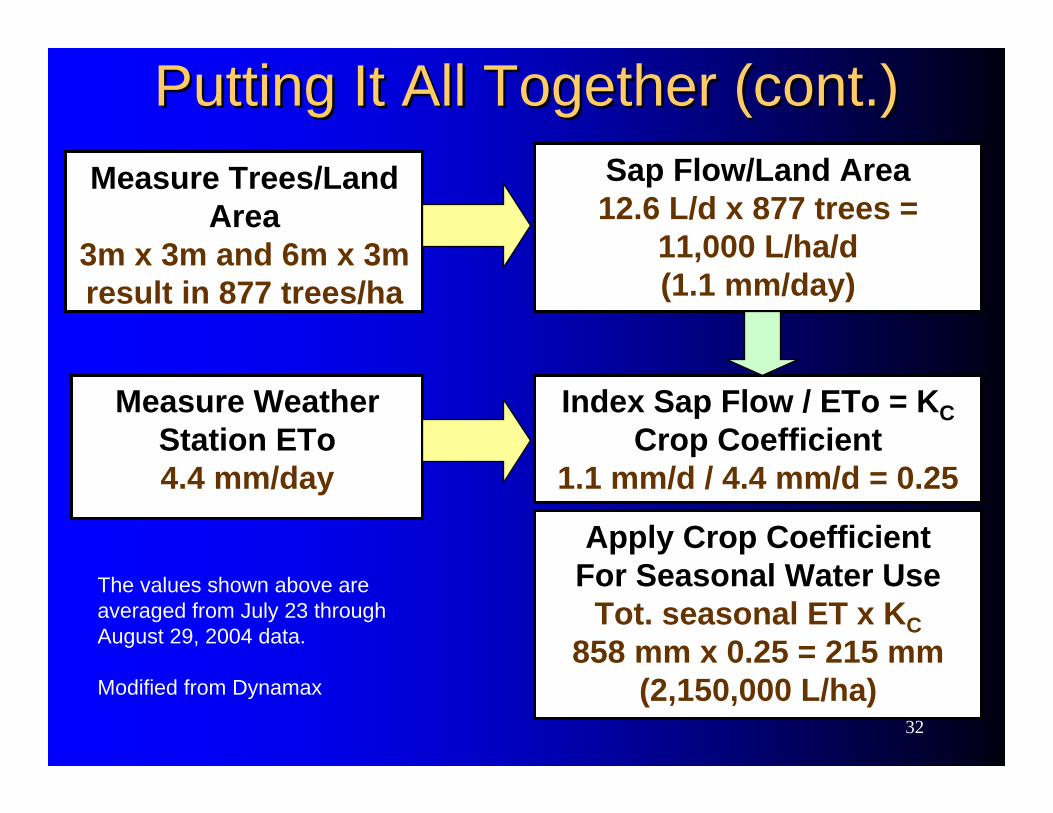
Putting It All Together (cont.)Putting It All Together (cont.)Sap Flow/Land Area12.6 L/d x 877 trees =
11,000 L/ha/d(1.1 mm/day)
Measure Weather Station ETo4.4 mm/day
Apply Crop CoefficientFor Seasonal Water Use
Tot. seasonal ET x KC858 mm x 0.25 = 215 mm
(2,150,000 L/ha)
Measure Trees/Land Area
3m x 3m and 6m x 3m result in 877 trees/ha
Index Sap Flow / ETo = KCCrop Coefficient
1.1 mm/d / 4.4 mm/d = 0.25
The values shown above are averaged from July 23 through August 29, 2004 data.
Modified from Dynamax

33
Conclusions Conclusions
34
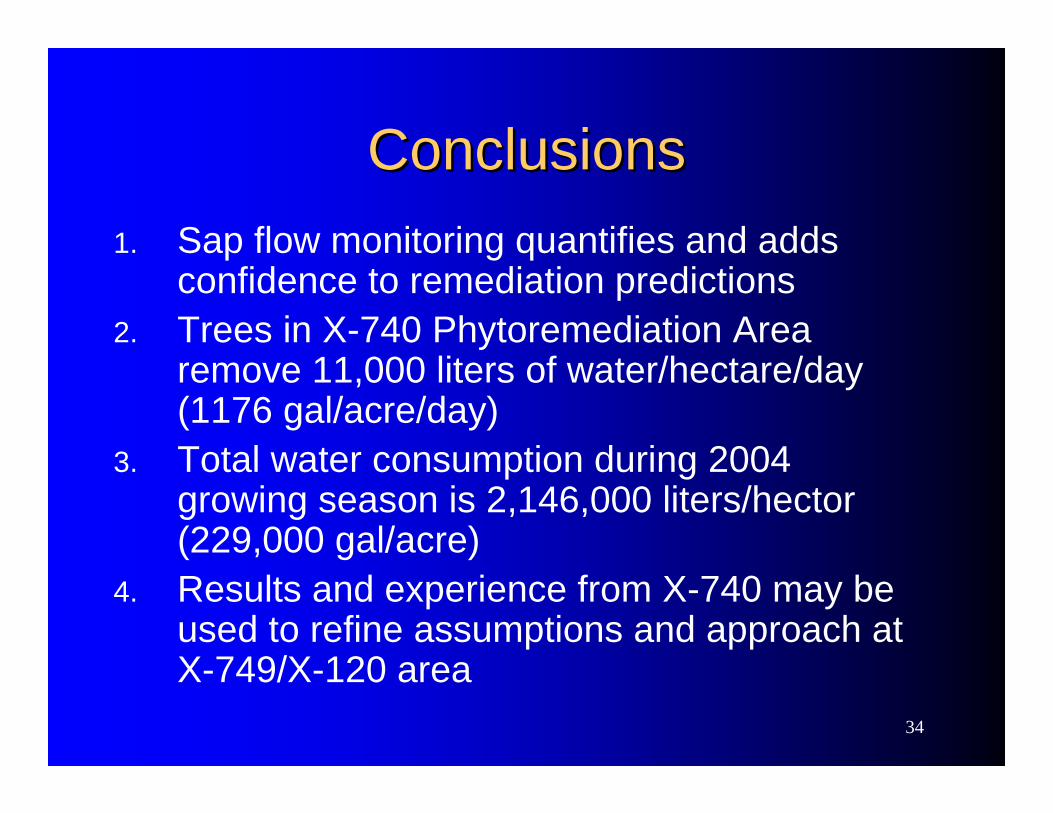
ConclusionsConclusions1. Sap flow monitoring quantifies and adds
confidence to remediation predictions2. Trees in X-740 Phytoremediation Area
remove 11,000 liters of water/hectare/day (1176 gal/acre/day)
3. Total water consumption during 2004 growing season is 2,146,000 liters/hector (229,000 gal/acre)
4. Results and experience from X-740 may be used to refine assumptions and approach at X-749/X-120 area
35
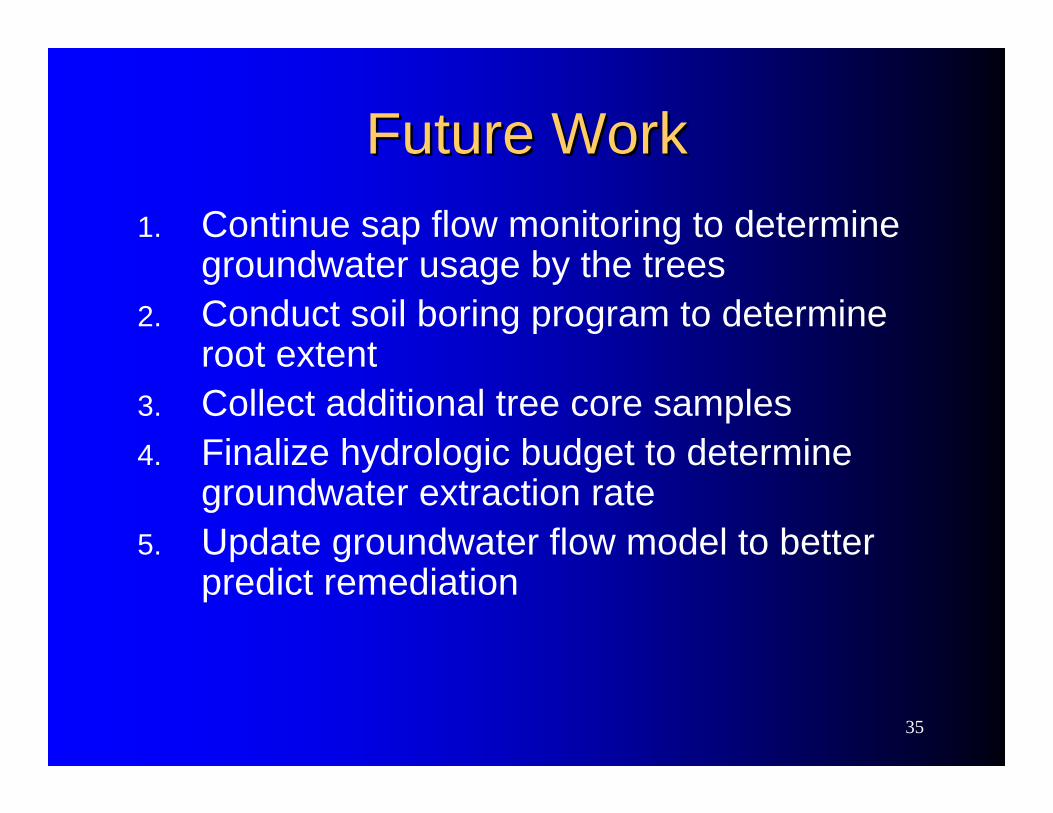
Future WorkFuture Work1. Continue sap flow monitoring to determine
groundwater usage by the trees2. Conduct soil boring program to determine
root extent3. Collect additional tree core samples4. Finalize hydrologic budget to determine
groundwater extraction rate5. Update groundwater flow model to better
predict remediation
36
AcknowledgementsAcknowledgementsOrganizations– DOE, Ohio EPA, Bechtel Jacobs Company LLC,
Pro2ServeAuthors– Russ Vranicar (DOE)– Maria Galanti (OEPA)– John Sokol & Sandy Childers (BJC)– Dave Rieske, Joe Ritchey, Steven Thompson (P2S)
Contributors– Michael van Bavel (Dynamax)– Joel Burken (University of Missouri-Rolla)