measuring alcohol abuse in the community: consumption, binge-drinking, and alcohol-related...
TRANSCRIPT
Measuring Alcohol Abuse in the Community: Consumption, Binge-Drinking, and Alcohol-Related Consequences ("Alcoholism")Author(s): Donna L. Reynolds, Larry W. Chambers and Michael R. DeVillaerSource: Canadian Journal of Public Health / Revue Canadienne de Sante'e Publique, Vol. 83, No.6 (NOVEMBER / DECEMBER 1992), pp. 441-447Published by: Canadian Public Health AssociationStable URL: http://www.jstor.org/stable/41991504 .
Accessed: 17/06/2014 21:36
Your use of the JSTOR archive indicates your acceptance of the Terms & Conditions of Use, available at .http://www.jstor.org/page/info/about/policies/terms.jsp
.JSTOR is a not-for-profit service that helps scholars, researchers, and students discover, use, and build upon a wide range ofcontent in a trusted digital archive. We use information technology and tools to increase productivity and facilitate new formsof scholarship. For more information about JSTOR, please contact [email protected].
.
Canadian Public Health Association is collaborating with JSTOR to digitize, preserve and extend access toCanadian Journal of Public Health / Revue Canadienne de Sante'e Publique.
http://www.jstor.org
This content downloaded from 185.2.32.113 on Tue, 17 Jun 2014 21:36:49 PMAll use subject to JSTOR Terms and Conditions
Measuring Alcohol Abuse in the
Community: Consumption,
Binge-Drinking, and Alcohol-Related
Consequences ("Alcoholism")
Donna L. Reynolds , MSc,' Larry W. Chambers, PhD,1,2 Michael R DeVillaer, MASc 3,4
ABSTRACT
This study reported and compared community health indicators for the measurement of alcohol abuse. Using data from the 1989 Hamilton- Wentworth Health Survey, similar rates were found for four differing definitions of alcohol abuse: 1) drinking everyday ($.7%, 95% confidence limit (CL)=3.8-7.7%), 2) drinking at least 14 drinks in the past seven days (12.1 %, 95% CL=9.2- 15.1%), 3) frequent bingeing on 1 0 drinks or more (9.4%, 95% CL=6.9-1 1.8%), and 4) "alcoholism" as defined by the Michigan Alcoholism Screening Test (MAST) (7.4%, 95% CL=5.1-9.7%). Bingeing on five drinks or more occurred fre- quently (37.0%, 95% CL=32.8-4l. 1%). AU indi- cators of alcohol abuse from the survey were signifi- cantly higher for males as compared to females (p<0.05), and demonstrated varying distributions by age. Estimates of drinking consumption based on the sale of alcoholic beverages in the community were also examined and found to estimate con- sumption levels nearly double that of the self- reported survey data. Relevance to public health planning and monitoring is discussed.
ABREGE
Cette étude établit un rapport comparatif sur les indices de santé communautaire permettant d évaluer la consommation excessive d'alcool. À partir des données de l'enquête sur la santé de Hamilton-Wentworth en 1 989, il a été possible de dégager des taux semblables pour quatre définitions différentes de la consommation excessive d'alcool : (1) consommation quotidienne (5,7 %, 95 % de marge de confiance (MC) = 3,8-7,7 %), (2) ab- sorption d'au moins 14 consommations au cours desseptjoursprécédents(12,l %,95 %MC=9,2- 15,1 %), ivrognerie fréquente avec 10 consommations ou plus (9,4 %, 95 % MC = 6,9- 1 1,8 %), et (4) "alcoolisme" tel que défini par le Michigan Alcoholism Screening Test (MAST) [test de dépistage d'alcoolisme] (7,4 %, 95 % MC = 5, 1-9,7 %). Onaconstatéuneivrogneriefréquente de cinq consommations ou plus (37,0 %, 95 % MC = 32,8-4 1 , 1 %). L'enquête révèle que tous les indicateurs de consommation excessive d'alcool étaient beaucoup plus élevés pour les hommes que pour les femmes (p<0,05) et font apparaître également une répartition qui varie par tranche d'âge. Des estimations de la consommation d'alcool basées sur les ventes de boissons alcooliques dans la communauté ont également été étudiées et ont révêlé qu'elles étaient presque le double des chiffres recueillis par l'enquête. La pertinence de tous ces chiffres pour la planification et le contrôle en matière de santé publique fait l'objet de la discus- sion.
Measuring and monitoring the burden of alcohol abuse in the community allows ap- propriate management and adequate resource allocation. Knowledge about the prevalence of alcohol abuse can, therefore, lead to opti- mal targeting of programs for prevention through to treatment. Target populations can be identified using community informa- tion to demonstrate need and/or characteris- tics of those at high risk for alcohol abuse.
A number of sources have been used to provide such information. Commonly used indicators at the community level have in- cluded: alcohol consumption based on sales of alcoholic beverages, and aggregate data from hospital separations, legal offences, traf- fic crashes, and death certificates.1"4 These data, however, have limitations: the magni- tude of aggregate data can artificially vary in time and in location (e.g. hospital separations can be influenced by admission policies and staff practices; alcohol-related arrests can re- flect the priority assigned by local law en- forcement); these data tabulate "events" and not individual occurrences; and, the aggre- gate data, in particular mortality data, repre- sent the extreme end of the alcohol-abuse continuum. In addition, mortality data are well documented as to their inaccuracy.5,6
1. Health Priorities Analysis Unit, Department of Clinical Epidemiology and Biostatistics, Faculty of Health Sciences, McMaster University, Hamilton, ON
2 . Hamilton-Wentworth Department ofPublic Health Services - A Teaching Health Unit Affiliated with McMaster University, Hamilton, ON
3. Hamilton Area Office of the Addiction Research Foundation, Hamilton, ON
4. The views in this publication are those of the authors and do not necessarily reflect those of the Addiction Research Foundation.
Correspondence and reprint requests to: D.L. Reynolds, Health Priorities Analysis Unit, 25 Main Street West, Second Floor, Hamilton, Ontario Canada L8N 3P6, Tel: (416) 546-3620.
Surveys of the population provide an alter- nate source of alcohol use data for the com- munity.7"13 Response rates and the accuracy of self-reported data (particularly consump- tion) often limit the validity of these data.14 One way to circumvent this problem is through the use of multiple indicators. The advantage of survey information is the ability to directly measure the individual occurrence of alcohol abuse. This information can thereby be used to determine the number and charac- teristics of individuals at risk for alcohol abuse, and be incorporated into the design and conduct of interventions. In contrast, the utility of aggregate data is limited to planning resource allocation for secondary and tertiary care for those abusing alcohol since demand is determined by events and not necessarily by individuals.
The purpose of this study was to examine estimates of alcohol abuse at the community level obtained from a community health sur- vey. The prevalence of alcohol abuse among residents was reported and compared to a similar measure of abuse estimated by the sales of alcoholic beverages in the same com- munity.
METHODS
In May, 1989, the Hamilton-Wentworth Health Survey (HWHS) was conducted as a pre-test to the 1990 Ontario Health Survey (funded by the Ontario Ministry of Health and conducted by Statistics Canada). Infor- mation on the physical, psychological and social determinants of health was collected from a stratified random sample of the popu- lation of Hamilton-Wentworth using an interviewer-administered questionnaire (LAQ) and a self-administered questionnaire (SAQ). The LAQ was administered by a trained interviewer who questioned a single
NOVEMBER - DECEMBER 1992 CANADIAN JOURNAL OF PUBLIC HEALTH 441
This content downloaded from 185.2.32.113 on Tue, 17 Jun 2014 21:36:49 PMAll use subject to JSTOR Terms and Conditions
MEASURING ALCOHOL ABUSE IN THE COMMUNITY
knowledgeable member of a household re- garding all members of that household. One SAQwas left for each member of the house- hold (age 12 years and over) to complete and mail back to the study centre. Up to three follow-up telephone calls were made to en- courage non-respondents to return the SAQ. Detailed information on the survey meth- ods, including copies of the questionnaire, are described elsewhere.15
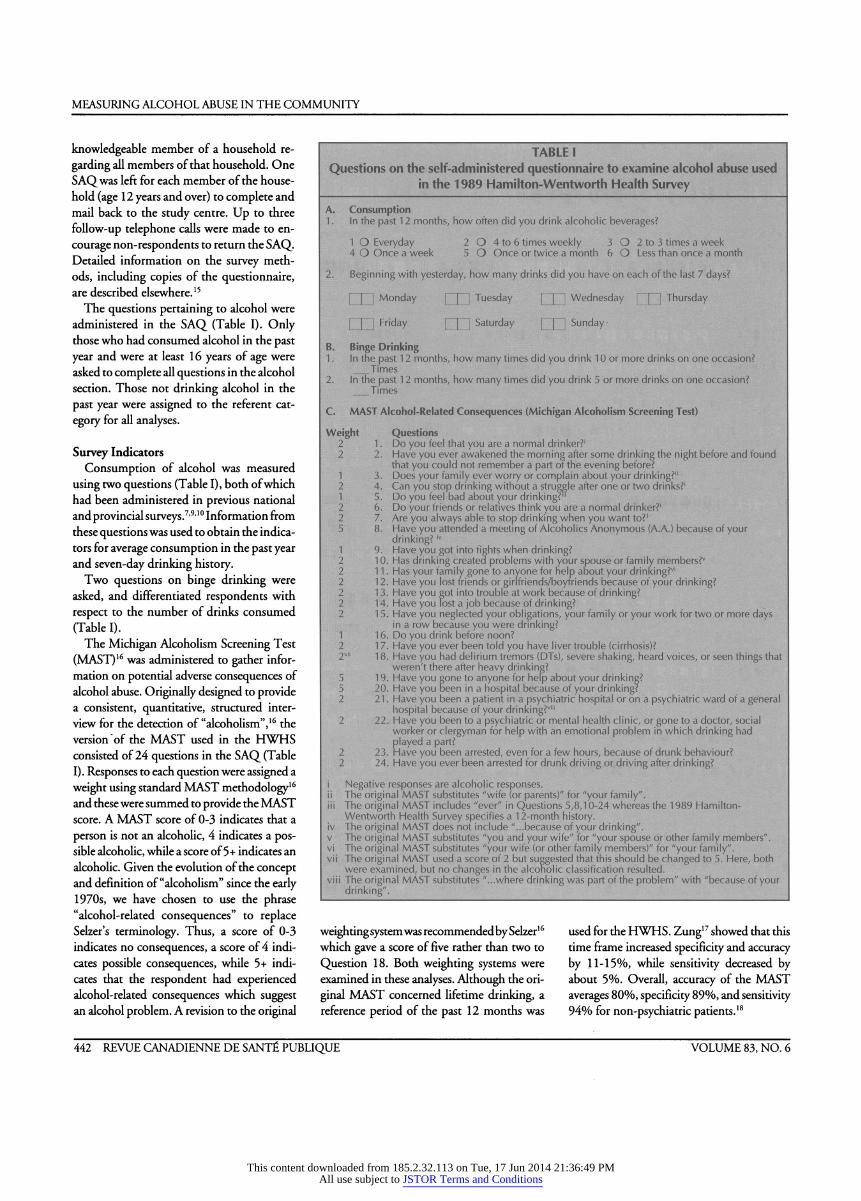
The questions pertaining to alcohol were administered in the SAQ (Table I). Only those who had consumed alcohol in the past year and were at least 16 years of age were asked to complete all questions in the alcohol section. Those not drinking alcohol in the past year were assigned to the referent cat- egory for all analyses.
Survey Indicators Consumption of alcohol was measured
using two questions (Table I), both of which had been administered in previous national and provincial surveys.7,9,10 Information from these questions was used to obtain the indica- tors for average consumption in the past year and seven-day drinking history.
Two questions on binge drinking were asked, and differentiated respondents with respect to the number of drinks consumed (Table I).
The Michigan Alcoholism Screening Test (MAST)16 was administered to gather infor- mation on potential adverse consequences of alcohol abuse. Originally designed to provide a consistent, quantitative, structured inter- view for the detection of "alcoholism",16 the version* of the MAST used in the H WHS consisted of 24 questions in the SAQ (Table I). Responses to each question were assigned a weight using standard MAST methodology16 and these were summed to provide the MAST score. A MAST score of 0-3 indicates that a person is not an alcoholic, 4 indicates a pos- sible alcoholic, while a score of 5+ indicates an alcoholic. Given the evolution of the concept and definition of "alcoholism" since the early 1970s, we have chosen to use the phrase "alcohol-related consequences" to replace Selzer's terminology. Thus, a score of 0-3 indicates no consequences, a score of 4 indi- cates possible consequences, while 5+ indi- cates that the respondent had experienced alcohol-related consequences which suggest an alcohol problem. A revision to the original
TABLE I Questions on the self-administered questionnaire to examine alcohol abuse used
in the 1989 Hamilton- Wentworth Health Survey
A. Consumption 1 . In the past 1 2 months, how often did you drink alcoholic beverages?
1 O Everyday 2 O 4 to 6 times weekly 3 O 2 to 3 times a week 4 O Once a week 5 O Once or twice a month 6 O Less than once a month
2. Beginning with yesterday, how many drinks did you have on each of the last 7 days?
I I I Monday f | | Tuesday | | | Wednesday [~J~] Thursday
P I I Friday | | | Saturday | | | Sunday -
B. Binge Drinking 1 . In the past 1 2 months, how many times did you drink 1 0 or more drinks on one occasion?
Times 2. In the past 1 2 months, how many times did you drink 5 or more drinks on one occasion?
Times
C. MAST Alcohol-Related Consequences (Michigan Alcoholism Screening Test)
Weight Questions 2 1 . Do you feel that you are a normal drinker?' 2 2. Have you ever awakened the morning after some drinking the night before and found
that you could not remember a part of the evening before? 1 3. Does your family ever worry or complain about your drinking?" 2 4. Can you stop drinking without a struggle after one or two drinks?' 1 5. Do you feel bad about your drinkingr" 2 6. Do your friends or relatives think you are a normal drinker?' 2 7. Are you always able to stop drinking when you want to?1 5 8. Have you attended a meeting of Alcoholics Anonymous (A.A.) because of your
drinking? iv 1 9. Have you got into fights when drinking? 2 1 0. Has drinking created problems with your spouse or family members?v 2 11. Has your family gone to anyone for help about your drinking?vi 2 1 2. Have you lost friends or girlfriends/boyrriends because of your drinking? 2 1 3. Have you got into trouble at work because of drinking? 2 1 4. Have you lost a job because of drinking? 2 1 5. Have you neglected your obligations, your family or your work for two or more days in a row because you were drinking? 1 1 6. Do you drink before noon? 2 1 7. Have you ever been told you have liver trouble (cirrhosis)? 2vii 1 8. Have you had delirium tremors (DTs), severe shaking, heard voices, or seen things that
weren't there after heavy drinking? 5 1 9. Have you gone to anyone for help about your drinking? 5 20. Have you been in a hospital because of your drinking? 2 21 . Have you been a patient in a psychiatric hospital or on a psychiatric ward of a general hospital because of your drinking?™' 2 22. Have you been to a psychiatric or mental health clinic, or gone to a doctor, social worker or clergyman for help with an emotional problem in which drinking had played a part? 2 23. Have you been arrested, even for a few hours, because of drunk behaviour?
2 24. Have you ever been arrested for drunk driving or driving after drinking? i Negative responses are alcoholic responses. ii The original MAST substitutes "wife (or parents)" for "your family". iii The original MAST includes "ever" in Questions 5,8,10-24 whereas the 1989 Hamilton-
Wentworth Health Survey specifies a 12-month history. iv The original MAST does not include "...because of your drinking". v The original MAST substitutes "you and your wife" for "your spouse or other family members". vi The original MAST substitutes "your wife (or other family members)" for "your family". vii The original MAST used a score of 2 but suggested that this should be changed to 5. Here, both
were examined, but no changes in the alcoholic classification resulted. viii The original MAST substitutes "...where drinking was part of the problem" with "because of your
drinking".
weighting system was recommended by Selzer16 which gave a score of five rather than two to Question 18. Both weighting systems were examined in these analyses. Although the ori- ginal MAST concerned lifetime drinking, a reference period of the past 12 months was
used for the H WHS. Zung17 showed that this time frame increased specificity and accuracy by 11-15%, while sensitivity decreased by about 5%. Overall, accuracy of the MAST averages 80%, specificity 89%, and sensitivity 94% for non-psychiatric patients.18
442 REVUE CANADIENNE DE SANTÉ PUBLIQUE VOLUME 83, NO. 6
This content downloaded from 185.2.32.113 on Tue, 17 Jun 2014 21:36:49 PMAll use subject to JSTOR Terms and Conditions
MEASURING ALCOHOL ABUSE IN THE COMMUNITY
TABLE II Prevalence and population estimates (with 95% confidence limits (CL)) of problem drinking among those 1 6 years of age and
over, by sex, as determined by three indicators of alcohol use, Hamilton-Wentworth, 1 989
Males Females Both Sexes Population Estimate* 95% CL Population Estimate 95% CL Population Estimate 95% CL
No. % Lower Upper No. % Lower Upper No. % Lower Upper
1 . Consumption a) Average During Past Year
<1 Time/Month 47,900 32.6 26.7 38.4 83,500 45.6 40.0 51.2 131,400 39.8 35.7 43.9 1-2 Times/Month 22,100 15.0 10.5 19.5 40,000 21.9 17.2 26.5 62,100 18.8 15.5 22.1
1 Time/Week 20,800 14.1 9.7 18.5 26,300 14.4 10.4 18.3 47,000 14.2 11.3 17.2 2-3 Times/Week 27,900 19.0 14.0 23.9 19,900 10.9 7.4 14.4 47,800 14.5 11.5 17.4 4-6 Times/Week 15,300 10.4 6.5 14.2 7,700 4.2 1.9 6.5 23,000 7.0 4.8 9.1
Everyday 13,200 9.0 5.4 12.6 5,700 3.1 1.1 5.1 18,900 5.7 3.8 7.7 Total 147,200 100.0 183,000 100.0 330,200 100.0
Not Stated 4,200 10,700 14,900 b) 7-Day Alcohol History 0 Drinks 48,000 37.6 31.1 44.2 79,500 52.3 46.1 58.5 127,500 45.6 41.1 50.2
1-6 Drinks 37,500 29.4 23.3 35.6 50,900 33.5 27.7 39.3 88,400 31.6 27.4 35.9 7-13 Drinks 16,400 12.9 8.3 17.4 13,400 8.8 5.3 12.3 29,800 10.7 7.9 13.5 2:14 Drinks 25,600 20.1 14.7 25.5 8,300 5.5 2.6 8.3 33,900 12.1 9.2 15.1
Total 127,500 100.0 152,000 100.0 279,500 100.0 Not Stated 23,900 41,700 65,600
2. Binge Drinking a) ä5 Drinks at One Sitting Never 69,100 49.1 42.7 55.5 129,500 74.2 69.1 79.2 198,600 63.0 58.9 67.1
1-4 Times 20,500 14.6 10.0 19.1 21,900 12.5 8.7 16.3 42,400 13.4 10.5 16.4 ;>5 Times 51,000 36.3 30.1 42.5 23,200 13.3 9.4 17.2 74,200 23.6 19.9 27.2
Total 140,600 100.0 174,600 100.0 315,200 100.0 Not Stated 10,800 19,100 30,000
b) 2:10 Drinks at One Sitting Never 108,700 75.9 70.4 81.3 159,500 89.8 86.4 93.3 268,200 83.6 80.4 86.7 1-4 Times 9,700 6.8 3.6 10.0 12,900 7.3 4.3 10.3 22,600 7.1 4.9 9.2 ä5 Times 24,900 17.4 12.6 22.2 5,200 2.9 1.0 4.8 30,000 9.4 6.9 11.8
Total 143,300 100.0 177,600 100.0 320,900 100.0 Not Stated 8,200 16,100 24,300
3. Alcohol-related Consequences a) MAST (Michigan Alcoholism Screening Test)
No Consequences 100,600 74.8 69.1 80.5 147,000 88.3 84.5 92.1 247,700 82.3 78.9 85.6 Possible Consequences 18,300 13.6 9.1 18.1 12,900 7.7 4.6 10.9 31,100 10.3 7.7 13.0
Consequences 15,700 11.7 7.4 15.9 6,600 4.0 1.7 6.3 22,300 7.4 5.1 9.7 Total 134,600 100.0 166,500 100.0 301,100 100.0
Not Stated 16,900 27,200 44,000 * Population estimates may not sum to totals due to rounding.
Associations between the HWHS alcohol indicators were examined using Pearson cor- relation coefficients (R). The average level of drinking, seven-day drinking history and MAST score were left as continuous vari- ables. Bingeing on at least 10 drinks was assigned 0 for those never bingeing, 1 for bingeing one to four times in the past 12 months, and 2 for bingeing at least five times in the past 12 months.
For all survey indicators, prevalence rates (i.e. for those 16 years of age and over) and population estimates were determined by applying a weight to each respondent. The weight equalled the number of persons repre- sented by the respondent, and was depen- dent on the sampling methodology. The weights were provided by Statistics Canada
and were adjusted to the 1989 age and sex population distribution for the community. The weights varied from 424. 5 to 76 1 . 5 with an average of 60 4.46. Ninety-five percent confidence limits (95% CL) were calculated for all estimates.19'20
Consumption Using Sales Data Prior to the availability of survey estimates
for Hamilton-Wentworth, alcohol sales data were commonly used to estimate the preva- lence of alcohol consumption in Ontario communities. 121 Consumption levels per day for Hamilton-Wentworth were abstracted from Rush,1 and converted to weekly esti- mates of alcohol consumption for the adult population of Hamilton-Wentworth (age 1 5 years of age and over) using the 1 986 Census
population as the denominator.22 Using er- ror estimates provided by Rush,1 high and low prevalence estimates were calculated to represent 95% CL.
RESULTS
A response rate of 85% (N=896) was achieved for the LAQ. Of the 896 respon- dents who were asked to complete the SAQ, 603 (67%) returned the questionnaire to the study centre. Only those completing both questionnaires, and who were 1 6 years of age and over, were included in these analyses. As a result, 571 subjects were included in the analysis, with over half being female (56%). Respondents were found to be slightly older than the 1986 Census population but were
NOVEMBER - DECEMBER 1992 CANADIAN JOURNAL OF PUBLIC HEALTH 443
This content downloaded from 185.2.32.113 on Tue, 17 Jun 2014 21:36:49 PMAll use subject to JSTOR Terms and Conditions
MEASURING ALCOHOL ABUSE IN THE COMMUNITY
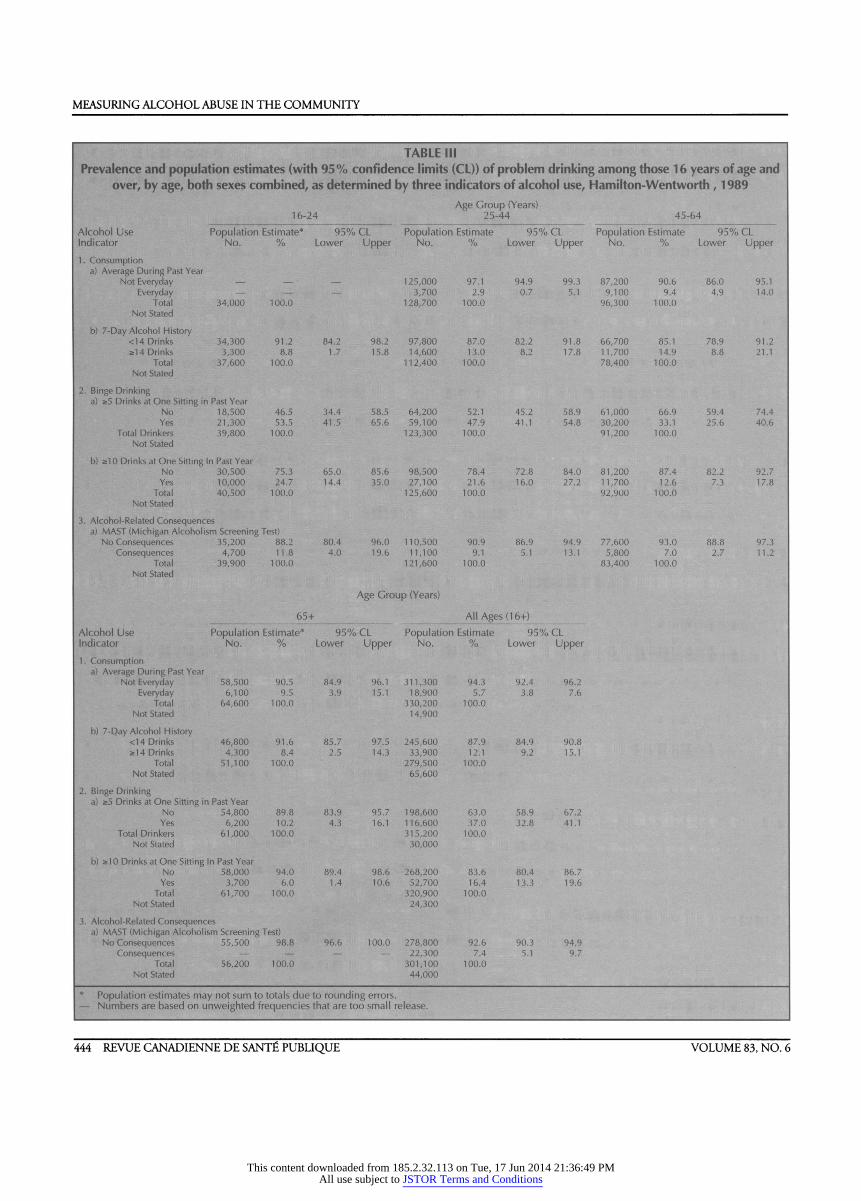
TABLE III Prevalence and population estimates (with 95% confidence limits (CL)) of problem drinking among those 1 6 years of age and
over, by age, both sexes combined, as determined by three indicators of alcohol use, Hamilton-Wentworth , 1 989
Age Group (Years) 16-24 25-44 45-64
Alcohol Use Population Estimate* 95% CL Population Estimate 95% CL Population Estimate 95% CL Indicator No. % Lower Upper No. % Lower Upper No. % Lower Upper 1. Consumption
a) Average During Past Year Not Everyday - •- - 125,000 97.1 94.9 99.3 87,200 90.6 86.0 95.1
Everyday - - - 3,700 2.9 0.7 5.1 9,100 9.4 4.9 14.0 Total 34,000 100.0 128,700 100.0 96,300 100.0
Not Stated b) 7-Day Alcohol History
<14 Drinks 34,300 91.2 84.2 98.2 97,800 87.0 82.2 91.8 66,700 85.1 78.9 91.2 *14 Drinks 3,300 8.8 1.7 15.8 14,600 13.0 8.2 17.8 11,700 14.9 8.8 21.1
Total 37,600 100.0 112,400 100.0 78,400 100.0 Not Stated
2. Binge Drinking a) *5 Drinks at One Sitting in Past Year
No 18,500 46.5 34.4 58.5 64,200 52.1 45.2 58.9 61,000 66.9 59.4 74.4 Yes 21,300 53.5 41.5 65.6 59,100 47.9 41.1 54.8 30,200 33.1 25.6 40.6
Total Drinkers 39,800 100.0 123,300 100.0 91,200 100.0 Not Stated
b) as10 Drinks at One Sitting In Past Year No 30,500 75.3 65.0 85.6 98,500 78.4 72.8 84.0 81,200 87.4 82.2 92.7 Yes 10,000 24.7 14.4 35.0 27,100 21.6 16.0 27.2 11,700 12.6 7.3 17.8
Total 40,500 100.0 125,600 100.0 92,900 100.0 Not Stated
3. Alcohol-Related Consequences a) MAST (Michigan Alcoholism Screening Test)
No Consequences 35,200 88.2 80.4 96.0 110,500 90.9 86.9 94.9 77,600 93.0 88.8 97.3 Consequences 4,700 11.8 4.0 19.6 11,100 9.1 5.1 13.1 5,800 7.0 2.7 11.2
Total 39,900 100.0 121,600 100.0 83,400 100.0 Not Stated
Age Group (Years) 65+ All Ages (1 6+)
Alcohol Use Population Estimate* 95% CL Population Estimate 95% CL Indicator No. % Lower Upper No. % Lower Upper 1. Consumption
a) Average During Past Year Not Everyday 58,500 90.5 84.9 96.1 311,300 94.3 92.4 96.2
Everyday 6,100 9.5 3.9 15.1 18,900 5.7 3.8 7.6 Total 64,600 100.0 330,200 100.0
Not Stated 1 4,900 b) 7-Qay Alcohol History <14 Drinks 46,800 91.6 85.7 97.5 245,600 87.9 84.9 90.8
*14 Drinks 4,300 8.4 2.5 14.3 33,900 12.1 9.2 15.1 Total 51,100 100.0 279,500 100.0
Not Stated 65,600 2. Binge Drinking
a) *5 Drinks at One Sitting in Past Year No 54,800 89.8 83.9 95.7 198,600 63.0 58.9 67.2 Yes 6,200 10.2 4.3 16.1 116,600 37.0 32.8 41.1
Total Drinkers 61,000 100.0 315,200 100.0 Not Stated 30,000
b) *10 Drinks at One Sitting In Past Year No 58,000 94.0 89.4 98.6 268,200 83.6 80.4 86.7 Yes 3,700 6.0 1.4 10.6 52,700 16.4 13.3 19.6
Total 61,700 100.0 320,900 100.0 Not Stated 24,300
3. Alcohol-Related Consequences a) MAST (Michigan Alcoholism Screening Test)
No Consequences 55,500 98.8 96.6 100.0 278,800 92.6 90.3 94.9 Consequences - - - - 22,300 7.4 5.1 9.7
Total 56,200 100.0 301,100 100.0 Not Stated 44,000
* Population estimates may not sum to totals due to rounding errors. - Numbers are based on unweighted frequencies that are too small release.
444 REVUE CANADIENNE DE SANTÉ PUBLIQUE VOLUME 83, NO. 6
This content downloaded from 185.2.32.113 on Tue, 17 Jun 2014 21:36:49 PMAll use subject to JSTOR Terms and Conditions
MEASURING ALCOHOL ABUSE IN THE COMMUNITY
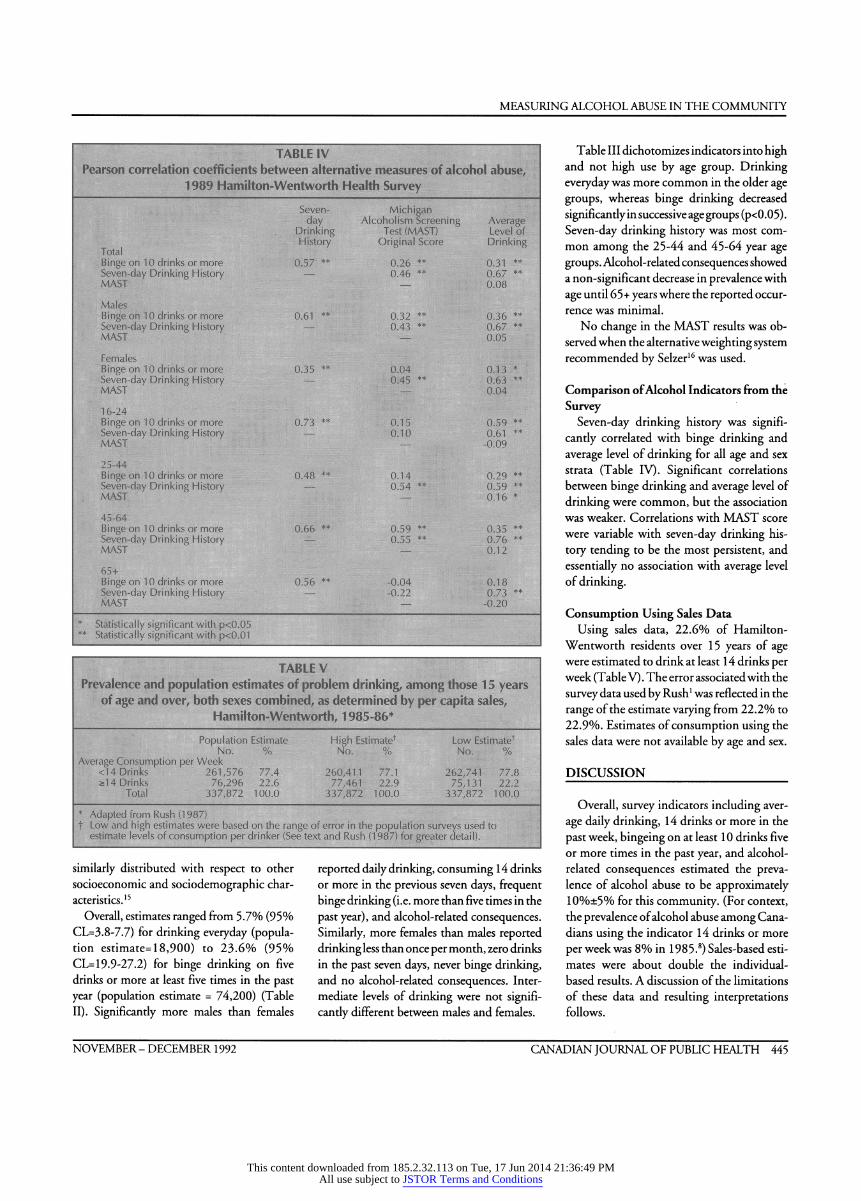
TABLE IV Pearson correlation coefficients between alternative measures of alcohol abuse,
1989 Hamilton-Wentworth Health Survey Seven- Michigan day Alcoholism Screening Average
Drinking Test (MAST) Level of History Original Score Drinking Total
Binge on 10 drinks or more 0.57 ** 0.26 ** 0.31 ** Seven-day Drinking History - 0.46 ** 0.67 ** MAST - 0.08 Males Binge on 10 drinks or more 0.61 ** 0.32 ** 0.36 ** Seven-day Drinking History - 0.43 ** 0.67 ** MAST - 0.05 Females Binge on 10 drinks or more 0.35 ** 0.04 0.13 * Seven-day Drinking History - 0.45 ** 0.63 ** MAST - 0.04 16-24 Binge on 10 drinks or more 0.73 ** 0.15 0.59 ** Seven-day Drinking History - 0.10 0.61 ** MAST - -0.09 25-44 Binge on 10 drinks or more 0.48 ** 0.14 0.29 ** Seven-day Drinking History - 0.54 ** 0.59 ** MAST - 0.16 *
45-64 Binge on 10 drinks or more 0.66 ** 0.59 ** 0.35 ** Seven-day Drinking History - 0.55 ** 0.76 ** MAST - 0.12 65+ Binge on 10 drinks or more 0.56 ** -0.04 0.18 Seven-day Drinking History - -0.22 0.73 ** MAST - -0.20
* Statistically significant with p<0.05 ** Statistically significant with p<0.01
TABLE V Prevalence and population estimates of problem drinking, among those 1 5 years
of age and over, both sexes combined, as determined by per capita sales, Hamilton-Wentworth, 1985-86*
Population Estimate High Estimate1 Low Estimate1 No. % No. % No. %
Average Consumption per Week <14 Drinks 261,576 77.4 260,411 77.1 262,741 77.8 &14 Drinks 76,296 22.6 77,461 22.9 75,131 22.2
Total 337,872 100.0 337,872 100.0 337,872 100.0 * Adapted from Rush (1 987) t Low and high estimates were based on the range of error in the population surveys used to
estimate levels of consumption per drinker (See text and Rush (1 987) for greater detail).
similarly distributed with respect to other socioeconomic and sociodemographic char- acteristics.15
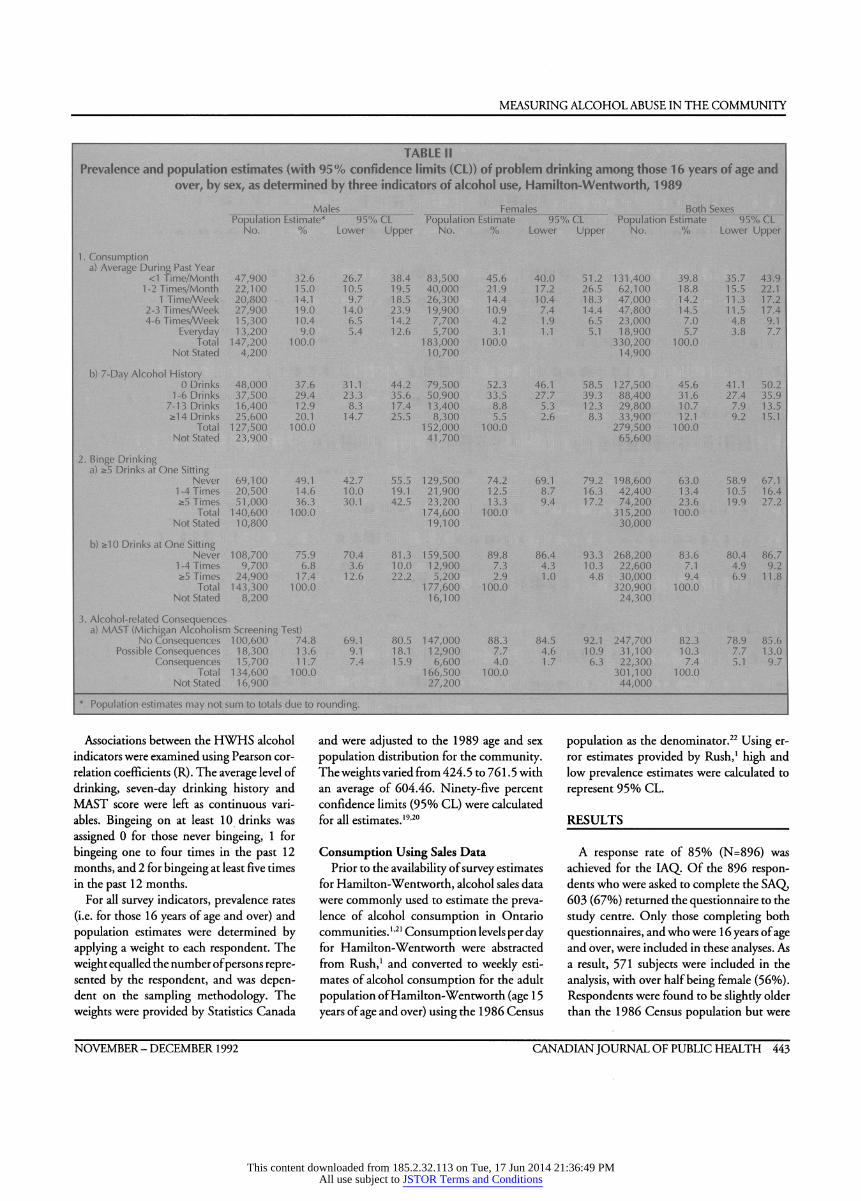
Overall, estimates ranged from 5.7% (95% CL=3.8-7.7) for drinking everyday (popula- tion estimate= 18,900) to 23.6% (95% CL= 19.9-27.2) for binge drinking on five drinks or more at least five times in the past year (population estimate = 74,200) (Table II). Significantly more males than females
reported daily drinking, consuming 14 drinks or more in the previous seven days, frequent binge drinking (i.e. more than five times in the past year), and alcohol-related consequences. Similarly, more females than males reported drinking less than once per month, zero drinks in the past seven days, never binge drinking, and no alcohol-related consequences. Inter- mediate levels of drinking were not signifi- cantly different between males and females.
T able III dichotomizes indicators into high and not high use by age group. Drinking everyday was more common in the older age groups, whereas binge drinking decreased significantly in successive age groups (p<0.05) . Seven-day drinking history was most com- mon among the 25-44 and 45-64 year age groups. Alcohol-related consequences showed a non-significant decrease in prevalence with age until 65+ years where the reported occur- rence was minimal.
No change in the MAST results was ob- served when the alternative weighting system recommended by Selzer16 was used.
Comparison of Alcohol Indicators from the Survey
Seven-day drinking history was signifi- cantly correlated with binge drinking and average level of drinking for all age and sex strata (Table IV). Significant correlations between binge drinking and average level of drinking were common, but the association was weaker. Correlations with MAST score were variable with seven-day drinking his- tory tending to be the most persistent, and essentially no association with average level of drinking.
Consumption Using Sales Data Using sales data, 22.6% of Hamilton-
Wentworth residents over 15 years of age were estimated to drink at least 14 drinks per week (T able V) . The error associated with the survey data used by Rush1 was reflected in the range of the estimate varying from 22.2% to 22.9%. Estimates of consumption using the sales data were not available by age and sex.
DISCUSSION
Overall, survey indicators including aver- age daily drinking, 14 drinks or more in the past week, bingeing on at least 10 drinks five or more times in the past year, and alcohol- related consequences estimated the preva- lence of alcohol abuse to be approximately 10%±5% for this community. (For context, the prevalence of alcohol abuse among Cana- dians using the indicator 14 drinks or more per week was 8% in 1 98 5. 8) Sales-based esti- mates were about double the individual- based results. A discussion of the limitations of these data and resulting interpretations follows.
NOVEMBER - DECEMBER 1992 CANADIAN JOURNAL OF PUBLIC HEALTH 445
This content downloaded from 185.2.32.113 on Tue, 17 Jun 2014 21:36:49 PMAll use subject to JSTOR Terms and Conditions
MEASURING ALCOHOL ABUSE IN THE COMMUNITY
Consumption indicators which rely on self-report have the common problem of having those who abuse alcohol underesti- mating the quantity and frequency of their consumption.16,23 A more conceptual prob- lem with consumption statistics is that they are unlikely to consider the physical and psychological components included in cur- rent definitions of problem-drinking, alcohol-dependency and alcoholism.24
We used 14 drinks or more per week as a cut-off point to indicate alcohol abuse. Evi- dence indicates that, in males, mortality from all causes changes with amount consumed in a "J-shaped" pattern, where the increase oc- curred at the two to three drinks per day, or 1 4 or more drinks per week.25 While this cut- off point enabled comparisons with other surveys,1,7,9 alternatives are numerous,8,26 with justification for their choice being typically vague and lacking standardization.
Similar data on the health risks of different levels of alcohol consumption among fe- males were not available. Age, body weight, and tolerance also contribute to the experi- ence with, and/or susceptibility to, alco- hol.24 27,28 Thus, ideally cut-off points should vary by these factors. As a community health indicator or summary measure of alcohol abuse, such extensive tabulations would be counter-productive.
Binge drinking has the added requirement to consider duration and binge circumstances (e.g. driving after drinking) as important variables in assessing the health risks of this behaviour. No data were available to address these issues. It is reasonable to assume, how- ever, that binge drinking on 10 drinks or more can be considered sufficient to cause intoxication of most people, with frequent bingeing posing an added likelihood of ad- verse outcomes.
The validity and reliability of the MAST has been extensively studied and found to be satisfactory for the detection of persons with alcohol-related problems or "alcoholism".18 Hedlund and Vieweg18 provide an extensive review of the MAST which will not be detailed here. When used in the general population, the MAST tends to detect the more severe end of the alcohol-dependency spectrum.23,29,30 This may be due to the use of the 5+ score which was validated among a chronic treatment population. To detect milder alcohol-related consequences, it is
possible to examine the characteristics of those with a MAST score of less than five. Harburg et al.,31 however, found that two questions on the MAST can be misinter- preted by persons who abstain or rarely drink alcohol. Very low drinkers may an- swer that they (and/or their friends) do not consider themselves to be "normal" drink- ers (Questions 1 and 6). The MAST pre- sumes that "not normal" refers to excessive drinking. Since each of these questions is scored as two, "abnormally low drinkers" could be classified as those with possible alcohol-related consequences. This is likely to have occurred here since 77.7% of those with possible alcohol-related consequences had responded positively to only these two questions on the MAST. Further, 46.7% of those with possible alcohol-related conse- quences said they did not drink in the past seven days, and 91.1% had consumed fewer than 14 drinks in this period. It is recom- mended, therefore, that future community surveys reword Questions 1 and 6 of the MAST to refer to excessive drinking.32
Although the alcohol abuse indicators ex- amined above have been used in other sur- veys, comparisons between these measures have been lacking. High consumption (drink- ing everyday or 14 drinks or more in the past week), binge drinking (five or more times in the past year on 10 drinks or more), and alcohol-related consequences all provided similar estimates of the prevalence of prob- lem drinking in Hamilton-Wentworth (5.7% to 1 2. 1 %) thereby increasing our confidence in the validity of the survey. Statistically significant correlations were found for the continuous versions of these indicators. In this community, therefore, any one of these indicators could approximate the overall prevalence of alcohol-related problems. The distribution of each indicator, however, var- ies significantly by age and sex. Thus, the choice of an appropriate indicator must de- pend on the underlying research question. For example, bingeing may be a more rel- evant indicator for quantifying the magni- tude of the alcohol problem among younger people than would drinking everyday since daily drinking was rare among those 16-24 years.
As the HWHS was cross-sectional, it is not possible to examine changes in alcohol abuse for different cohorts of individuals as they
progress through time; it is unknown whether the persons age 1 6-24 years who were identi- fied as having alcohol-related consequences would continue with this behaviour through- out their lifetime. Alternatively, it is not known whether those who binge-drink heavily during their youth become daily drink- ers and heavy drinkers as they age. Prospec- tive studies are required to answer these ques- tions.
The sales data provide estimates of con- sumption that are much higher than those obtained from the HWHS. Questions re- garding the validity of the sales data method- ology, however, have been raised.33'36 The assumptions of a log-normal curve to esti- mate consumption, and a homogeneous population have been challenged by a num- ber of researchers.33'36 The significant differ- ences in consumption levels between males and females is one example of the problems with this latter assumption. Sales-based esti- mates, therefore, should be used with ex- treme caution with the knowledge that, based on these findings, they provide a higher esti- mate of alcohol abuse in the community as compared to the individual-based survey data.
The translation of percentages to popula- tion estimates stresses the tremendous im- pact that alcohol abuse has upon the health of populations. Using the most conservative indicator, drinking everyday, nearly 19,000 residents may be considered to have an alco- hol problem. By monitoring such indicators, public health professionals can evaluate the effectiveness of programs in reducing the number and prevalence of people who abuse alcohol.
ACKNOWLEDGEMENTS
The preparation and field work of the HWHS was funded by the Ontario Govern- ment through the Ontario Ministry of Health and was conducted by Statistics Canada. Special thanks go to Mr. Gary Catlin, man- ager of the 1989 Hamilton-Wentworth Health Survey, which was conducted as a pre-test to the Ontario Health Survey.
REFERENCES 1 . Rush BR Alcohol consumption in Ontario coun-
ties and regional municipalities, 1985-86. Addic- tion Research Foundation Internal Document No. 94. Toronto, ON: Addiction Research Founda- tion, 1987.
446 REVUE CANADIENNE DE SANTÉ PUBLIQUE VOLUME 83, NO. 6
This content downloaded from 185.2.32.113 on Tue, 17 Jun 2014 21:36:49 PMAll use subject to JSTOR Terms and Conditions
MEASURING ALCOHOL ABUSE IN THE COMMUNITY
2. Addiction Research Foundation. Ontario Profile Annual Sourcebook: Alcohol and Other Drugs. Toronto, ON: Addiction Research Foundation, 1992.
3. Adrian M. Mapping the severity of alcohol and drug problems in Ontario. Can J Public Health 1983; 74: 335-42.
4. Adrian M, Juli P, and Williams R. Statistics on Alcohol and Drug Use in Canada and other Coun- tries. Volumes 1 and 2. Toronto, ON: Addiction Research Foundation, 1983.
5. Kircher T, Neslon J, Burdo H. The autopsy as a measure of accuracy of the death certificate. N Engl J Med 1985; 313: 1263-9.
6. Engel LW, Sträuchen JA, Chiazze L, and Heid M. Accuracy of death certification in an autopsied population with specific attention to malignant neoplasms and vascular disease. Am J Epidemiol 1980; 111:99-112.
7. Canada Health Survey. The Health of Canadians: Report of the Canada Health Survey. Ottawa, ON: Statistics Canada, Cat. No. 82-538E, 1981.
8. Statistics Canada. General Social Survey, Analysis Series, 1: Health and Social Support 1985. Minister of Supply and Services Canada, 1987.
9. Health and Welfare Canada. Canada's Health Pro- motion Survey: Technical Report. Rootman I, Warren R et al., eds. Ottawa: Minister of Supply and Services Canada, 1988.
10. Émond A and Guyon L. The Health of Québecers: Highlights of the 1987 Québec Health Survey. Québec, 1988.
11. Reynolds DL and Chambers LW. Hamilton- Wentworth on the rocks? - Alcohol (Ab) Use in Hamilton-Wentworth. Health Priorities Analysis Unit, McMaster University, Hamilton, Ontario, Infowatch 1990; 2(5).
1 2. Crawford A, Plant MA, Kreitman N, Latcham RW. Unemployment and drinking behaviour: Some data from a general population survey of alcohol use. Brit ] Addiction 1987;82:1007-16.
13. Bradstock K, Forman MR, Binkin NJ, Gentrv EM et al. Alcohol use and health behaviour lifestyles among US women: The behavioural risk factor survey. Addictive Behaviours 1988;13:61-71.
14. Herscovitch A. Alcoholism: From Recognition to Recovery. Toronto, ON: Addiction Research Foun- dation, 1989.
15. Chambers LW and Reynolds DL. 1989 Hamilton- Wentworth Health Survey: Survey Methods. Inter- nal Document, Health Priorities Analysis Unit, McMaster University, Hamilton, Ontario, 1990.
16. Selzer ML. The Michigan Alcoholism Screening Test: The quest for a new diagnostic instrument. Amer J Psychiat 1971; 127: 89-94.
17. Zung BJ. Evaluation of the Michigan Alcoholism Screening Test (MAST) in assessing lifetime and recent problems. J Clin Psychol 1982; 38: 425-39.
18. Hedlund JL and Vieweg BW. The Michigan Alco- holism Screening Test (MAST): A comprehensive review .J Operational Psychiatry 1984; 15: 55-64.
19. Freedman D, Pisani R and Purves R. Statistics. New York: W.W. Norton and Co., 1978.
20. Statistics Canada. The Health and Activity Limita- tion Survey Microdata User's Guide - Adults in Households. Ottawa, ON: Statistics Canada, 1989.
21 . Simpson R and Rush BR. A programmers guide to alcohol consumption statistics. Addiction Research Foundation Internal Document No. 57. Toronto, ON: Addiction Research Foundation, 1985.
22. Statistics Canada. Census of Canada. Ottawa, ON: Statistics Canada, 1986.
23. King M. At risk drinking among general practice attenders: validation of the CAGE questionnaire. Psychol Med 1986; 16: 213-17.
24. Schuckit MA. Alcohol and Alcoholism. In: Braunwald E, Isselbachwe KJ, Petersdorf et al. eds. Harrison 's Principles of Internal Medicine, Eleventh Edition. Toronto: McGraw-Hill Book Company, 1987.
25. Boffetta P and Garfinkel L. Alcohol drinking and mortality among men enrolled in an American Cancer Society prospective study. Epidemiology 1990; 342-8.
26. Health and Welfare Canada. National Alcohol and Other Drugs Survey (1989): Highlights Report. Eliany M, Giesbrecht N, Nelson M, Wellman B and Wortley S (eds.). Minister of Supply and Ser- vices Canada, Cat. No., H39-175/1990E, 1990.
27. Frezza M, Di Padova C, Pozzato G, et al. High blood levels in women: The role of decreased gastric alcohol dehydrogenase activity and first-pass me- tabolism. N Engl J Med 1990; 322: 95-9.
28. Seitz HK, Egerer G, and Simanowski UA. High blood alcohol levels in women. N Engl J Med 1 990; 323: 58.
29 . Saunders WM and Kershaw PW. Screening tests for alcoholism: findings from a community study. Brit J Addiction 1980; 75: 37-41.
30. Saunders WM and Kershaw PW. The prevalence of problem drinking and alcoholism in the West of Scotland. Brit J Psychiat 1978; 133: 493-9.
3 1 . Harburg E, Gunn R, Gleiberman L et al. Using the Short Michigan Alcoholism Screening T est to Study Social Drinkers: Tecumseh, Michigan./ Studj 'ko- hol 1988; 49(6): 522-31.
32. Selzer ML, Vinokur A and Van Rooijen L. A self- administered Short Michigan Alcoholism Screen- ing Test (SMAST)./ W,4tó>/1975;36:l 17-26.
33. Single E. The availability theory of alcohol-related problems. In: Chaudron CD and Wilkinson DA, eds. Theories on Alcoholism. Toronto, ON: Addic- tion Research Foundation, 1988: 325-51.
34. Parker DA and Harman MS. The distribution of consumption model of prevention of alcohol prob- lems; a critical assessment. J Stud Alcohol 1978;39:377-99.
35. Skog O-J. On the distribution of alcohol consump- tion. National Institute for Alcohol Research, No. 4. Oslo, 19 77.
36. Skog O-J. The distribution of alcohol consump- tion. Part I: A critical discussion of the Ledermann Model. (SIFA mimeograph No. 64,67). National Institute for Alcohol Research, Oslo, 1982.
Received: December 17, 1991 Accepted: March 20, 1992
NOVEMBER - DECEMBER 1992 CANADIAN JOURNAL OF PUBLIC HEALTH 447
This content downloaded from 185.2.32.113 on Tue, 17 Jun 2014 21:36:49 PMAll use subject to JSTOR Terms and Conditions