measurements of the vertical coherence length in neutron interferometry
TRANSCRIPT
Measurements of the Vertical Coherence Length in Neutron Interferometry
D. A. Pushin,1,* M. Arif,2 M. G. Huber,3 and D. G. Cory1
1Department of Nuclear Science and Engineering, Massachusetts Institute of Technology, Cambridge, Massachusetts, USA2National Institute of Standards and Technology, Gaithersburg, Maryland, USA
3Department of Physics, Tulane University, New Orleans, Louisiana, USA(Received 19 March 2008; published 26 June 2008)
The study and use of macroscopic quantum coherence requires long coherence lengths. Here wedescribe an approach to measuring the vertical coherence length in neutron interferometry, along withimprovements to the NIST interferometer that led to a measured coherence length of 790 A. Themeasurement is based on introducing a path separation and measuring the loss in contrast as thisseparation is increased. The measured coherence length is consistent with the momentum distributionof the neutron beam. Finally, we demonstrate that the loss in contrast with beam displacement in one leg ofthe interferometer can be recovered by introducing a corresponding displacement in the second leg.
DOI: 10.1103/PhysRevLett.100.250404 PACS numbers: 03.75.Dg, 03.65.�w, 42.50.�p
Introduction.—We wish to develop neutron interferom-etery as a robust practical example of a macroscopic co-herent device with potential application to quantuminformation processing (QIP) and condensed matter phys-ics. Interferometry is one of the most direct measures ofquantum interference [1–4]. Having an interferometer witha long coherence length opens up the possibilities of usinginterferometry for new experiments and studies that are noteasily accessible by other approaches. Increases in thecoherence length also improve both the interferometercontrast and the precision of measurements. In particulara long vertical coherence length would allow useful im-plementations of Fourier spectroscopy [5] with applica-tions in condensed matter and biology. Beyond suchapplications a long coherence length would also benefitfoundational physics questions. Here a long coherencelength permits studies of macroscopical quantum interfer-ence [6], since increasing the coherence length moves thedescription of interferometry towards a more plane-wavepicture and permits simple studies of decoherence. Herewe describe modifications to the National Institute ofStandards and Technology (NIST) neutron interferometerthat increased the coherence length (lc) and we describe amethod to directly measures the spatial coherence.
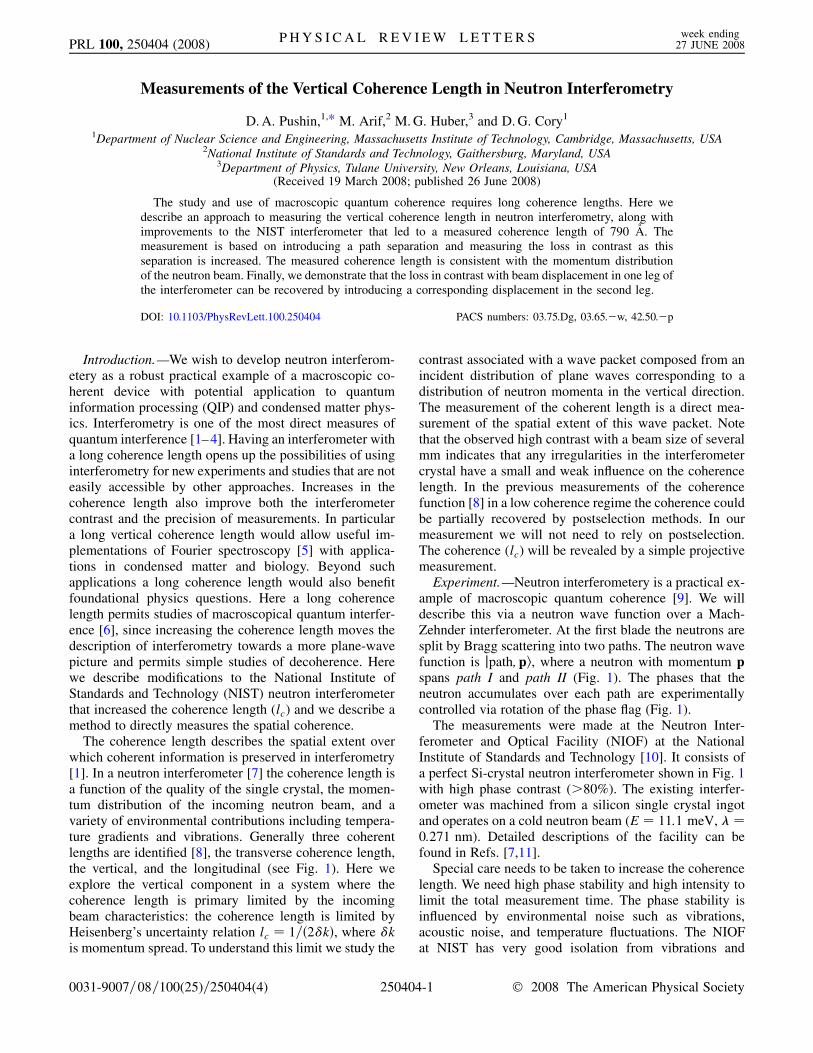
The coherence length describes the spatial extent overwhich coherent information is preserved in interferometry[1]. In a neutron interferometer [7] the coherence length isa function of the quality of the single crystal, the momen-tum distribution of the incoming neutron beam, and avariety of environmental contributions including tempera-ture gradients and vibrations. Generally three coherentlengths are identified [8], the transverse coherence length,the vertical, and the longitudinal (see Fig. 1). Here weexplore the vertical component in a system where thecoherence length is primary limited by the incomingbeam characteristics: the coherence length is limited byHeisenberg’s uncertainty relation lc � 1=�2�k�, where �kis momentum spread. To understand this limit we study the
contrast associated with a wave packet composed from anincident distribution of plane waves corresponding to adistribution of neutron momenta in the vertical direction.The measurement of the coherent length is a direct mea-surement of the spatial extent of this wave packet. Notethat the observed high contrast with a beam size of severalmm indicates that any irregularities in the interferometercrystal have a small and weak influence on the coherencelength. In the previous measurements of the coherencefunction [8] in a low coherence regime the coherence couldbe partially recovered by postselection methods. In ourmeasurement we will not need to rely on postselection.The coherence (lc) will be revealed by a simple projectivemeasurement.
Experiment.—Neutron interferometery is a practical ex-ample of macroscopic quantum coherence [9]. We willdescribe this via a neutron wave function over a Mach-Zehnder interferometer. At the first blade the neutrons aresplit by Bragg scattering into two paths. The neutron wavefunction is jpath;pi, where a neutron with momentum pspans path I and path II (Fig. 1). The phases that theneutron accumulates over each path are experimentallycontrolled via rotation of the phase flag (Fig. 1).
The measurements were made at the Neutron Inter-ferometer and Optical Facility (NIOF) at the NationalInstitute of Standards and Technology [10]. It consists ofa perfect Si-crystal neutron interferometer shown in Fig. 1with high phase contrast (>80%). The existing interfer-ometer was machined from a silicon single crystal ingotand operates on a cold neutron beam (E � 11:1 meV, � �0:271 nm). Detailed descriptions of the facility can befound in Refs. [7,11].
Special care needs to be taken to increase the coherencelength. We need high phase stability and high intensity tolimit the total measurement time. The phase stability isinfluenced by environmental noise such as vibrations,acoustic noise, and temperature fluctuations. The NIOFat NIST has very good isolation from vibrations and
PRL 100, 250404 (2008) P H Y S I C A L R E V I E W L E T T E R S week ending27 JUNE 2008
0031-9007=08=100(25)=250404(4) 250404-1 © 2008 The American Physical Society
acoustic noise [10]. In order to increase the phase stabilityover a longer period of time care was taken to control boththe temperature and temperature gradients within the in-terferometer enclosure. Even a temperature gradient assmall as 1 mK over 10 cm will shift interferometer bladesby a few angstroms with respect to each other and result ina large phase change. The interferometer is housed in analuminum enclosure and all heat sources (i.e. motors) areplaced outside this enclosure. We installed two PT-100calibrated thermometers in the enclosure (one in closevicinity of the neutron interferometer) to monitor boththe absolute temperature and the gradient. A set of heaterswere installed to set the temperature to near room tem-perature. Using a PID temperature controller we were ableto maintain the temperature of the enclosure to within5 mK, this dramatically improved the phase stability ofour system.
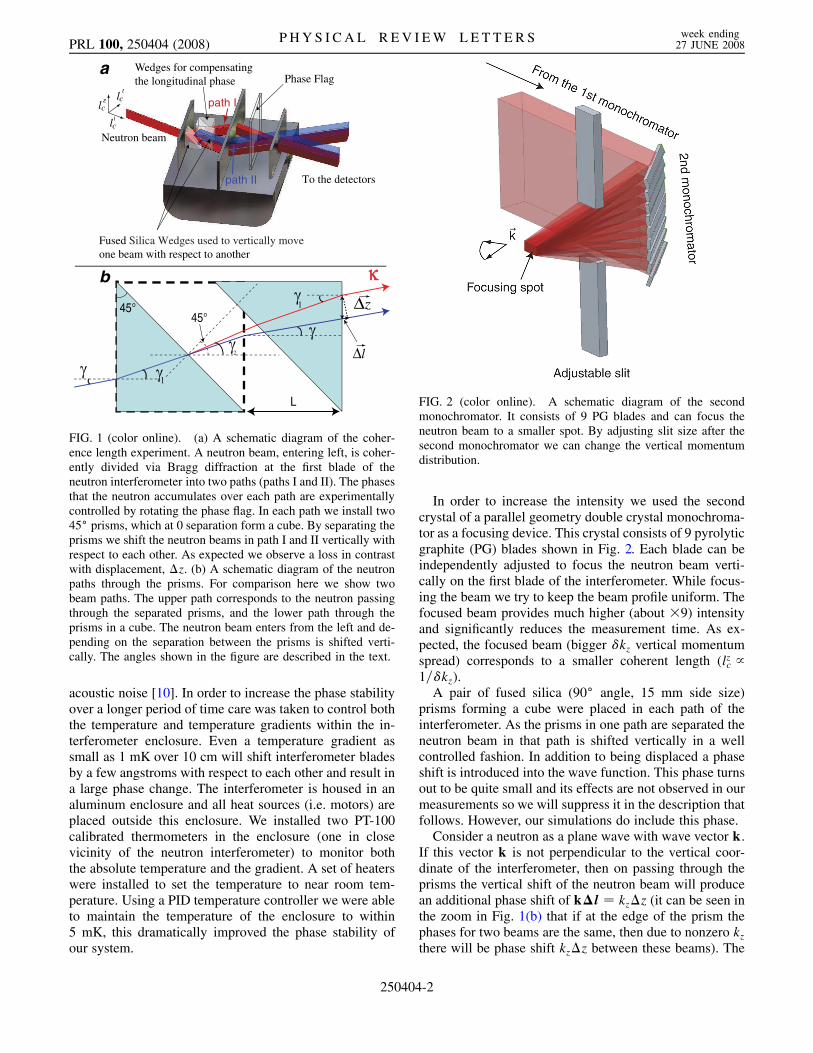
In order to increase the intensity we used the secondcrystal of a parallel geometry double crystal monochroma-tor as a focusing device. This crystal consists of 9 pyrolyticgraphite (PG) blades shown in Fig. 2. Each blade can beindependently adjusted to focus the neutron beam verti-cally on the first blade of the interferometer. While focus-ing the beam we try to keep the beam profile uniform. Thefocused beam provides much higher (about �9) intensityand significantly reduces the measurement time. As ex-pected, the focused beam (bigger �kz vertical momentumspread) corresponds to a smaller coherent length (lzc /1=�kz).
A pair of fused silica (90� angle, 15 mm side size)prisms forming a cube were placed in each path of theinterferometer. As the prisms in one path are separated theneutron beam in that path is shifted vertically in a wellcontrolled fashion. In addition to being displaced a phaseshift is introduced into the wave function. This phase turnsout to be quite small and its effects are not observed in ourmeasurements so we will suppress it in the description thatfollows. However, our simulations do include this phase.
Consider a neutron as a plane wave with wave vector k.If this vector k is not perpendicular to the vertical coor-dinate of the interferometer, then on passing through theprisms the vertical shift of the neutron beam will producean additional phase shift of k�l � kz�z (it can be seen inthe zoom in Fig. 1(b) that if at the edge of the prism thephases for two beams are the same, then due to nonzero kzthere will be phase shift kz�z between these beams). The
FIG. 2 (color online). A schematic diagram of the secondmonochromator. It consists of 9 PG blades and can focus theneutron beam to a smaller spot. By adjusting slit size after thesecond monochromator we can change the vertical momentumdistribution.
Fused Silica Wedges used to vertically moveone beam with respect to another
Phase Flag
Neutron beam
To the detectors
Wedges for compensatingthe longitudinal phase
2
∆z
1
45°
L
45°1
a
b
path I
path II
l
l
lcc
c
∆l
z
t
l
FIG. 1 (color online). (a) A schematic diagram of the coher-ence length experiment. A neutron beam, entering left, is coher-ently divided via Bragg diffraction at the first blade of theneutron interferometer into two paths (paths I and II). The phasesthat the neutron accumulates over each path are experimentallycontrolled by rotating the phase flag. In each path we install two45� prisms, which at 0 separation form a cube. By separating theprisms we shift the neutron beams in path I and II vertically withrespect to each other. As expected we observe a loss in contrastwith displacement, �z. (b) A schematic diagram of the neutronpaths through the prisms. For comparison here we show twobeam paths. The upper path corresponds to the neutron passingthrough the separated prisms, and the lower path through theprisms in a cube. The neutron beam enters from the left and de-pending on the separation between the prisms is shifted verti-cally. The angles shown in the figure are described in the text.
PRL 100, 250404 (2008) P H Y S I C A L R E V I E W L E T T E R S week ending27 JUNE 2008
250404-2
wave function of a neutron over the interferometer is
� � eikrei�1C1jIi � eik�r��z�ei�2C2jIIi; (1)
where �1 and �2 are the phases over path I and path II inthe absence of the prisms. The coefficients C1 and C2 areparameters of the neutron interferometer that account forthe attenuation and scattering losses of the neutron beamdue to interferometer crystal.
The vertical shift from the prisms is well described byintroducing the index of refraction of the neutron
n �Kinside
k0� 1� �2 Nbc
2�; (2)
where bc is the coherent scattering length, N is the atomdensity, Kinside is the wave vector of the neutron inside theprisms, k0 is the wave vector of the incident neutron and wehave ignored the reactive cross section. The vertical beamshift due to the sets of prisms is
�z � �zm�1� tan�1� � L tan�; (3)
where �zm � L cos45� sin�2= sin�45� � �2� �L tan�2=�1� tan�2� is the vertical shift of the neutronbeam in between the prisms in path II. Because tan� �kz=k and tan�1 � kz=�nk� we can rewrite �z for smallangles as
�z � L�n�1� 2
kzk
�: (4)
The measured contrast originates from the constructiveinterference of the two paths as described by the projectionoperator for the O beam
PO �12�jIi � jIIi��hIj � hIIj�: (5)
The intensity in the direct beam direction is
IO � h�jPOj�i: (6)
For an incoherent sum of plane waves, the intensity on thedetector is
IO��0��Z��kz�h�jPOj�idkz
�Z��kz�
�1
2�C2
1�C22�
�C1C2 cos��0�kz�z��dkz; (7)
where ��kz� is the neutron vertical momentum distribution.The contrast is contained in the second term of the integraland the loss of contrast is a result of averaging over themomentum distribution.
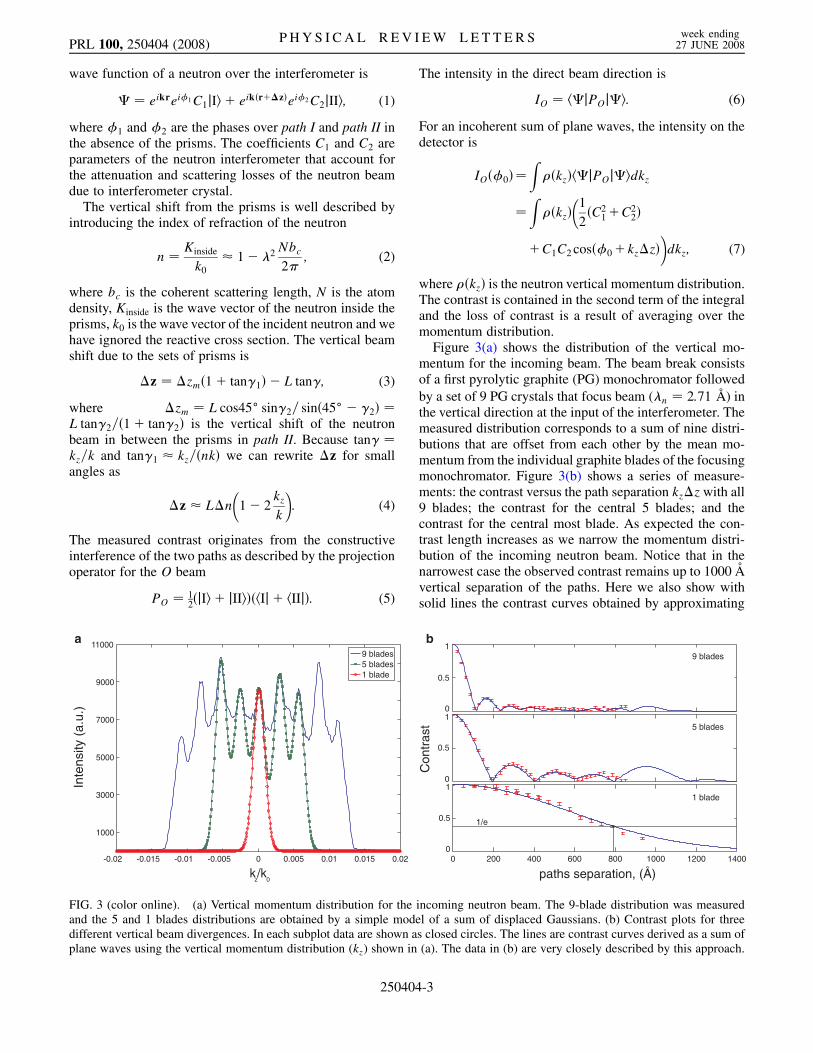
Figure 3(a) shows the distribution of the vertical mo-mentum for the incoming beam. The beam break consistsof a first pyrolytic graphite (PG) monochromator followedby a set of 9 PG crystals that focus beam (�n � 2:71 �A) inthe vertical direction at the input of the interferometer. Themeasured distribution corresponds to a sum of nine distri-butions that are offset from each other by the mean mo-mentum from the individual graphite blades of the focusingmonochromator. Figure 3(b) shows a series of measure-ments: the contrast versus the path separation kz�zwith all9 blades; the contrast for the central 5 blades; and thecontrast for the central most blade. As expected the con-trast length increases as we narrow the momentum distri-bution of the incoming neutron beam. Notice that in thenarrowest case the observed contrast remains up to 1000 Avertical separation of the paths. Here we also show withsolid lines the contrast curves obtained by approximating
0
0.5
1
0
0.5
1
Con
tras
t
0 200 400 600 800 1000 1200 14000
0.5
1
paths separation, (Å)-0.02 -0.015 -0.01 -0.005 0 0.005 0.01 0.015 0.02
1000
3000
5000
7000
9000
11000
kz/k
0
Inte
nsity
(a.
u.)
9 blades5 blades1 blade
ba
1/e
1 blade
9 blades
5 blades
FIG. 3 (color online). (a) Vertical momentum distribution for the incoming neutron beam. The 9-blade distribution was measuredand the 5 and 1 blades distributions are obtained by a simple model of a sum of displaced Gaussians. (b) Contrast plots for threedifferent vertical beam divergences. In each subplot data are shown as closed circles. The lines are contrast curves derived as a sum ofplane waves using the vertical momentum distribution (kz) shown in (a). The data in (b) are very closely described by this approach.
PRL 100, 250404 (2008) P H Y S I C A L R E V I E W L E T T E R S week ending27 JUNE 2008
250404-3
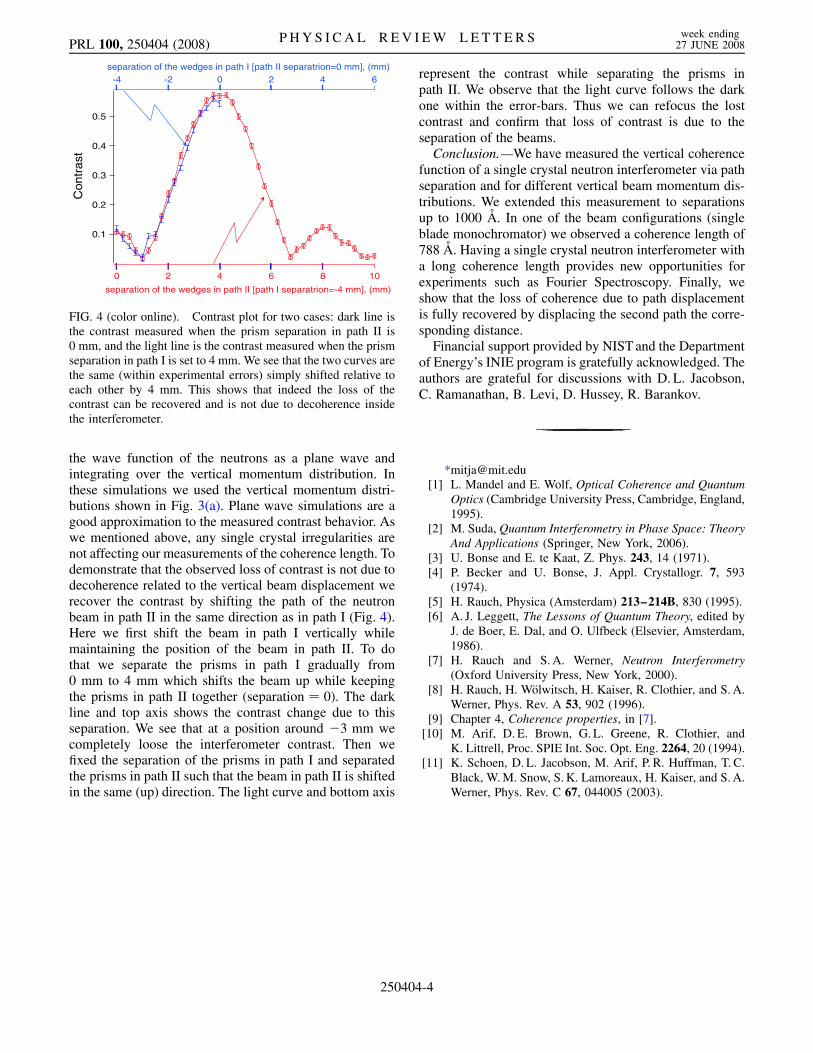
the wave function of the neutrons as a plane wave andintegrating over the vertical momentum distribution. Inthese simulations we used the vertical momentum distri-butions shown in Fig. 3(a). Plane wave simulations are agood approximation to the measured contrast behavior. Aswe mentioned above, any single crystal irregularities arenot affecting our measurements of the coherence length. Todemonstrate that the observed loss of contrast is not due todecoherence related to the vertical beam displacement werecover the contrast by shifting the path of the neutronbeam in path II in the same direction as in path I (Fig. 4).Here we first shift the beam in path I vertically whilemaintaining the position of the beam in path II. To dothat we separate the prisms in path I gradually from0 mm to 4 mm which shifts the beam up while keepingthe prisms in path II together (separation � 0). The darkline and top axis shows the contrast change due to thisseparation. We see that at a position around �3 mm wecompletely loose the interferometer contrast. Then wefixed the separation of the prisms in path I and separatedthe prisms in path II such that the beam in path II is shiftedin the same (up) direction. The light curve and bottom axis
represent the contrast while separating the prisms inpath II. We observe that the light curve follows the darkone within the error-bars. Thus we can refocus the lostcontrast and confirm that loss of contrast is due to theseparation of the beams.
Conclusion.—We have measured the vertical coherencefunction of a single crystal neutron interferometer via pathseparation and for different vertical beam momentum dis-tributions. We extended this measurement to separationsup to 1000 A. In one of the beam configurations (singleblade monochromator) we observed a coherence length of788 A. Having a single crystal neutron interferometer witha long coherence length provides new opportunities forexperiments such as Fourier Spectroscopy. Finally, weshow that the loss of coherence due to path displacementis fully recovered by displacing the second path the corre-sponding distance.
Financial support provided by NIST and the Departmentof Energy’s INIE program is gratefully acknowledged. Theauthors are grateful for discussions with D. L. Jacobson,C. Ramanathan, B. Levi, D. Hussey, R. Barankov.
*[email protected][1] L. Mandel and E. Wolf, Optical Coherence and Quantum
Optics (Cambridge University Press, Cambridge, England,1995).
[2] M. Suda, Quantum Interferometry in Phase Space: TheoryAnd Applications (Springer, New York, 2006).
[3] U. Bonse and E. te Kaat, Z. Phys. 243, 14 (1971).[4] P. Becker and U. Bonse, J. Appl. Crystallogr. 7, 593
(1974).[5] H. Rauch, Physica (Amsterdam) 213–214B, 830 (1995).[6] A. J. Leggett, The Lessons of Quantum Theory, edited by
J. de Boer, E. Dal, and O. Ulfbeck (Elsevier, Amsterdam,1986).
[7] H. Rauch and S. A. Werner, Neutron Interferometry(Oxford University Press, New York, 2000).
[8] H. Rauch, H. Wolwitsch, H. Kaiser, R. Clothier, and S. A.Werner, Phys. Rev. A 53, 902 (1996).
[9] Chapter 4, Coherence properties, in [7].[10] M. Arif, D. E. Brown, G. L. Greene, R. Clothier, and
K. Littrell, Proc. SPIE Int. Soc. Opt. Eng. 2264, 20 (1994).[11] K. Schoen, D. L. Jacobson, M. Arif, P. R. Huffman, T. C.
Black, W. M. Snow, S. K. Lamoreaux, H. Kaiser, and S. A.Werner, Phys. Rev. C 67, 044005 (2003).
0.5
0.4
0.3
0.2
0.1
Co
ntr
ast
1086420
separation of the wedges in path II [path I separatrion=-4 mm], (mm)
6420-2-4separation of the wedges in path I [path II separatrion=0 mm], (mm)
FIG. 4 (color online). Contrast plot for two cases: dark line isthe contrast measured when the prism separation in path II is0 mm, and the light line is the contrast measured when the prismseparation in path I is set to 4 mm. We see that the two curves arethe same (within experimental errors) simply shifted relative toeach other by 4 mm. This shows that indeed the loss of thecontrast can be recovered and is not due to decoherence insidethe interferometer.
PRL 100, 250404 (2008) P H Y S I C A L R E V I E W L E T T E R S week ending27 JUNE 2008
250404-4