measurement of the strain field near a crack tip in polymethylmethacrylate by holographic...
TRANSCRIPT

Measurement of the Strain Field Near a Crack Tip in Polymethylmethacrylate by Holographic Interferometry
Real-time holographic interferometry is used to determine the averaged transverse-strain field in the vicinity of a sharp crack using strip specimens of transparent plastic loaded in tension
by T. D. Dudderar and R. O'Regan
A B S T R A C T ~ A n experimental method has been developed for the detai led, real-t ime study of the strain f ield near a crack t ip in any transparent material. This method combines holography and interferometry to measure the f ield of averaged transverse strain in a sheet specimen under in- plane loading.
It is shown that the solution for an edge crack in ca semi- inf ini te sheet based on two-dimensional l inear elastic theory can be appl ied to the f in i te-width polymethy lmethacry late specimen. This solution is observed to become less val id as the crack t ip is approached due to the breakdown of the plane-stress assumption. This effect is evaluated for a range of thicknesses from much less to much more than the crack length.
List of Symbols a = ha l f -c rack length (in.) b ---- half width of specimen (in.)
Dx = length of scattering zone along the crack line (in.)
N = f r inge order N~ ---- fr inge order remote from crack tip
Ncr= fr inge order at the crack line for the max i - m u m scat ter ing-zone radius
P = fract ional deviat ion between the analytical and the actual fr inge counts
r = distance f rom crack tip (in.) re = distance f rom crack tip at which order de-
viates from that predicted by plane-stress theory (in.)
t = thickness of specimen (in.) Z1 = complex stress function for solution to the
problem of an infinite plate wi th an array of uni formly spaced cracks loaded in biaxial tension
ez ----- average t ransverse strain ~ = t ransverse strain remote from crack tip
= complex spatial argument , x + iy (~) ---- correction function for effect of free edge
Introduction The major i ty of failures of mechanical components occur at loads somewhat below those associated with general yielding. Whether by continuous loading or
T. D. Dudderar and R. O'Regan are associated with Bell Telephone Laboratories, Inc., Murray Hill, N. J. 07974 and "Whtppany, N. J. 07981, respectively. Paper was presented at 1970 SESA Spring Meeting held in Hunts- ville, Ala., on May 19-22.
fatigue, they usual ly fal l into the ca tegory of fa i lure by fracture. The developing technology of f rac ture mechanics is in tended to provide a quant i ta t ive aid to mechanical design against fracture. The cur ren t invest igat ion is part of a cont inuing program to ex- ploit the technique of holographic in t e r fe romet ry to invest igate and extend the fundamenta l concepts which under l ie f rac ture mechanics.
In holographic in te r fe rometry , 1-~ a re fe rence beam which i l luminates a proper ly prepared photographic plate, or hologram, reconstructs a wavef ron t which existed at the t ime the plate was ' exposed . The re - constructed wavef ron t can be the superposit ion of two near ly identical wavef ron ts which existed at different times, or the reconst ructed wavef ron t can be used as an optical replica to in ter fere wi th an existing sl ightly per turbed wavefront . In te r fe rence fr inges occur w h e n e v e r there is a phase difference be tween the two wavef ron ts of 180 d e g - - i n the la t ter case these fringes are seen in real t ime.
In f rac ture mechanics, the fundamenta l concept is that fai lure is associated wi th the existence of flaws or stress concentrat ions in a material . In the wors t case of an elastic mater ia l wi th an ideally sharp flaw, fa i lure is associated wi th a cri t ical va lue of the parameter , K, cal led the s t ress- intensi ty factor. 4 This parameter arises f rom the solution for the stress-field equations and is of the form
K ~ ~ / ~ , (1)
where ~| is the remote-f ie ld stress and a is the hal f - crack length. (For a crack in an infinite sheet loaded
in tension normal to the crack line, K ----- a~A/~a). The cri t ical vaIue of K at fracture, name ly Ke, is a s ignif- icant mater ia l property, l ike the yield stress or the elastic modulus.
A large number of two-d imens iona l analyt ical solutions for K has been developed for var ious load- ing modes and geometries for an ideal l inear-e las t ic material . 5 However , most real mater ia ls do not behave in this way. Depar tures f rom this theore t ica l behavior are of interest as they involve real (non- linear, ineIastic and inhomogeneous) mate r ia l be - havior. Such behavior par t ia l ly determines the actual f rac ture toughness of the material . Simultaneously, th ree-d imens iona l considerations also act to a l ter the
Experimental Mechanics I 49
stress field from that predicted by the two-d imen- sional theory, especially in regions of high stress gradient. Since a sharp-crack- t ip region represents the worst case, such effects are of considerable im- portance in a n y study of crack-tip stress phenomena. In the present investigation, these effects are ob- served and studied by holographic in terferometry using cast polymethylmethacryla te (PMMA) as a test material .
This polymer was chosen for several reasons: 1. It is a widely used s tructural plastic whose
fracture behavior is of general interest. 2. Its consti tut ive behavior is known and it can be
used effectively to model a l inear elastic mater ia l for loadings on the t ime scale chosen.
3. Its Poisson's ratio of 0.35 is close to that of many engineer ing materials. Therefore, a quant i ta - tive evaluat ion of thickness effects can be applied general ly to model l inear-elast ic behavior of such other materials.
4. Its t ransparency makes it ideal for transmission holographic interferometry.
Because of these characteristics, experiments with PMMA provide a comparison between the actual be- havior of a rea l - l inear-e las t ic mater ial and the two- dimensional solution developed from l inear-elast ic theory.
Laser holographic interferometry was chosen as an exper imental technique in order to take advantage of its inheren t ly high resolution and sensi t ivi ty and its abil i ty to give full-field information. For this par- t icular experiment, the region of greatest interest lies immediate ly in front of the crack tip and along the crack line where the principal stresses are equal to each other. Consequently, the classical photo- elastic technique, which is sensitive to the difference between principal stresses, gives little useful infor- mation.
Experiment In holography, s tanding waves are formed by the
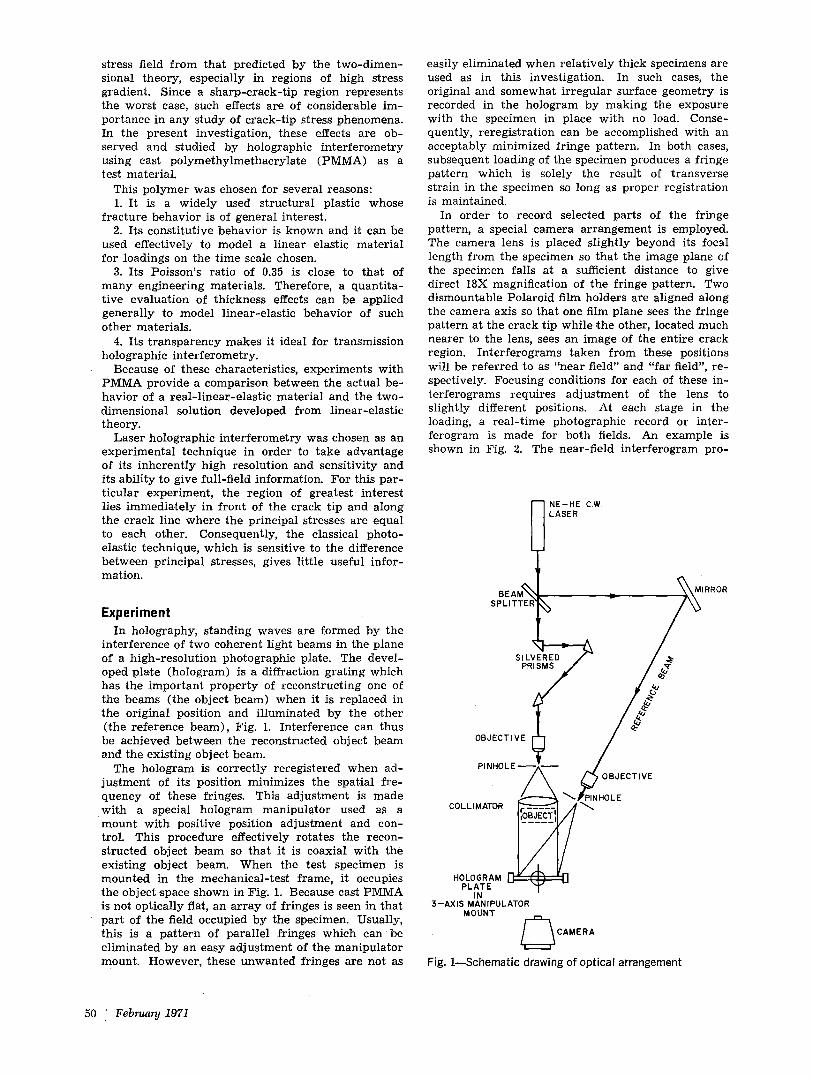
interference of two coherent light beams in the plane of a h igh-resolut ion photographic plate. The devel- oped plate (hologram) is a diffraction grat ing which has the impor tant proper ty of reconstruct ing one of the beams (the object beam) when it is replaced in the original position and i l luminated by the other (the reference beam), Fig. 1. Interference can thus be achieved between the reconstructed object beam and the existing object beam.
The hologram is correctly reregistered when ad- jus tment of its position minimizes the spatial fre- quency of these fringes. This adjus tment is made with a special hologram manipula tor used as a mount with positive position adjustment and con- trol. This procedure effectively rotates the recon- structed object beam so that it is coaxial with the existing object beam. When the test specimen is mounted in the mechanical- tes t frame, it occupies the object space shown in Fig. 1. Because cast PMMA is not optically flat, an a r ray of fringes is seen in that part of the field occupied by the specimen. Usually, this is a pa t te rn of paral lel fringes which can be el iminated by an easy adjus tment of the manipula tor mount. However, these unwanted fringes are not as
easily e l iminated when rela t ively thick specimens are used as in this investigation. In such cases, the original and somewhat i r regular surface geometry is recorded in the hologram by making the exposure with the specimen in place with no load. Conse- quently, reregistrat ion can be accomplished with an acceptably minimized fr inge pattern. In both cases, subsequent loading of the specimen produces a fringe pat tern which is solely the result of transverse strain in the specimen so long as proper registration is maintained.
In order to record selected parts of the fringe pattern, a special camera a r rangement is employed. The camera lens is placed sl ightly beyond its focal length from the specimen so that the image plane of the specimen falls at a sufficient distance to give direct 18X magnification of the fringe pattern. Two dismountable Polaroid film holders are aligned along the camera axis so that one film plane sees the fringe pat tern at the crack tip while the other, located much nearer to the lens, sees an image of the entire crack region. Interferograms taken from these positions will be referred to as "near field" and "far field", re- spectively. Focusing conditions for each of these in- terferograms requires ad jus tment of the lens to slightly different positions. At each stage in the loading, a rea l - t ime photographic record or in ter - ferogram is made for both fields. An example is shown in Fig. 2. The near-f ield interferogram pro-
I NE-HE C.W. ,ASER
BEAM~ I~ ~--~MIRROR SP',TTE, /%
s,,VEl EO'- ,fl
/_% OBJECTIVE [~
COLLIIII!IL E ~ ~IN ::~ EcTIvE
.oto%AM r;.." IN 3-AXIS MANIPULATOR MOUNT
--~CAMERA
Fig. i--Schematic drawing of optical arrangement
50 I February 1971

vides a detailed record of the behavior of the speci- men at the crack t ip while the far-field interferogram covers enough of the remote field to establish fringe order. This method gives quant i ta t ive results 50 times closer to the crack tip than the photoelastic- coating method used by Fessler and Wilson. 6
Rectangular-sheet specimens, 10-in. high and 2- in. wide, were made with five thicknesses ranging from 0.027 in. to 0.5 in. All were double-side cracked at mid-height by machining and wedging with a razor blade to produce 0.2-in.-long cracks with sharp tips. This gave a c rack- length- to-spec imen-width ratio, a/b, of approximately 0.2 and a specimen-thick- ness- to-crack- length ratio, t/a, of approximately 0.12 to 2.5. A uniform tensile stress was applied normal to the crack l ine by a dead-weight testing frame. Known weights were applied at regular intervals to obtain an effective loading rate of 1000 psi /hr . Ex- tension of the specimens between grips was moni - tored with an optical tracker and found to be l inear with load up to fracture. In addition, no residual fringes were observed in the fractured specimen. Hence, the specimen behavior is considered to be l inear ly elastic under conditions of the present ex- periment.
Because of the great thickness of some of the speci-
mens, surface details were out of focus when the fringes were photographed for the interferogram. Consequently, a separate photograph was made with the camera focused on the near surface with no load in order to record surface details needed to establish scale and position.
Data Reduction The data were taken from the interferograms by
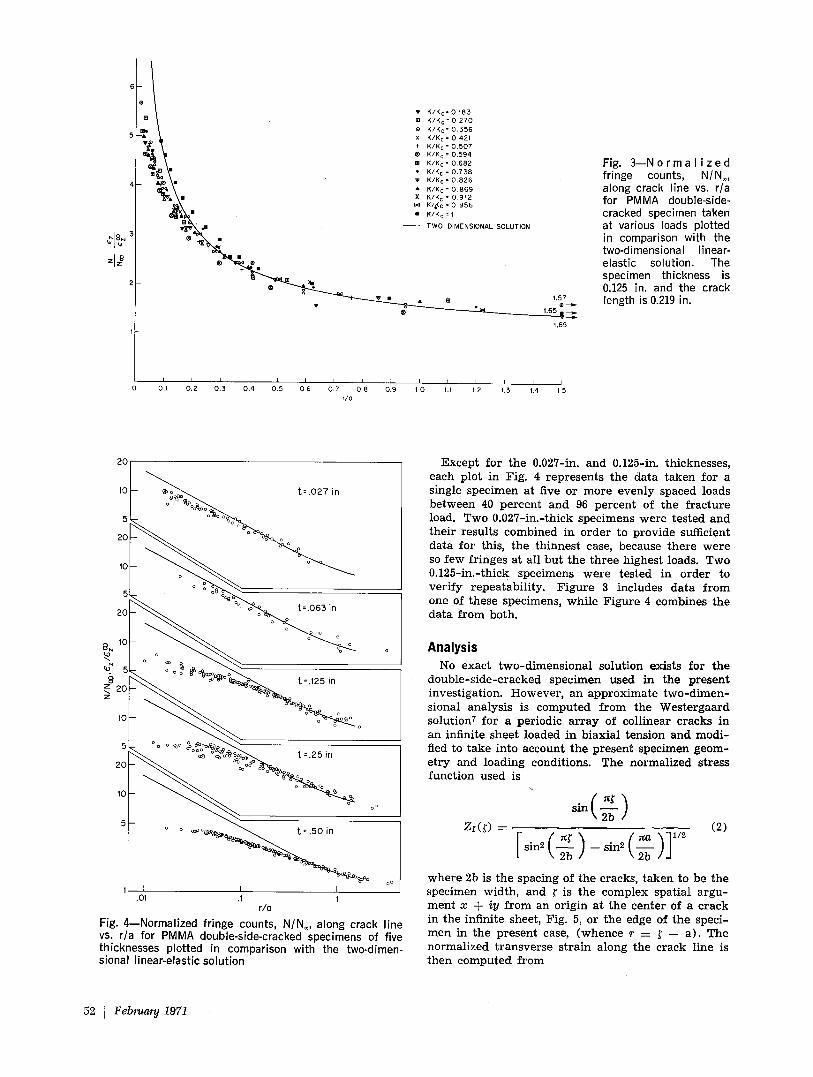
not ing the fr inge count N at each posi~tion r where the fr inge pat tern intercepts the crack line. The position coordinate r was normalized by dividing it by the crack length a, and the fr inge count N was normalized by dividing it by the far-field fr inge count N~ at the appropriate load. Figure 3 shows these data plotted on a l inear scale for a typical specimen of 0.125-in. thickness. Log-log plots of all the data reduced are shown in Fig. 4 with separated vert ical scales for each thickness tested. For com- parison, a curve is shown wi th each data plot which represents the normalized t ransverse s t ra in computed from the two-dimensional solution around a crack at the edge of a semi-infini te sheet of l inear elastic mater ia l loaded in tension. A brief discussion of this solution wil l be given in the next section.
Fig. 2--Near- and far-field interfero- grams of crack region in a double-side- cracked specimen of PMMA at 96 per- cent of the fracture load, a thickness of 0.125 in. and a crack length of 0.219 in. The near/far-field scale ratio is 11:1
Experimental Mechanics I 51
=1#
�9 K / K c : 0 . 1 8 3 B K / K c = 0 2 7 0 | K / K c : 0 . 3 5 6 x K /K c : 0 421 + K / K c = 0 . 5 0 7 | K /K c = 0 . 5 9 4 m K /Kc = 0 . 6 8 2 �9 K /K c = 0 . 7 3 8 v K /K c = 0 . 8 2 6 �9 K /Kc = 0 . 8 6 9 Z K /K c = 0 9 1 2
K/oKc = 0 9 5 6 �9 K /K c =
- - TWO-DIMENSIONAL SOLUTION
1,57 |
1.69
Fig. 3 - - N o r m a l i z e d fringe counts, NINe, along crack line vs. r/a for PMMA double-side- cracked specimen taken at various loads plotted in comparison with the two-dimensional linear- elastic solution. The specimen thickness is 0.125 in. and the crack length is 0.219 in.
I I I 0.1 012 013 I 015 016 0 .7 0 .4 018 01.9 1 I0 1.1
r /0
I I I I 12 1.3 1.4 15
2 0
5
, 0 2 7 i n
10 o o
2 2 ~ - . ~ v ~ t=.063 in
o o ~ o o
t, = . 1 2 5 i n
,el_ 5 ~ $ ~ o ~ t:.25in
o ~o oo~O
2 0
o I
~o i I I
.01 .1 1 r/o
Fig. 4---Normalized fringe counts, NINe, along crack line vs. r/a for PMMA double-side-cracked specimens of five thicknesses plotted in comparison with the two-dimen- sional linear-elastic solution
Except for the 0.027-in. and 0.125-in. thicknesses, each plot in Fig. 4 r epresen t s the da ta t aken for a single spec imen at five or more evenly spaced loads be tween 40 percen t and 96 percen t of the f rac ture load. Two 0.027-in.-thick specimens were tes ted and the i r resul ts combined in o rde r to provide sufficient da ta for this, the th innes t case, because the re were so few fr inges at all but the th ree highest loads. Two 0.125-in.-thick specimens were tes ted in order to ver i fy repea tab i l i ty . F igu re 3 includes da ta f rom one of these specimens, whi le F igure 4 combines the da ta f rom both.
Analysis No exact two-d imens iona l solution exists for the
doub le - s ide -c racked specimen used in the presen t investigation. However , an approx ima te tw o-d imen- sional analysis is computed f rom the Wes te rgaa rd solution 7 for a per iodic a r r a y of col l inear cracks in an infinite sheet loaded in b iax ia l tension and modi - fied to t ake into account the presen t specimen geom- e t ry and loading conditions. The normal ized stress funct ion used is
X2b / ZI(~) = (2)
_ rsin2 ( rt~ ) sin 2 L \ 2b \ - ~ - / J
where 2b is the spacing of the cracks, t aken to be the specimen width, and ~ is the complex spat ia l a rgu- ment x 4- iy f rom an or igin at the center of a c rack in the infinite sheet, Fig. 5, or the edge of the speci- men in the present case, (whence r = ~ -- a) . The normal ized t r ansverse s t ra in along the crack l ine is then computed f rom
52 I February 1971

Fig. 5--Geometry and coordinate system for a periodic array of collinear cracks in an infinite sheet loaded in biaxial tension
l o"
- - j
o"
I. b _1.
a a 0 (]
b _ b
/
I b . I . b _1
o-
ez - - 2 R e Z I ( . O -- x(~) -- 1 (3)
whe re the first t e rm is der ived f rom the stress func- tion of eq (2) for coll inear cracks in an infinite sheet. The second te rm is a correction for the f ree edge based on the work of Bowie 8 and integrat ion of the classical Boussinesq solution to account for the distr ibuted load along the edge, and uni ty is subtracted to conver t f rom a state of biaxial tension to uniaxial tension normal to the crack.
The resul t ing solution represents an approximate two-dimensional solution for an edge crack wi th coll inear inter ior cracks in a semi-infini te sheet loaded in tension normal to the crack. This solution is a near ly exact two-dimens ional analysis near the crack tip and provides a comparison wi th the exper i - menta l f r inge-count data f rom which t h r ee -d imen- sional effects can be determined.
In order to compare the exper imenta l ly observed f r inge shapes wi th the two-d imens iona l analysis, it is not necessary to in terpre t the ra ther complicated complete solution described above. The general na ture of this solution can readi ly be seen by noting that solutions for all geometries lead to the same form 5 for the sum of the in-plane stresses near a crack tip, i.e., Cx q- Cy ---- 2K cos (e /2 ) / (2nr ) l /% For plane stress, the t ransverse strain field is given by
2uK cos (0/2) ez ----- - - , ( 4 )
E (2nr) t/2
where r and a are the spatial coordinates or iginat ing at the crack tip, Fig. 6, v and E are the elastic con- stants of the material , and K is the appropriate s t ress- intensi ty factor for the specimen geometry.
In transmission interferometry,* the relat ionship
o The intensity equation is g iven by
2~r ~ Dark fringes appear wherever I =- O. Consequent ly - - -
k E (~1 + ~ ) t = (2N + 1)r which yields eq (5) above.
(I - n)
I
X
Fig. 6--Geometry and coordinate sys- tem for crack in an infinite sheet as applied to a side crack in a semi- infinite sheet with the origin at the crack tip
between fr inge order and average t ransverse s train is
--k (2N q- 1) ,+; = ( 5 )
2 ( n - 1)t
where k is the wave leng th of the light, n is the index of refract ion of the mater ia l and t is its thickness. The effective index of refract ion is defined by
E n = n o - - A �9 - - where A is the stress-optic coefficient
y
E x p e a m e n t a l M e c h a n i c s I 53

and no is the index of refraction at no load. T h e locus of an interference fringe of order N in
the vicini ty of a crack tip obtained from eqs (4) and (5) is
( K )~ rN = C . cos 2 (0/2) (6)
2 N 4 - 1
8 [ v t ( n - - 1 ) ] ~ where C ---- - - Consequently, we
have a simple re la t ionship between the s t ress- inten- sity factor, K, and the near-f ie ld-fr inge pattern, eq (6), for each fringe defined by N = - -~=t (n- - 1 ) /L Such fringes, which represent loci of constant t rans- verse strain (or, when cz is small, the sum of in -p lane principal stresses) are usual ly called "isopachics."
D i s c u s s i o n
The coincidence of the normalized f r inge-count distr ibution over almost the complete range of load- ing, as shown in Fig. 3, indicates that the mater ia l behavior is l inear elastic throughout the field of ob- servation. This conclusion applies in the near field up to the crack tip to wi th in half of the resolving power of the technique, which is 5000 fringes per inch. (The only data which fail to superimpose are those associated with the max imum load, K / K e ----- 1. These data were taken from an interferogram ex- posed less than 20 sec before fracture when the crack tip was beginning to move.)
As Figs. 3 and 4 show, the data fit the two-d imen- sional theory, eq (3), quite consistently for large r /a but fall off as the crack tip is approached. Since the polymer behaves like a l inear-elast ic material , this departure from the predicted behavior must result from the effect of thickness and the associated de- par ture from the plane-stress assumption.
The f r inge-count sensit ivi ty [e.g. as in eq (5)] is defined in terms of an effective index of refraction in order to take into account two first-order cont r ibu- tions to the change in optical-path length which result in the formation of interference fringes. One is associated with the elastic properties of the speci- men mater ia l and the other with its stress-optic properties. The first is proport ional to the index of refraction times the change in specimen thickness due to the stress field represented by (~1 4- ~2). The second is proport ional to the specimen thickness times the change in the index of refraction due to the stress field. As a result, plane strain effectively re- duces but cannot completely el iminate f r inge-count sensit ivi ty by suppressing the thickness-change con-
TABLE 1--DEVIATION RANGE PER UNIT THICKNESS
Deviation Range
Normalized per Unit Thickness, Normalized Deviation Thickness,
t, in. Thickness, t/a Range, rda rc/t
0.027 0.129 0.13 1.0 0,063 0.306 0.24 0.78 0.125 0.570 0.24 0.43 0.250 1.13 0.20 0.18 0.500 2.55 0.34 0.13
Fig. 7--Experimental vs, theoretical interfero- gram fringe patterns for near-field crack region in PMMA at 96 percent of the fracture load
tr ibution. In fact, a hypothetical completely plane- s train exper iment using PMMA would exhibit about 32 percent of the f r inge-count sensit ivity to (~1 4- ~2) of a wholly plane-stress experiment.
At the same time, the shape of the fringes shown in Fig. 2 can be compared with the analysis for the isopachics, eqs (4) to (8). The cos z (0/2) shape of these isopachic fringes is observed throughout the entire load range. Similar ly shaped fringes have been observed in photoelastic studies of the isopachic pat tern around a crack tip conducted by PostP How- ever, the somewhat lower resolution of his technique limits observation of the fringe shapes in the near field. In Fig. 7, the isopachic-fringe pa t te rn predicted by eq (6) is plotted in a half field with the other half field devoted to the interferogram pat tern ( taken on a 0.125-in.-thick specimen at K / K c = 0.96) of Fig. 2 for comparison. Strong agreement can be seen in both fr inge shape and spacing, which is determined by the inverse squares of the ratios of the fringe orders. Both eq (6) and the complete solution pre- dict cusps on every fringe at the crack tip. Examina- t ion of Fig. 7 shows that the actual fringe cusps ap- pear fur ther and fur ther away from the crack tip as the fringe order decreases. The plane-stress solution indicates a s tep-funct ion change in thickness at the crack tip which the mater ia l cannot accommodate without spreading out. This three-dimensional con- s traint accounts for the observed distr ibution of the fr inge origins along the crack.
As seen in Figs. 3 and 4, the two-dimensional elastic solution and the exper imental data diverge as the crack tip is approached. At the same time, it is observed in Fig. 2 that the fringe field in the region
54 I February 1971

t
\ P VS r/a / - t=O,500in , t /a=2.55 / l " \ / ,-t=O.,25in,t/a=0.570 /
- ~~Tin,i,a-Oi'~ ~ P
~ o
I 7 PLANE STRESS [
I I I [ - . ~ i . i - .2 .s ,4
L I r/a
CRACK ~- '- LENGTH,o
Fig. 8~Fractional deviation, P, between the two-dimen- sional solution and a curve fitted to the experimental data vs. r/a plotted across thickness
behind the crack is distr ibuted along the crack in contrast to the concentrat ion predicted by the theory. Both of these phenomena are associated with the thickness effect which are not included in the two-dimensional theory. Theoretical analyses of such three-dimensional effects are quite difficult, and interest ing t reatments have been made by Har t ranf t and Sih 10 and, on a related problem, by Rhines. 11
In order to evaluate these effects, specimens with a thickness range from t /a of 0.129 to 2.55 were tested. In Fig. 4, the divergence can be seen to in- crease with thickness, t, which is consistent with a three-dimensional model. For purposes of compari- son, the radius at which a fitted data curve falls 5 percent below the normalized plane-stress solution is defined as the range, rc, of departure from plane stress. It can be seen from Table 1 that, in no case, does rc/t exceed uni ty; it is largest for the thinnest specimen and grows progressively smaller as the th ickness- to-crack- length ratio, t/a, is decreased. Consequently, it may be concluded that the effect of thickness on the val idi ty of the two-dimensional solution is not felt much beyond a distance of one thickness from the crack tip for the t /a range in- vestigated. As would be expected, decreasing t /a decreases rJa. However, this is not as effective in decreasing the three-dimensional effect as would be anticipated, because of the much faster increase in r J t due to the changing influence of the free edge.
With in the region of divergence, the th ree -d imen- sional effect produces a hydrostatic tensile com- ponent of stress which acts to decrease the observed fringe count by reducing the t ransverse strain in the interior of the specimen. Since the out-of-plane stress is always zero at the specimen surface, the stress state varies continuously from quasi-plane stress at the surface to something approaching plane strain at mid-thickness, The fractional deviation , P, between the actual behavior as represented by the fringe count and the plane-stress value at each r/a
may be taken as representat ive of the extent of the approach to plane s t rain in the inter ior of the speci- men. Figure 8 shows this schematically as a funct ion of r/a for three typical thicknesses in which the de- pendence on thickness and distance from the crack tip is clearly indicated. For i l lustrat ive purposes only, the shapes of these curves were established by dividing the difference between the plane-stress solution and least-squares fi t ted-data curves by 68 percent of the plane-stress solution, which is the difference between the hypothetical fr inge dis t r ibu- tions for plane stress and plane strain. This was then plotted as if the mater ia l were divided into two types of stress regions, one nearest the surfaces in plane stress and one interior in plane strain. In theory, P must approach uni ty because th ree -d imen- sional effects severely l imit the thickness change at the crack tip while the two-dimensional plane-stress solution requires that the thickness change at the crack tip equal the thickness itself. How near ly P equals one at r = 0 depends on the mater ia l ' s capac- i ty to strain before fracture, which for polymethyl - methacryla te is quite small. Therefore, the curves for all thicknesses in Fig. 8 should approach a full width at r/a = 0. However, because there are in- sufficient meaningfu l fr inge data inside r/a of 0.02, for most specimens the solid curves are te rmina ted at that point.
One of the factors l imit ing the extent of the mean- ingful data at the crack tip is the scattering zone which can be seen in Fig. 2. This zone appears after a significant amount of loading and grows to a maxi - mum size at fracture. The existence of such a zone is a l imita t ion on the ideal elastic behavior of the mater ia l if it is associated with crazing.
Kambour 12 associates crazing with the hydrostatic tensile component of stress and says "since stresses beyond the tip of a crack have a hydrostat ic tensile component, a plastic response here might wel l be a crazing one". He also reports that crazing is associ- ated with void formation and results in a change of the refract ive index from that of the bu lk polymer. These factors suggest that the scattering region is associated wi th crazing. Table 2 presents data on the effective length of the final scattering zone measured along the crack line for each specimen thickness in - vestigated, as well as the observed fr inge count per uni t thickness for crazing. It can be seen that the scattering region increases in size directly with specimen thickness and the accompanying increase in size of the region of th ree-d imens iona l stress, vc/a
TABLE 2--FRINGE COUNT PER UNIT THICKNESS FOR CRAZI NG
Associated Fringe Count
Normalized per Inch Thickness, Normalized Scattering-zone Thickness
t, in. Thickness, t/a Length, Dx/a Ner/t
0.027 0.129 - - - - 0.063 0.306 0.04 • 0.02 206 0.125 0.570 0.06 ___ 0.02 240 0.250 1.13 0.11 ___ 0.02 132 0.500 2.55 0.16 • 0.02 62
Experimental Mechanics 55

in Table 1. This is consistent with Kambour ' s hypo- thesis of a hydrostat ic stress cri terion for crazing.
The f r inge counts per uni t thickness for crazing presented in Table 2 can be compared wi th the value of 250 fr inges per inch thickness obtained in the tensile cal ibrat ion test.* It can be seen that the order of magni tude is reasonable, especially for the 0,063-in.- and 0.125-in.-thick specimens where the depar ture f rom plane stress is significantly smaller than for the thicker specimens, Figs. 4 and 8.
Since the stress becomes severe at the crack tip for all specimens, it is probable that some crazing occurs at the crack- t ip region in every case. Another factor re la ted to thickness must also be considered in as- sociating this behavior wi th scattering. The fur ther a scat ter ing point lies f rom the focal plane of the camera system, the greater its effect wil l be in the in terferogram. This acts directly to increase the scattering effect of crazing in the th icker specimens. Consequently, even if the occurrence of crazing were itself independent of the hydrostat ic or th ree -d imen- sional na ture of the stress field at the crack tip, its behavior as a scattering source (as seen in the in- te r ferograms) is not. Therefore, the scattering zone would still be expected to be larger in the th icker specimens--as was observed.
Two other phenomena might be expected to con- t r ibute to the appearance of an anomalous region at the crack tip. One would be associated wi th the finite aper ture of the optical system and excessive refrac- tion of the l ight due to the ve ry large local deforma- tion. In this case, a dark region wi th a smooth boundary would be seen at the crack tip. The other would be caused by inaccurate focusing, in which case a smooth envelope of discontinuous fringes would be seen. Both of these phenomena have been observed by the authors. In fact, an example of being sl ightly out-of- focus can be seen in the far - field in te r fe rogram shown in Fig. 2. However , the scat ter ing zone observed in this exper iment and discussed in terms of a mater ia l phenomenon is quite different f rom ei ther of the above. The boundary of the scat ter ing zone is ex t remely discontinuous and the fr inges which appear wi thin it are continuous with those outside it, as can be seen in the near-f ield in te r fe rogram of Fig. 2.
Sources of Experimental Error Errors in the present invest igat ion were caused by
an uncer ta in ty of about • 1/2 a f r inge for any in te r - ferogram. Therefore, the percentage er ror is larger for th inner specimens and l ighter loads. Another source of er ror was the difficulty in precisely locating the crack tip. When the in te r fe rogram is made, genera l ly ne i ther surface is in focus- -hence the tip cannot be clear ly observed. Also, even the best crack tips were somewhat irregular . This i r regular i ty was grea ter for the th icker specimens.
Summary and Conclusion Two factors, one geometr ical and one material ,
* Calibration of tensile samples taken from three specimens established the onset of visible crazing at a stress of 6900 • 400 psi and an aver- age fringe shift of about 250 per inch of specimen thickness.
play a role in explaining the deviat ion be tween the two-dimens ional or plane-stress theory and the actual mater ia l behavior. In the first case, the high strain gradients (in fact the two-dimensional theory demands an infinite discontinuity in t ransverse strain) near the crack tip assure a region of th ree- dimensional stress for all specimens of finite th ick- ness, and clear ly cannot be expected to be described by a simple, two-dimensional theory. The present invest igation establishes the ex ten t of this region and, in turn, the limits of applicabil i ty of the ele- men ta ry theory, Figs. 4 and 8.
The mater ia l behavior is essential ly l inear elastic to wel l wi thin the area of three-d imens ional stress where a scattering region indicates the presence of crazing at h igher loads 'and grea ter thicknesses. This second factor represents the l imit on the polymer 's capacity to behave as an ideal l inear-elast ic material .
The method of rea l - t ime holographic in te r fe rom- etry permit ted the use of cast po lymethylmeth- acrylate sheet to model a l inear-elast ic mater ia l without the requi red optical flatness necessary for convent ional in terferometry . Ini t ial fr inge pat terns associated wi th planar i r regular i t ies of the sheet could be e l iminated by use of the adjustable mount. Al ternat ively , nonplanar i r regular i t ies could be re- moved by exposing the hologram wi th the specimen in place at no load.
The high resolut ion attained wi th this method per- mi t ted examinat ion of the strain field an order of magni tude closer to the crack tip than any of the methods heretofore used by other experimenters. Measurements were made to wi th in 0.002 in. of the crack tip and fr inge densities of 2500 fringes per inch were observed.
A c k n o w l e d g m e n t s
The authors wish to express thei r appreciation to A. Zacharias for use of the He -Ne ~aser, to T. T. Wang for his helpful suggestions, to D. Gibson for his as- sistance in conducting the experiments , and to G. B. Fay for machining the specimens and test hardware.
R e f e r e n c e s
1. Hefllnger, L. 0. , Wuerker, R. F. and Brooks, l:l. E., "Holo- graphic Inter~erometry," Jnl. Appl. Phys., 37 (2), 642 (Feb. 1966).
2. Fouruey, M. E., "'Application of Holography to Photoelas- tlcity,'" EXPEI~XMENWaL ~ECX~aNXCS, 8 (1), 33"38 (Jan. 1968).
3. Dudderar, T. D., "'Applications of Holography to Fracture Mechanics," EXI'ERIMESTAL MECrtaNICS, 9 (6), 281-285 (lune 1969).
4. Irwin, G. R., "Fracture Mechanics," Structural Mechanics, Pergamon Press, New York, 557-592 (1960).
5. Paris, P. C. and Sih, G. C., "Stress Analysis of Cracks," Frac- ture Toughness Testing and Its Applications, ASTM Special Tech. Publ. No. 381 (1965).
6. Fessler, H. and Wilson, R. W. , "Strains Near Cracks in Aluminum Plates," Proc. 11th Intnatl. Cong. Appl. Mech., Munich, 603-611 (1966).
7. Westergaard, H. M., "'Bearing Pressures and Cracks," Trans. Am. Sac. Mech. Engr., Jnl. Appl. Mech., A49-A53 (1939).
8. Bowie, O. L., "'Rectangular Tensile Sheet with Symmetric Edge Cracks," Jnl. Appl. Mech., 31 (2), Set. E., 208-212 (1964).
9. Post, D., "'Photoelastie Stress Analysis for an Edge Crack in a Tensile Field," Proe. SESA, XII (1), 99-116 (May 1953),
10. Hartran#, R. J. and Sih, G. C., "'The Use of Eigenfunction Expansions in the General Solution of Three-Dimensional Crack Problems," ]nl. Math. and Mech., 19 (2), 123-135 (1969).
11. Rhines, W. J., "'An Extension of Generalized Plane Stress for Problems with Out-of-plane Restraint," EX~laXMENTaL wrECHANICS, 8 (11), 481-487 (Nov. 1968).
12. Kambour, R. P., "Mechanism of Fracture in Glassy Polymers. L Fracture Surfaces in Polymcthyl Methacrylate,'" Jnl. of Polymer Sei., 3, Part A, 1713-1724 (1965).
56 I F e b r u a r y 1971