measurement of running resistance by …€¦ · measurement of running resistance...
TRANSCRIPT
A.Müschen, E.Dewulf, P. Bailey, C.Hosier
MEASUREMENT OF RUNNING RESISTANCE BY
TORQUEMETER METHOD
� Measurement of Running Resistance
� Chassis-Dynamometer Setting
� Comparison Torquemeter Method / Coastdown Method
2 11/12/2012 Torquemeter-Coastdown_Comparison of Methods

TORQUEMETER METHOD
3 11/12/2012 Torquemeter-Coastdown_Comparison of Methods
• Torquemeter in the drive-train of test
vehicle to measure running
resistance
• Preferably: measure running
resistance at the rims of each of the
driven wheels
• Excluding effects of powertrain /
transmission / vehicle inertia during
measurement
• Instrumentation of vehicle w/o
affecting running resistance
(aerodynamic drag)– special set of rims and adapter rings
– signal transfer to data collection device,
preferably wireless
– difficult / time consuming
Wheel
Position of StrainGauges
TorquemeterMeasuring Device
Adapter
Brake Disc

MEASUREMENT OF RUNNING RESISTANCE - ROAD TESTING (1)
4 11/12/2012 Torquemeter-Coastdown_Comparison of Methods
Vehicle conditioning:
• Preconditioning and Stabilization of vehicle at the speed where the running
resistance is to be measured
Torque Measurement / Data Collection (ISO 10521-1):
• Record at least 10 data sets of speed/torque/time for min. 5 seconds, see table
• Calculate mean speed and torque
• Assess accuracy of measurement
• Repeat torque measurement on the track in both directions to have at least 4
consecutive results with sufficient accuracy
MEASUREMENT OF RUNNING RESISTANCE - ROAD TESTING (2)
5 11/12/2012 Torquemeter-Coastdown_Comparison of Methods
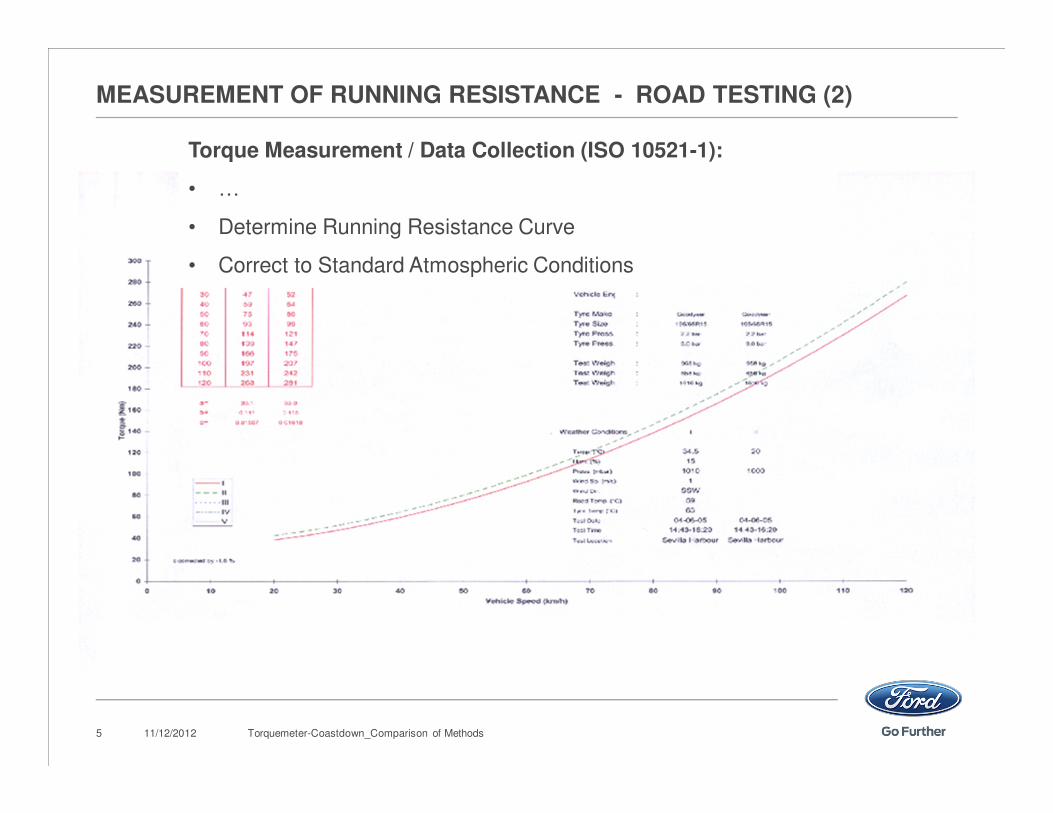
Torque Measurement / Data Collection (ISO 10521-1):
• …
• Determine Running Resistance Curve
• Correct to Standard Atmospheric Conditions
� Measurement of Running Resistance
� Chassis-Dynamometer Setting
� Comparison Torquemeter Method / Coastdown Method
6 11/12/2012 Torquemeter-Coastdown_Comparison of Methods

LOAD SETTING OF CHASSIS DYNAMOMETER (1)
7 11/12/2012 Torquemeter-Coastdown_Comparison of Methods
Wheel
Position of StrainGauges
TorquemeterMeasuring Device
Adapter
Brake DiscEvaluate Dyno Setting to provide same
torquemeter readings vs. speed
as measured on the road (“running resistance”)
• Vehicle is fitted with the same
instrumentation as on the road
• Preconditioning and Stabilization of vehicle
at the desired speed
� Dyno Adjustment / Data Collection:
• Record at least 10 data sets of
speed/torque/time for min. 5 seconds,
see table

LOAD SETTING OF CHASSIS DYNAMOMETER (2)
8 11/12/2012 Torquemeter-Coastdown_Comparison of Methods
Wheel
Position of StrainGauges
TorquemeterMeasuring Device
Adapter
Brake Disc� Dyno Adjustment / Data Collection:
• Calculate mean speed and torque
• Assess accuracy of measurement
• Repeat torque measurement to have
at least 4 consecutive results with
sufficient accuracy
• Determine Road Load Resistance Curve
• Verify road load setting,
error of simulated road load to be
< 10% up to 20km/h, < 5% up to 50 km/h,
< 3% else
• if required: Adjustment of dynamometer coefficients & new Iteration

Chassis dynamometer setting process – Verification
Vehicle, Dyno
Tyre
Details

� Measurement of Running Resistance
� Chassis-Dynamometer Setting
� Comparison Torquemeter Method / Coastdown Method
10 11/12/2012 Torquemeter-Coastdown_Comparison of Methods

ROAD LOAD COMPARISON C/D MATCH VS. TORQUEMETER METHOD (1)
11 11/12/2012 Torquemeter-Coastdown_Comparison of Methods
Road load comparison between the torque method and the coast down method
Tyre Rdyn. Weight IWC Track Torque (Nm) Dyno load (N) Coast Down Data derived from Dyno Settings ( sec )
a b c F0 F1 F2 125-115 115-105 105-95 95-85 85-75 75-65 65-55 55-45 45-35 35-25 25-15 TOTAL
(m) (kg) (kg) 120 110 100 90 80 70 60 50 40 30 20
235/50R18 0,336 1768 1810 62,0 0,091 0,01349 102,1 -0,015 0,0405 5,83 6,58 7,45 8,48 9,68 11,09 12,70 14,53 16,53 18,60 20,56 132,03
Tyre Rdyn. Weight IWC Track Coast Down Data ( sec )
125-115 115-105 105-95 95-85 85-75 75-65 65-55 55-45 45-35 35-25 25-15 TOTAL
(m) (kg) (kg) 120 110 100 90 80 70 60 50 40 30 20
235/50R18 0,336 1768 1810 5,77 6,53 7,40 8,44 9,64 11,07 12,70 14,54 16,56 18,64 20,60 131,89
Speed [km/h] 120 110 100 90 80 70 60 50 40 30 20
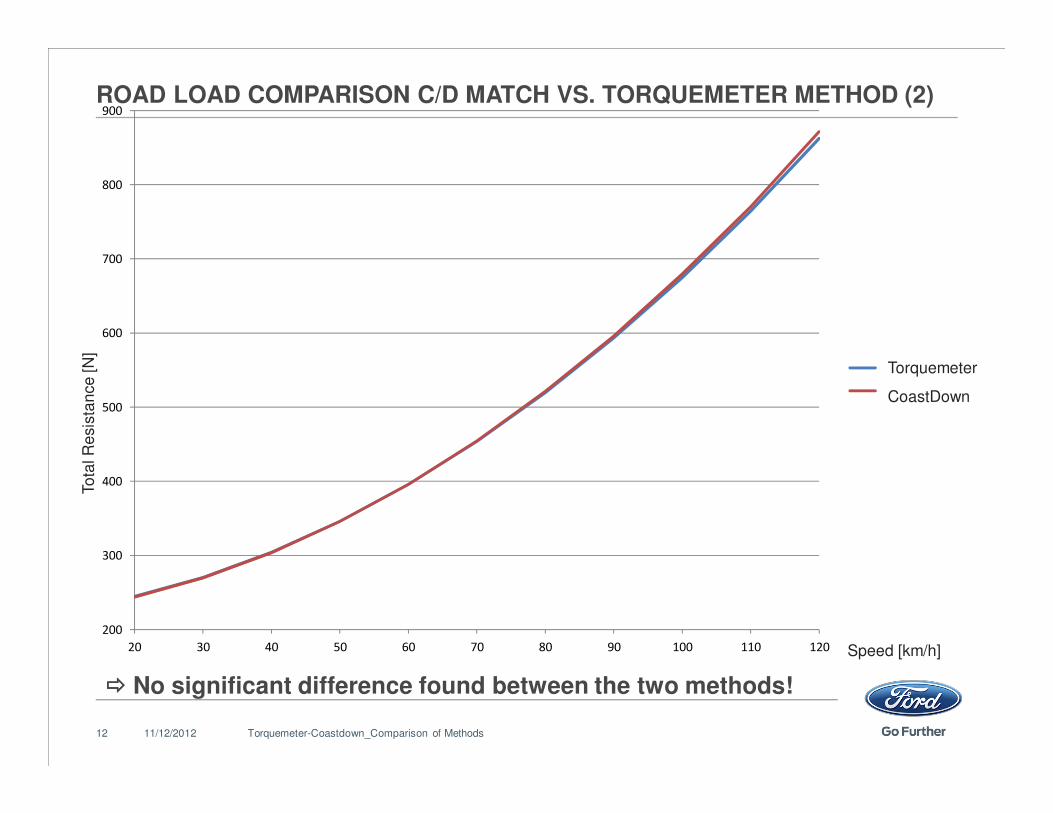
calc. Force, based on TorqueMeter Method, [N] 862,4 764,1 674,9 592,9 519,4 453,4 395,9 346,0 304,2 270,3 244,5
calc. Force, based on Track Coast Down Method, [N] 871,4 770,0 679,4 595,7 521,6 454,2 395,9 345,8 303,6 269,7 244,1
Force Difference (TorqueMeter - Track c/d) [N] -9,0 -5,9 -4,6 -2,8 -2,2 -0,8 0,0 0,2 0,6 0,6 0,5
rel. Difference [%] -1,0 -0,8 -0,7 -0,5 -0,4 -0,2 0,0 0,1 0,2 0,2 0,2
time Difference (TorqueMeter - Track c/d) [sec] 0,060 0,050 0,050 0,040 0,040 0,020 0,000 -0,010 -0,030 -0,040 -0,040 0,140
rel. Difference [%] 1,0 0,8 0,7 0,5 0,4 0,2 0,0 -0,1 -0,2 -0,2 -0,2 0,1
1. Torquemeter method as described above was applied for creation of Dyno Settings
2. Dyno Settings were used for coastdown on the dyno („Coast Down Data derived from Dyno Settings“)
3. Coastdown Method was applied on the track for reference (“Track Coast Down Data“)
4. Comparison of Total Resistance („calc. Force“) and coastdown times (“time“)
���� No significant difference found between the two methods!
To
tal R
esis
tan
ce
[N
]ROAD LOAD COMPARISON C/D MATCH VS. TORQUEMETER METHOD (2)
12 11/12/2012 Torquemeter-Coastdown_Comparison of Methods
���� No significant difference found between the two methods!
200
300
400
500
600
700
800
900
20 30 40 50 60 70 80 90 100 110 120
Datenreihen1
Datenreihen2
Torquemeter
CoastDown
Speed [km/h]